
ETRM software spending rises with trade counts, not prices
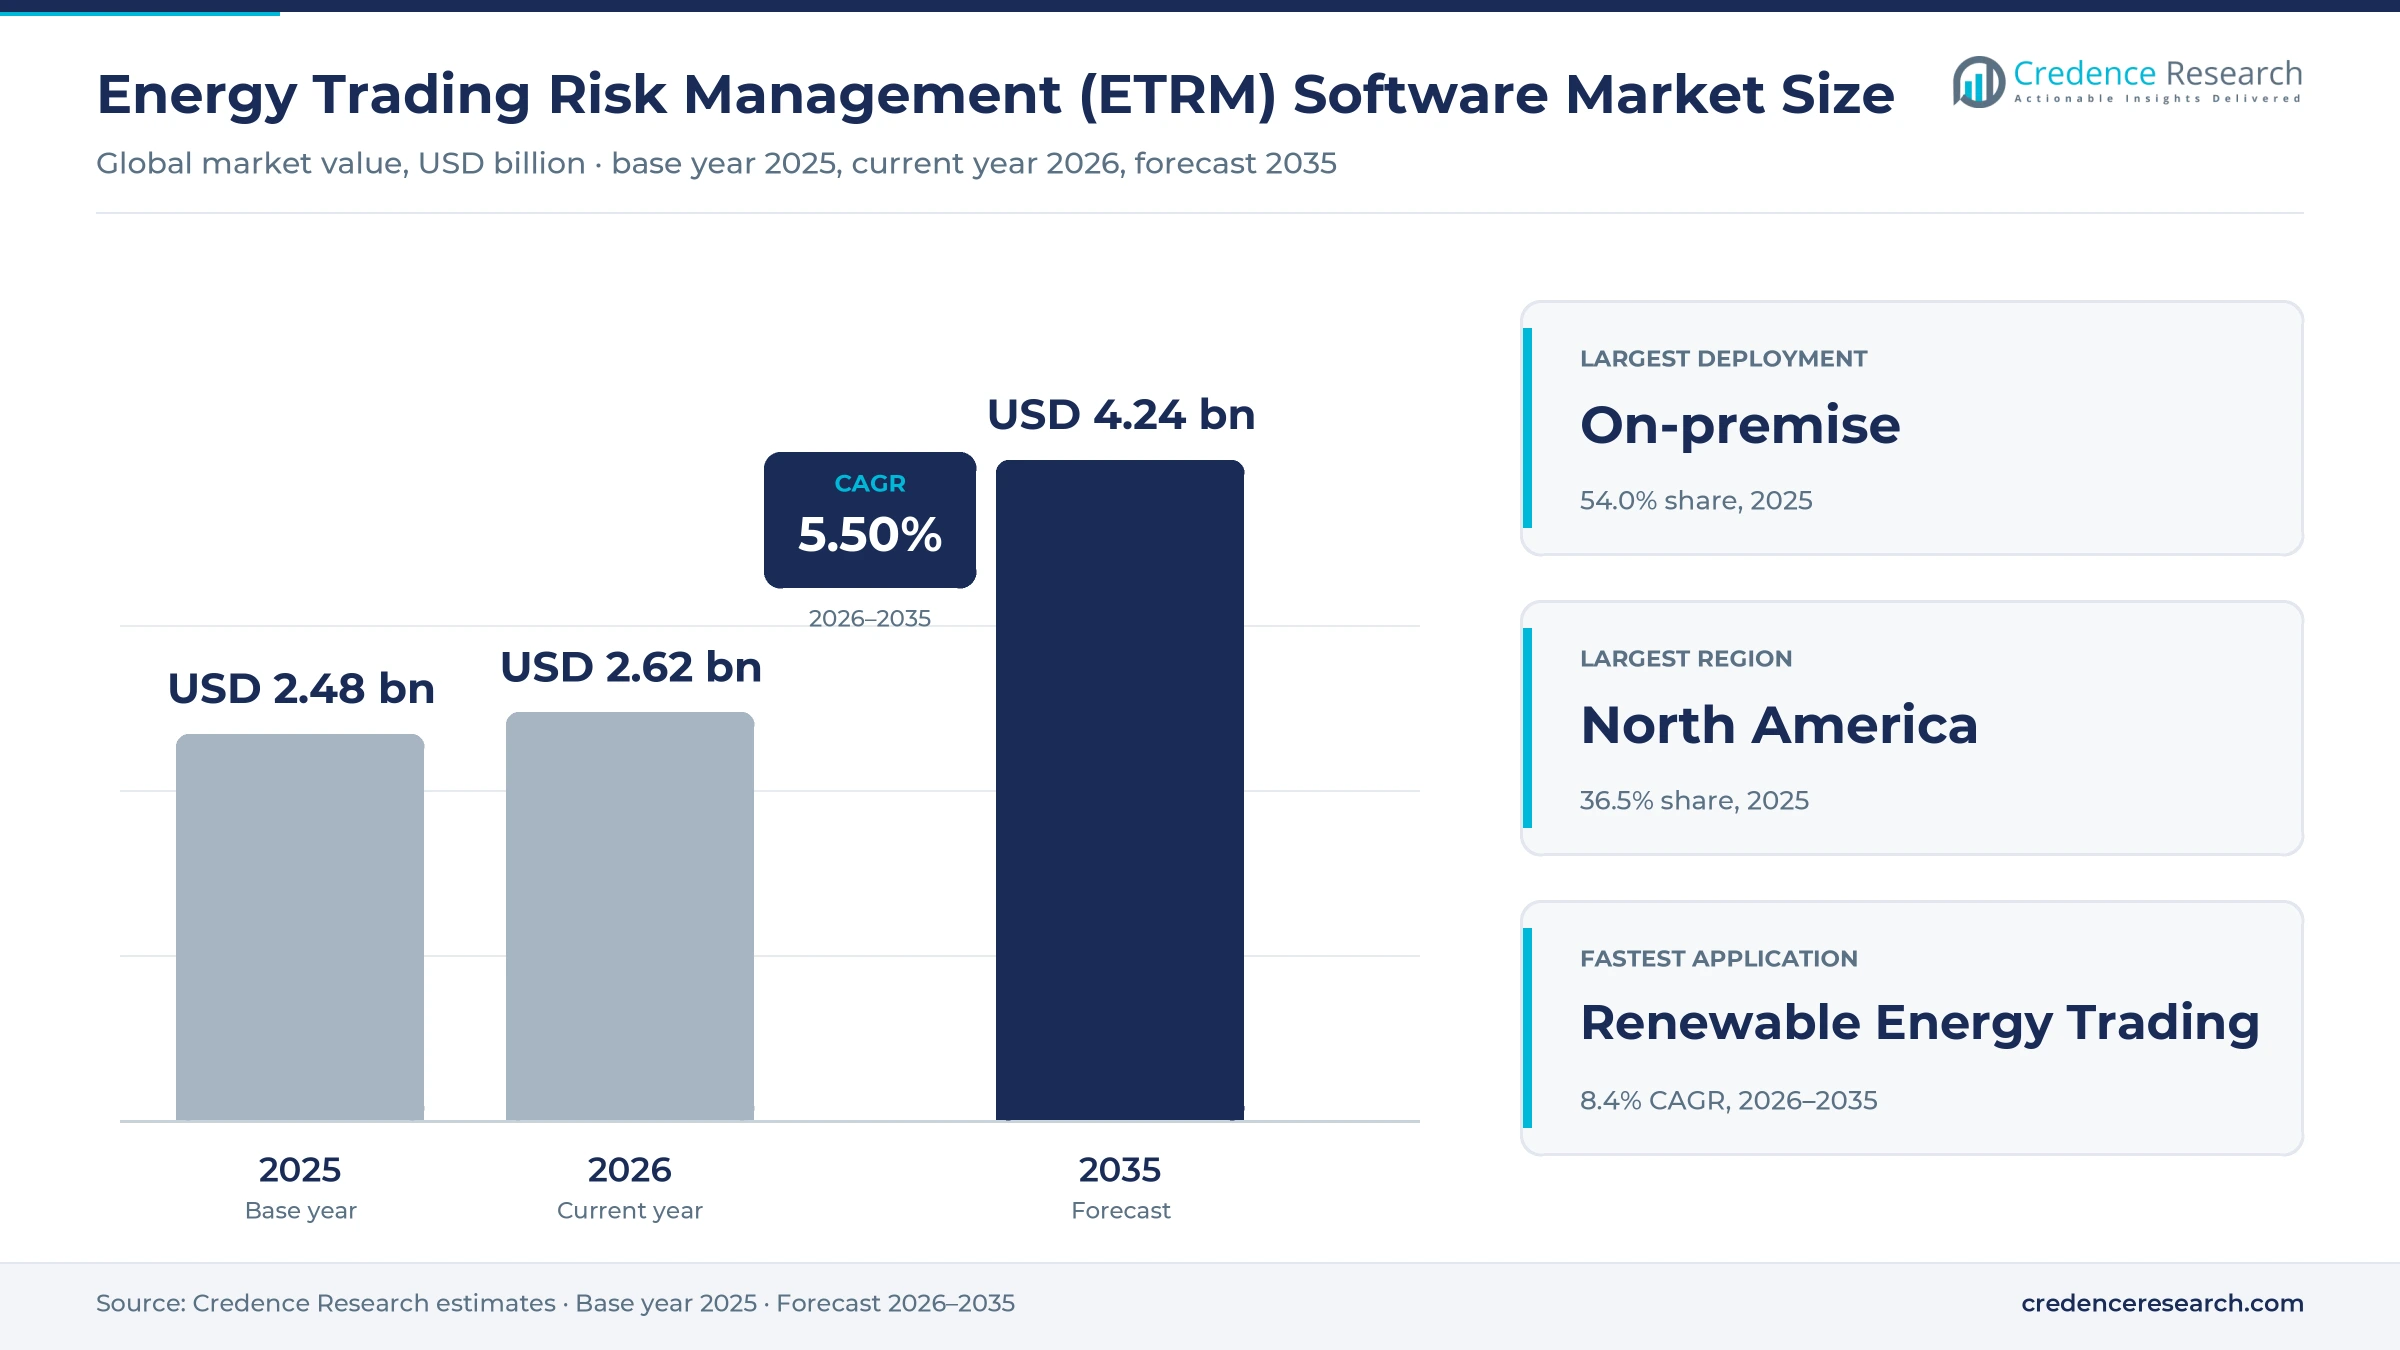
The global energy trading risk management (ETRM) software market was valued at USD 2.48 billion in 2025 and is projected to increase from USD 2.62 billion in 2026 to USD 4.24 billion by 2035, registering a CAGR of 5.50% during 2026–2035. Demand comes from utilities, merchant traders, producers and large consumers that must capture trades, value positions and report them to regulators across power, gas, oil, coal and certificate markets. North America held the largest regional share, 36.5% in 2025, because its nodal power markets and gas hubs create dense, fast-changing positions. Asia Pacific is the fastest-growing region at 6.7% a year as exchanges in India and Japan add volume and new participants. The most important commercial change is the move from heavily customized on-premise suites to subscription platforms, because shorter contracts let buyers switch vendors at renewal. Europe's switch to 15-minute day-ahead trading has also multiplied the intervals that every system must handle.
What separates ETRM platforms from general energy risk management software?
The market counts software licenses, subscriptions and vendor or partner services for systems that capture energy trades, track positions, value portfolios, measure market and credit risk, schedule physical deliveries and settle invoices. Buyers usually purchase a core trade capture and risk module first, then add scheduling, credit, settlement and regulatory reporting modules as their books grow. Contracts run from one-year subscriptions to multi-year enterprise licenses with separate implementation projects.
General enterprise risk tools, stand-alone price data feeds, exchange trading screens sold without position keeping and pure grid control systems sit outside the estimate. Commodity suites built mainly for metals or agriculture are counted only for the energy share of their use. Value is measured at the vendor level, so it includes software fees, hosting and the services needed to make the system run.
Energy Trading Risk Management (ETRM) Software Market Insights
- The market is valued at USD 2.48 billion in 2025 and is projected to reach USD 4.24 billion by 2035, growing at a 5.50% CAGR as trade counts and reporting duties expand.
- North America led with 36.5% of 2025 value, while Asia Pacific grows fastest at 6.7% a year on new exchange volume.
- On-premise systems held 54.0% of 2025 value, while Cloud-based platforms grow fastest at 7.2% a year to 2035.
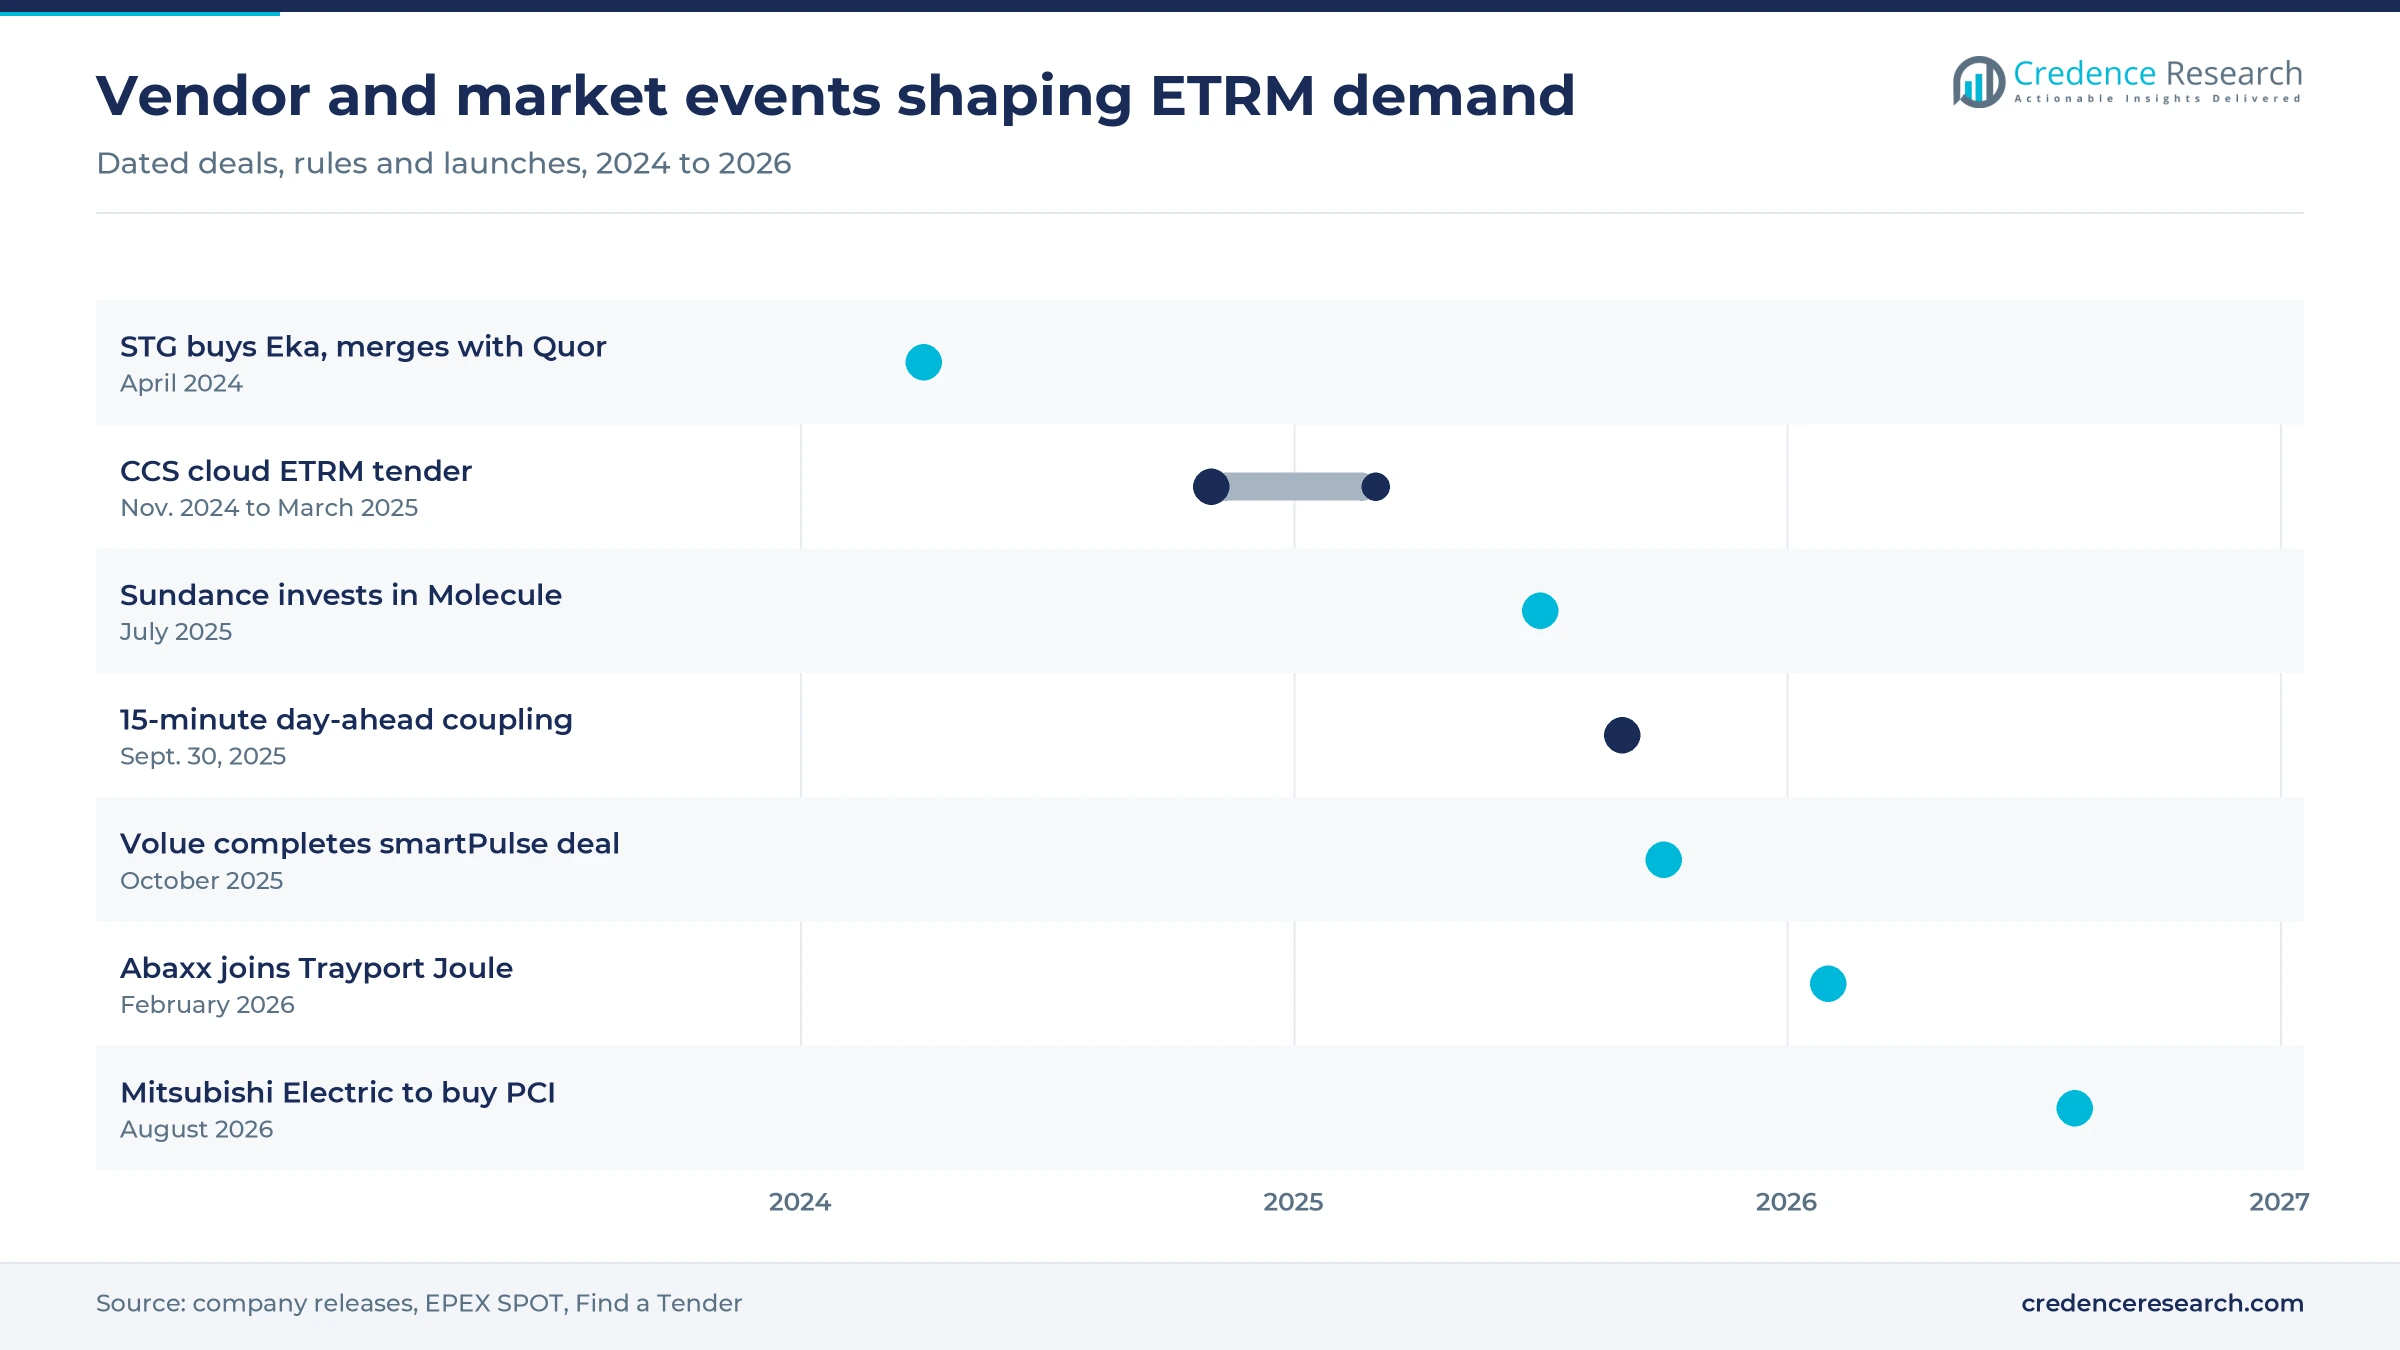
- Europe moved its day-ahead power auction to 15-minute intervals for delivery on Oct. 1, 2025, multiplying the positions each system must value.
- Mitsubishi Electric agreed on Aug. 20, 2026, to buy PCI Energy Solutions for USD 1.4 billion, a sign that grid and trading software is consolidating.
Licensed suites lead while cloud and renewables gain
Why does software hold most of the spending?
Based on type, the market is categorized into software and services. Software led with 63.0% of 2025 value because every desk pays recurring license or subscription fees per user and per module, while services spending peaks around a project. TMX Trayport alone counted more than 10,400 licensees and 29,400 connections at Dec. 31, 2025, which shows how seat-based pricing scales with trading headcount. Services grow fastest at 5.8% a year as buyers hand system operations to vendors. Lisbon-based utility EDP, for example, chose ION's Openlink with Center of Excellence managed services to run daily operations.
Why do on-premise systems still lead while cloud platforms gain?
Based on deployment, the market is categorized into on-premise and cloud-based systems. On-premise systems led with 54.0% of 2025 value because large utilities and oil majors still run customized suites that were installed over many years and are expensive to move. Cloud-based platforms grow fastest at 7.2% a year as public and private buyers replace that estate at renewal. Crown Commercial Service, which buys power and gas for U.K. public bodies, awarded a contract in March 2025 to replace its ETRM with an off-the-shelf cloud-based system rather than custom code.
Why does power trading lead and renewables grow fastest?
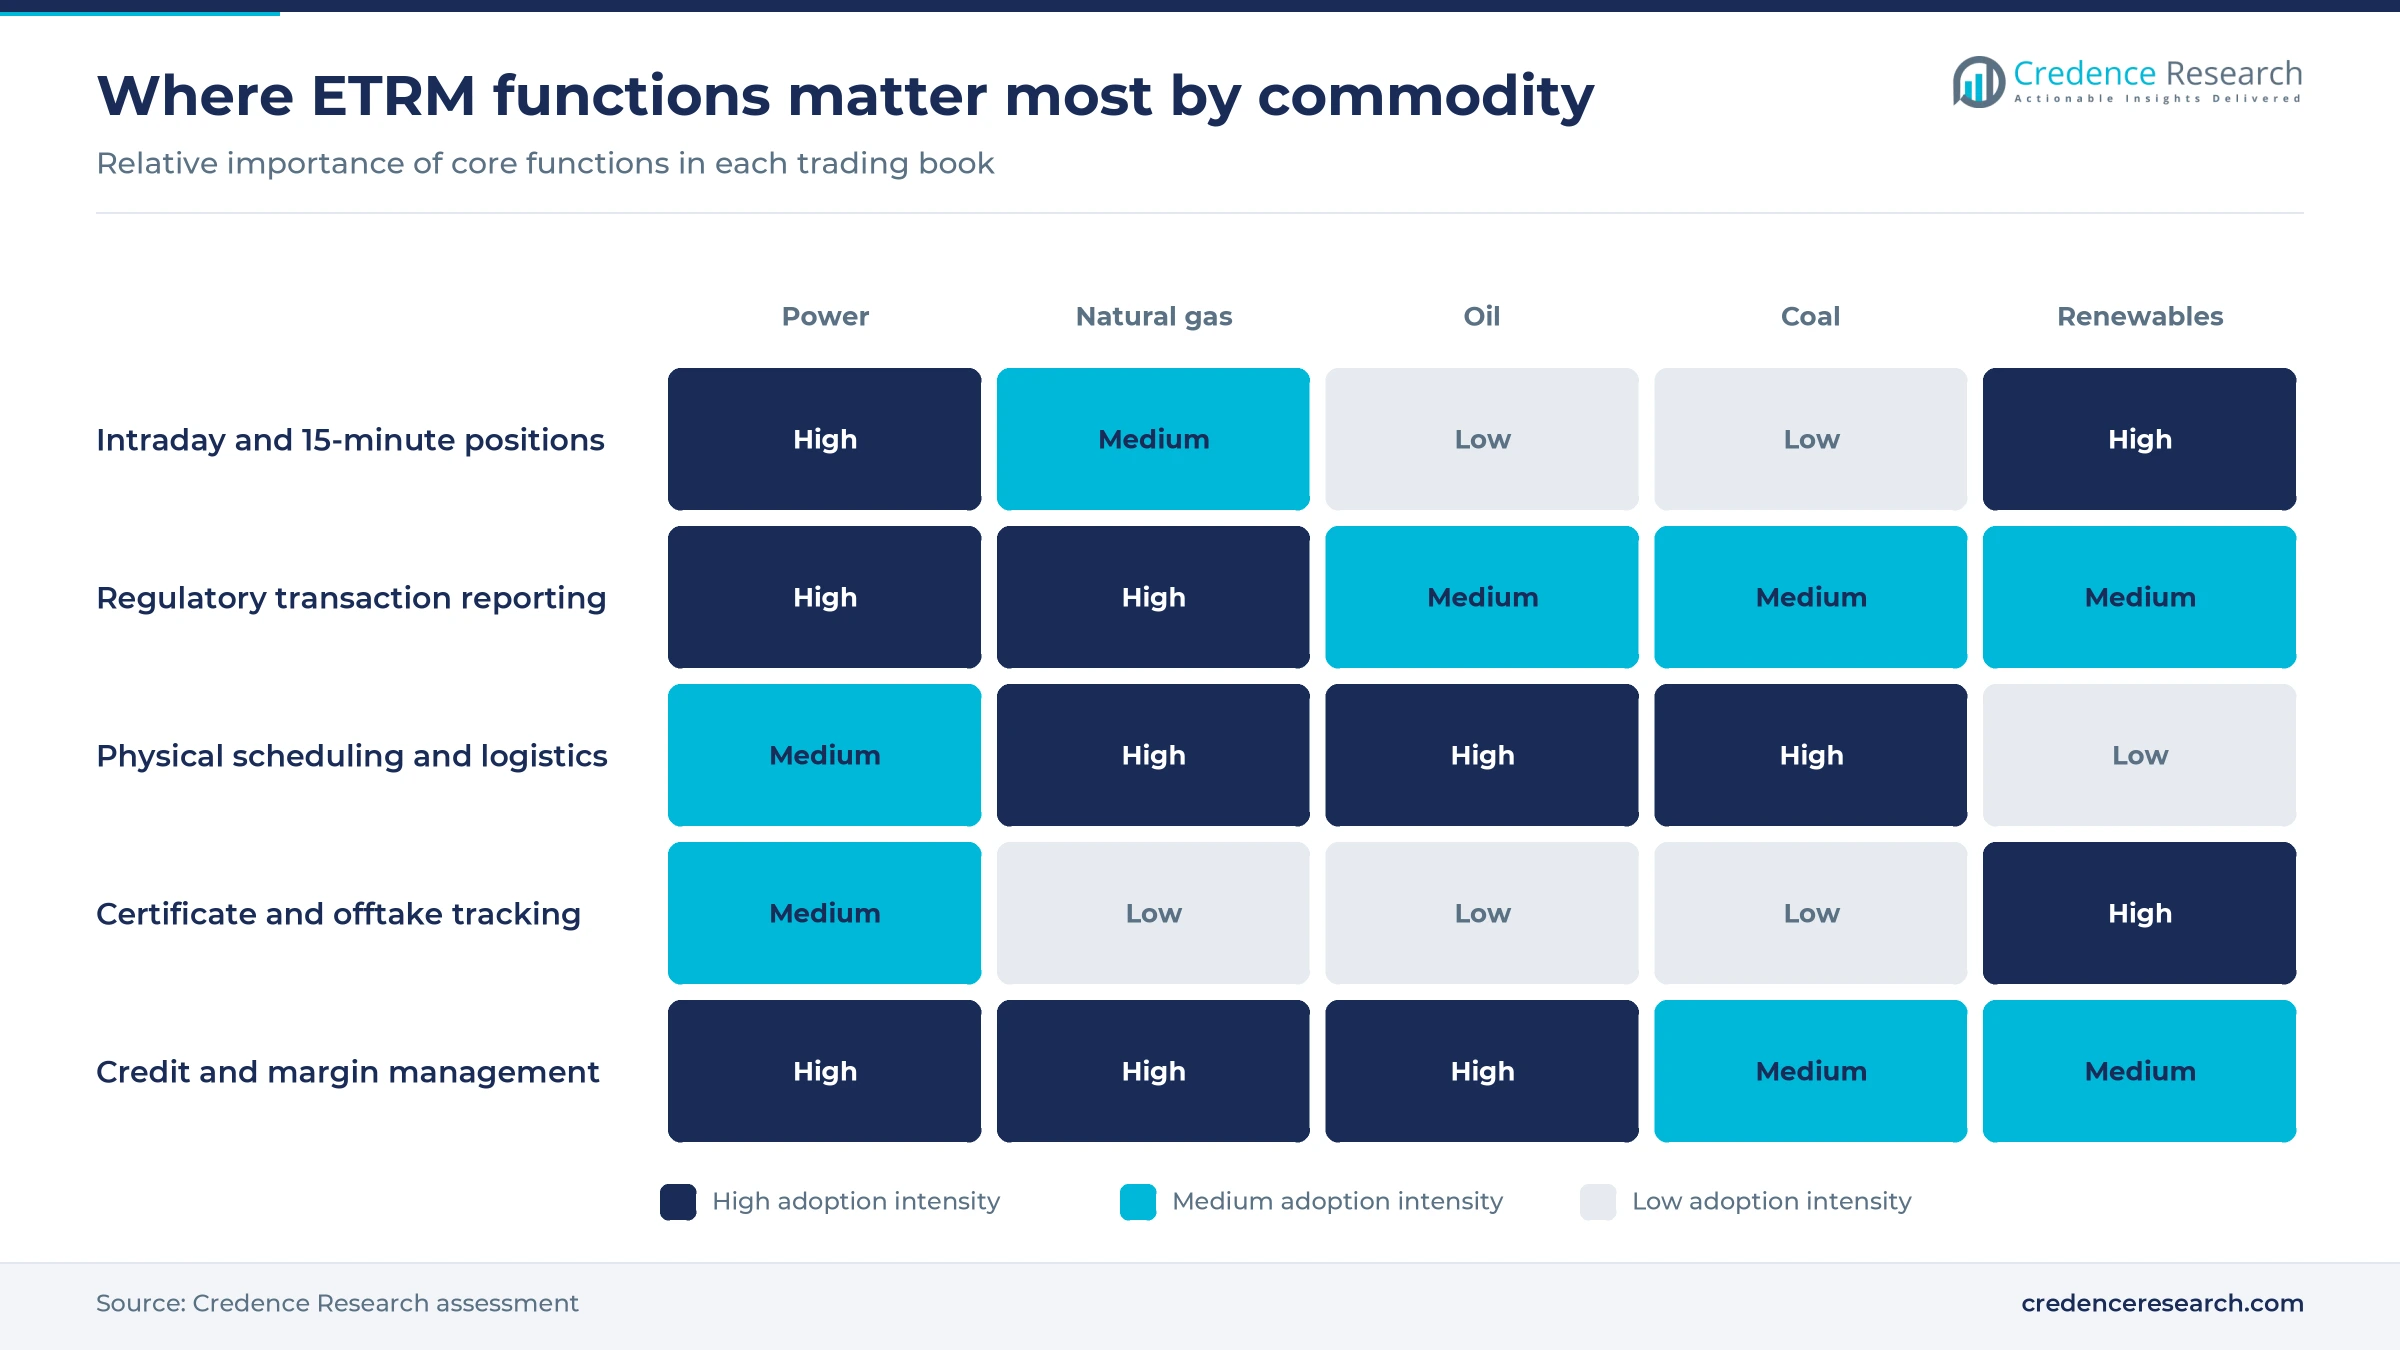
Based on application, the market is categorized into power, natural gas, oil, coal and renewable energy trading. Power Trading led with 36.0% of 2025 value because power books carry the most delivery intervals, locations and counterparties. EEX Group cleared 9,330.3 TWh of European power derivatives in 2025, up 11%, and each contract feeds position and margin calculations. Renewable Energy Trading grows fastest at 8.4% a year as certificate and offtake contracts multiply. IRENA reported that renewables made up 85.6% of all power capacity added worldwide in 2025, so more output is sold under contracts that ETRM platforms must track.
Why do utilities lead while industrial consumers grow fastest?
Based on end user, the market is categorized into utilities, traders and marketers, energy producers and industrial consumers. Utilities led with 34.0% of 2025 value because they hedge generation, retail load and fuel in one book. PCI Energy Solutions says its platform supports about 60% of U.S. power generation, which shows how deeply scheduling and settlement software sits in utility operations. Industrial Consumers grow fastest at 6.5% a year as more large buyers trade directly. Brazil's market operator CCEE recorded 21,707 consumer units moving to the free power market in 2025, each needing contract and exposure tracking.
| Segment Group | Leading Sub-segment | Share, 2025 | Fastest-growing Sub-segment | CAGR, 2026–2035 |
|---|---|---|---|---|
| By Type | Software | 63.0% | Services | 5.8% |
| By Deployment | On-premise | 54.0% | Cloud-based | 7.2% |
| By Application | Power Trading | 36.0% | Renewable Energy Trading | 8.4% |
| By End User | Utilities | 34.0% | Industrial Consumers | 6.5% |
Subscription bands and reporting fees set what buyers pay
Pricing in this market combines an annual software fee, an implementation project and compliance costs that rise with trade volume. Cloud vendors quote annual subscriptions tied to commodities, users and modules, while legacy suites pair license fees with yearly maintenance and long integration work. Implementation is quoted separately, as the challenges section explains, so buyers compare total cost over the contract term rather than the annual fee alone. In Europe, the fees ACER charges reporting channels pass through to traders, so firms with high trade counts favor platforms with built-in reporting. Vendors that publish clear bands win smaller buyers, while large estates remain priced case by case.
| Offer or cost item | Typical price or fee | Basis |
|---|---|---|
| Cloud ETRM, smaller exchange-only trading firm | USD 100,000 or more per year | Molecule, January 2026 |
| Cloud ETRM, typical trading company | USD 150,000 to USD 250,000 per year | Molecule, January 2026 |
| Cloud ETRM, large firm with physical logistics | USD 500,000 or more per year | Molecule, January 2026 |
| REMIT exposure report, once exposure reporting starts | EUR 500 per exposure report per market participant, charged to the reporting mechanism | ACER REMIT fees decision background note, 2026 |
| Transaction-record fee basis for a newly registered reporting mechanism | EUR 100 per day, up from EUR 65 | ACER REMIT fees decision background note, 2026 |
| Large enterprise suite with integration | USD 1 million or more per year | Credence Research estimate from vendor ranges and project scope |
Request a Free Sample
Fill in your details and we'll send you a free sample report.
- Sample data tables & charts
- Research methodology
Volumes, reporting rules and volatile prices lift demand
Exchange volumes keep climbing across power and gas
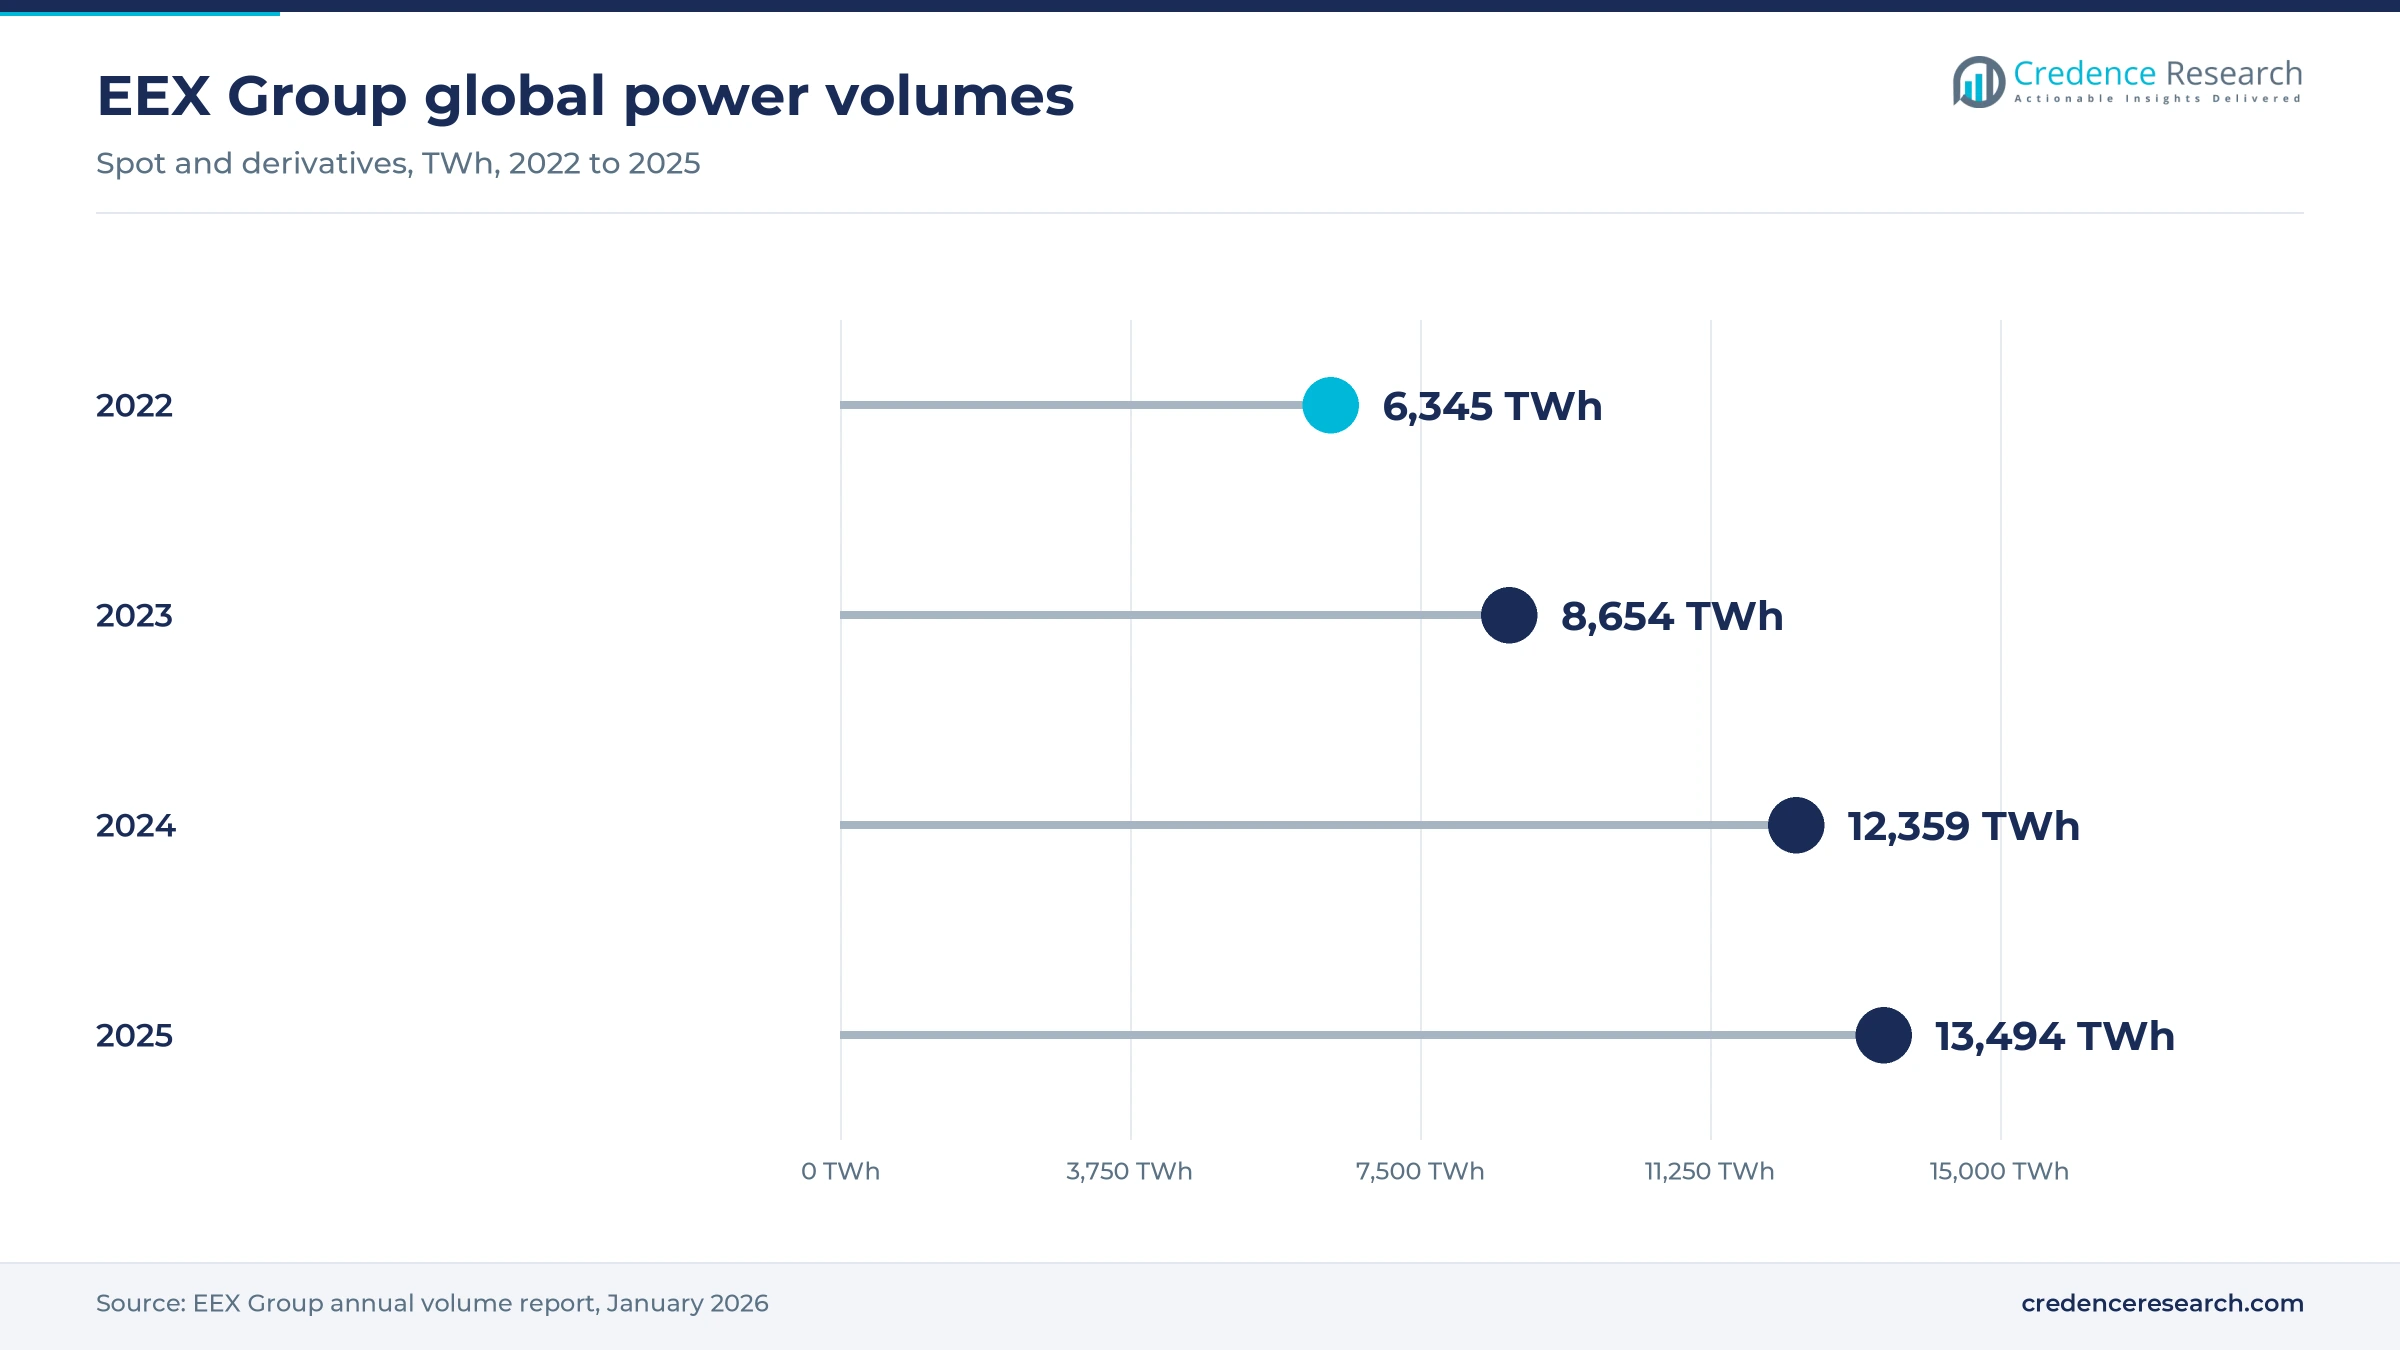
Rising exchange volumes are the most direct source of demand, because each trade must be captured, valued and settled. EEX Group reported that its global power volumes reached 13,493.7 TWh in 2025, up 9% on 2024, according to its annual volume report. European gas derivatives grew even faster, rising 30% to 5,113.9 TWh, which adds collateral and margin work for gas desks. Japanese power derivatives on the same exchange more than doubled to 149.2 TWh, which brings a new group of Asian utilities into cleared trading. Higher volumes raise user counts, margin calls and settlement runs at the same time, so trading firms tend to upgrade capacity before they add new desks.
Wider reporting rules turn compliance into a system requirement
Regulatory reporting has moved from a back-office task to a core system function in Europe. REMIT, the EU rulebook for wholesale energy trading, was revised in May 2024, and ACER updated its reporting manual in December 2024 to match. ACER counted nearly 19,000 registered market participants in December 2024, and the number of records reported to it has grown about 47% a year since 2021, according to its 2026 fees note, while registered reporting channels numbered between 104 and 107 over 2021 to 2024. Each of those firms needs clean trade data and audit trails that spreadsheets cannot provide. Vendors that build reporting into the trade capture flow cut rework for these firms and turn compliance from a cost center into a reason to upgrade.
Renewables and batteries multiply small, fast positions
The build-out of wind, solar and storage creates many more small positions that need forecasting, scheduling and valuation. IRENA reported that the world added a record 692 GW of renewable capacity in 2025, lifting the total to 5,149 GW. In the United States, the Energy Information Administration counted 10.4 GW of new battery storage in 2024 and operators planned another 19.6 GW for 2025. Batteries trade several times a day across energy and ancillary markets, so their owners need intraday position views rather than monthly books. This pushes asset owners that once relied on grid-scale batteries as passive assets toward full trading systems.
Volatile prices make daily risk measurement unavoidable
Sharp price swings raise the cost of not knowing exposure in real time. The Henry Hub spot price averaged USD 3.52 per MMBtu in 2025, 56% above 2024, and touched a daily high of USD 9.86, according to the Energy Information Administration. Regional spikes were larger, with Algonquin Citygate averaging USD 16.37 in January. Europe saw the opposite extreme, as Germany recorded 570 hours of negative power prices in 2025, according to the Czech energy data portal oEnergetice. Both conditions punish firms that value positions once a day, so risk officers are asking for intraday mark-to-market, credit limits and scenario tools that only modern ETRM platforms supply.
Quarter-hour markets and cloud replacements reshape buying
Shift to quarter-hour and algorithmic intraday trading
Europe's move to finer time steps is reshaping what trade capture must handle. The single day-ahead coupling switched to 15-minute market time units on Sept. 30, 2025, for delivery on Oct. 1, 2025, according to EPEX SPOT, which quadruples the intervals in each daily auction. TMX Trayport said in February 2026 that it facilitated more than 620 million trades in Europe in 2025, nearly 20 every second. Volue added this capability by acquiring smartPulse, a certified independent software vendor on EPEX SPOT and Nord Pool. The result is rising demand for algorithmic energy trading software tied directly to ETRM positions, since manual desks cannot price four times as many slots.
Rise of cloud subscriptions as legacy suites reach renewal
Buyers are replacing heavily customized suites with subscription platforms, and investors are funding that shift. Sundance Growth made a growth investment in cloud-native vendor Molecule in July 2025 to speed its go-to-market work. Crown Commercial Service, whose energy customers spend more than GBP 1.5 billion a year, chose an off-the-shelf cloud system in March 2025. Molecule says its contracts typically run 12 to 24 months, while industry terms run up to 60 months, so switching costs stay low. Shorter terms shift bargaining power to buyers and push older vendors to offer hosted versions of their own suites.
Distributed energy aggregation opens a U.S. wholesale opening
FERC Order 2222, which lets aggregations of distributed resources sell into wholesale markets, gives vendors a new class of buyers. Every FERC-regulated grid operator has filed compliance plans, with variations between them, and FERC has accepted June 1, 2029, as MISO's start date, according to a July 2025 Pacific Northwest National Laboratory review. Aggregators will need bidding, settlement and portfolio risk tools sized for thousands of small devices. Mitsubishi Electric's agreement to buy PCI Energy Solutions for USD 1.4 billion shows how highly grid-side trading software is now valued. Vendors that serve virtual power plants at low cost per asset are best placed.
Certificate and green power trading creates an emerging product line
Certificate trading is becoming large enough to need its own position and inventory tools. The Indian Energy Exchange traded 8,746 million units on its green market in fiscal 2025, up 170%, and cleared 17.8 million renewable energy certificates, up 136%. EEX Group's guarantee of origin futures traded 36.2 TWh in their first full year in 2025. These instruments sit alongside power contracts in the same books, so traders want one system that values both. Vendors that add registry links and inventory tracking for renewable certificates can sell into utility desks that already hold their core ETRM licenses.
Long projects, fees and vendor consolidation slow buyers
Long implementations keep total cost high
Implementation cost remains the main reason that buyers delay replacing old systems. Molecule's January 2026 cost guide notes that implementation is the largest cost item in an ETRM purchase and can triple in price over the life of a system, as customization and data migration grow. Utilities with decades of trade history face the steepest bills. Mid-size firms often postpone upgrades for that reason, leaving them on unsupported versions. Vendors that offer fixed-scope rollouts and standard data loaders reduce this barrier and shorten the sales cycle.
Rising reporting fees squeeze smaller participants
Compliance costs are climbing for firms that trade in Europe. ACER raised the flat enrolment fee for reporting channels from EUR 9,000 to EUR 15,000 and projects an annual funding shortfall of EUR 9 million to EUR 11 million from 2026, which points to further fee increases. Reporting channels pass those costs to traders, and small participants feel them most. Some exit trading or outsource the work, which removes potential ETRM buyers. Vendors can respond by bundling reporting into subscriptions at predictable prices.
Vendor consolidation narrows choice for large buyers
Ownership of the largest suites has concentrated, which limits negotiating power for big utilities. ION completed its purchase of Openlink in March 2018 and announced the acquisition of Allegro in April 2019, adding both to a commodities unit that already included Triple Point. Buyers of enterprise suites therefore face fewer independent bidders at renewal. Price increases and slower roadmaps are the usual risks of such concentration. Large buyers mitigate them with multi-vendor architectures and clear exit clauses in their contracts.
Shrinking coal and oil books cap some modules
Parts of the installed base face a long-term decline in traded volume. The International Energy Agency expects global coal demand, which hit a record 8.85 billion tons in 2025, to fall about 3% by 2030 as renewables and LNG displace it. Coal ETRM systems and freight modules will see fewer new licenses as a result. Oil books are likely to face similar pressure later in the decade. Vendors with heavy coal or oil exposure must shift development toward power and certificates to keep revenue stable.
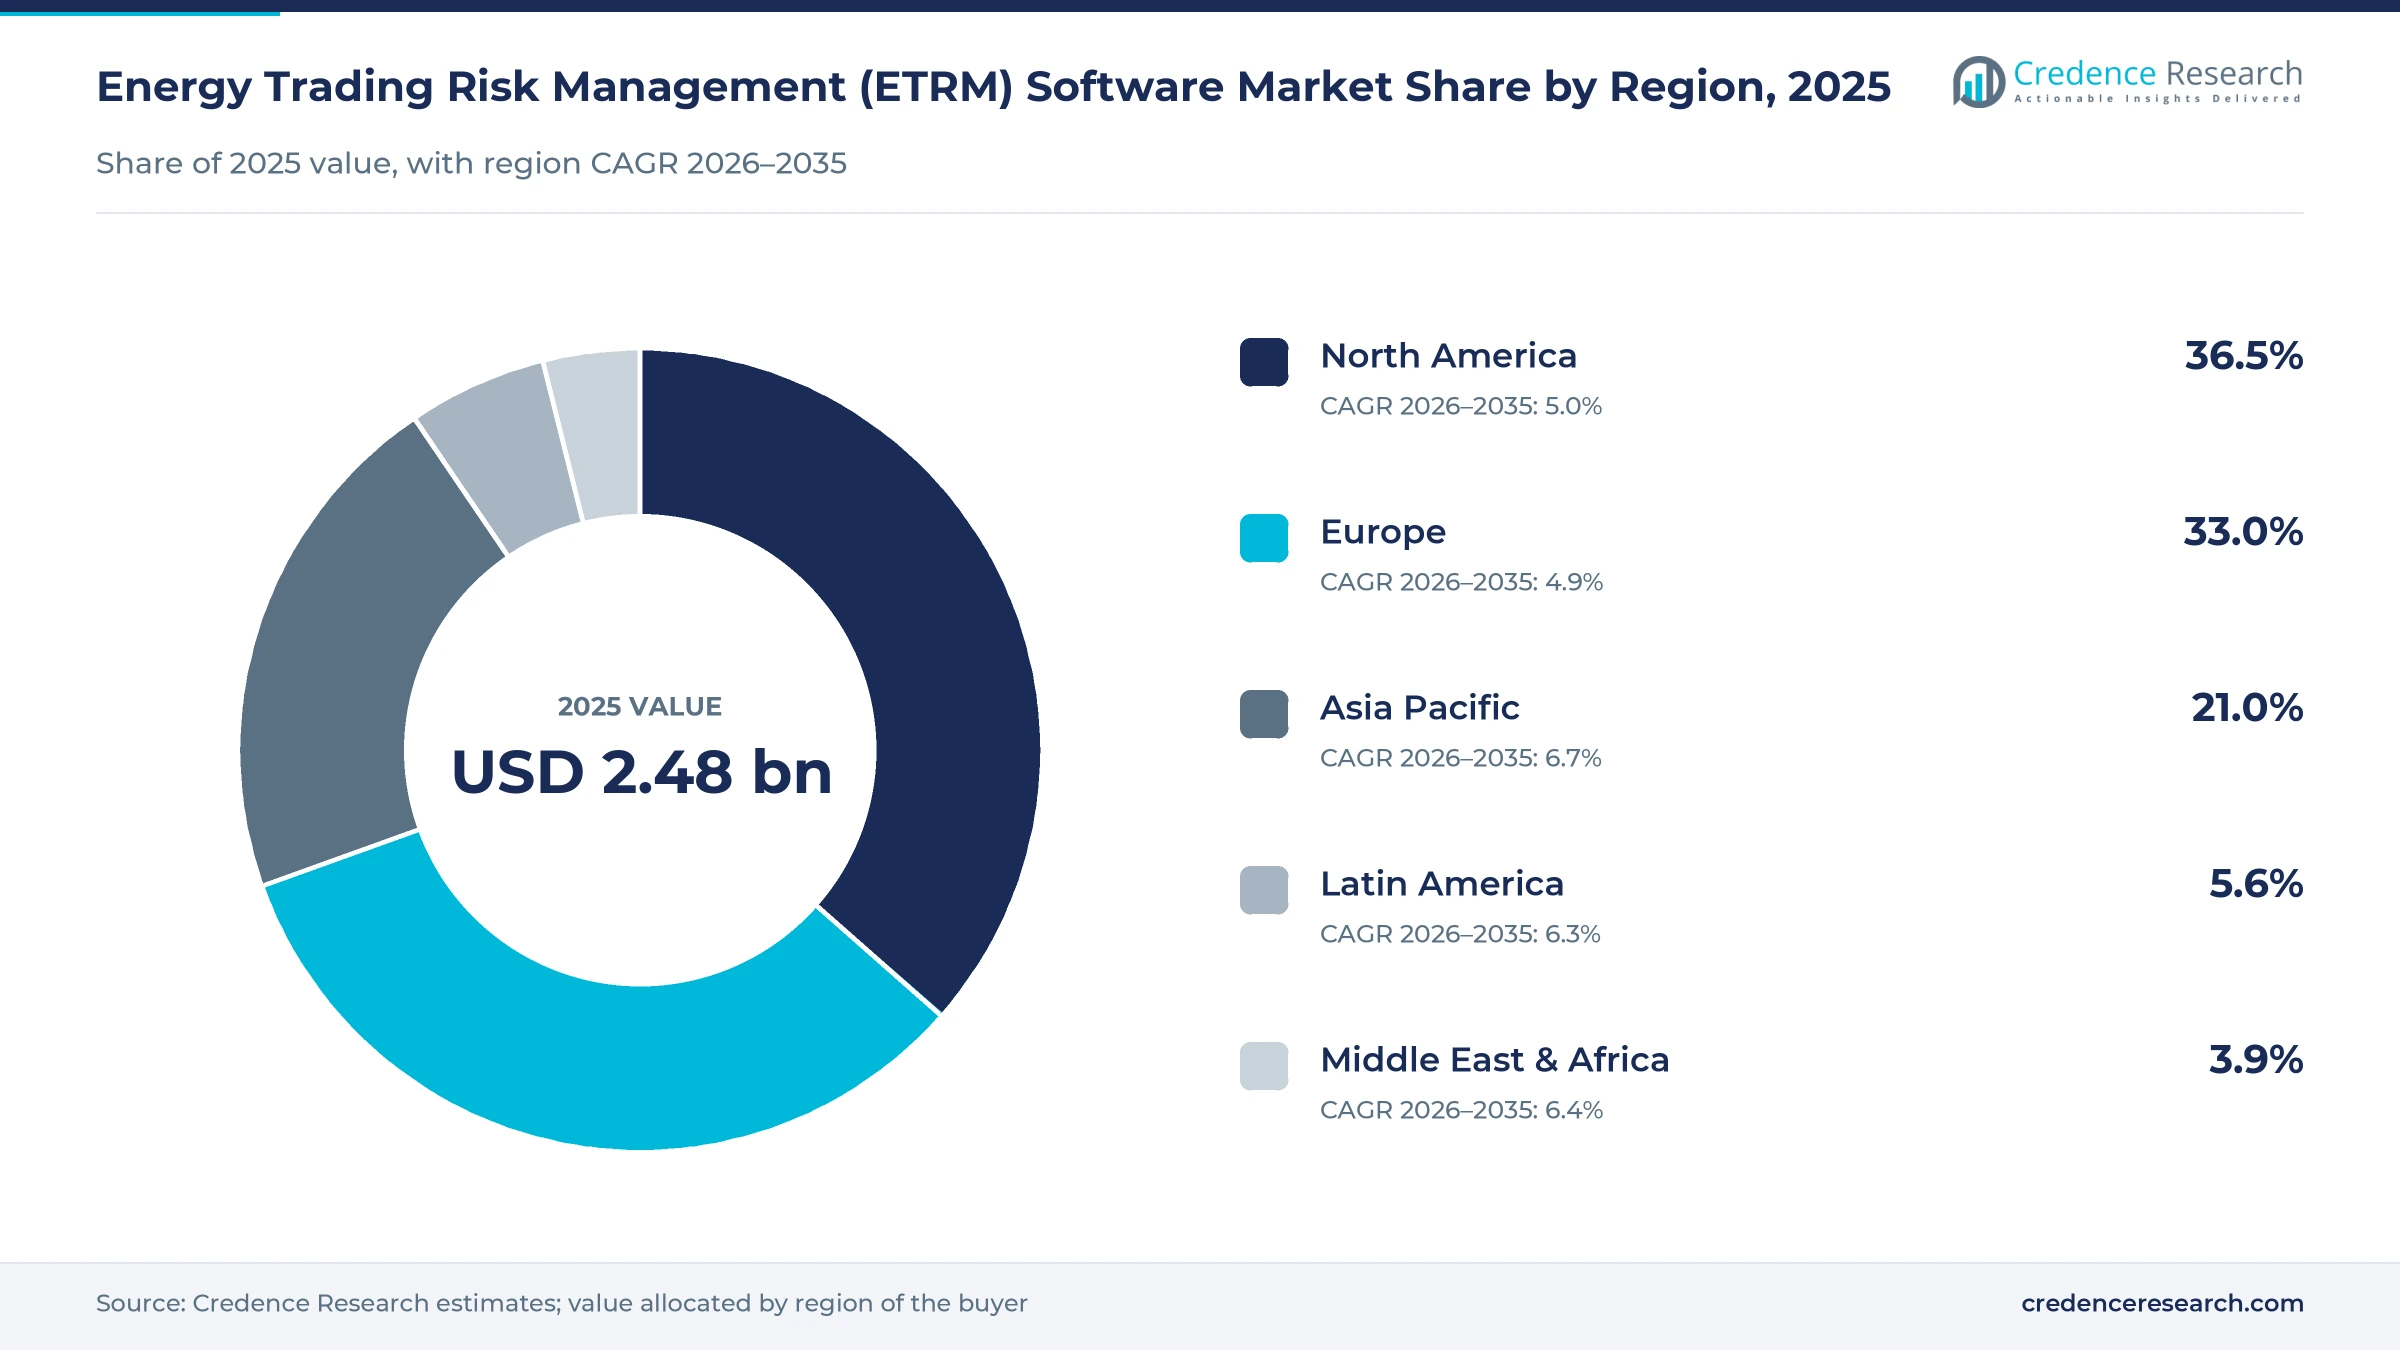
North America leads while Asia Pacific grows fastest
| Region | Value, 2025 (USD billion) | Share, 2025 | CAGR, 2026–2035 |
|---|---|---|---|
| North America | 0.91 | 36.5% | 5.0% |
| Europe | 0.82 | 33.0% | 4.9% |
| Asia Pacific | 0.52 | 21.0% | 6.7% |
| Latin America | 0.14 | 5.6% | 6.3% |
| Middle East & Africa | 0.10 | 3.9% | 6.4% |
North America leads on nodal power and gas hub complexity
North America held 36.5% of 2025 value and grows at 5.0% a year. Demand rests on nodal power markets, active gas hubs and many utilities that hedge both fuel and load. EEX Group's U.S. nodal power derivatives reached 3,096.7 TWh in 2025, up 4%, which shows how much cleared power risk sits in the region. Cloud vendors based in Houston compete directly with enterprise suites for marketers and producers. Steady growth reflects a mature base where spending comes mostly from replacement and new grid-side buyers.
Europe depends on dense, cross-border trading networks
Europe held 33.0% of 2025 value and grows at 4.9% a year. The continent has the densest cross-border trading network, built around the TMX Trayport licensee base noted in the segment section. European power spot volumes on EEX Group venues rose 6% to 917.5 TWh in 2025. The reporting duties and quarter-hour auctions described above add load to every system in use. Growth is held back mainly by the high installed base, since most large traders already own an ETRM and buy upgrades rather than first systems.
Asia Pacific grows fastest as exchanges add participants
Asia Pacific held 21.0% of 2025 value and grows fastest at 6.7% a year. Asia added 513.3 GW of renewable capacity in 2025, 74.2% of the world total, according to IRENA, which multiplies variable output that must be scheduled and sold. The Indian Energy Exchange traded a record 121 billion units in fiscal 2025, up 19%. In Japan, Hitachi Energy has offered its TRMTracker platform to local market participants since December 2021 and works with consulting partner Skipping Stone on deployments. Many buyers in the region are buying their first full ETRM system, which supports above-average growth.
Latin America grows as Brazil opens its free power market
Latin America held 5.6% of 2025 value and grows at 6.3% a year. Brazil is the main source of new demand, as retail traders build products for smaller buyers entering the free market. Services firms made up 6,648 and commercial businesses 4,098 of the consumer units that migrated in 2025, according to CCEE data reported by Cenario Energia. PCI Energy Solutions has also expanded into Mexico and Peru. Retail traders serving these buyers need contract, billing and exposure tools, which favors low-cost cloud platforms over enterprise suites.
Middle East & Africa builds trading hubs from a small base
Middle East & Africa held 3.9% of 2025 value and grows at 6.4% a year. The UAE clarified the tax treatment of qualifying commodity trading through Ministerial Decisions No. 229 and 230 of 2025, a move ADNOC welcomed as support for energy trading hubs. Renewable capacity in the Middle East grew 28.9% in 2025, and Africa added 11.3 GW, according to IRENA. National oil company trading arms remain the main buyers in the region. New power market reforms will add utility buyers more slowly, so the regional share stays small through 2035.
Buyouts and venue links shaped vendor moves in 2024 to 2026
| Development | Status and market relevance |
|---|---|
| In April 2024, STG acquired Eka Software Solutions and merged it with Quor Group, its metals-focused CTRM portfolio company. | Completed; creates a combined cloud CTRM and ETRM vendor across energy, agriculture and metals |
| In July 2025, Sundance Growth made a growth investment in Houston-based cloud ETRM vendor Molecule. | Completed; funds go-to-market expansion and product development |
| In October 2025, Volue completed its acquisition of smartPulse, a short-term power trading and battery optimization platform. | Completed; adds intraday trading and battery tools for European asset owners |
| In February 2026, Abaxx Exchange agreed to extend trading access through TMX Trayport's Joule platform. | Connectivity planned for the first quarter of 2026; adds LNG, weather and environmental contracts |
| In August 2026, Mitsubishi Electric agreed to acquire PCI Energy Solutions for USD 1.4 billion. | Signed; closing expected by the end of 2026 subject to regulatory approval |
Interval data, APIs and reporting links redefine platforms
- Interval-level position engines store and value positions in 15-minute or shorter blocks, so a single power book can hold millions of rows that older daily systems cannot process.
- API-first architectures let trading desks connect price feeds, algorithms and exchange gateways directly, which Molecule and other cloud vendors use to shorten integration work.
- Built-in regulatory reporting sends trade and order records straight to reporting channels, which lowers rework as REMIT and similar rules widen.
- Forecasting and analytics modules combine weather, load and price data to project output and exposure for renewable and battery portfolios before the trading window closes.
Need a Custom Version of This Report?
Tailor the scope, geography, or segments to your exact requirements.
- Custom geography or segment scope
- Direct access to our analyst team
One large owner faces cloud natives and grid specialists
Competition turns on three capabilities that buyers test in every selection. The first is breadth across commodities, since utilities want power, gas, certificates and sometimes coal in one book, and enterprise suites still lead on that breadth. The second is speed and cost of rollout, where cloud-native vendors win mid-size traders with fixed-scope projects and one- or two-year terms. The third is grid and market connectivity, which favors vendors with scheduling links to grid operators and exchanges. Price matters most for smaller firms, while large buyers weigh valuation accuracy and audit history. Consolidation has reduced the number of independent enterprise bidders, and buyers now often pair one core platform with specialist tools for intraday trading or reporting. Commodity trading and risk management, or CTRM suites, built for metals and agriculture, compete in the same accounts when a group trades several commodity classes.
How concentrated is the supply side?
The supply side of energy trading risk management software splits into three groups with different strengths. One owner, ION, holds several of the largest enterprise suites, including Openlink, Allegro, Triple Point and RightAngle, and serves more than 1,200 commodity clients. Cloud-native vendors such as Molecule, Eka and Amphora compete on speed of rollout and shorter contracts. Grid-side specialists such as Hitachi Energy, PCI Energy Solutions and Volue win utilities through scheduling and settlement depth. Barriers to entry are high at the top, because large buyers demand proven valuation models and many integrations. Margins sit mainly in recurring licenses and managed services rather than one-off projects.
Companies profiled and their roles in this market
| Company | Type | Role in the market |
|---|---|---|
| ION Group | Enterprise suite owner | Openlink, Allegro, Triple Point and RightAngle trading and risk platforms |
| Hitachi Energy | Grid and trading software | TRMTracker ETRM, offered to Japanese market participants since 2021 |
| FIS | Financial technology provider | Energy Trading, Risk and Logistics Platform, formerly Aligne, for power, gas, coal and LNG |
| SAP | Enterprise software | Commodity management modules within its ERP suite |
| Eka Software Solutions | Cloud CTRM vendor | Software-as-a-service platform, now merged with Quor Group under STG |
| Molecule | Cloud-native ETRM vendor | API-first trade capture, risk and settlement for power, gas and renewables |
| Amphora | CTRM vendor | Symphony CTRM platform for physical commodity trading |
| TMX Trayport | Trading network | Joule trading platform linking traders, brokers and exchanges |
| PCI Energy Solutions | Grid-side software | Forecasting, scheduling, trading and settlement software for power providers |
| Volue | Energy software | Power trading and battery optimization, including smartPulse |
| Energy One | ETRM vendor | Trading, settlement and risk software for Australian and European markets |
Replacement cycles, not new users, will drive vendor growth
Credence Research's view is that replacement of aging suites, not a rising number of first-time buyers, will decide which vendors gain share in the energy trading risk management software market to 2035. Most large traders already own a system, but many run versions that cannot handle quarter-hour power, certificate books or new reporting fields. Buyers should test vendors on interval data handling, reporting integration and the cost of exit before signing multi-year terms. Suppliers that offer predictable subscription pricing and short rollouts will win mid-size accounts. Investors should watch renewal rates and migration speed more closely than new logo announcements.
Buyer tiers and published price ranges anchor the base
The report uses 2025 as the base year and 2035 as the forecast horizon, with values in current U.S. dollars. The 2025 value is a Credence Research estimate built from the number of trading firms in each buyer tier and typical annual system spend, cross-checked against published vendor price ranges, regulator counts of market participants and disclosed transaction values in the sector. The earlier estimate on this page, more than ten times larger, was revised down after this check because it did not fit published vendor price ranges or regulator counts of market participants. Regional, segment and scenario splits are Credence Research estimates based on exchange volumes, market structure and deployment patterns. Inputs include regulator and exchange publications, company press releases and vendor pricing pages. No interviews or proprietary surveys were used to build these estimates.
Cloud renewals and power markets carry growth to 2035
Growth in energy trading risk management software to 2035 comes mainly from replacement of on-premise suites with cloud subscriptions and from power markets that keep adding intervals, assets and participants. Power and certificate books will take a larger share of spending, while coal and oil modules grow slowly. Asia Pacific adds the most first-time buyers, and North America and Europe add value through upgrades and new aggregator clients. Consolidation will continue, but cloud vendors keep pricing pressure on the largest suites. On the base case, the market reaches USD 4.24 billion by 2035.
Replacement timing sets the range of outcomes
The range of outcomes depends mostly on how quickly large utilities and traders replace legacy suites and how fast distributed resources reach wholesale markets. A slower replacement cycle, or consolidation that lifts prices without adding users, would hold growth near the downside case. Faster cloud migration in Europe and North America, together with new buyers in India, Japan and Brazil, would lift spending toward the upside case.
| Scenario | CAGR, 2026–2035 | Value, 2035 | What has to hold |
|---|---|---|---|
| Downside | 4.0% | USD 3.73 billion | Legacy suites are extended rather than replaced and aggregator programs start late |
| Base | 5.50% | USD 4.24 billion | Cloud replacements proceed at renewal and Asian exchanges keep adding participants |
| Upside | 6.8% | USD 4.74 billion | Utilities migrate faster and aggregators adopt full trading systems at scale |
Frequently Asked Questions
How big is the energy trading risk management software market?
How much does ETRM software cost?
Is cloud-based ETRM replacing on-premise systems?
Which companies offer leading ETRM software?
Do ETRM systems support coal trading?
Which application leads ETRM spending?
Which region leads the ETRM software market?
How does the 15-minute power market affect ETRM systems?
Table of Content
Chapter 1 Market Segmentation
- 1.1 Segmentation Framework
- 1.1.1 Product and Service Classification
- 1.1.2 Application and End-Use Classification
- 1.1.3 Technology and Solution Classification
- 1.1.4 Customer and Distribution Channel Classification
- 1.1.5 Geographic Segmentation
- 1.1.6 Market Segment Definitions and Boundaries
- 1.2 By Type
- 1.2.1 Software
- 1.2.2 Services
- 1.3 By Deployment
- 1.3.1 On-premise
- 1.3.2 Cloud-based
- 1.4 By Application
- 1.4.1 Power Trading
- 1.4.2 Natural Gas Trading
- 1.4.3 Oil Trading
- 1.4.4 Coal Trading
- 1.4.5 Renewable Energy Trading
- 1.5 By End User
- 1.5.1 Utilities
- 1.5.2 Traders & Marketers
- 1.5.3 Energy Producers
- 1.5.4 Industrial Consumers
Chapter 2 Introduction
- 2.1 Report Objectives and Scope
- 2.2 Product Definition and Industry Terminology
- 2.3 Market Inclusions and Exclusions
- 2.4 Research Process
- 2.4.1 Primary Research and Expert Interviews
- 2.4.2 Secondary Research and Source Review
- 2.4.3 Top-Down and Bottom-Up Estimation
- 2.4.4 Data Triangulation and Verification
- 2.5 Market Size Measurement Basis
- 2.5.1 2025: USD 2.48 billion → 2035: USD 4.24 billion
- 2.6 Historical and Forecast Reference Periods
- 2.6.1 Historical Period: 2018-2025
- 2.6.2 Base Year: 2025
- 2.6.3 Forecast Period: 2025-2035
- 2.7 Research Assumptions and Limitations
Chapter 3 Executive Summary
- 3.1 Market Snapshot and Key Findings
- 3.2 Base-Year Market Size, 2025
- 3.3 Forecast Market Size, 2035
- 3.4 Revenue and Volume Growth Outlook
- 3.5 Key Demand and Supply Indicators
- 3.6 Leading Market Segments
- 3.7 Fastest-Growing Market Opportunities
- 3.8 Regional Performance Highlights
- 3.9 Technology and Industry Transformation
- 3.10 Competitive Landscape Summary
- 3.11 Analyst View and Strategic Implications
Chapter 4 Global Energy Trading Risk Management (ETRM) Software Market Trends and Developments
- 4.1 Historical Industry Development, 2018-2025
- 4.2 Recent Market Trends and Developments
- 4.3 Demand and Customer Behavior Trends
- 4.4 Technology and Product Innovation
- 4.5 Artificial Intelligence, Automation and Digitalization
- 4.6 Local Manufacturing and Supply Chain Realignment
- 4.7 Industry Partnerships, Mergers and Acquisitions
- 4.8 Sustainability and Circular Economy Developments
- 4.9 Government and Private Sector Investment Trends
- 4.10 Emerging Business Models and Commercialization
- 4.11 Industry Developments and Announcements
Chapter 5 Global Energy Trading Risk Management (ETRM) Software Market Supply and Demand Analysis
- 5.1 Demand Trend and Consumption Analysis, 2018-2025
- 5.2 Demand Forecast, 2025-2035
- 5.3 Supply Chain Structure and Procurement Trends
- 5.4 Supply-Demand Gap and Bottlenecks
- 5.5 Import Dependence and Sourcing Structure
- 5.6 Regional Supply and Demand Concentration
Chapter 6 Global Energy Trading Risk Management (ETRM) Software Market Pricing Analysis
- 6.1 Pricing Structure and Measurement
- 6.2 Historical Pricing Trends, 2018-2025
- 6.3 Pricing Outlook, 2025-2035
- 6.4 Pricing by Product and Market Segment
- 6.5 Geographic Pricing Differences
- 6.6 Key Input, Energy, Labor and Logistics Costs
- 6.7 Contract Pricing and Purchasing Models
- 6.8 Pricing Sensitivity and Competitive Positioning
- 6.9 Price, Margin and Profitability Implications
Chapter 7 Global Energy Trading Risk Management (ETRM) Software Market Dynamics
- 7.1 Market Growth Drivers
- 7.1.1 Demand-Side Drivers
- 7.1.2 Technology and Innovation Drivers
- 7.1.3 Infrastructure and Investment Drivers
- 7.1.4 Regulatory and Policy Drivers
- 7.2 Market Restraints
- 7.2.1 Cost and Affordability Constraints
- 7.2.2 Technology and Adoption Barriers
- 7.2.3 Supply Chain and Operational Constraints
- 7.3 Market Challenges
- 7.3.1 Competitive Pressure and Margin Erosion
- 7.3.2 Skills, Infrastructure and Implementation Gaps
- 7.4 Emerging Market Opportunities
- 7.5 Market Dynamics Impact and Time-Horizon Assessment
Chapter 8 Global Energy Trading Risk Management (ETRM) Software Value Chain Analysis
- 8.1 Industry Value Chain Overview
- 8.2 Upstream Suppliers and Critical Inputs
- 8.3 Technology and Component Providers
- 8.4 Manufacturing or Service Delivery
- 8.5 Distribution, Channel Partners and Integrators
- 8.6 Downstream Applications and End Users
- 8.7 Value Addition and Profit Pools
- 8.8 Vertical Integration and Outsourcing
- 8.9 Supplier Concentration and Risk
- 8.10 Supply Chain Localization and Resilience
Chapter 9 Global Energy Trading Risk Management (ETRM) Software Market Regulations and Policies
- 9.1 Relevant Laws, Standards and Compliance Frameworks
- 9.2 Product, Service, Safety and Quality Requirements
- 9.3 Government Policies, Incentives and Subsidies
- 9.4 Imports, Exports and Trade Barriers
- 9.5 Public Procurement and Local Content Requirements
- 9.6 Data Protection, AI and Cybersecurity Compliance
- 9.7 Upcoming Policy Changes and Market Implications
Chapter 10 Global Energy Trading Risk Management (ETRM) Software Market Hotspots and Opportunities
- 10.1 Market Opportunity Mapping and Growth Hotspots
- 10.2 High-Growth Applications and Customer Groups
- 10.3 Underserved Markets and White-Space Opportunities
- 10.4 Emerging Technology and Product Opportunities
- 10.5 New Capacity and Investment Hotspots
- 10.6 Market Entry and Expansion Opportunities
- 10.7 Distribution and Partnership Opportunities
- 10.8 Near-Term and Long-Term Commercial Potential
- 10.9 Opportunity Attractiveness and Execution Risks
Chapter 11 Global Energy Trading Risk Management (ETRM) Software Market Outlook, 2025-2035
- 11.1 Market Size and Analysis
- 11.1.1 Revenue (Market Measurement: 2025: USD 2.48 billion → 2035: USD 4.24 billion)
- 11.1.2 Historical Market Size, 2018-2025
- 11.1.3 Base-Year Market Size, 2025
- 11.2 Market Forecast, 2025-2035
- 11.2.1 Revenue Forecast to 2035
- 11.2.2 CAGR and Year-on-Year Growth
- 11.2.3 Incremental Revenue Opportunity
- 11.3 Forecast Assumptions and Scenario Analysis
- 11.3.1 Base-Case Forecast
- 11.3.2 Optimistic and Conservative Scenarios
- 11.3.3 Technology, Pricing and Policy Sensitivities
- 11.4 Market Attractiveness and Growth Outlook
Chapter 12 Global Energy Trading Risk Management (ETRM) Software Market Segmentation and Outlook
- 12.1 Segmentation Summary and Market Shares, 2025
- 12.2 Largest and Fastest-Growing Segments
- 12.3 By Type - Market Size and Forecast, 2025-2035
- 12.3.1 Segment Definition and Scope
- 12.3.2 Historical Market Size, 2018-2025
- 12.3.3 Revenue Forecast, 2025-2035
- 12.3.4 Base-Year Market Share, 2025
- 12.3.5 Segment CAGR and Growth Drivers
- 12.3.6 Subsegment Market Size and Forecast
- 12.3.6.1 Software
- 12.3.6.2 Services
- 12.3.7 Subsegment Pricing and Adoption Trends
- 12.3.8 Leading Suppliers and Competition
- 12.3.9 Regional Demand and Opportunities
- 12.4 By Deployment - Market Size and Forecast, 2025-2035
- 12.4.1 Segment Definition and Scope
- 12.4.2 Historical Market Size, 2018-2025
- 12.4.3 Revenue Forecast, 2025-2035
- 12.4.4 Base-Year Market Share, 2025
- 12.4.5 Segment CAGR and Growth Drivers
- 12.4.6 Subsegment Market Size and Forecast
- 12.4.6.1 On-premise
- 12.4.6.2 Cloud-based
- 12.4.7 Subsegment Pricing and Adoption Trends
- 12.4.8 Leading Suppliers and Competition
- 12.4.9 Regional Demand and Opportunities
- 12.5 By Application - Market Size and Forecast, 2025-2035
- 12.5.1 Segment Definition and Scope
- 12.5.2 Historical Market Size, 2018-2025
- 12.5.3 Revenue Forecast, 2025-2035
- 12.5.4 Base-Year Market Share, 2025
- 12.5.5 Segment CAGR and Growth Drivers
- 12.5.6 Subsegment Market Size and Forecast
- 12.5.6.1 Power Trading
- 12.5.6.2 Natural Gas Trading
- 12.5.6.3 Oil Trading
- 12.5.6.4 Coal Trading
- 12.5.6.5 Renewable Energy Trading
- 12.5.7 Subsegment Pricing and Adoption Trends
- 12.5.8 Leading Suppliers and Competition
- 12.5.9 Regional Demand and Opportunities
- 12.6 By End User - Market Size and Forecast, 2025-2035
- 12.6.1 Segment Definition and Scope
- 12.6.2 Historical Market Size, 2018-2025
- 12.6.3 Revenue Forecast, 2025-2035
- 12.6.4 Base-Year Market Share, 2025
- 12.6.5 Segment CAGR and Growth Drivers
- 12.6.6 Subsegment Market Size and Forecast
- 12.6.6.1 Utilities
- 12.6.6.2 Traders & Marketers
- 12.6.6.3 Energy Producers
- 12.6.6.4 Industrial Consumers
- 12.6.7 Subsegment Pricing and Adoption Trends
- 12.6.8 Leading Suppliers and Competition
- 12.6.9 Regional Demand and Opportunities
- 12.7 Segment Growth Comparison
- 12.8 Segment Attractiveness and Priority Matrix
Chapter 13 Global Energy Trading Risk Management (ETRM) Software End-Use and Application Market Outlook
- 13.1 End-Use Industry and Customer Demand Structure
- 13.2 Leading Applications and Customer Groups
- 13.3 End-Use Market Size, Share and Forecast
- 13.4 Major End-Use Industry Deep Dives
- 13.4.1 Customer Requirements and Use Cases
- 13.4.2 Demand and Replacement Cycles
- 13.4.3 Technical and Regulatory Considerations
- 13.4.4 Purchasing and Procurement Models
- 13.4.5 Leading Vendors and Distribution Channels
- 13.4.6 Forecast and Commercial Opportunities
- 13.5 Emerging Applications and Cross-Segment Demand
- 13.6 End-Use Industry Investment Priorities
Chapter 14 Global Energy Trading Risk Management (ETRM) Software Geographic Market Outlook, 2025-2035
- 14.1 Regional Market Size and Share, 2025
- 14.2 Regional Market Forecast, 2025-2035
- 14.3 Regional Pricing, Production and Demand Differences
- 14.4 North America
- 14.4.1 United States
- 14.4.2 Canada
- 14.4.3 Mexico
- 14.5 Europe
- 14.5.1 Germany
- 14.5.2 France
- 14.5.3 Italy
- 14.5.4 United Kingdom
- 14.5.5 Spain
- 14.5.6 Poland
- 14.5.7 Russia
- 14.5.8 Netherlands
- 14.5.9 Belgium
- 14.5.10 Sweden
- 14.5.11 Denmark
- 14.5.12 Norway
- 14.5.13 Rest of Europe
- 14.6 Asia Pacific
- 14.6.1 China
- 14.6.2 India
- 14.6.3 Japan
- 14.6.4 South Korea
- 14.6.5 Thailand
- 14.6.6 Indonesia
- 14.6.7 Vietnam
- 14.6.8 Malaysia
- 14.6.9 Australia
- 14.6.10 Rest of Asia Pacific
- 14.7 Latin America
- 14.7.1 Brazil
- 14.7.2 Argentina
- 14.7.3 Colombia
- 14.7.4 Chile
- 14.7.5 Rest of Latin America
- 14.8 Middle East
- 14.8.1 Saudi Arabia
- 14.8.2 United Arab Emirates
- 14.8.3 Turkey
- 14.8.4 Israel
- 14.8.5 Iran
- 14.8.6 Rest of the Middle East
- 14.9 Africa
- 14.9.1 South Africa
- 14.9.2 Egypt
- 14.9.3 Nigeria
- 14.9.4 Morocco
- 14.9.5 Rest of Africa
- 14.10 Regional Investment, Policy and Supply Chain Differences
- 14.11 Regional Competitive Landscape
- 14.12 Geographic Growth Hotspots
Chapter 15 Global Energy Trading Risk Management (ETRM) Software Technology, Innovation and Sustainability Outlook
- 15.1 Technology Landscape and Maturity
- 15.2 Product, Process and Service Innovation
- 15.3 AI, Automation and Digital Tools in the Industry
- 15.4 Technology Adoption and Performance Benchmarking
- 15.5 Innovation Pipeline and R&D Investment
- 15.6 Patent and Intellectual Property Trends
- 15.7 Energy Efficiency and Resource Management
- 15.8 Sustainability, Recycling and Circularity
- 15.9 Technology Roadmap, 2025-2035
- 15.10 Risks of Obsolescence and Technology Substitution
Chapter 16 Global Energy Trading Risk Management (ETRM) Software Market Key Strategic Imperatives
- 16.1 Growth and Market Entry Priorities
- 16.2 High-Return Products and Segments
- 16.3 Pricing, Profitability and Cost Optimization
- 16.4 Technology Investment and Product Differentiation
- 16.5 Supply Chain Localization and Resilience
- 16.6 Distribution and Customer Acquisition
- 16.7 Partnership, Acquisition and Capacity Strategy
- 16.8 Regional Expansion Priorities
- 16.9 Short-, Medium- and Long-Term Actions
Chapter 17 Competition Outlook
- 17.1 Industry Competition Characteristics
- 17.2 Market Structure and Concentration
- 17.3 Market Share and Competitive Positioning, 2025
- 17.4 Company-Wise Revenue and Product Benchmarking
- 17.5 Production and Service Capacity Benchmarking
- 17.6 Technology, Pricing and Differentiation
- 17.7 Regional Footprint and Distribution Strength
- 17.8 Mergers, Acquisitions and Strategic Alliances
- 17.9 New Entrants and Competitive Threats
- 17.10 Porter's Five Forces and Industry Attractiveness
- 17.11 Competitive Outlook, 2025-2035
Chapter 18 Company Profiles
- 18.1 Company Coverage and Selection Criteria
- 18.2 ION Group
- 18.2.1 Business Description
- 18.2.2 Company Ownership and Geographic Presence
- 18.2.3 Product and Service Portfolio
- 18.2.4 Manufacturing and Operating Footprint
- 18.2.5 Financial Performance and Investment
- 18.2.6 Market Share and Competitive Position
- 18.2.7 Technology and Innovation Capabilities
- 18.2.8 Strategic Alliances or Partnerships
- 18.2.9 Recent Developments
- 18.2.10 Growth Strategy and Outlook
- 18.3 Hitachi Energy
- 18.4 FIS
- 18.5 SAP
- 18.6 Eka Software Solutions
- 18.7 Molecule
- 18.8 Amphora
- 18.9 TMX Trayport
- 18.10 PCI Energy Solutions
- 18.11 Volue
- 18.12 Energy One
- 18.13 Other Relevant Market Participants
Note: Every listed company is profiled on the structure shown under the first company. The company list is preliminary and may change based on research findings, market developments, data availability and client requirements.
Chapter 19 Disclaimer
- 19.1 Research and Forecast Disclaimer
- 19.2 Data Source and Estimation Limitations
Note: The depth of individual sections depends on data availability for this market. Volume, capacity, trade and other unit-based metrics are included where applicable.

