
Real-time bidding turns streams into storefronts
The global live auction commerce market was valued at USD 1.04 billion in 2025 and is projected to increase from USD 1.20 billion in 2026 to USD 4.22 billion by 2035, registering a CAGR of 15.00% during 2026–2035. Demand comes from collectors, resellers and small shops that sell trading cards, toys, luxury goods and sneakers in streamed sessions where each lot closes on a short bid timer. Asia Pacific held the largest regional share, 42.0% in 2025, because livestream selling is most deeply rooted in China and is spreading through Japan and Australia. Latin America is the fastest-growing region at 16.50% a year, as social video shopping reaches Brazil. On the commercial side, general social apps have added native bidding tools that compete with dedicated auction apps, while card grading and authentication services have become part of the sale for high-value lots.
What do live auction platforms earn on each streamed sale?
The market covers the revenue that platforms earn from real-time auctions run during livestreams, including commissions, seller fees and buyer fees on lots sold through bidding. Sellers host streams on dedicated apps or on social video platforms, show each item on camera and run a countdown, and buyers pay through the platform when the timer closes.
The scope excludes the gross value of goods sold, fixed-price livestream sales, traditional auction houses and timed online listings without a stream. The value chain runs from card makers, brands and resellers through streaming and payment tools, grading and authentication services and shipping partners to collectors watching on their phones.
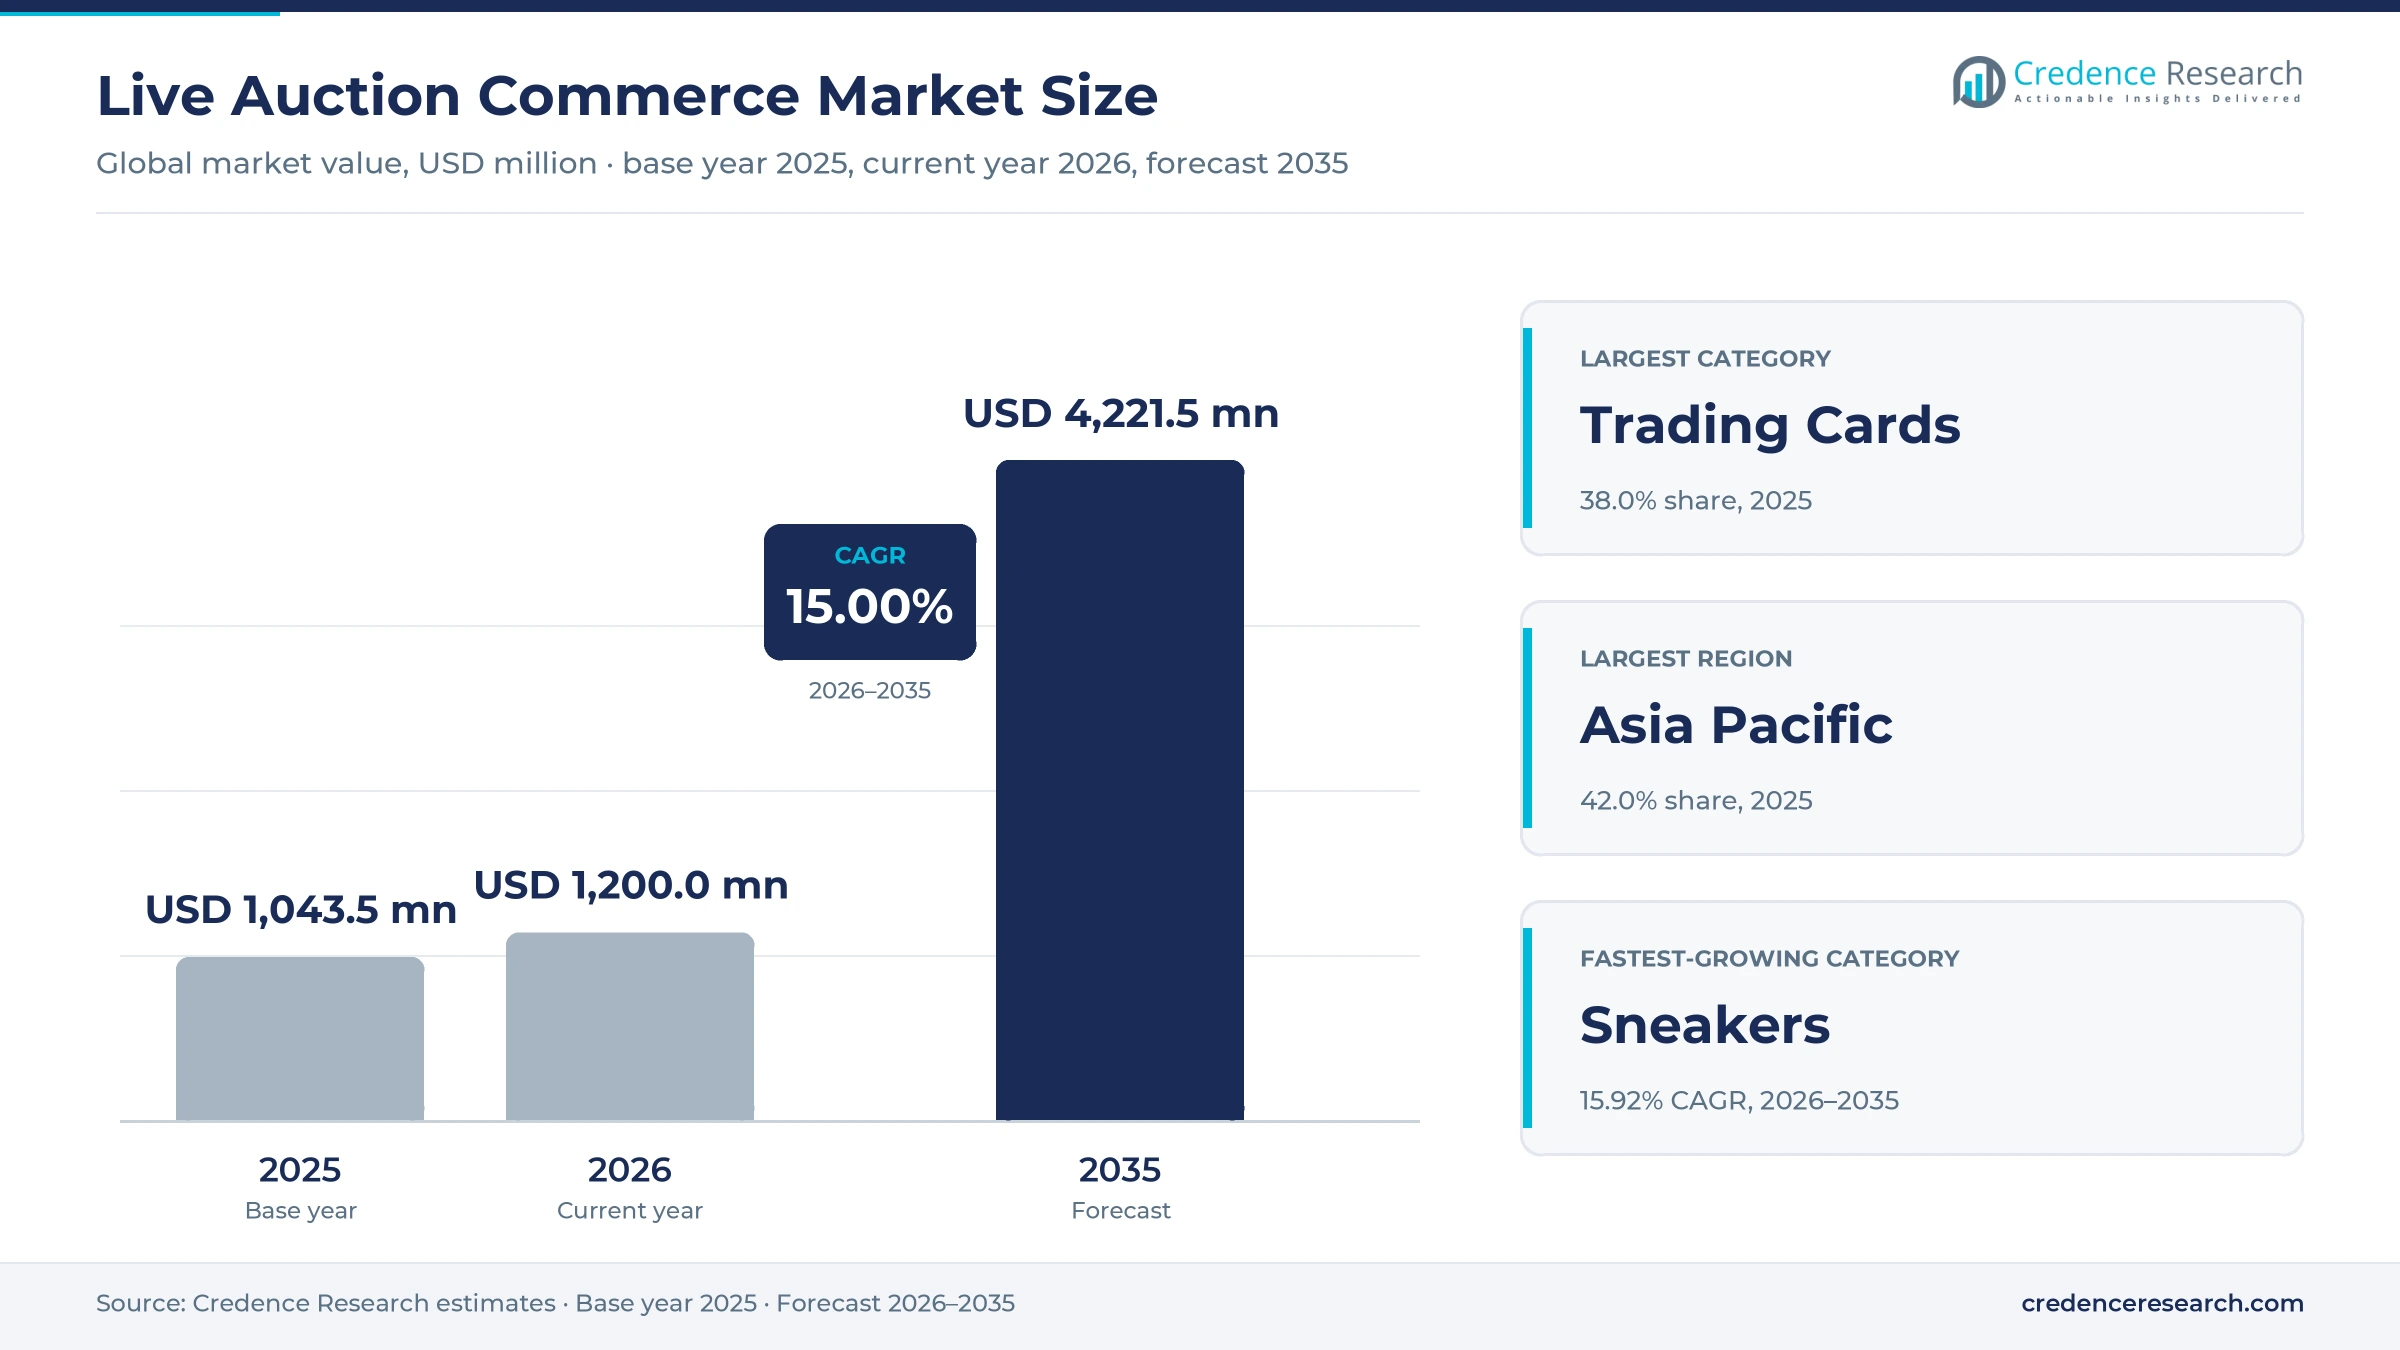
Live Auction Commerce Market Insights
- The market grows from USD 1.04 billion in 2025 to USD 4.22 billion by 2035 at a 15.00% CAGR, as more collectors buy through streamed bidding.
- Asia Pacific held 42.0% of 2025 value, supported by a Chinese livestream e-commerce base worth CNY 4.5 trillion in 2024.
- Trading Cards led with 38.0% of 2025 value, as about 10 billion Pokémon cards were produced in the year to March 2026.
- In March 2026, TikTok Shop ran an Auction Day campaign with a 3% commission on eligible auction orders in the U.S.
- Whatnot raised $545 million at a $20 billion valuation in August 2026, which shows the capital now behind dedicated apps.
Trading cards lead while sneakers grow fastest
Why do trading cards lead streamed auction sales?
Based on category, the market is categorized into trading cards, collectibles, fashion and sneakers. Trading Cards led with 38.0% of 2025 value because card supply and grading keep refilling auction lots, and The Pokémon Company reported cumulative production of 85 billion cards by March 2026, up from 75 billion a year earlier. Sneakers grow fastest at 15.92% a year, as TikTok Shop said in August 2026 that U.K. sneaker sellers using LIVE Auction grew ninefold in a month. Collectibles gain from toy and memorabilia lots, while fashion gains as eBay Live streams pre-owned Hermès and Rolex pieces.
How do dedicated apps and social platforms split bids?
Based on platform, the market is categorized into dedicated apps and social commerce. Dedicated Apps led with 64.0% of 2025 value because collectors gather in apps built around bidding, and Whatnot said in August 2026 that more than 650,000 people join each week. Social Commerce grows fastest at 15.76% a year, as general video apps add bidding, and TikTok Shop reported in August 2026 that LIVE auctions made up 40% of U.K. collectables sales in June 2026. TikTok said the U.K. collectables category itself rose 84% from a year earlier.
Which sellers account for most streamed auction value?
Based on seller type, the market is categorized into professional resellers, hobbyist sellers and brands and retailers. Professional Resellers led with 46.0% of 2025 value because full-time streamers run several shows a week, and Whatnot said in January 2026 that sellers going live three to four times weekly averaged more than $13,000 in monthly sales. Brands and Retailers grow fastest at 15.96% a year, as Whatnot launched a Shopify app on April 29, 2026, after 30 beta merchants generated over $10 million across 20 categories. Hobbyists remain a large base of part-time hosts who stream on evenings and weekends.
| Segment Group | Leading Sub-segment | Share, 2025 | Fastest-growing Sub-segment | CAGR, 2026–2035 |
|---|---|---|---|---|
| By Category | Trading Cards | 38.0% | Sneakers | 15.92% |
| By Platform | Dedicated Apps | 64.0% | Social Commerce | 15.76% |
| By Seller Type | Professional Resellers | 46.0% | Brands and Retailers | 15.96% |
Request a Free Sample
Fill in your details and we'll send you a free sample report.
- Sample data tables & charts
- Research methodology
Stream shopping, star hosts and checkout tools lift bids
Livestream shopping adoption expands real-time bidding
Livestream shopping is moving from a niche habit to a routine way to buy, which widens the pool of bidders for every auction lot. TikTok Shop said in August 2026 that U.K. LIVE sales grew 55% from a year earlier, with more than 6,000 LIVE sessions held each day in the country. Whatnot reported that its buyer base more than doubled over the year to August 2026, and that over 20 million new accounts were created in 2025. In Brazil, TikTok Shop said daily lives rose twentyfold in its first year after the May 2025 launch, according to Canaltech. In the Credence Research model this adds about 6.0 percentage points to annual growth to 2035.
Creator hosts raise engagement for collectibles
Hosts with their own following turn an auction into a show, which keeps viewers watching and bidding for longer. eBay listed 11 hosted live holiday events from Nov. 28, 2025, with guests such as Max B and Jill Zarin alongside top sellers like Vookum's and Linda's Stuff. In Australia, eBay Live opened in December 2025 with AFL player Buddy Franklin selling trading cards, according to eCommerceNews. TikTok Shop collectibles head Owen Liang said more than 20 million users watch collectibles content on TikTok each month, according to Value Added Resource. In the Credence Research model this adds about 4.2 percentage points to annual growth.
Integrated payments and logistics simplify transactions
Auctions close in seconds, so platforms that settle payment, sync stock and ship in one flow remove the friction that once limited streamed sales. Whatnot launched a Shopify app on April 29, 2026, that syncs products, inventory and orders, so merchants fulfill bids from one dashboard, according to Pulse. TikTok Shop documented auction listings through LIVE Manager in June 2026 with a return window of up to 30 days, according to PPC Land. eBay began PSA inspection of U.K. trading cards sold for £500 or more on May 6, 2026. In the Credence Research model this adds about 2.7 percentage points to annual growth.
Trading card supply and grading feed new lots
A steady flow of new and graded cards gives sellers fresh lots for every stream, which keeps auctions running between big releases. The Pokémon Company reported cumulative card production of 85 billion by March 2026, about 10 billion more than a year earlier, according to PokeGuardian. Major graders handled 26.6 million cards in 2025, with PSA at 19.26 million, up 26%, and Pokémon at more than 16.1 million, according to GemRate data cited by Cllct. These graded cards feed the card grading services industry and give buyers a trusted grade before they bid. As a result, trading cards hold 38.0% of 2025 value.
Social apps add auction tools and authentication grows
Shift as social and resale apps add native bidding
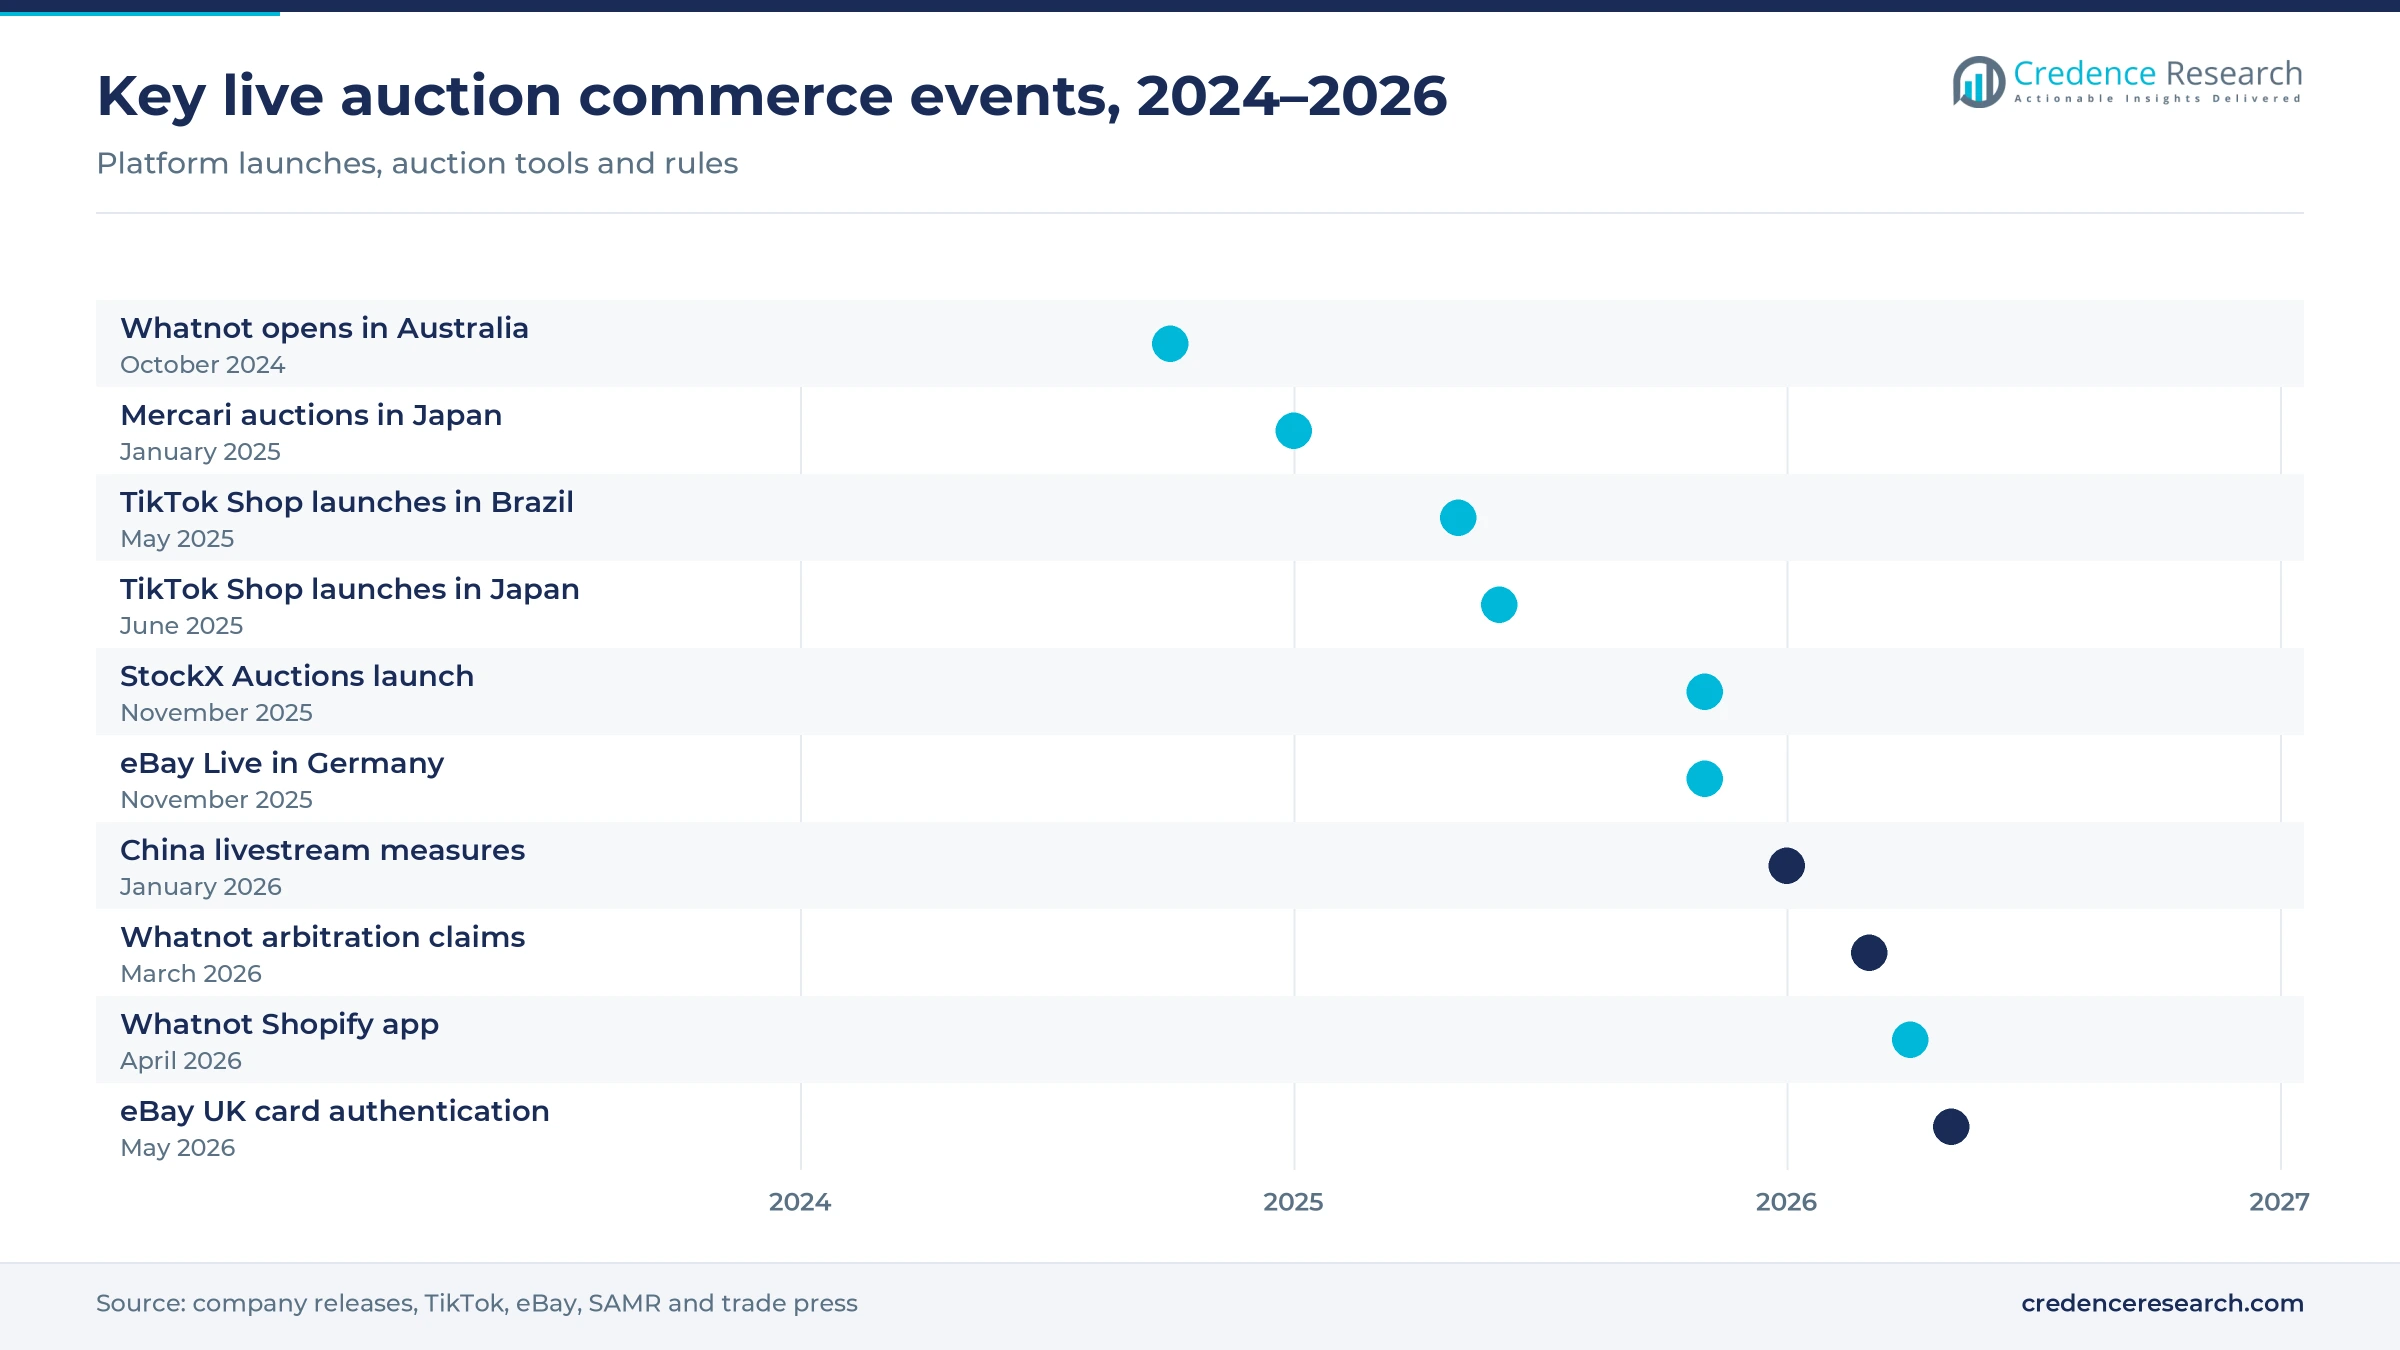
Bidding is shifting from a feature of specialist apps to a standard tool on general social and resale platforms. TikTok Shop documented Countdown Bidding in June 2026 with fixed, extended and Surprise Set formats, and a $5,000 cap per Surprise Set item, according to PPC Land. StockX launched StockX Auctions for sneakers and memorabilia on Nov. 5, 2025, according to Value Added Resource. In Japan, Mercari launched auctions in January 2025 after a survey found about 70% of users wanted to try them. As a result, social commerce grows at 15.76% a year, the fastest platform segment, as bidding reaches audiences that never opened an auction app.
Rise of authentication built into high-value lots
Authentication is becoming part of the auction itself, because buyers bid more freely when a third party has checked the item. eBay began PSA inspection for U.K. trading cards sold at £500 or more on May 6, 2026, and said a 1999 Pokémon Shadowless Charizard sold for £16,500 in the U.K. in 2025. CGC graded 4.92 million cards in 2025, up 121%, according to GemRate data cited by Cllct. eBay Live holiday streams in late 2025 also featured pre-owned Hermès, Rolex and Cartier pieces. In turn, the wider sports memorabilia trade gains a channel where verified items reach bidders within seconds.
Brand and retailer onboarding opens a new seller base
Brands and retailers offer a clear opening, because most still sell through fixed-price stores and have not yet tried streamed bidding. Whatnot opened its Shopify app in eight countries on April 29, 2026, after 30 beta merchants generated over $10 million across 20 categories, according to Pulse. Fanatics launched Fanatics Live in July 2023 with Major League Baseball, Topps and VeeFriends as early partners, according to Retail Dive. eBay Live has added Hard Goods, Health and Beauty and Art and Antiques, according to Value Added Resource in February 2026. As a result, brands and retailers grow at 15.96% a year, the fastest seller type.
New markets in Europe and Latin America offer an opening
Europe and Latin America offer the next opening, because live auction tools arrived there only in the past two years. eBay Live launched in Germany on Nov. 29, 2025, at Comic Con Stuttgart and later reached France and Italy, according to eBay and Value Added Resource. Whatnot said in August 2026 that U.K. sellers rose 360% over the year, with daily-live U.K. sellers averaging £30,000 a month. In Brazil, TikTok Shop reported 134 million active users in June 2026, according to Canaltech. As a result, Latin America becomes the fastest-growing region in the Credence Research model to 2035.
Gambling claims, fake bids and new rules test platforms
Gambling claims put card breaks under legal pressure
Card breaks and mystery formats face claims that they work like games of chance, which raises legal risk for platforms. A plaintiff attorney filed 15 arbitrations against Whatnot in March 2026 alleging an illegal casino, with 15 more planned, according to Value Added Resource. Whatnot rejected the claims and said breakers make up 4% of its sellers. In turn, platforms are tightening rules on random formats, which could slow growth in break-heavy categories.
Fake and shill bids undermine price discovery
Fake bids distort prices and can erode buyer trust, especially in new auction products with thin bidder pools. Soon after StockX Auctions opened on Nov. 5, 2025, a 2011 Nike Mags listing was bid up to $1.2 million, far above its real value, according to Value Added Resource. StockX said it used a mix of technology and human review to clean up such bids. As a result, platforms invest more in bidder checks and account limits.
China tightens rules on livestream selling
Stricter oversight in China raises compliance work for platforms and hosts in the largest regional market. SAMR and the Cyberspace Administration of China released new livestream e-commerce measures in January 2026, requiring AI hosts to be clearly labeled and banning fake transactions and false reviews. Platforms must also verify host qualifications and handle illegal activity in their live rooms. In turn, smaller studios that run jade and collectibles auctions face higher costs to stay compliant.
Impulse spending and scarcity draw public criticism
Fast bidding can push buyers into spending they regret, which draws media and consumer criticism of the format. The Guardian reported in late 2025 that one user built up £7,500 in credit card debt and that some card resellers charged up to 250% above retail. Such reports raise the risk that consumer protection agencies will act on the format. Platforms respond with spending tools, seller bans and clearer rules on random formats for buyers.
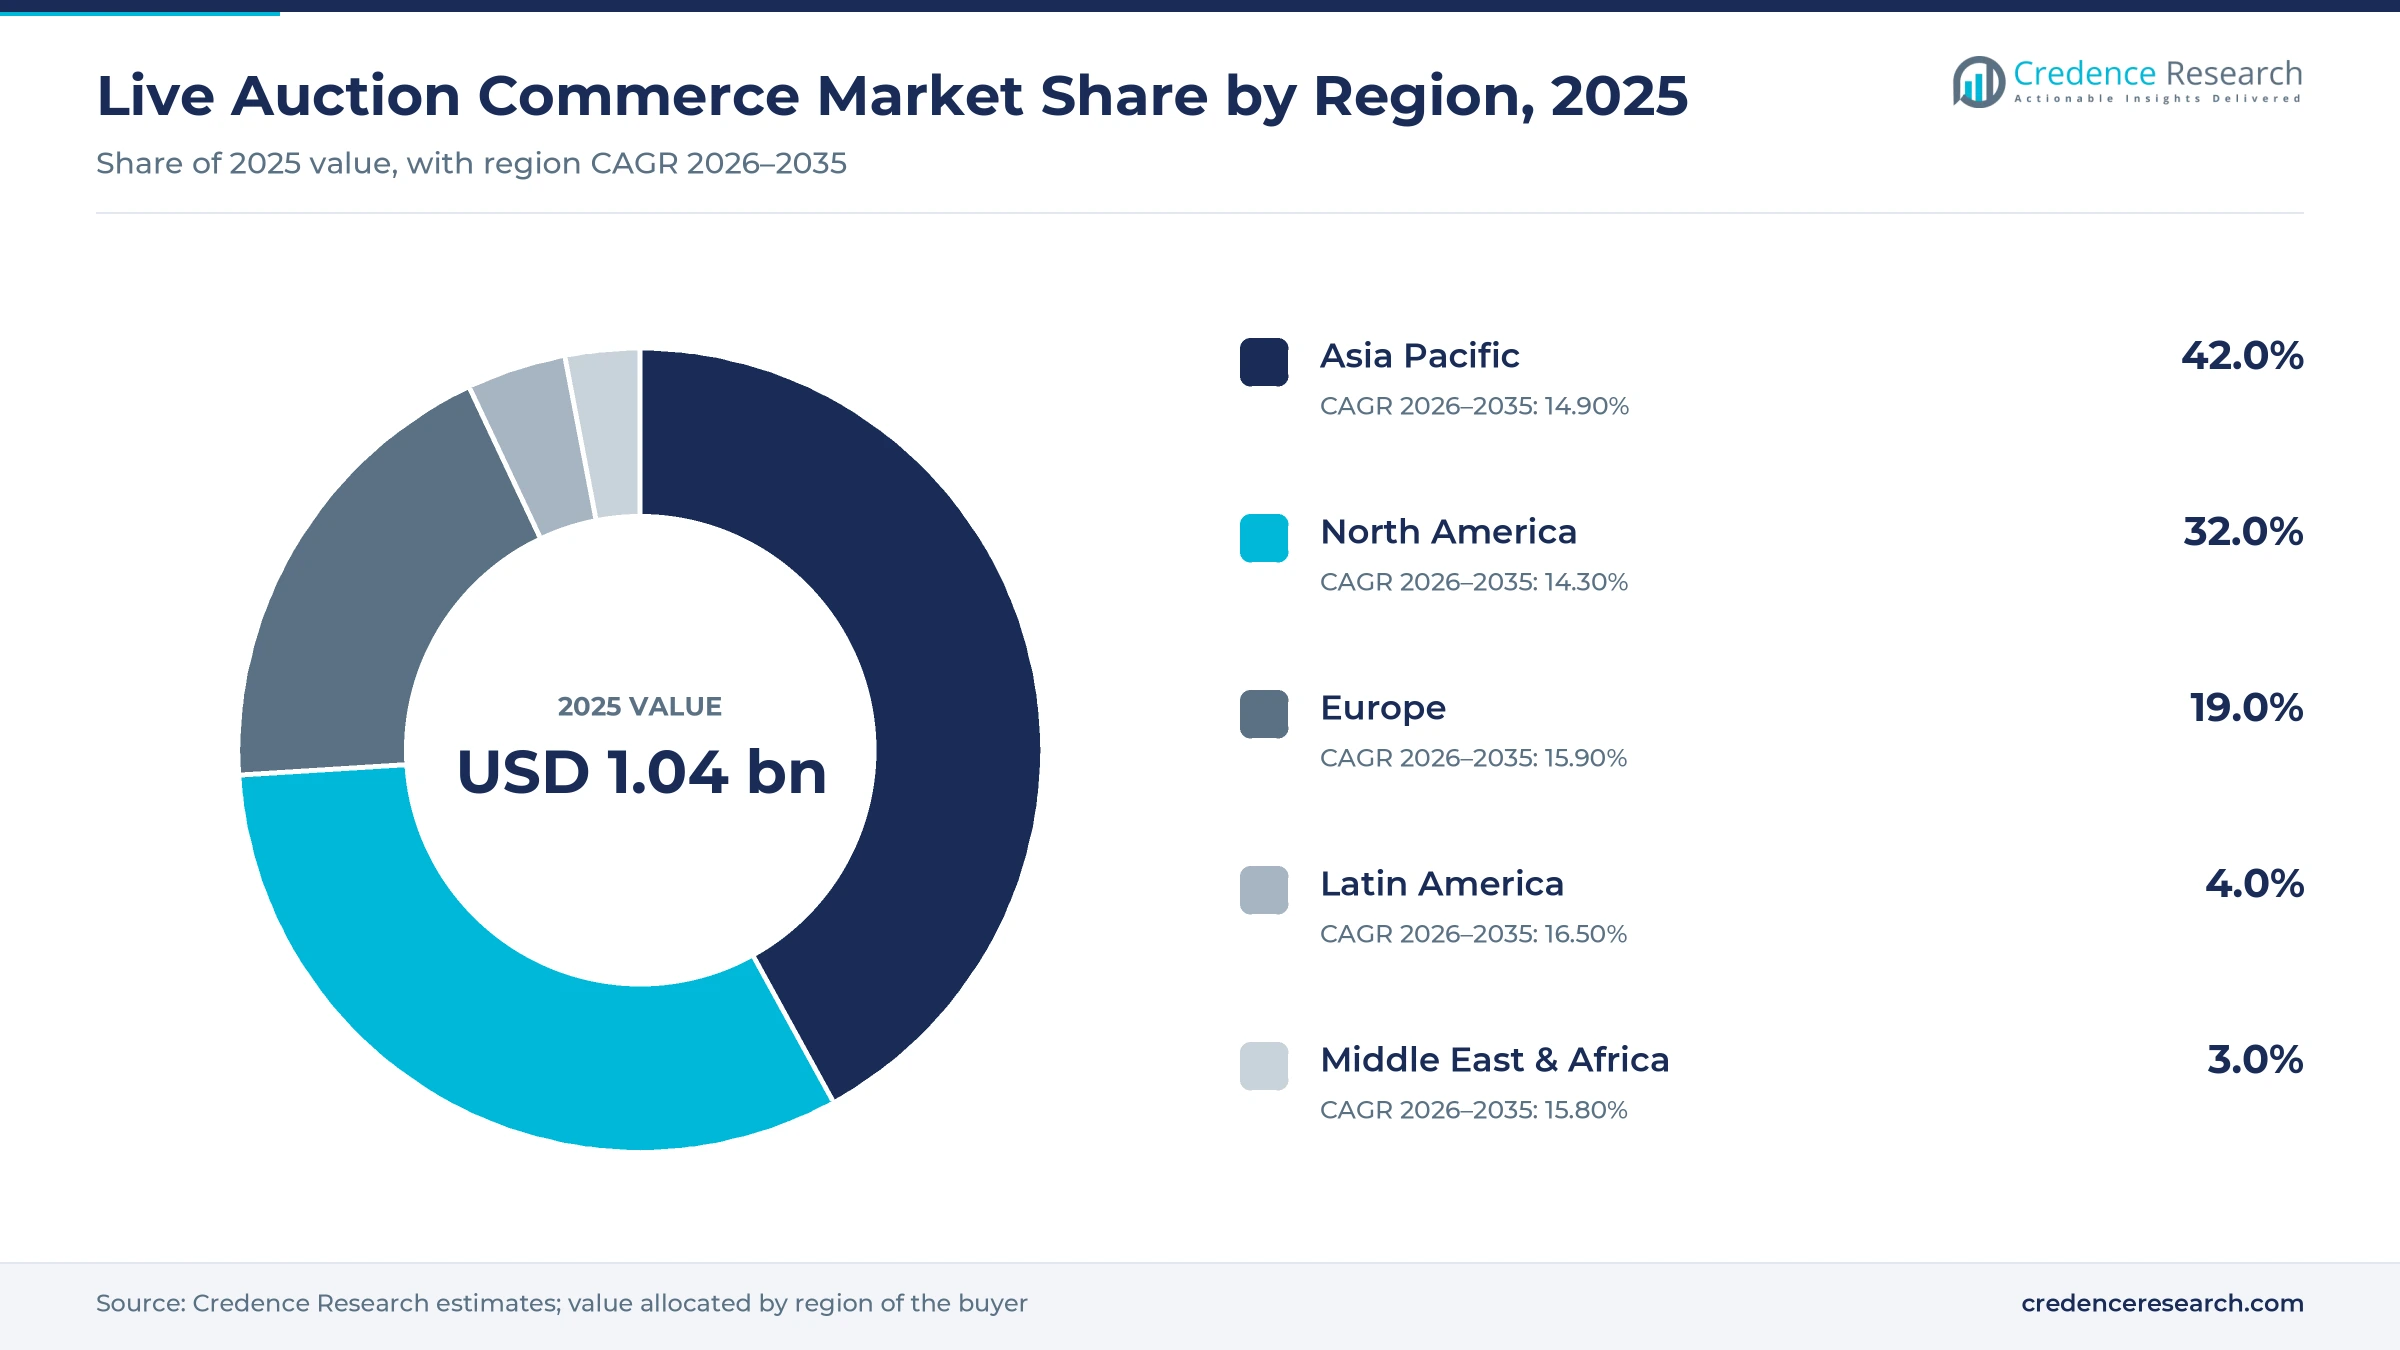
Asia Pacific leads as Latin America grows fastest
| Region | Value, 2025 (USD billion) | Share, 2025 | CAGR, 2026–2035 |
|---|---|---|---|
| Asia Pacific | 0.44 | 42.0% | 14.90% |
| North America | 0.33 | 32.0% | 14.30% |
| Europe | 0.20 | 19.0% | 15.90% |
| Latin America | 0.04 | 4.0% | 16.50% |
| Middle East & Africa | 0.03 | 3.0% | 15.80% |
Asia Pacific leads on deep livestream selling habits
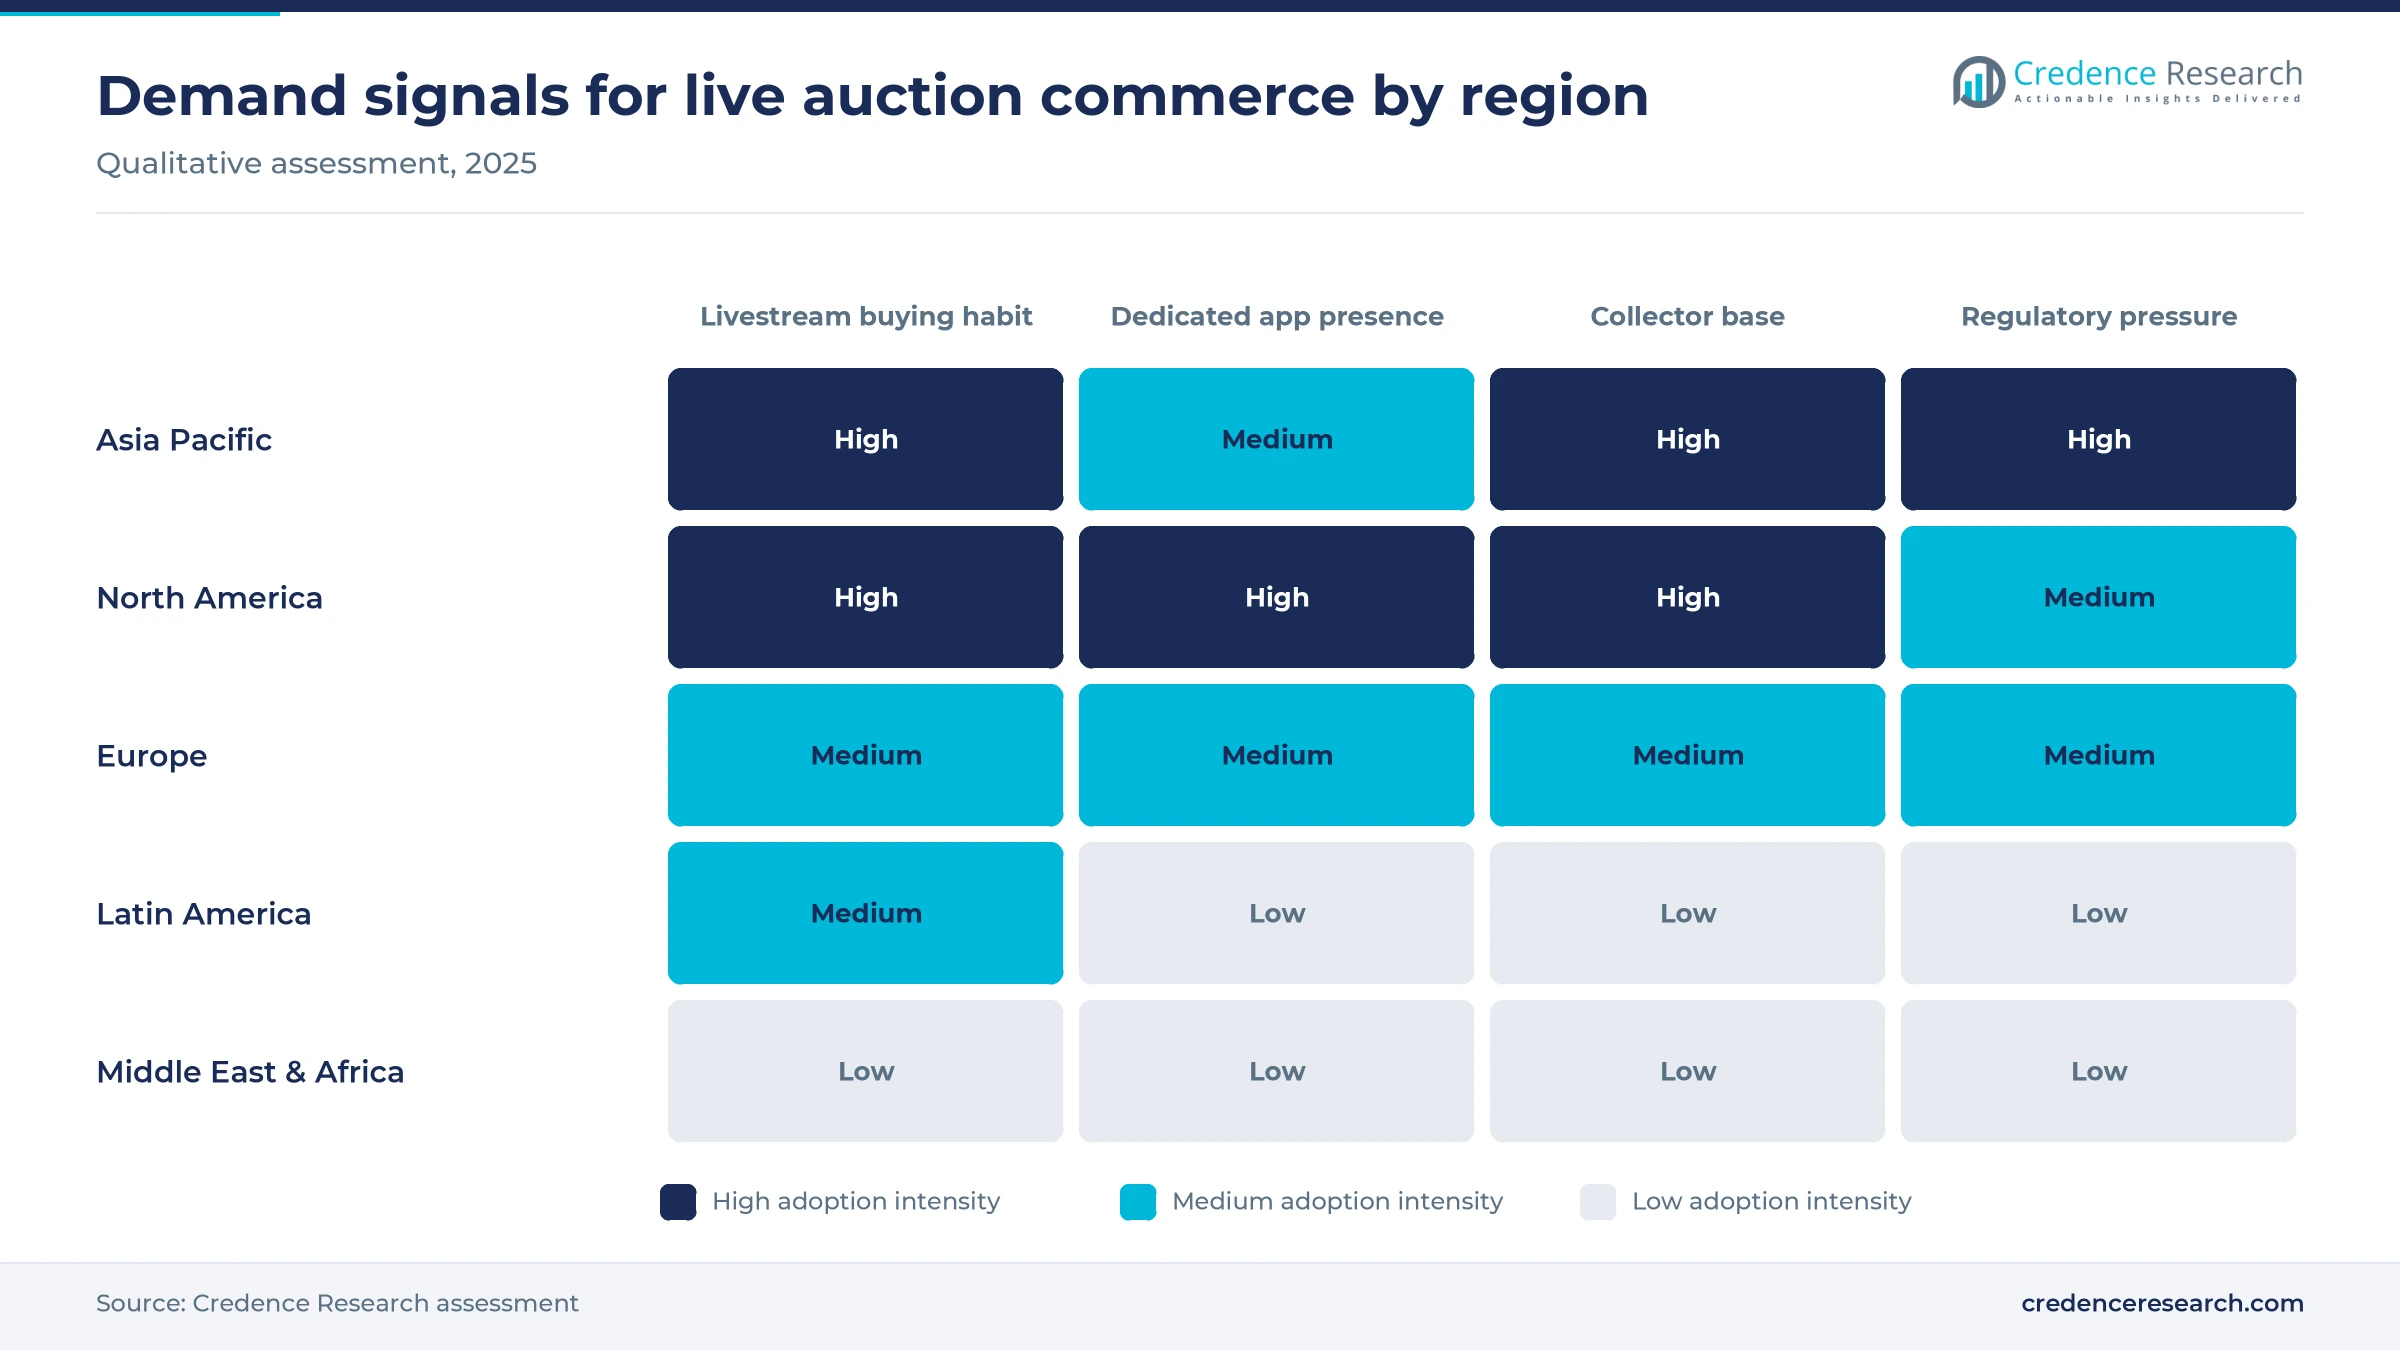
Asia Pacific held 42.0% of 2025 value and grows at 14.90% a year, because streamed selling is most widespread in China, where livestream e-commerce reached CNY 4.5 trillion in 2024, according to SAMR's Development Research Center. TikTok Shop launched in Japan on June 30, 2025, as its 17th market, according to TechNode. Whatnot opened to Australian sellers on Oct. 13, 2024, at the Oz National Trading Card Show in Melbourne. However, China's January 2026 rules add compliance cost for hosts.
North America leads dedicated auction apps
North America held 32.0% of 2025 value and grows at 14.30% a year, since the U.S. is the largest market for dedicated apps such as Whatnot, eBay Live and Fanatics Live. eBay Live began in the U.S. in 2022 and toured Los Angeles, Las Vegas and New York in 2025, according to Sports Illustrated. eBay Live reached Canada in February 2026 with $1 starting bids at Fan Expo Vancouver. TikTok Shop ran its U.S. Auction Day from March 19 to 31, 2026.
Europe grows on new launches in the U.K. and the EU
Europe held 19.0% of 2025 value and grows at 15.90% a year, as platforms open new countries. Whatnot named the U.K. its second-largest market in August 2026, and its U.K. sellers rose 360% over the year. eBay Live launched in Germany in November 2025, then in France and Italy by February 2026. TikTok Shop said its U.K. LIVE sales grew 55% in the year to August 2026, with sneakers among the fastest-growing auction categories.
Latin America is the fastest-growing region
Latin America held 4.0% of 2025 value and grows fastest at 16.50% a year, as social video shopping reaches Brazil. TikTok Shop launched there in May 2025 and said lives drove a 161-fold rise in live GMV in its first year, according to Canaltech. Daily lives rose twentyfold over the same period, and the app reported 134 million active users in the country. As a result, Brazilian sellers gain the reach that auction formats need to scale.
Middle East & Africa builds from a small base
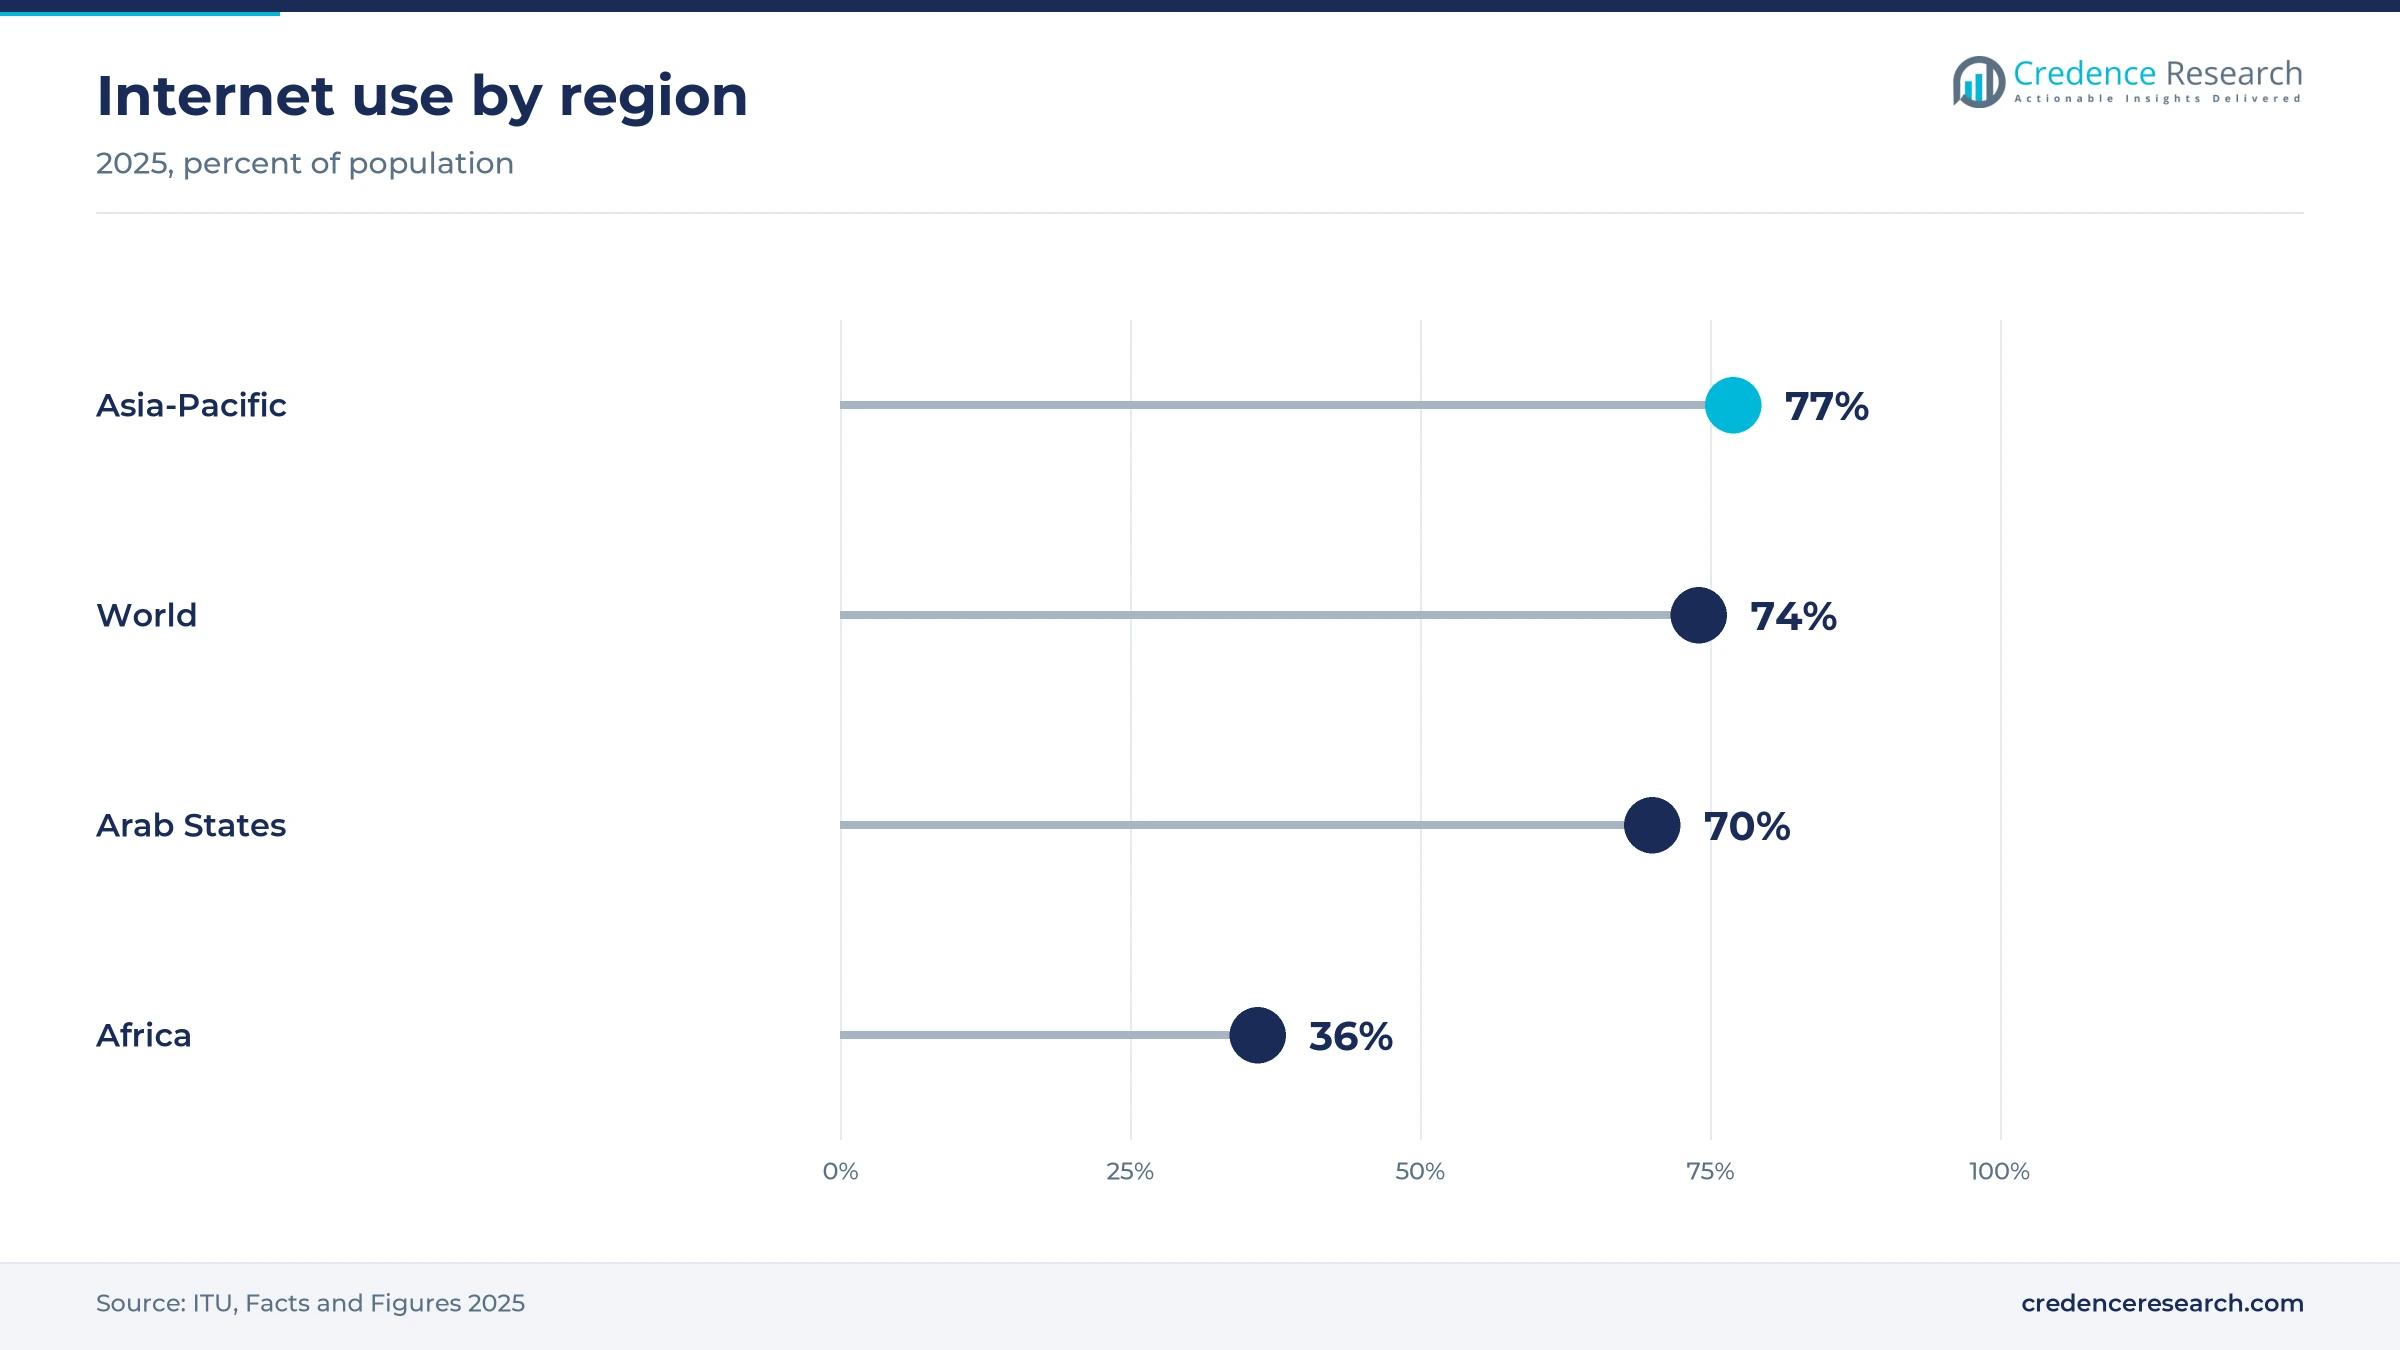
Middle East & Africa held 3.0% of 2025 value and grows at 15.80% a year, from a small base of streamed auctions. ITU put internet use at 70% in the Arab States and 36% in Africa in 2025, which limits the audience in much of Africa. Arab States connectivity is close to the world average of 74%, so Gulf buyers are the first audience. As a result, the Gulf leads regional spending to 2035, while African demand depends on wider mobile internet access.
Funding rounds and market launches in 2024–2026
| Development | Status and market relevance |
|---|---|
| In January 2025, Mercari launched auctions in Japan after a test of listings without a set price began in May 2024. | Launched January 2025; about 70% of surveyed users wanted to try auctions |
| In October 2025, Whatnot raised $225 million in a Series F round co-led by DST Global and CapitalG at an $11.5 billion valuation. | Closed October 2025; funds platform features and international expansion |
| In November 2025, StockX launched StockX Auctions for sneakers, pop-culture memorabilia and collectibles. | Launched Nov. 5, 2025; early fake bids were removed after review |
| In November 2025, eBay launched eBay Live in Germany at Comic Con Stuttgart, followed by Australia in December. | Germany Nov. 29, 2025; Australia Dec. 5, 2025; Canada February 2026 |
| In August 2026, Whatnot raised $545 million in a Series G round at a $20 billion valuation. | Announced August 2026; led by Iconiq, Lightspeed and Avra |
Bid timers, synced inventory and authentication
- Extended bid timers reset the countdown when a late bid arrives, as in the 30-second extended bidding that eBay Live used at its Canadian launch.
- Synced inventory links a seller's store catalog to the stream, so the Whatnot Shopify app updates stock and orders as each lot closes.
- Third-party authentication checks high-value lots before delivery, as PSA does for U.K. trading cards sold through eBay at £500 or more.
- Streaming host tools such as TikTok LIVE Manager and Fanatics LiveOS let sellers queue lots, track bids and review analytics, building on streaming software used across video apps.
Need a Custom Version of This Report?
Tailor the scope, geography, or segments to your exact requirements.
- Custom geography or segment scope
- Direct access to our analyst team
Platforms compete on fees, audience and trust
Competition centers on fees, audience size and buyer trust across streamed bidding apps. Whatnot leads dedicated apps with more than 250 categories, operations in the U.S., Canada, the U.K., several EU countries and Australia, and commissions of 8% to 11%. eBay uses its existing buyers and authentication services to grow eBay Live across seven countries, from trading cards to luxury goods. TikTok Shop brings a large social audience and has used campaigns such as a 3% commission Auction Day to attract sellers. Fanatics Live links streams to Topps cards and league partners. StockX entered with auctions for sneakers and memorabilia in November 2025. As formats converge, the platform that keeps fake bids and risky break formats out of its streams is likely to keep the highest-spending collectibles buyers.
Companies profiled and their roles in this market
| Company | Type | Role in the market |
|---|---|---|
| Whatnot | Dedicated live auction app | Runs streamed auctions across more than 250 categories in North America, Europe and Australia |
| eBay Live | Marketplace live channel | Streams auctions of cards, comics, watches and luxury goods with authentication |
| TikTok Shop LIVE | Social commerce platform | Offers Countdown Bidding and LIVE Auction tools to approved sellers |
| Fanatics Live | Dedicated live auction app | Hosts card breaks and collectible drops linked to Topps and league partners |
| StockX | Resale marketplace | Runs StockX Auctions for sneakers, memorabilia and collectibles since November 2025 |
Trust in each bid will decide who keeps collectors
Credence Research's view is that the live auction commerce market will grow near its forecast pace only if platforms keep each bid trustworthy. Audiences are no longer the main constraint, as Whatnot adds more than 650,000 sign-ups a week and TikTok Shop runs more than 6,000 U.K. LIVE sessions a day. The risks lie in gambling claims against card breaks, fake bids on new auction products and tighter rules in China. Platforms that combine authentication, clear rules on random formats and tools for brands will hold share by 2035.
Model built from platform, regulator and trade data
The report uses 2025 as the base year and forecasts to 2035. Market values come from the Credence Research model, which combines platform disclosures on users, sellers, sessions, fees and launches with official statistics from the International Telecommunication Union and China's State Administration for Market Regulation, and with card production and grading data published by The Pokémon Company and GemRate. Regional, category, platform and seller type splits are Credence Research estimates based on platform availability by country, published category data and seller disclosures. No interviews or surveys were used for this edition of the report.
Brand sellers and new markets carry growth to 2035
The market is projected to reach USD 4.22 billion by 2035, growing at a 15.00% CAGR from USD 1.20 billion in 2026. Trading cards will remain the largest category, while sneakers and fashion carry a growing share of the gain as authentication spreads. Asia Pacific will stay the largest region, and Latin America will grow fastest as social video shopping deepens in Brazil. Dedicated apps will keep the core collector audience, but social platforms with native bidding and brands joining through store integrations will widen the seller base.
Frequently Asked Questions
How big is the live auction commerce market?
Which region leads the market?
Which region grows fastest?
Which category leads live auction sales?
Why are sneakers growing quickly in live auctions?
What legal risks do live auction platforms face?
How does a live auction differ from a normal online auction?
Who are the main companies in the live auction commerce market?
Table of Content
Chapter 1 Market Segmentation
- 1.1 Segmentation Framework
- 1.1.1 Product and Service Classification
- 1.1.2 Application and End-Use Classification
- 1.1.3 Technology and Solution Classification
- 1.1.4 Customer and Distribution Channel Classification
- 1.1.5 Geographic Segmentation
- 1.1.6 Market Segment Definitions and Boundaries
- 1.2 By Category
- 1.2.1 Trading Cards
- 1.2.2 Collectibles
- 1.2.3 Fashion
- 1.2.4 Sneakers
- 1.3 By Platform
- 1.3.1 Dedicated Apps
- 1.3.2 Social Commerce
- 1.4 By Seller Type
- 1.4.1 Professional Resellers
- 1.4.2 Hobbyist Sellers
- 1.4.3 Brands and Retailers
Chapter 2 Introduction
- 2.1 Report Objectives and Scope
- 2.2 Product Definition and Industry Terminology
- 2.3 Market Inclusions and Exclusions
- 2.4 Research Process
- 2.4.1 Primary Research and Expert Interviews
- 2.4.2 Secondary Research and Source Review
- 2.4.3 Top-Down and Bottom-Up Estimation
- 2.4.4 Data Triangulation and Verification
- 2.5 Market Size Measurement Basis
- 2.5.1 2025: USD 1.04 billion → 2035: USD 4.22 billion
- 2.6 Historical and Forecast Reference Periods
- 2.6.1 Historical Period: 2018-2025
- 2.6.2 Base Year: 2025
- 2.6.3 Forecast Period: 2025-2035
- 2.7 Research Assumptions and Limitations
Chapter 3 Executive Summary
- 3.1 Market Snapshot and Key Findings
- 3.2 Base-Year Market Size, 2025
- 3.3 Forecast Market Size, 2035
- 3.4 Revenue and Volume Growth Outlook
- 3.5 Key Demand and Supply Indicators
- 3.6 Leading Market Segments
- 3.7 Fastest-Growing Market Opportunities
- 3.8 Regional Performance Highlights
- 3.9 Technology and Industry Transformation
- 3.10 Competitive Landscape Summary
- 3.11 Analyst View and Strategic Implications
Chapter 4 Global Live Auction Commerce Market Trends and Developments
- 4.1 Historical Industry Development, 2018-2025
- 4.2 Recent Market Trends and Developments
- 4.3 Demand and Customer Behavior Trends
- 4.4 Technology and Product Innovation
- 4.5 Artificial Intelligence, Automation and Digitalization
- 4.6 Local Manufacturing and Supply Chain Realignment
- 4.7 Industry Partnerships, Mergers and Acquisitions
- 4.8 Sustainability and Circular Economy Developments
- 4.9 Government and Private Sector Investment Trends
- 4.10 Emerging Business Models and Commercialization
- 4.11 Industry Developments and Announcements
Chapter 5 Global Live Auction Commerce Market Production, Supply and Demand Analysis
- 5.1 Demand Trend and Consumption Analysis, 2018-2025
- 5.2 Demand Forecast, 2025-2035
- 5.3 Production and Output Trend, 2018-2025
- 5.4 Production and Output Forecast, 2025-2035
- 5.5 Installed Capacity and Capacity Utilization
- 5.6 Company-Wise Production Plants and Statistics
- 5.6.1 Installed Production Capacity
- 5.6.2 Actual Production
- 5.6.3 Planned Capacity and Expansion Targets
- 5.7 Supply Chain Structure and Procurement Trends
- 5.8 Supply-Demand Gap and Bottlenecks
- 5.9 Import Dependence and Sourcing Structure
- 5.10 Contract Manufacturing and Outsourcing
- 5.11 Regional Supply and Demand Concentration
Chapter 6 Global Live Auction Commerce Market Pricing Analysis
- 6.1 Pricing Structure and Measurement
- 6.2 Historical Pricing Trends, 2018-2025
- 6.3 Pricing Outlook, 2025-2035
- 6.4 Average Selling Price and Unit Economics
- 6.5 Pricing by Product and Market Segment
- 6.6 Geographic Pricing Differences
- 6.7 Key Input, Energy, Labor and Logistics Costs
- 6.8 Contract Pricing and Purchasing Models
- 6.9 Pricing Sensitivity and Competitive Positioning
- 6.10 Price, Margin and Profitability Implications
Chapter 7 Global Live Auction Commerce Market Dynamics
- 7.1 Market Growth Drivers
- 7.1.1 Demand-Side Drivers
- 7.1.2 Technology and Innovation Drivers
- 7.1.3 Infrastructure and Investment Drivers
- 7.1.4 Regulatory and Policy Drivers
- 7.2 Market Restraints
- 7.2.1 Cost and Affordability Constraints
- 7.2.2 Technology and Adoption Barriers
- 7.2.3 Supply Chain and Operational Constraints
- 7.3 Market Challenges
- 7.3.1 Competitive Pressure and Margin Erosion
- 7.3.2 Skills, Infrastructure and Implementation Gaps
- 7.4 Emerging Market Opportunities
- 7.5 Market Dynamics Impact and Time-Horizon Assessment
Chapter 8 Global Live Auction Commerce Value Chain Analysis
- 8.1 Industry Value Chain Overview
- 8.2 Upstream Suppliers and Critical Inputs
- 8.3 Technology and Component Providers
- 8.4 Manufacturing or Service Delivery
- 8.5 Distribution, Channel Partners and Integrators
- 8.6 Downstream Applications and End Users
- 8.7 Value Addition and Profit Pools
- 8.8 Vertical Integration and Outsourcing
- 8.9 Supplier Concentration and Risk
- 8.10 Supply Chain Localization and Resilience
Chapter 9 Global Live Auction Commerce Market Regulations and Policies
- 9.1 Relevant Laws, Standards and Compliance Frameworks
- 9.2 Product, Service, Safety and Quality Requirements
- 9.3 Government Policies, Incentives and Subsidies
- 9.4 Imports, Exports and Trade Barriers
- 9.5 Public Procurement and Local Content Requirements
- 9.6 Environmental and Sustainability Compliance
- 9.7 Data Protection, AI and Cybersecurity Compliance
- 9.8 Upcoming Policy Changes and Market Implications
Chapter 10 Global Live Auction Commerce Market Hotspots and Opportunities
- 10.1 Market Opportunity Mapping and Growth Hotspots
- 10.2 High-Growth Applications and Customer Groups
- 10.3 Underserved Markets and White-Space Opportunities
- 10.4 Emerging Technology and Product Opportunities
- 10.5 New Capacity and Investment Hotspots
- 10.6 Market Entry and Expansion Opportunities
- 10.7 Distribution and Partnership Opportunities
- 10.8 Near-Term and Long-Term Commercial Potential
- 10.9 Opportunity Attractiveness and Execution Risks
Chapter 11 Global Live Auction Commerce Market Outlook, 2025-2035
- 11.1 Market Size and Analysis
- 11.1.1 Revenue (Market Measurement: 2025: USD 1.04 billion → 2035: USD 4.22 billion)
- 11.1.2 Market Volume and Quantity Sold
- 11.1.3 Historical Market Size, 2018-2025
- 11.1.4 Base-Year Market Size, 2025
- 11.2 Market Forecast, 2025-2035
- 11.2.1 Revenue Forecast to 2035
- 11.2.2 Volume Forecast to 2035
- 11.2.3 CAGR and Year-on-Year Growth
- 11.2.4 Incremental Revenue Opportunity
- 11.3 Forecast Assumptions and Scenario Analysis
- 11.3.1 Base-Case Forecast
- 11.3.2 Optimistic and Conservative Scenarios
- 11.3.3 Technology, Pricing and Policy Sensitivities
- 11.4 Market Attractiveness and Growth Outlook
Chapter 12 Global Live Auction Commerce Market Segmentation and Outlook
- 12.1 Segmentation Summary and Market Shares, 2025
- 12.2 Largest and Fastest-Growing Segments
- 12.3 By Category - Market Size and Forecast, 2025-2035
- 12.3.1 Segment Definition and Scope
- 12.3.2 Historical Market Size, 2018-2025
- 12.3.3 Revenue Forecast, 2025-2035
- 12.3.4 Volume Forecast, 2025-2035
- 12.3.5 Base-Year Market Share, 2025
- 12.3.6 Segment CAGR and Growth Drivers
- 12.3.7 Subsegment Market Size and Forecast
- 12.3.7.1 Trading Cards
- 12.3.7.2 Collectibles
- 12.3.7.3 Fashion
- 12.3.7.4 Sneakers
- 12.3.8 Subsegment Pricing and Adoption Trends
- 12.3.9 Leading Suppliers and Competition
- 12.3.10 Regional Demand and Opportunities
- 12.4 By Platform - Market Size and Forecast, 2025-2035
- 12.4.1 Segment Definition and Scope
- 12.4.2 Historical Market Size, 2018-2025
- 12.4.3 Revenue Forecast, 2025-2035
- 12.4.4 Volume Forecast, 2025-2035
- 12.4.5 Base-Year Market Share, 2025
- 12.4.6 Segment CAGR and Growth Drivers
- 12.4.7 Subsegment Market Size and Forecast
- 12.4.7.1 Dedicated Apps
- 12.4.7.2 Social Commerce
- 12.4.8 Subsegment Pricing and Adoption Trends
- 12.4.9 Leading Suppliers and Competition
- 12.4.10 Regional Demand and Opportunities
- 12.5 By Seller Type - Market Size and Forecast, 2025-2035
- 12.5.1 Segment Definition and Scope
- 12.5.2 Historical Market Size, 2018-2025
- 12.5.3 Revenue Forecast, 2025-2035
- 12.5.4 Volume Forecast, 2025-2035
- 12.5.5 Base-Year Market Share, 2025
- 12.5.6 Segment CAGR and Growth Drivers
- 12.5.7 Subsegment Market Size and Forecast
- 12.5.7.1 Professional Resellers
- 12.5.7.2 Hobbyist Sellers
- 12.5.7.3 Brands and Retailers
- 12.5.8 Subsegment Pricing and Adoption Trends
- 12.5.9 Leading Suppliers and Competition
- 12.5.10 Regional Demand and Opportunities
- 12.6 Segment Growth Comparison
- 12.7 Segment Attractiveness and Priority Matrix
Chapter 13 Global Live Auction Commerce Geographic Market Outlook, 2025-2035
- 13.1 Regional Market Size and Share, 2025
- 13.2 Regional Market Forecast, 2025-2035
- 13.3 Regional Pricing, Production and Demand Differences
- 13.4 North America
- 13.4.1 United States
- 13.4.2 Canada
- 13.4.3 Mexico
- 13.5 Europe
- 13.5.1 Germany
- 13.5.2 France
- 13.5.3 Italy
- 13.5.4 United Kingdom
- 13.5.5 Spain
- 13.5.6 Poland
- 13.5.7 Russia
- 13.5.8 Netherlands
- 13.5.9 Belgium
- 13.5.10 Sweden
- 13.5.11 Denmark
- 13.5.12 Norway
- 13.5.13 Rest of Europe
- 13.6 Asia Pacific
- 13.6.1 China
- 13.6.2 India
- 13.6.3 Japan
- 13.6.4 South Korea
- 13.6.5 Thailand
- 13.6.6 Indonesia
- 13.6.7 Vietnam
- 13.6.8 Malaysia
- 13.6.9 Australia
- 13.6.10 Rest of Asia Pacific
- 13.7 Latin America
- 13.7.1 Brazil
- 13.7.2 Argentina
- 13.7.3 Colombia
- 13.7.4 Chile
- 13.7.5 Rest of Latin America
- 13.8 Middle East
- 13.8.1 Saudi Arabia
- 13.8.2 United Arab Emirates
- 13.8.3 Turkey
- 13.8.4 Israel
- 13.8.5 Iran
- 13.8.6 Rest of the Middle East
- 13.9 Africa
- 13.9.1 South Africa
- 13.9.2 Egypt
- 13.9.3 Nigeria
- 13.9.4 Morocco
- 13.9.5 Rest of Africa
- 13.10 Regional Investment, Policy and Supply Chain Differences
- 13.11 Regional Competitive Landscape
- 13.12 Geographic Growth Hotspots
Chapter 14 Global Live Auction Commerce Technology, Innovation and Sustainability Outlook
- 14.1 Technology Landscape and Maturity
- 14.2 Product, Process and Service Innovation
- 14.3 AI, Automation and Digital Tools in the Industry
- 14.4 Technology Adoption and Performance Benchmarking
- 14.5 Innovation Pipeline and R&D Investment
- 14.6 Patent and Intellectual Property Trends
- 14.7 Energy Efficiency and Resource Management
- 14.8 Sustainability, Recycling and Circularity
- 14.9 Technology Roadmap, 2025-2035
- 14.10 Risks of Obsolescence and Technology Substitution
Chapter 15 Global Live Auction Commerce Market Key Strategic Imperatives
- 15.1 Growth and Market Entry Priorities
- 15.2 High-Return Products and Segments
- 15.3 Pricing, Profitability and Cost Optimization
- 15.4 Technology Investment and Product Differentiation
- 15.5 Supply Chain Localization and Resilience
- 15.6 Distribution and Customer Acquisition
- 15.7 Partnership, Acquisition and Capacity Strategy
- 15.8 Regional Expansion Priorities
- 15.9 Short-, Medium- and Long-Term Actions
Chapter 16 Competition Outlook
- 16.1 Industry Competition Characteristics
- 16.2 Market Structure and Concentration
- 16.3 Market Share and Competitive Positioning, 2025
- 16.4 Company-Wise Revenue and Product Benchmarking
- 16.5 Production and Service Capacity Benchmarking
- 16.6 Technology, Pricing and Differentiation
- 16.7 Regional Footprint and Distribution Strength
- 16.8 Mergers, Acquisitions and Strategic Alliances
- 16.9 New Entrants and Competitive Threats
- 16.10 Porter's Five Forces and Industry Attractiveness
- 16.11 Competitive Outlook, 2025-2035
Chapter 17 Company Profiles
- 17.1 Company Coverage and Selection Criteria
- 17.2 Whatnot
- 17.2.1 Business Description
- 17.2.2 Company Ownership and Geographic Presence
- 17.2.3 Product and Service Portfolio
- 17.2.4 Manufacturing and Operating Footprint
- 17.2.5 Production Capacity and Expansion Plans
- 17.2.6 Financial Performance and Investment
- 17.2.7 Market Share and Competitive Position
- 17.2.8 Technology and Innovation Capabilities
- 17.2.9 Strategic Alliances or Partnerships
- 17.2.10 Recent Developments
- 17.2.11 Growth Strategy and Outlook
- 17.3 eBay Live
- 17.4 TikTok Shop LIVE
- 17.5 Fanatics Live
- 17.6 StockX
- 17.7 Other Relevant Market Participants
Note: Every listed company is profiled on the structure shown under the first company. The company list is preliminary and may change based on research findings, market developments, data availability and client requirements.
Chapter 18 Disclaimer
- 18.1 Research and Forecast Disclaimer
- 18.2 Data Source and Estimation Limitations
Note: The depth of individual sections depends on data availability for this market. Volume, capacity, trade and other unit-based metrics are included where applicable.

