
Market Overview:
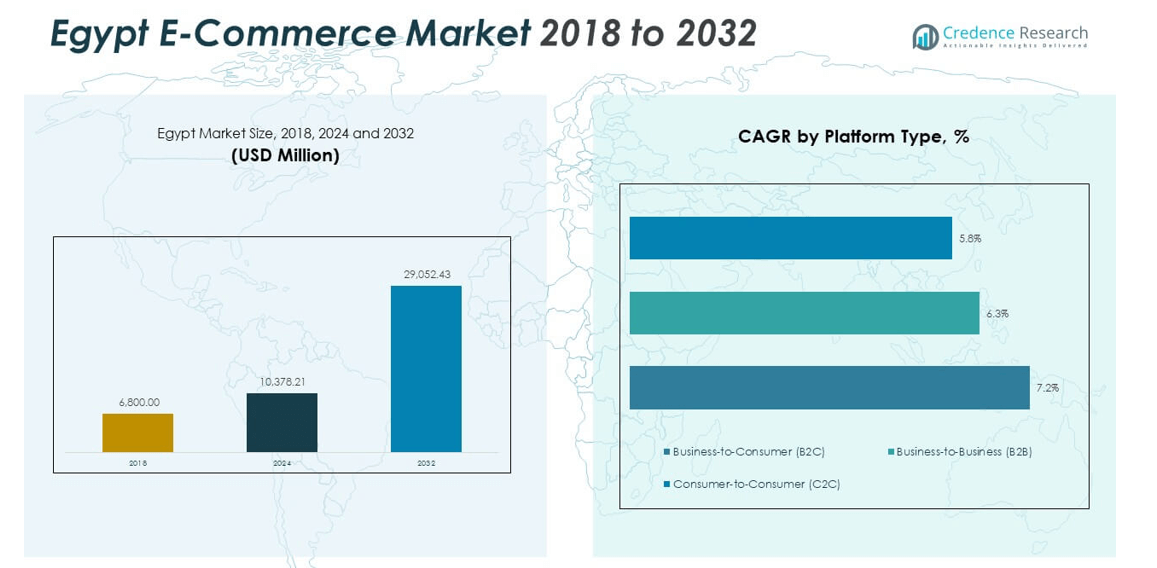
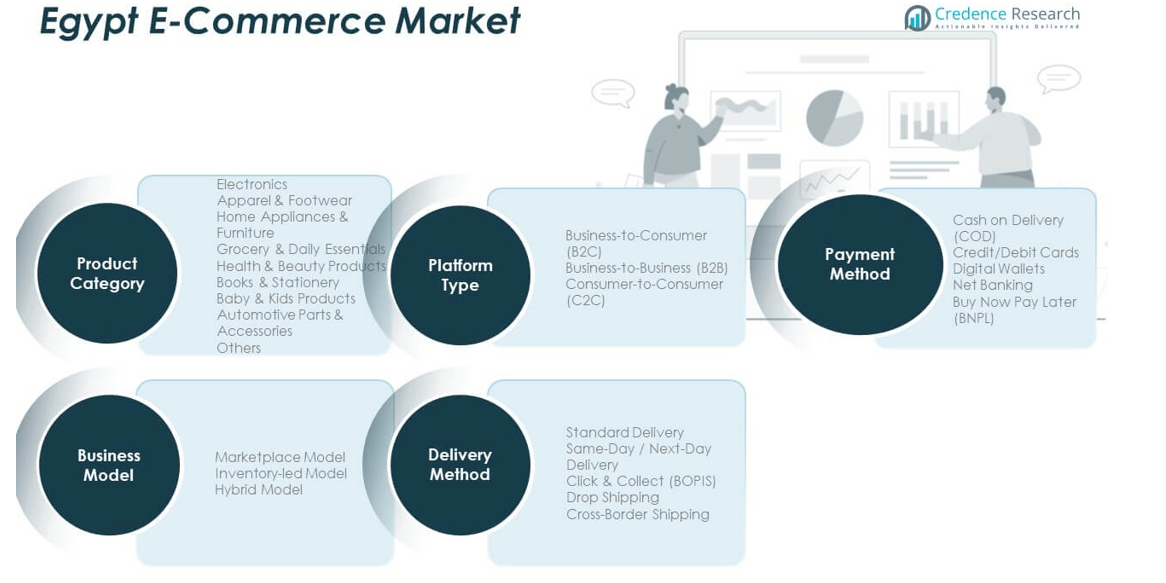
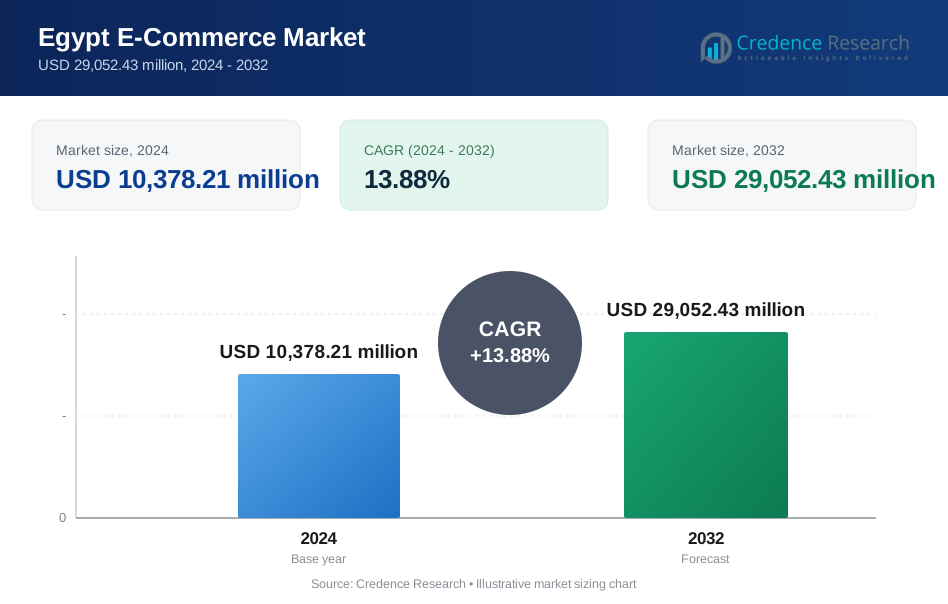
The Egypt E-Commerce Market size was valued at USD 6,800.00 million in 2018, reached USD 10,378.21 million in 2024, and is anticipated to reach USD 29,052.43 million by 2032, at a CAGR of 13.88% during the forecast period.
| REPORT ATTRIBUTE | DETAILS |
|---|---|
| Historical Period | 2020-2023 |
| Base Year | 2024 |
| Forecast Period | 2025-2032 |
| Egypt E-Commerce Market Size 2024 | USD 10,378.21 million |
| Egypt E-Commerce Market, CAGR | 13.88% |
| Egypt E-Commerce Market Size 2032 | USD 29,052.43 million |
Rising internet access, wider smartphone use, and secure payment options drive strong growth in the Egypt E-Commerce Market. Young consumers adopt online shopping for daily needs and lifestyle products. Banks and fintech firms expand digital payments, which speeds up online transactions. Logistics providers strengthen last-mile delivery to reduce delays. Retailers invest in omnichannel models to serve urban and semi-urban buyers. Global marketplaces expand their presence and increase category depth. Local sellers use social commerce to reach wider audiences.
Regional activity centers around Cairo, Giza, and Alexandria, which lead due to higher income levels and strong digital infrastructure. Emerging cities such as Mansoura and Tanta gain traction as logistics networks expand. Rural areas observe gradual adoption as mobile commerce access improves. Cross-border platforms capture interest due to broader product choices. Local marketplaces strengthen their reach through regional warehouses. These shifts create varied growth patterns across Egypt.
Market Insights:
- The Egypt E-Commerce Market grew from USD 6,800 million in 2018 to USD 11,672.94 million in 2024 and is projected to reach USD 29,052.43 million by 2032, reflecting a strong CAGR of 13.88% driven by wider digital adoption and expanding online consumption.
- Cairo and Giza hold 58% of the market due to dense urban populations, strong digital infrastructure, and high purchasing power. Alexandria and Canal Cities contribute 22%, supported by logistics connectivity and active online buyers. The Delta Region and Upper Egypt account for 20%, reflecting steady digital inclusion and rising mobile-first behavior.
- The fastest-growing region is the Delta Region and Upper Egypt, holding 20% share, driven by expanding delivery routes, wider smartphone penetration, and strong adoption of social-commerce-led buying.
- Business-to-Consumer (B2C) platforms form the largest segment in the chart, representing the highest share in platform usage through strong participation across retail categories.
- Business-to-Business (B2B) and Consumer-to-Consumer (C2C) segments together contribute the remaining platform-type distribution, reflecting increasing SME procurement and steady growth in peer-driven digital trade.
Market Drivers:
Expanding Digital Access And Strong Consumer Adoption Across Urban And Semi-Urban Groups
The Egypt E-Commerce Market advances due to wider internet access across major cities. Households purchase smartphones with better data plans that support online browsing. Brands use targeted advertising to reach younger groups that prefer digital shopping journeys. Logistics firms push faster delivery networks to cover dense neighborhoods. Payment service providers roll out secure gateways that improve user trust. Retailers introduce loyalty programs that promote repeat buying behavior. Social commerce accelerates growth through high engagement rates on major platforms. Product variety increases and attracts buyers searching for convenience. It benefits from steady transition toward digital-first choices.
- For instance, Vodafone Egypt serves approximately 53 million mobile subscribers, which strengthens digital access and supports higher online shopping activity across urban areas.
Rising Adoption Of Cashless Payments And Rapid Growth Of Local Fintech Platforms
Safer digital transactions strengthen customer confidence in the Egypt E-Commerce Market. Banks promote mobile wallets that simplify order payments for larger segments. Fintech firms integrate QR-based payment options across many retail categories. Merchants accept contactless transactions that reduce cart abandonment. Government pushes broader financial inclusion efforts that support online spending. Younger consumers pick wallet services for ease of refunds and faster checkout flow. Retailers add automated billing tools that minimize errors. Payment providers enhance fraud detection to protect high-volume transactions. It benefits from stronger reliability in digital settlement systems.
- For instance, Fawry processes more than 6 million transactions per day across its network of more than 400 thousand agents/points, reinforcing trust in digital payments nationwide.
Greater Retail Digitization And Strong Shift Toward Omnichannel Fulfillment Models
Large brands deploy unified sales platforms that boost the Egypt E-Commerce Market. Stores add click-and-collect services that simplify order journeys. Retail chains connect warehouse data with front-end systems for real-time inventory visibility. Consumers trust brands that offer smooth movement between online and offline touchpoints. Businesses analyze customer behavior to reduce stock gaps. Automated tools support accurate dispatch operations. User engagement rises when brands use data-led recommendations. Delivery firms partner with retailers to strengthen last-mile reliability. It gains momentum from the retail sector’s wider platform upgrades.
Growing Demand For Convenience-Focused Shopping Supported By Lifestyle Changes And Digital Media Influence
Shoppers use digital channels more due to tight schedules across major cities within the Egypt E-Commerce Market. Many households prefer home delivery for groceries and essentials. Influencer-led marketing drives interest in beauty, fashion, and home products. Media content shapes buying patterns among active online users. Retailers expand product categories to match rising lifestyle needs. Apps improve interface quality to shorten search times. Customer support teams use chat tools to assist high-volume queries. Promotions raise conversion during peak events. It gains traction from daily dependence on online platforms.
Market Trends:
Strong Expansion Of Mobile-First Shopping Behavior Across All Age Segments
Mobile engagement grows across the Egypt E-Commerce Market due to better device affordability. Users complete purchases through apps that offer shorter navigation. Retailers create mobile-optimized storefronts with clean layouts. Payment flows become smoother with one-tap settlement. Push notifications drive rapid response to flash deals. Influencers shape product preferences on social platforms. Younger buyers dominate app-based sessions during seasonal sales. Brands design vertical videos for quick product previews. It advances due to growth in mobile-centric habits.
- For instance, TikTok surpassed 1 billion global monthly active users, and Egypt ranks among its fastest-growing MENA markets, boosting mobile-driven discovery and purchase behavior.
Rise Of Cross-Border Marketplaces And Growing Interest In International Brands
Global platforms attract steady traffic within the Egypt E-Commerce Market. Consumers compare international and local products for quality assurance. Shoppers search for niche categories not supplied by local sellers. Global sellers invest in faster delivery routes to reduce waiting time. Buyers rely on transparent return policies for high-value imports. Fashion and electronics lead in cross-border demand. Product authenticity tools create higher confidence for premium goods. Currency-friendly payment options increase adoption. It gains visibility through rising interest in global selections.
- For instance, AliExpress serves millions of users globally and ships to Egypt through its extensive logistics network, supporting strong demand for cross-border fashion and electronics.
Rapid Growth Of Social Commerce Driven By High Engagement On Visual Platforms
Social platforms influence purchasing decisions in the Egypt E-Commerce Market. Short-form content highlights product features in relatable formats. Sellers promote curated bundles to attract impulse buyers. Live-stream selling gains attention from younger users. Engagement rises when brands use local influencers. Direct checkout tools cut time between discovery and purchase. Social ads target behavior patterns with strong accuracy. User reviews shape community trust. It strengthens due to the social layer’s growing impact on buying decisions.
Wider Use Of AI-Based Personalization Tools And Improved Customer Experience Systems
AI supports better recommendations within the Egypt E-Commerce Market. Systems track browsing patterns to refine product visibility. Chatbots address common queries within seconds. Brands use predictive tools to plan inventory for fast-moving goods. Voice search becomes more common in mobile apps. Recommendation engines increase repeat purchases among loyal users. Personal dashboards highlight deals based on shopping history. Platforms reduce friction through automated support flows. It benefits from smarter digital interaction systems.
Market Challenges Analysis:
Logistics Fragmentation And Delivery Pressure Across Dense And Expanding City Networks
Delivery complexity shapes the Egypt E-Commerce Market and creates operational stress for many sellers. Urban congestion affects timing for fragile and bulky shipments. Couriers handle rising order volumes during peak seasons with limited route flexibility. Rural delivery still lacks unified coverage, which slows expansion. High fuel costs reduce margin levels for small businesses. Storage gaps delay order consolidation for multi-item shipments. Return handling increases workload for warehouses. Miscommunication between courier teams and buyers triggers repeated attempts. It faces persistent friction from uneven logistics maturity.
Limited Financial Inclusion, Fraud Risks, And Ongoing Trust Concerns Among New Digital Users
Financial access gaps challenge many potential shoppers within the Egypt E-Commerce Market. Cash-on-delivery dependence creates verification issues for sellers. Fraudulent claims increase processing time for service teams. Inconsistent digital literacy reduces user comfort with payment apps. Data security concerns impact checkout rates across certain groups. Merchants invest in customer education to reduce hesitation. New users seek visible safety markers in app interfaces. Platforms work on stronger verification tools to protect high-value categories. It encounters recurring trust barriers during user onboarding.
Market Opportunities:
Expansion Of Digital Payments, Fintech Adoption, And Broader Financial Inclusion Potential
Wider financial access unlocks stronger prospects across the Egypt E-Commerce Market. Mobile wallets help onboard shoppers that avoid card-based payments. Banks introduce simple onboarding steps for new digital customers. QR acceptance widens across groceries, services, and lifestyle categories. Payment providers enable low-cost settlement for small merchants. Fintech apps raise digital literacy through guided flows. Businesses tap underserved regions with secure payment tools. It gains advantage from higher adoption of digital finance.
Growth Potential In Tier-2 Cities, Rural Commerce, And Local Seller Enablement Programs
Untapped regions generate long-term expansion for the Egypt E-Commerce Market. Platforms invest in regional warehouses to shorten delivery time. Local sellers use online storefronts to reach broader audiences. Training programs help micro-businesses upload and manage inventory. Logistics partners extend delivery zones through new route networks. Government efforts support digital inclusion at community level. Consumers trust platforms that guarantee easy returns. It grows due to wider participation from emerging regions.
Market Segmentation Analysis:
By Product Category
The Egypt E-Commerce Market expands across major categories that meet rising consumer demand. Electronics lead due to strong interest in smartphones, laptops, and accessories. Apparel and footwear attract young shoppers that prefer trend-driven and value-focused choices. Home appliances and furniture grow through wider access to large-format items and efficient delivery networks. Grocery and daily essentials gain traction from steady demand for quick-replenishment products. Health and beauty products rise due to strong digital marketing and influencer-driven visibility. Consumers shift toward trusted platforms that offer reliable returns. It gains strength through broad category diversification.
- For instance, Samsung shipped approximately 6 millionsmartphones globally in 2023, driving high online demand for electronics across major e-commerce channels. It gains strength through broad category diversification (e.g., TVs, home appliances, etc.).
By Platform Type
Platform adoption shifts based on buyer needs across the Egypt E-Commerce Market. Business-to-consumer platforms attract higher order volumes from retail categories. Business-to-business platforms support bulk procurement for SMEs and distributors. Consumer-to-consumer platforms grow from peer-led transactions across fashion and household items. Platforms invest in secure payment systems to support user confidence. Category depth improves buyer retention on major marketplaces. Traffic rises during promotional periods and national shopping events. It benefits from stronger digital participation across segments.
By Payment Method
Payment behavior shapes overall adoption trends within the Egypt E-Commerce Market. Cash on delivery remains common among first-time and cautious shoppers. Credit and debit cards serve urban users with established banking access. Digital wallets grow due to simple onboarding and faster checkout journeys. Net banking supports structured payments for higher-value orders. Buy now pay later attracts younger shoppers that seek flexible settlement cycles. Platforms invest in fraud prevention tools to improve safety. It gains momentum from improved payment convenience.
By Delivery Method / Distribution Channel
Delivery preferences guide fulfillment priorities for the Egypt E-Commerce Market. Standard delivery handles routine orders with stable timelines. Same-day and next-day delivery attract buyers who require speed for essential items. Click and collect offers flexible pick-up options for urban shoppers. Drop shipping supports wide product listings without heavy inventory requirements. Cross-border shipping extends access to global brands with structured logistics. Fulfillment hubs enhance coverage for regional delivery zones. It improves service quality through better route optimization.
Segmentation:
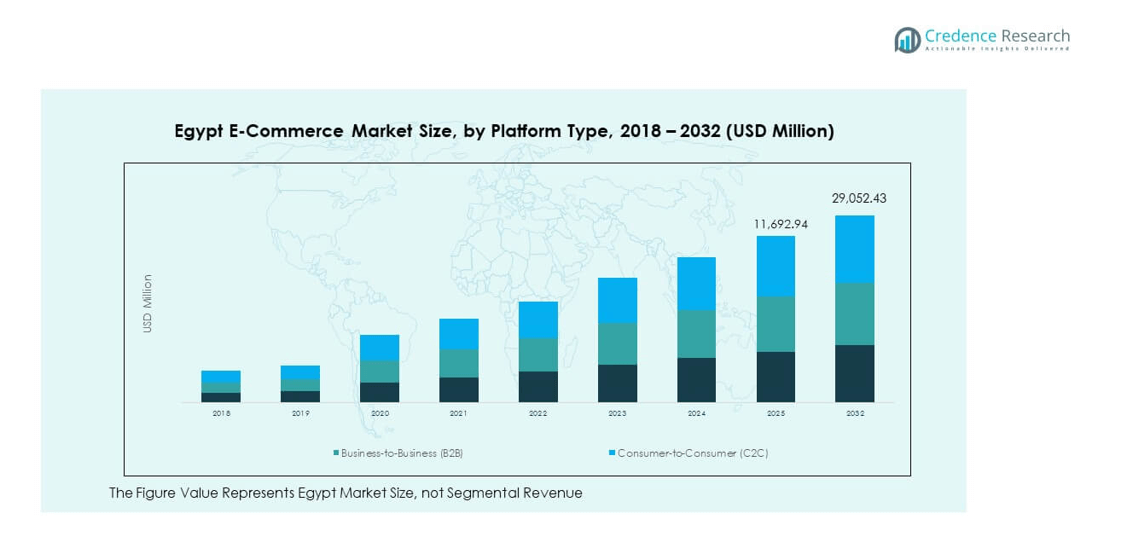
By Product Category
- Electronics
- Apparel & Footwear
- Home Appliances & Furniture
- Grocery & Daily Essentials
- Health & Beauty Products
By Platform Type
- Business-to-Consumer (B2C)
- Business-to-Business (B2B)
- Consumer-to-Consumer (C2C)
By Payment Method
- Cash on Delivery (COD)
- Credit/Debit Cards
- Digital Wallets
- Net Banking
- Buy Now Pay Later (BNPL)
By Business Model
- Marketplace Model
- Inventory-led Model
- Hybrid Model
By Delivery Method / Distribution Channel
- Standard Delivery
- Same-Day / Next-Day Delivery
- Click & Collect (BOPIS)
- Drop Shipping
- Cross-Border Shipping
Regional Analysis:
Cairo and Giza
Cairo and Giza hold the largest share of the Egypt E-Commerce Market with nearly 58% of total activity. High internet penetration supports strong online buying behavior in these regions. Retailers invest in faster delivery networks that handle dense demand. Buyers rely on mobile apps to shop across electronics, fashion, and essentials. Local and international platforms base major warehouse operations in these cities. Payment adoption grows through banks and fintech firms offering secure digital tools. It strengthens its position through consistent digital spending.
Alexandria and Canal Cities
Alexandria and the Canal Cities account for nearly 22% of the market share and show steady expansion. Strong port connectivity supports faster movement of cross-border goods. Consumers adopt e-commerce platforms to access wider product selections. Retailers view these regions as high-potential zones for electronics and lifestyle categories. Logistics partners introduce regional hubs to improve delivery predictability. Buyers prefer mixed payment methods depending on order value and product type. It gains visibility through widening regional fulfillment capacity.
Delta Region and Upper Egypt
The Delta Region and Upper Egypt collectively contribute around 20% of the Egypt E-Commerce Market and reflect emerging growth. Mobile-first users drive strong activity in Tier-2 and Tier-3 cities. Platforms target these regions through localized campaigns and language-specific content. Delivery firms expand routes to shorten lead times for essentials, beauty, and home products. Cash-on-delivery remains common, though wallet adoption rises among younger customers. Merchants use social commerce tools to reach rural and semi-urban buyers. It gains traction as digital inclusion efforts expand each year.
Key Player Analysis:
- Amazon Egypt
- Jumia
- Elaraby Group
- Carrefour
- Hanimex
- Fawry
- Breadfast
- Chefaa
- elmenus
- Taager
- MaxAB
- Okhtein
- Yodawy
- Manzzeli
- Homzmart
Competitive Analysis:
The Egypt E-Commerce Market features strong competition driven by expanding digital adoption and rising consumer expectations. Global platforms and major regional players scale operations to secure higher traffic and stronger brand visibility. Local firms hold ground through faster delivery, localized catalogs, and high engagement on mobile channels. Payment service providers influence platform selection through secure and simple checkout tools. Retail chains integrate online and offline channels to build wider reach and stable customer retention. Logistics partners improve delivery accuracy to support large daily order volumes. It evolves through continuous upgrades in service quality, platform experience, and product variety.
Recent Developments:
- In September 2025, Amazon Egypt reinforced its commitment to Egypt's digital economy by announcing its second consecutive collaboration with Shark Tank Egypt. This strategic partnership aims to provide new pathways for small and medium-sized businesses and entrepreneurs to grow their businesses online by connecting visionary business leaders with Amazon's comprehensive resources, including its technology infrastructure, fulfillment network, and customer reach. Additionally, in October 2025, Amazon Egypt renewed its partnership with Valu, a leading fintech platform, to expand seamless financing solutions for customers. This collaboration builds on Amazon's previous acquisition of a 3.95% direct stake in Valu in June 2025 at EGP 6.041 per share, signaling deep integration into Egypt's financial ecosystem. The renewed partnership aims to provide greater financial flexibility, easier access to a broader variety of products, and personalized savings for a larger number of consumers through effortless checkout processes.
- In August 2025, Breadfast secured a significant $10 million investment from the European Bank for Reconstruction and Development (EBRD) as part of its Series B2 funding round, led by Novastar Ventures. This strategic injection brought Breadfast's valuation to approximately $382.3 million, demonstrating strong institutional confidence in the startup. The funding is aimed at accelerating Breadfast's expansion across Egypt by increasing fulfillment centers in current strongholds—Cairo, Giza, Alexandria, and Mansoura—while entering new cities to broaden its national footprint. The company plans to leverage the capital to improve its proprietary technology and expand private-label products to boost margins and maintain price competitiveness. Swedish investment firm Vostok New Ventures (VNV) reported that its 7.9% stake in Breadfast nearly doubled to $30.2 million since its initial 2021 investment, exemplifying investor confidence in Breadfast's robust growth trajectory as a fully integrated quick-commerce platform delivering over 6,000 products within 60 minutes.
- In October 2024, Jumia announced plans to establish new integrated warehouses in Egypt as part of its broader continental expansion strategy. The Egyptian facility spans approximately 27,000 square meters and was anticipated to reach full operational capacity by January 2025. This expansion is strategically positioned to facilitate penetration into inland areas, enhance e-commerce development, improve cost efficiency, and support Jumia's ongoing growth across the African continent. Earlier, in September 2024, Jumia Egypt partnered with Forsa, a subsidiary of Drive Financial under the Ghabbour Auto Group, to offer flexible installment payment options. Through this agreement, Jumia customers can purchase various products—including electronics, home appliances, fashion items, beauty products, and groceries—while benefiting from convenient installment services, allowing customers to repay purchases over time rather than upfront.
Report Coverage:
The research report offers an in-depth analysis based on Product Category, Platform Type, Payment Method, Business Model, and Delivery Method. It details leading market players, providing an overview of their business, product offerings, investments, revenue streams, and key applications. Additionally, the report includes insights into the competitive environment, SWOT analysis, current market trends, as well as the primary drivers and constraints. Furthermore, it discusses various factors that have driven market expansion in recent years. The report also explores market dynamics, regulatory scenarios, and technological advancements that are shaping the industry. It assesses the impact of external factors and global economic changes on market growth. Lastly, it provides strategic recommendations for new entrants and established companies to navigate the complexities of the market.
Future Outlook:
- Online demand in the Egypt E-Commerce Market will expand through stronger mobile adoption and digital behavior shifts.
- Payment diversity will grow with higher wallet usage and wider acceptance of flexible methods.
- Logistics networks will improve through new hubs and advanced delivery optimization tools.
- B2C platforms will gain deeper penetration across emerging cities with regional fulfillment support.
- B2B digital ordering will rise as SMEs adopt streamlined procurement systems.
- Social commerce will influence product discovery and shape brand engagement trends.
- Cross-border ordering will accelerate due to wider access to global categories.
- Omnichannel retailing will strengthen through unified inventory and consistent service models.
- AI-driven tools will refine personalization and efficient customer interaction flows.
- Market competition will intensify through platform expansion, local partnerships, and service innovation.
Request a Free Sample
Fill in your details and we'll send you a free sample report.
- Sample data tables & charts
- Research methodology
Need a Custom Version of This Report?
Tailor the scope, geography, or segments to your exact requirements.
- Custom geography or segment scope
- Direct access to our analyst team
Frequently Asked Questions
What is the current size of the Egypt e-commerce market?
At what Compound Annual Growth Rate is the Egypt E-Commerce Market projected to grow between 2024 and 2032?
What are the key drivers of growth in the Egypt e-commerce market?
Which regions in Egypt are leading the e-commerce market?
Is e-commerce growth expanding to other areas beyond Cairo and Alexandria?
Table of Content
Chapter 1. Report Introduction
- 1.1 Report Description & Purpose
- 1.1.1 Report Title & Market Definition
- 1.1.2 Unique Selling Propositions (USP) & Key Differentiators
- 1.1.3 Value Proposition for Stakeholders
- 1.2 Research Objectives
- 1.2.1 Market Sizing Objectives (Volume & Revenue)
- 1.2.2 Segmentation Objectives
- 1.2.3 Competitive Intelligence Objectives
- 1.2.4 Forecast & Scenario Objectives
- 1.3 Report Scope
- 1.3.1 Egypt E-Commerce Scope – Types & Subtypes Covered
- 1.3.2 Geographic Scope – Regions & Countries Covered
- 1.3.3 Historical Period, Base Year & Forecast Period (2024; forecast to 2032)
- 1.3.4 Inclusions & Exclusions
- 1.4 HS Code & Classification Framework
- 1.5 Currency, Units & Pricing Basis
- 1.6 Target Stakeholders
- 1.7 Limitations & Assumptions
Chapter 2. Executive Summary
- 2.1 Global Egypt E-Commerce Market Snapshot
- 2.1.1 Market Size – Historical (2024) & Forecast (2024-2032) (2024: USD 10,378.21 million → 2032: USD 29,052.43 million)
- 2.1.2 Volume & Revenue – Global Totals
- 2.1.3 Key Market Highlights – Top Five Facts
- 2.2 Egypt E-Commerce Market Segmentation Snapshot
- 2.2.1 Market Split by Region – 2024 vs. 2032
- 2.3 Competitive Snapshot
- 2.3.1 Top 10 Players by Revenue Share – 2024
- 2.3.2 Top 10 Players by Volume Share – 2024
- 2.3.3 Recent Strategic Developments (18-Month Summary)
- 2.4 Key Investment Highlights & Strategic Conclusions
Chapter 3. Egypt E-Commerce Market Dynamics & Industry Analysis
- 3.1 Market Overview & Context
- 3.1.1 Egypt E-Commerce Market Position in the Broader Automotive Value Chain
- 3.1.2 OEM vs. Replacement Market Dynamics
- 3.1.3 Market Maturity & Development Stage by Region
- 3.2 Egypt E-Commerce Market Drivers
- 3.3 Egypt E-Commerce Market Restraints & Challenges
- 3.4 Egypt E-Commerce Market Opportunities
- 3.5 Porter's Five Forces Analysis
- 3.5.1 Threat of New Entrants
- 3.5.2 Bargaining Power of Suppliers
- 3.5.3 Bargaining Power of Buyers
- 3.5.4 Threat of Substitutes
- 3.5.5 Competitive Rivalry – Intensity Assessment
- 3.6 Egypt E-Commerce Value Chain Analysis
- 3.6.1 Upstream – Raw Material/Input Suppliers
- 3.6.1.1 Raw Material/Input 1
- 3.6.1.2 Raw Material/Input 2
- 3.6.1.3 Raw Material/Input 3
- 3.6.2 Midstream – Production/Manufacturing/Service Delivery
- 3.6.2.1 Production/Process Overview
- 3.6.2.2 Key Facility Locations & Capacity by Manufacturer
- 3.6.3 Downstream – Distribution & End Consumer
- 3.6.3.1 Primary Channel – B2B/OEM
- 3.6.3.2 Secondary Channels – Dealer, Retail, Online, Direct
- 3.6.4 Value Chain Profitability Analysis
- 3.6.1 Upstream – Raw Material/Input Suppliers
- 3.7 PESTEL Analysis
- 3.7.1 Political Factors
- 3.7.2 Economic Factors
- 3.7.3 Social Factors
- 3.7.4 Technological Factors
- 3.7.5 Environmental Factors
- 3.7.6 Legal Factors
- 3.8 Egypt E-Commerce Supply Chain Analysis
- 3.8.1 Raw Material/Input Supply Risk Assessment
- 3.8.2 Manufacturing Concentration Risk (Geographic Exposure)
- 3.8.3 Trade Disruption Impact Analysis
- 3.9 Regulatory & Policy Landscape
Note: The regulatory and policy landscape section covers regulations based on their applicability to the market, Egypt E-Commerce category, geography, and scope of the study. Only regulatory frameworks with a material impact on operations, compliance, trade, sustainability, or market access are analyzed in detail.
Chapter 4. Key Investment Pockets & Opportunity Analysis
- 4.1 Egypt E-Commerce Market Attractiveness Analysis
- 4.1.1 By Region – Investment Attractiveness Matrix (Volume × CAGR)
- 4.2 Absolute Revenue Growth Opportunity
- 4.2.1 By Region – Absolute USD Growth Through 2032
- 4.3 Incremental Volume Opportunity
- 4.3.1 By Region – Incremental Volume Through 2032
- 4.3.2 Segment – Incremental Volume
- 4.4 Emerging Submarket Opportunity Deep Dive (Subject to Applicability)
- 4.5 Emerging Market Opportunity Scorecards
- 4.5.1 United States
- 4.5.2 Europe
- 4.5.3 Asia
- 4.5.4 Middle East & Africa
Note: Emerging Market Opportunity Scorecards will be included based on relevance and strategic importance. Regions listed are indicative and may vary depending on data availability and market dynamics.
Chapter 5. Egypt E-Commerce Import-Export Analysis & Trade Flows
- 5.1 Global Trade Overview
- 5.1.1 Global Export Value by Country (2024)
- 5.1.2 Global Export Volume by Country (2024)
- 5.1.3 Global Import Value by Country (2024)
- 5.1.4 Global Import Volume by Country (2024)
- 5.1.5 Net Trade Balance by Country (2024)
- 5.2 Export Analysis – Segment
- 5.2.1 Type 1 (HS Code)
- 5.2.2 Type 2 (HS Code)
- 5.2.3 Type 3 (HS Code)
- 5.2.4 Type 4 (HS Code)
- 5.2.5 Type 5 (HS Code)
- 5.3 Import Analysis – Segment
- 5.3.1 Type 1 (HS Code)
- 5.3.2 Type 2 (HS Code)
- 5.3.3 Type 3 (HS Code)
- 5.3.4 Type 4 (HS Code)
- 5.3.5 Type 5 (HS Code)
- 5.4 Average Unit Trade Prices
- 5.4.1 Average Export Price – Segment & Country
- 5.4.2 Average Import Price – Segment & Source Country
- 5.4.3 Price Trends (2024)
- 5.5 Key Trade Route Analysis
- 5.5.1 Trade Route 1
- 5.5.2 Trade Route 2
- 5.5.3 Trade Route 3
- 5.5.4 Trade Route 4
- 5.5.5 Trade Route 5
- 5.6 Trade Policy Impact Assessment
- 5.6.1 US Anti-Dumping & Section 301 Tariffs
- 5.6.2 EU Customs Union Impact
- 5.6.3 Major Free Trade Agreements
- 5.6.4 USMCA Rules of Origin
Note: Trade policy analysis will be included only where relevant to the Egypt E-Commerce market.
Chapter 6. Competitive Landscape & Company Benchmarking
- 6.1 Egypt E-Commerce Market Concentration & Structure
- 6.1.1 Herfindahl-Hirschman Index (HHI) – vs. 2024
- 6.1.2 Tier 1, Tier 2 & Tier 3 Market Structure
- 6.1.3 Global, Regional & Local Player Dynamics
- 6.2 Egypt E-Commerce Market Share Analysis – 2024
- 6.2.1 Global Revenue Share by Company
- 6.2.2 Global Volume Share by Company
- 6.2.3 Regional Revenue Share
- 6.2.4 Market Share Evolution ( vs. 2024)
- 6.2.5 OEM Segment Share by Company
- 6.2.6 Replacement Segment Share by Company
- 6.3 Production/Delivery Capacity & Facility Analysis
- 6.3.1 Global Installed Capacity
- 6.3.2 Capacity Utilization Rates
- 6.3.3 Production/Output Volume
- 6.3.4 Facility Locations & Capacity Map
- 6.3.5 Planned Capacity Additions
- 6.4 Egypt E-Commerce Competitive Benchmarking Matrix
- 6.4.1 Revenue, Volume, CAGR & Profitability Comparison
- 6.4.2 Channel Revenue Mix
- 6.4.3 Geographic Revenue Exposure
- 6.4.4 R&D Intensity
- 6.4.5 Sustainability Maturity
- 6.5 Strategic Developments in Egypt E-Commerce (Last 24 Months)
- 6.5.1 Mergers, Acquisitions & Divestments
- 6.5.2 New Egypt E-Commerce Launches
- 6.5.3 Facility Expansions
- 6.5.4 Strategic Alliances, Joint Ventures & Partnerships
- 6.5.5 Distribution Expansion & Market Entry
- 6.5.6 Sustainability & ESG Initiatives
- 6.6 Competitive Strategy Mapping
- 6.6.1 Leader, Challenger, Follower & Niche Classification
- 6.6.2 Pricing Strategy Comparison
- 6.6.3 Channel Strategy Matrix
Note: Strategic developments are included based on their materiality and the availability of reliable information.
Chapter 7. Global Egypt E-Commerce Market – By Distribution Channel
- 7.1 Segment Overview
- 7.1.1 Volume & Revenue Split by Channel (2024 & 2032)
- 7.1.2 Channel Mix Evolution (2024-2032)
Chapter 8. Regional Market Analysis – Global Overview
- 8.1 Global Regional Overview
- 8.1.1 Regional Volume Share
- 8.1.2 Regional Revenue Share
- 8.1.3 Regional Volume by Region
- 8.1.4 Regional Revenue by Region
- 8.1.5 Regional Forecast Through 2032
- 8.2 Cross-Regional Segment Analysis
- 8.2.1 By Distribution Channel
- 8.2.2 By Brand/Price Tier
Chapter 9. North America Egypt E-Commerce Market
- 9.1 United States
- 9.2 Canada
- 9.3 Mexico
Chapter 10. Europe Egypt E-Commerce Market
- 10.1 Germany
- 10.2 France
- 10.3 Italy
- 10.4 United Kingdom
- 10.5 Spain
- 10.6 Poland
- 10.7 Russia
- 10.8 Netherlands
- 10.9 Belgium
- 10.10 Sweden
- 10.11 Denmark
- 10.12 Norway
- 10.13 Rest of Europe
Chapter 11. Asia Pacific Egypt E-Commerce Market
- 11.1 China
- 11.2 India
- 11.3 Japan
- 11.4 South Korea
- 11.5 Thailand
- 11.6 Indonesia
- 11.7 Vietnam
- 11.8 Malaysia
- 11.9 Australia
- 11.10 Rest of Asia Pacific
Chapter 12. Latin America Egypt E-Commerce Market
- 12.1 Brazil
- 12.2 Argentina
- 12.3 Colombia
- 12.4 Chile
- 12.5 Rest of Latin America
Chapter 13. Middle East Egypt E-Commerce Market
- 13.1 Saudi Arabia
- 13.2 United Arab Emirates
- 13.3 Turkey
- 13.4 Israel
- 13.5 Iran
- 13.6 Rest of the Middle East
Chapter 14. Africa Egypt E-Commerce Market
- 14.1 South Africa
- 14.2 Egypt
- 14.3 Nigeria
- 14.4 Morocco
- 14.5 Rest of Africa
Chapter 15. Egypt E-Commerce Company Profiles
- 15.1 [Company 01]
- 15.1.1 Company Overview
- 15.1.2 Key Management Personnel
- 15.1.3 Products & Services Portfolio
- 15.1.4 Financial Performance
- 15.1.5 Key Market Focus & Geographic Presence
- 15.1.6 Recent Developments & Strategic Initiatives
Note: The company profile list is preliminary and may change based on research findings, market developments, data availability, and client requirements.
Chapter 16. Appendices
- Appendix A – List of Abbreviations & Acronyms
- Appendix B – Industry Classification Code Reference – Full Series
- Appendix C – Production & Capacity Data Tables
- Appendix D – End-Use & Demand Base Tables
- Appendix E – Consumption & Replacement Rate Assumptions
- Appendix F – ASP Reference Tables
- Appendix G – Manufacturing & Facility Database
- Appendix H – Import-Export Data Tables
- Appendix I – Regulatory Summary Tables
- Appendix J – Primary Research Participant List (Anonymized)
- Appendix K – Primary Research Questionnaire Framework
- Appendix L – Data Sources & Bibliography
- Appendix M – Market Size Divergence & Source Comparison
Chapter 17. Research Methodology
- 17.1 Research Framework & Philosophy
- 17.2 Secondary Research – Sources, Hierarchy & Data Extraction
- 17.3 Data Modeling – Bottom-Up & Top-Down Market Sizing
- 17.4 Primary Research – Stakeholder Framework, LOI & Sample Sizes
- 17.5 Forecast Methodology – Regression, Scenario & Sensitivity Analysis
- 17.6 Quality Control – Four-Layer Validation Framework
- 17.7 Limitations & Standard Assumptions
- 17.8 Disclaimer
