
Market Overview
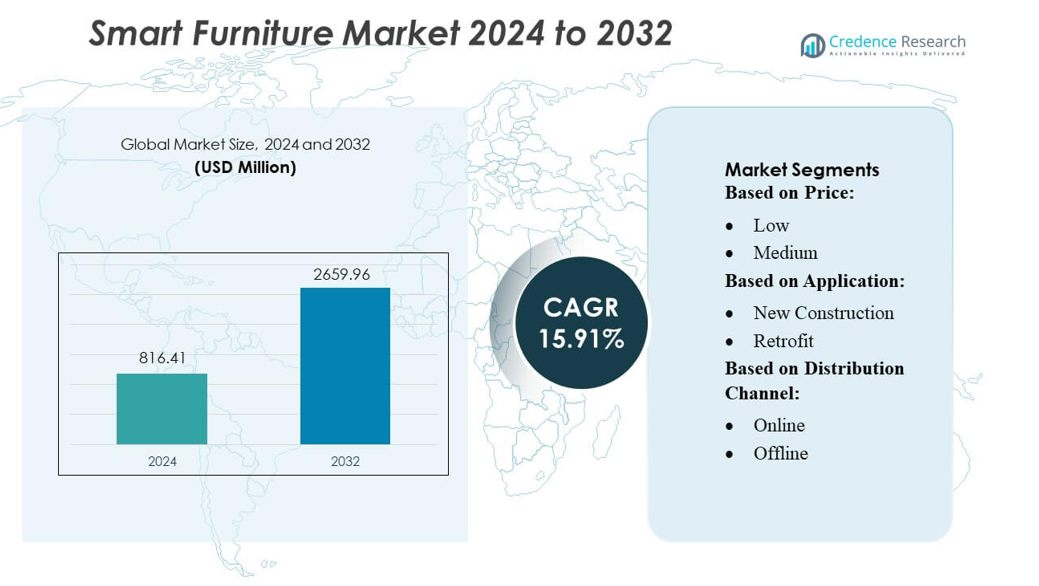
Smart Furniture Market size was valued USD 816.41 million in 2024 and is anticipated to reach USD 2659.96 million by 2032, at a CAGR of 15.91% during the forecast period.
| REPORT ATTRIBUTE | DETAILS |
|---|---|
| Historical Period | 2020-2023 |
| Base Year | 2024 |
| Forecast Period | 2025-2032 |
| Smart Furniture Market Size 2024 | USD 816.41 million |
| Smart Furniture Market, CAGR | 15.91% |
| Smart Furniture Market Size 2032 | USD 2659.96 million |
The Smart Furniture Market features strong competition from global technology and automation leaders, including Honeywell International Inc., Haier Group, Google LLC, Nice Polska Sp. z o.o., ABB, Johnson Controls, Apple Inc., Crestron Electronics, Inc., Gira, and Emerson Electric Co. These companies strengthen their presence by integrating IoT, AI, and sensor-based technologies into residential and commercial furniture solutions. Among all regions, North America leads the market with an exact market share of 32%, driven by high adoption of smart home ecosystems, advanced workspace automation, and strong consumer demand for connected and ergonomic furniture innovations.
Market Insights
- The Smart Furniture Market reached USD 816.41 million in 2024 and is expected to attain USD 2659.96 million by 2032, registering a CAGR of 15.91%, supported by increasing adoption of connected and automated furniture solutions.
- Rising demand for IoT-enabled, sensor-integrated, and ergonomically advanced furniture drives market expansion across residential and commercial segments, with smart office furniture emerging as the fastest-growing segment due to workspace digitalization.
- Technological innovation remains a core trend, as leading companies integrate AI-driven personalization, wireless charging, and voice-controlled features to enhance productivity and user comfort.
- High upfront costs, limited interoperability across platforms, and data security concerns continue to restrain wider adoption, particularly in price-sensitive markets.
- North America leads with 32% market share, while Europe and Asia-Pacific show strong growth momentum; the smart office segment holds a dominant share due to increasing hybrid work models and corporate investment in connected workspace optimization.
Market Segmentation Analysis:
By Price
The smart furniture market segmented by price reveals that the medium-priced segment dominates, accounting for the largest market share due to its balance between affordability and advanced functionality. Medium-range products appeal to a broad consumer base, including urban households and small offices seeking smart desks, adjustable beds, and modular seating with integrated IoT features. Market growth is driven by increasing awareness of ergonomic and connected home solutions, coupled with technological advancements such as app-controlled adjustments and energy-efficient sensors, making mid-tier smart furniture highly attractive to cost-conscious yet quality-focused buyers.
- For instance, Honeywell’s HPM Series PM2.5 sensor delivers a detection range up to 1,000 µg/m³. The sensor provides high accuracy of ±15% (for PM2.5 concentrations over 100 µg/m³) and is engineered for a long life of up to 10 years of continuous use.
By Application
In the application-based segmentation, new construction projects hold the dominant share, reflecting rising demand in residential and commercial developments incorporating smart furniture from the outset. Builders and interior designers prefer integrating connected desks, smart storage, and automated seating systems into modern layouts, enhancing convenience and space efficiency. Growth is fueled by increasing smart home adoption, regulatory incentives for energy-efficient building interiors, and rising consumer interest in multifunctional furniture. Retrofit applications are expanding but remain secondary due to the higher costs and installation complexity associated with upgrading existing furniture.
- For instance, Haier’s U+ Smart Life Platform-documented in Haier’s official ecosystem reports-supports integrations with more than 20,000 IoT device models and connects with over 1,000 certified service partners, enabling seamless incorporation of smart furniture into new construction environments.
By Distribution Channel
Within the distribution channel segment, offline retail maintains dominance, driven by the tactile nature of furniture purchases where consumers prefer in-person assessment for comfort, build quality, and functionality. Showrooms and specialty stores provide experiential demonstrations of IoT-enabled desks, smart beds, and seating solutions, reinforcing buyer confidence. Market drivers include the expansion of experiential retail outlets, brand-focused marketing strategies, and professional guidance on furniture integration. Online sales are growing rapidly due to convenience and direct-to-consumer models, but offline channels continue to lead due to high-value purchase behavior and hands-on product evaluation.
Key Growth Drivers
Rising Adoption of Smart Homes and IoT Integration
The increasing integration of IoT devices and smart home ecosystems drives demand for connected furniture solutions. Consumers seek furniture that enhances convenience, energy efficiency, and home automation, such as app-controlled desks, smart beds, and modular storage systems. Businesses are also adopting intelligent furniture to optimize workspace ergonomics and productivity. Growth is supported by technological advancements in sensors, AI-based adjustments, and voice-controlled interfaces, which enable seamless interaction and increased user satisfaction, making smart furniture an essential component of modern residential and commercial spaces. For instance, Google Home’s platform now supports over 50,000 devices from more than 10,000 different brands and integrates with a global network of smart-home products via its Cloud-to-Cloud and Matter infrastructures, enabling manufacturers to embed desk-mounted sensors, automated storage systems, or voice-controlled lighting into smart furniture.Growing Focus on Ergonomics and Wellness
Rising awareness of health and wellness is influencing furniture design and consumer preferences. Smart furniture with ergonomic features, such as posture-correcting chairs, height-adjustable desks, and sleep-monitoring beds, addresses physical well-being in homes and offices. The market benefits from increased sedentary lifestyle concerns, corporate wellness initiatives, and consumer willingness to invest in comfort-enhancing technology. Continuous innovation in ergonomics-driven designs and integrated monitoring systems ensures that smart furniture not only improves lifestyle quality but also encourages long-term adoption in both residential and professional settings. For instance, ABB enhances ergonomics-focused environments through its ABB i-bus® KNX platform, which integrates certified high-frequency (HF) presence detectors capable of detecting micro-movements (like breathing) at distances up to approximately 6 to 8 meters.Technological Advancements and Product Innovation
Rapid innovations in AI, robotics, and sensor technologies are expanding the capabilities of smart furniture. Companies are introducing features like automated adjustments, IoT-enabled storage solutions, and multifunctional modular furniture that adapts to user behavior. Continuous research and development reduce manufacturing costs while increasing functionality, making products more accessible to a wider audience. These advancements also support personalized experiences, energy efficiency, and seamless integration with home automation systems, strengthening market growth and establishing smart furniture as a critical element of future-ready residential and commercial interiors.Key Trends & Opportunities
Customization and Modular Designs
Consumers increasingly demand customizable smart furniture to suit individual aesthetics, space requirements, and functional needs. Modular systems and interchangeable components allow for flexibility in home and office setups, creating opportunities for brands to offer tailored solutions. Integration of smart technology into modular furniture enables adaptive use, enhancing convenience and space utilization. Rising interest in personalized design combined with IoT-enabled automation presents opportunities for market players to differentiate their offerings and expand into premium and mid-tier segments. For instance, Johnson Controls supports modular interior ecosystems through its OpenBlue suite, which connects smart furniture to building automation networks using more than 2,000 interoperable APIs.Expansion of Online and Omnichannel Retail
E-commerce and omnichannel distribution provide significant opportunities for smart furniture manufacturers. Online platforms allow consumers to explore a wide range of designs, compare features, and make informed purchases without geographical constraints. Brands leveraging virtual showrooms, AR-enabled previews, and direct-to-consumer models can enhance customer engagement and reduce dependency on traditional retail channels. Growth in digital adoption and increased comfort with high-value online purchases further positions online sales as a key opportunity to expand market reach and drive revenue growth. For instance, Apple’s ARKit, available on more than 1 billion active devices, enables highly accurate product visualization, allowing shoppers to preview furniture scale and placement at home.Integration with Sustainability and Eco-Friendly Materials
The shift toward sustainable living presents an opportunity to develop eco-friendly smart furniture. Manufacturers are increasingly using recycled materials, energy-efficient components, and low-impact production techniques. Products combining smart technology with sustainable practices appeal to environmentally conscious consumers and corporate clients, driving differentiation in a competitive market. This trend allows companies to align with global sustainability goals, enhance brand image, and tap into a growing segment seeking innovative yet responsible furniture solutions.Key Challenges
High Product Costs and Affordability Barriers
Smart furniture often commands premium pricing due to embedded technology, advanced materials, and research-intensive design. High costs can limit adoption among price-sensitive consumers, particularly in emerging markets. This affordability barrier may slow market penetration despite growing interest in connected and ergonomic solutions. Companies face the challenge of balancing innovation with cost-effective production while ensuring sufficient features and quality to meet consumer expectations, requiring strategic pricing and scalable manufacturing processes to broaden market accessibility.Technological Complexity and Maintenance Issues
Integration of sensors, AI, and IoT components increases product complexity, potentially leading to usability challenges, technical glitches, and higher maintenance requirements. Consumers may encounter difficulties in installation, connectivity, or software updates, affecting user experience and brand perception. Additionally, after-sales support and service infrastructure are critical to ensuring long-term functionality. Addressing these challenges requires robust design, intuitive interfaces, and reliable customer support systems to maintain trust, reduce friction, and foster sustained adoption in both residential and commercial segments.Regional Analysis
North America
North America holds a leading position in the smart furniture market, accounting for approximately 32% of the global share. Growth is driven by high adoption of IoT-enabled furniture, integration with smart home and office systems, and a strong preference for ergonomic designs. The U.S. dominates, supported by advanced technology infrastructure and rising disposable income. For instance, Steelcase reported a 15% increase in smart desk installations across corporate offices in 2024. Canada also shows growing demand for connected home furniture. The region benefits from a combination of corporate investments, consumer awareness, and innovation from established players like Herman Miller.
Europe
Europe contributes roughly 28% of the global smart furniture market, led by Germany, the U.K., and France. The region emphasizes sustainability, smart workspace solutions, and technologically advanced furniture designs. Corporates and co-working spaces are increasingly investing in sensor-integrated desks and chairs to enhance productivity and well-being. For instance, Sedus Stoll GmbH deployed smart desks capable of posture tracking across 120 European offices in 2024. Strong regulatory support for energy-efficient and ergonomic office infrastructure, combined with growing home automation trends, underpins market expansion. Continuous innovation in connected furniture and rising digital integration in residential and commercial spaces maintain Europe’s strong market presence.
Asia-Pacific
Asia-Pacific accounts for approximately 25% of the global smart furniture market, driven by rapid urbanization, rising disposable income, and increasing IoT adoption. China, Japan, and India are key markets, with growing demand for multifunctional, sensor-enabled, and connected furniture in homes and offices. For instance, Xiaomi’s smart desk with integrated wireless charging and IoT features sold over 50,000 units in 2024. Government-led smart city initiatives and technology-friendly policies further accelerate adoption. Expansion of e-commerce platforms enables wider market reach. Strong manufacturing capabilities in the region also support cost-effective production, making APAC a critical growth hub for smart furniture solutions.
Latin America:
Latin America contributes around 8% of the global smart furniture market, with Brazil and Mexico driving regional demand. Growth is fueled by rising awareness of ergonomic furniture, digital office integration, and corporate adoption of productivity-enhancing solutions. For instance, Flexform launched sensor-enabled office chairs in São Paulo, adopted by 60 corporate clients in 2024. While economic volatility and limited technological infrastructure pose challenges, increasing penetration of IoT devices and smart home systems is supporting gradual market growth. Emerging interest in connected residential furniture and government-backed urban modernization projects are expected to create new opportunities, positioning Latin America as a niche but steadily expanding market.
Middle East & Africa
MEA accounts for approximately 7% of the global smart furniture market, led by the UAE and Saudi Arabia. Growth is driven by the adoption of smart office solutions, luxury residential projects, and government-backed smart city initiatives. For instance, Haworth deployed AI-enabled office seating across 20 corporate locations in Dubai in 2024 to enhance workforce comfort and efficiency. Rising investments in digital infrastructure and technology-integrated furniture are driving adoption, although limited consumer awareness and higher costs constrain rapid growth. Strategic partnerships, smart urban development initiatives, and the expansion of IoT-enabled products are expected to strengthen MEA’s market presence over the coming years.
Market Segmentations:
By Price:
- Low
- Medium
By Application:
- New Construction
- Retrofit
By Distribution Channel:
- Online
- Offline
By Geography
- North America
- U.S.
- Canada
- Mexico
- Europe
- Germany
- France
- U.K.
- Italy
- Spain
- Rest of Europe
- Asia Pacific
- China
- Japan
- India
- South Korea
- South-east Asia
- Rest of Asia Pacific
- Latin America
- Brazil
- Argentina
- Rest of Latin America
- Middle East & Africa
- GCC Countries
- South Africa
- Rest of the Middle East and Africa
Competitive Landscape
The competitive landscape of the Smart Furniture Market features leading global players such as Honeywell International Inc., Haier Group, Google LLC, Nice Polska Sp. z o.o., ABB, Johnson Control, Apple Inc., Crestron Electronics, Inc., Gira, and Emerson Electric Co. The Smart Furniture Market is characterized by rapid technological advancement, continuous innovation, and a strong focus on integrating IoT, AI, and automation into everyday furniture applications. Companies in the market increasingly prioritize smart connectivity, energy efficiency, and ergonomic design to meet evolving consumer and corporate needs. Competition intensifies as manufacturers expand their portfolios with multifunctional, sensor-enabled solutions that enhance comfort, space utilization, and productivity in both residential and commercial settings. Strategic collaborations, investments in R&D, and the adoption of cloud-based platforms strengthen market positions. Additionally, growing emphasis on seamless interoperability with smart home ecosystems and workplace management systems drives differentiation, pushing the industry toward highly personalized and intuitive furniture solutions.
Key Player Analysis
- Honeywell International Inc.
- Haier Group
- Google LLC
- Nice Polska Sp. z o.o.
- ABB
- Johnson Control
- Apple Inc.
- Crestron Electronics, Inc.
- Gira
- Emerson Electric Co.
Recent Developments
- In June 2024, ABB launched the ReliaHome Smart Panel, a smart home energy management system for the U.S. and Canada, in partnership with Lumin. The system coordinates home energy assets like solar inverters, EV chargers, and batteries to optimize energy usage, allow circuit scheduling, and provide real-time control via a user-friendly app.
- In June of 2024, Bosch Smart Home updated its Controller II to act as a Matter Bridge, allowing its own devices to connect to other brands' ecosystems through the new universal Matter standard. This update provides greater flexibility for users to create a mixed smart home system, where Bosch products can be controlled within a larger, multi-brand network.
- In May 2024, Haier announced the launch of Haier Smart Home UK & Ireland with the goal of becoming the UK and Ireland's leading smart home provider.
- In April 2024, Samsung introduced new connected bespoke AI-powered home appliances to enhances the performance of appliances. With built-in Wi-Fi, internal cameras, AI chips and compatibility with the SmartThings application, Samsung’s latest Bespoke AI appliances come with enhanced features and connectivity to lay the foundation for a truly smart home.
Report Coverage
The research report offers an in-depth analysis based on Price, Application, Distribution Channel and Geography. It details leading market players, providing an overview of their business, product offerings, investments, revenue streams, and key applications. Additionally, the report includes insights into the competitive environment, SWOT analysis, current market trends, as well as the primary drivers and constraints. Furthermore, it discusses various factors that have driven market expansion in recent years. The report also explores market dynamics, regulatory scenarios, and technological advancements that are shaping the industry. It assesses the impact of external factors and global economic changes on market growth. Lastly, it provides strategic recommendations for new entrants and established companies to navigate the complexities of the market.
Future Outlook
- The market will increasingly integrate AI-driven personalization to enhance user comfort and automate routine adjustments.
- IoT connectivity will expand, enabling smart furniture to interact seamlessly with broader home and office ecosystems.
- Demand for ergonomic, health-monitoring furniture will rise as wellness-focused workplaces become more common.
- Smart office furniture adoption will accelerate with growth in hybrid work environments and digital collaboration tools.
- Energy-efficient and sustainable materials will gain prominence as manufacturers prioritize eco-friendly designs.
- Voice control, gesture recognition, and app-based management will become standard features in premium furniture.
- Modular and multifunctional smart furniture will see higher demand in compact urban living spaces.
- Cloud-based analytics will support real-time usage monitoring to optimize workspace layouts and employee productivity.
- Partnerships between furniture manufacturers and tech companies will intensify to deliver integrated smart solutions.
- Advancements in wireless charging and embedded sensors will drive innovation across residential and commercial segments.

Request a Free Sample
Fill in your details and we'll send you a free sample report.
- Sample data tables & charts
- Research methodology
Market Dynamics
IoT and Smart Home Ecosystem Integration
The proliferation of IoT devices and smart home platforms is driving demand for furniture that can seamlessly connect and interact with other smart systems, enhancing convenience, automation, and energy efficiency in both residential and commercial spaces.
Focus on Ergonomics and Wellness
Growing awareness of health and wellness is fueling demand for smart furniture with ergonomic features, such as posture-correcting chairs and height-adjustable desks, which address sedentary lifestyle concerns and support corporate wellness initiatives.
Technological Innovation and AI Personalization
Rapid advancements in AI, sensors, and automation are enabling smart furniture to offer personalized adjustments, voice control, and multifunctional capabilities, making these products more attractive and accessible to a wider audience.
Expansion of Omnichannel and Experiential Retail
The growth of online and omnichannel retail, combined with experiential showrooms, allows consumers to explore, test, and purchase smart furniture more easily, increasing market reach and consumer confidence in high-value purchases.
Sustainability and Eco-Friendly Materials
Rising consumer and regulatory focus on sustainability is encouraging manufacturers to use recycled materials and energy-efficient components in smart furniture, appealing to environmentally conscious buyers and supporting long-term market growth.
Need a Custom Version of This Report?
Tailor the scope, geography, or segments to your exact requirements.
- Custom geography or segment scope
- Direct access to our analyst team
Frequently Asked Questions
What is the current market size for the Smart Furniture Market, and what is its projected size in 2032?
At what Compound Annual Growth Rate is the Smart Furniture Market projected to grow between 2025 and 2032?
Which Smart Furniture Market segment held the largest share in 2024?
What are the primary factors fueling the growth of the Smart Furniture Market?
Who are the major players in this Market?
Which region commanded the largest share of the Smart Furniture Market in 2024?
Table of Content
Chapter 1 Market Segmentation
- 1.1 Segmentation Framework
- 1.1.1 Product and Service Classification
- 1.1.2 Application and End-Use Classification
- 1.1.3 Technology and Solution Classification
- 1.1.4 Customer and Distribution Channel Classification
- 1.1.5 Geographic Segmentation
- 1.1.6 Market Segment Definitions and Boundaries
- 1.2 By Price
- 1.2.1 Low
- 1.2.2 Medium
- 1.2.3 High
- 1.3 By Application
- 1.3.1 New Construction
- 1.3.2 Retrofit
Chapter 2 Introduction
- 2.1 Report Objectives and Scope
- 2.2 Product Definition and Industry Terminology
- 2.3 Market Inclusions and Exclusions
- 2.4 Research Process
- 2.4.1 Primary Research and Expert Interviews
- 2.4.2 Secondary Research and Source Review
- 2.4.3 Top-Down and Bottom-Up Estimation
- 2.4.4 Data Triangulation and Verification
- 2.5 Market Size Measurement Basis
- 2.5.1 2026: USD 794.8 → 2032: USD 2659.96 million
- 2.6 Historical and Forecast Reference Periods
- 2.6.1 Base Year: 2026
- 2.6.2 Forecast Period: 2026-2032
- 2.7 Research Assumptions and Limitations
Chapter 3 Executive Summary
- 3.1 Market Snapshot and Key Findings
- 3.2 Base-Year Market Size, 2026
- 3.3 Forecast Market Size, 2032
- 3.4 Revenue and Volume Growth Outlook
- 3.5 Key Demand and Supply Indicators
- 3.6 Leading Market Segments
- 3.7 Fastest-Growing Market Opportunities
- 3.8 Regional Performance Highlights
- 3.9 Technology and Industry Transformation
- 3.10 Competitive Landscape Summary
- 3.11 Analyst View and Strategic Implications
Chapter 4 Global Smart Furniture Market Trends and Developments
- 4.1 Historical Industry Development
- 4.2 Recent Market Trends and Developments
- 4.3 Demand and Customer Behavior Trends
- 4.4 Technology and Product Innovation
- 4.5 Artificial Intelligence, Automation and Digitalization
- 4.6 Local Manufacturing and Supply Chain Realignment
- 4.7 Industry Partnerships, Mergers and Acquisitions
- 4.8 Sustainability and Circular Economy Developments
- 4.9 Government and Private Sector Investment Trends
- 4.10 Emerging Business Models and Commercialization
- 4.11 Industry Developments and Announcements
Chapter 5 Global Smart Furniture Market Production, Supply and Demand Analysis
- 5.1 Demand Trend and Consumption Analysis
- 5.2 Demand Forecast, 2026-2032
- 5.3 Production and Output Trend
- 5.4 Production and Output Forecast, 2026-2032
- 5.5 Installed Capacity and Capacity Utilization
- 5.6 Company-Wise Production Plants and Statistics
- 5.6.1 Installed Production Capacity
- 5.6.2 Actual Production
- 5.6.3 Planned Capacity and Expansion Targets
- 5.7 Supply Chain Structure and Procurement Trends
- 5.8 Supply-Demand Gap and Bottlenecks
- 5.9 Import Dependence and Sourcing Structure
- 5.10 Contract Manufacturing and Outsourcing
- 5.11 Regional Supply and Demand Concentration
Chapter 6 Global Smart Furniture Market Pricing Analysis
- 6.1 Pricing Structure and Measurement
- 6.2 Historical Pricing Trends
- 6.3 Pricing Outlook, 2026-2032
- 6.4 Average Selling Price and Unit Economics
- 6.5 Pricing by Product and Market Segment
- 6.6 Geographic Pricing Differences
- 6.7 Key Input, Energy, Labor and Logistics Costs
- 6.8 Contract Pricing and Purchasing Models
- 6.9 Pricing Sensitivity and Competitive Positioning
- 6.10 Price, Margin and Profitability Implications
Chapter 7 Global Smart Furniture Market Dynamics
- 7.1 Market Growth Drivers
- 7.1.1 Demand-Side Drivers
- 7.1.2 Technology and Innovation Drivers
- 7.1.3 Infrastructure and Investment Drivers
- 7.1.4 Regulatory and Policy Drivers
- 7.2 Market Restraints
- 7.2.1 Cost and Affordability Constraints
- 7.2.2 Technology and Adoption Barriers
- 7.2.3 Supply Chain and Operational Constraints
- 7.3 Market Challenges
- 7.3.1 Competitive Pressure and Margin Erosion
- 7.3.2 Skills, Infrastructure and Implementation Gaps
- 7.4 Emerging Market Opportunities
- 7.5 Market Dynamics Impact and Time-Horizon Assessment
Chapter 8 Global Smart Furniture Value Chain Analysis
- 8.1 Industry Value Chain Overview
- 8.2 Upstream Suppliers and Critical Inputs
- 8.3 Technology and Component Providers
- 8.4 Manufacturing or Service Delivery
- 8.5 Distribution, Channel Partners and Integrators
- 8.6 Downstream Applications and End Users
- 8.7 Value Addition and Profit Pools
- 8.8 Vertical Integration and Outsourcing
- 8.9 Supplier Concentration and Risk
- 8.10 Supply Chain Localization and Resilience
Chapter 9 Global Smart Furniture Market Regulations and Policies
- 9.1 Relevant Laws, Standards and Compliance Frameworks
- 9.2 Product, Service, Safety and Quality Requirements
- 9.3 Government Policies, Incentives and Subsidies
- 9.4 Imports, Exports and Trade Barriers
- 9.5 Public Procurement and Local Content Requirements
- 9.6 Environmental and Sustainability Compliance
- 9.7 Data Protection, AI and Cybersecurity Compliance
- 9.8 Upcoming Policy Changes and Market Implications
Chapter 10 Global Smart Furniture Market Hotspots and Opportunities
- 10.1 Market Opportunity Mapping and Growth Hotspots
- 10.2 High-Growth Applications and Customer Groups
- 10.3 Underserved Markets and White-Space Opportunities
- 10.4 Emerging Technology and Product Opportunities
- 10.5 New Capacity and Investment Hotspots
- 10.6 Market Entry and Expansion Opportunities
- 10.7 Distribution and Partnership Opportunities
- 10.8 Near-Term and Long-Term Commercial Potential
- 10.9 Opportunity Attractiveness and Execution Risks
Chapter 11 Global Smart Furniture Market Outlook, 2026-2032
- 11.1 Market Size and Analysis
- 11.1.1 Revenue (Market Measurement: 2026: USD 794.8 → 2032: USD 2659.96 million)
- 11.1.2 Market Volume and Quantity Sold
- 11.1.3 Historical Market Size
- 11.1.4 Base-Year Market Size, 2026
- 11.2 Market Forecast, 2026-2032
- 11.2.1 Revenue Forecast to 2032
- 11.2.2 Volume Forecast to 2032
- 11.2.3 CAGR and Year-on-Year Growth
- 11.2.4 Incremental Revenue Opportunity
- 11.3 Forecast Assumptions and Scenario Analysis
- 11.3.1 Base-Case Forecast
- 11.3.2 Optimistic and Conservative Scenarios
- 11.3.3 Technology, Pricing and Policy Sensitivities
- 11.4 Market Attractiveness and Growth Outlook
Chapter 12 Global Smart Furniture Market Segmentation and Outlook
- 12.1 Segmentation Summary and Market Shares, 2026
- 12.2 Largest and Fastest-Growing Segments
- 12.3 By Price - Market Size and Forecast, 2026-2032
- 12.3.1 Segment Definition and Scope
- 12.3.2 Historical Market Size
- 12.3.3 Revenue Forecast, 2026-2032
- 12.3.4 Volume Forecast, 2026-2032
- 12.3.5 Base-Year Market Share, 2026
- 12.3.6 Segment CAGR and Growth Drivers
- 12.3.7 Subsegment Market Size and Forecast
- 12.3.7.1 Low
- 12.3.7.2 Medium
- 12.3.7.3 High
- 12.3.8 Subsegment Pricing and Adoption Trends
- 12.3.9 Leading Suppliers and Competition
- 12.3.10 Regional Demand and Opportunities
- 12.4 By Application - Market Size and Forecast, 2026-2032
- 12.4.1 Segment Definition and Scope
- 12.4.2 Historical Market Size
- 12.4.3 Revenue Forecast, 2026-2032
- 12.4.4 Volume Forecast, 2026-2032
- 12.4.5 Base-Year Market Share, 2026
- 12.4.6 Segment CAGR and Growth Drivers
- 12.4.7 Subsegment Market Size and Forecast
- 12.4.7.1 New Construction
- 12.4.7.2 Retrofit
- 12.4.8 Subsegment Pricing and Adoption Trends
- 12.4.9 Leading Suppliers and Competition
- 12.4.10 Regional Demand and Opportunities
- 12.5 Segment Growth Comparison
- 12.6 Segment Attractiveness and Priority Matrix
Chapter 13 Global Smart Furniture End-Use and Application Market Outlook
- 13.1 End-Use Industry and Customer Demand Structure
- 13.2 Leading Applications and Customer Groups
- 13.3 End-Use Market Size, Share and Forecast
- 13.4 Major End-Use Industry Deep Dives
- 13.4.1 Customer Requirements and Use Cases
- 13.4.2 Demand and Replacement Cycles
- 13.4.3 Technical and Regulatory Considerations
- 13.4.4 Purchasing and Procurement Models
- 13.4.5 Leading Vendors and Distribution Channels
- 13.4.6 Forecast and Commercial Opportunities
- 13.5 Emerging Applications and Cross-Segment Demand
- 13.6 End-Use Industry Investment Priorities
Chapter 14 Global Smart Furniture Geographic Market Outlook, 2026-2032
- 14.1 Regional Market Size and Share, 2026
- 14.2 Regional Market Forecast, 2026-2032
- 14.3 Regional Pricing, Production and Demand Differences
- 14.4 North America
- 14.4.1 United States
- 14.4.2 Canada
- 14.4.3 Mexico
- 14.5 Europe
- 14.5.1 Germany
- 14.5.2 France
- 14.5.3 Italy
- 14.5.4 United Kingdom
- 14.5.5 Spain
- 14.5.6 Poland
- 14.5.7 Russia
- 14.5.8 Netherlands
- 14.5.9 Belgium
- 14.5.10 Sweden
- 14.5.11 Denmark
- 14.5.12 Norway
- 14.5.13 Rest of Europe
- 14.6 Asia Pacific
- 14.6.1 China
- 14.6.2 India
- 14.6.3 Japan
- 14.6.4 South Korea
- 14.6.5 Thailand
- 14.6.6 Indonesia
- 14.6.7 Vietnam
- 14.6.8 Malaysia
- 14.6.9 Australia
- 14.6.10 Rest of Asia Pacific
- 14.7 Latin America
- 14.7.1 Brazil
- 14.7.2 Argentina
- 14.7.3 Colombia
- 14.7.4 Chile
- 14.7.5 Rest of Latin America
- 14.8 Middle East
- 14.8.1 Saudi Arabia
- 14.8.2 United Arab Emirates
- 14.8.3 Turkey
- 14.8.4 Israel
- 14.8.5 Iran
- 14.8.6 Rest of the Middle East
- 14.9 Africa
- 14.9.1 South Africa
- 14.9.2 Egypt
- 14.9.3 Nigeria
- 14.9.4 Morocco
- 14.9.5 Rest of Africa
- 14.10 Regional Investment, Policy and Supply Chain Differences
- 14.11 Regional Competitive Landscape
- 14.12 Geographic Growth Hotspots
Chapter 15 Global Smart Furniture Technology, Innovation and Sustainability Outlook
- 15.1 Technology Landscape and Maturity
- 15.2 Product, Process and Service Innovation
- 15.3 AI, Automation and Digital Tools in the Industry
- 15.4 Technology Adoption and Performance Benchmarking
- 15.5 Innovation Pipeline and R&D Investment
- 15.6 Patent and Intellectual Property Trends
- 15.7 Energy Efficiency and Resource Management
- 15.8 Sustainability, Recycling and Circularity
- 15.9 Technology Roadmap, 2026-2032
- 15.10 Risks of Obsolescence and Technology Substitution
Chapter 16 Global Smart Furniture Market Key Strategic Imperatives
- 16.1 Growth and Market Entry Priorities
- 16.2 High-Return Products and Segments
- 16.3 Pricing, Profitability and Cost Optimization
- 16.4 Technology Investment and Product Differentiation
- 16.5 Supply Chain Localization and Resilience
- 16.6 Distribution and Customer Acquisition
- 16.7 Partnership, Acquisition and Capacity Strategy
- 16.8 Regional Expansion Priorities
- 16.9 Short-, Medium- and Long-Term Actions
Chapter 17 Competition Outlook
- 17.1 Industry Competition Characteristics
- 17.2 Market Structure and Concentration
- 17.3 Market Share and Competitive Positioning, 2026
- 17.4 Company-Wise Revenue and Product Benchmarking
- 17.5 Production and Service Capacity Benchmarking
- 17.6 Technology, Pricing and Differentiation
- 17.7 Regional Footprint and Distribution Strength
- 17.8 Mergers, Acquisitions and Strategic Alliances
- 17.9 New Entrants and Competitive Threats
- 17.10 Porter's Five Forces and Industry Attractiveness
- 17.11 Competitive Outlook, 2026-2032
Chapter 18 Company Profiles
- 18.1 Company Coverage and Selection Criteria
- 18.2 Honeywell International Inc.
- 18.2.1 Business Description
- 18.2.2 Company Ownership and Geographic Presence
- 18.2.3 Product and Service Portfolio
- 18.2.4 Manufacturing and Operating Footprint
- 18.2.5 Production Capacity and Expansion Plans
- 18.2.6 Financial Performance and Investment
- 18.2.7 Market Share and Competitive Position
- 18.2.8 Technology and Innovation Capabilities
- 18.2.9 Strategic Alliances or Partnerships
- 18.2.10 Recent Developments
- 18.2.11 Growth Strategy and Outlook
- 18.3 Haier Group
- 18.4 Google LLC
- 18.5 Nice Polska Sp. z o.o.
- 18.6 ABB
- 18.7 Johnson Controls
- 18.8 Apple Inc.
- 18.9 Crestron Electronics, Inc.
- 18.10 Gira
- 18.11 Emerson Electric Co.
- 18.12 Other Relevant Market Participants
Note: Every listed company is profiled on the structure shown under the first company. The company list is preliminary and may change based on research findings, market developments, data availability and client requirements.
Chapter 19 Disclaimer
- 19.1 Research and Forecast Disclaimer
- 19.2 Data Source and Estimation Limitations
Note: The depth of individual sections depends on data availability for this market. Volume, capacity, trade and other unit-based metrics are included where applicable.

