Market Overview:
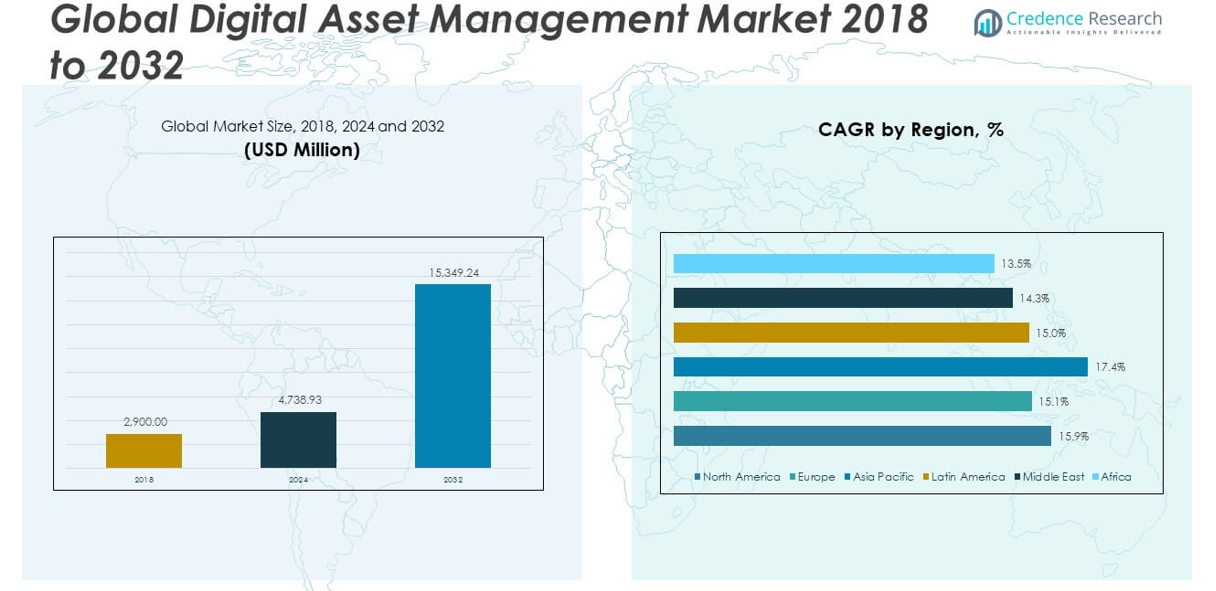
The Digital Asset Management Market size was valued at USD 2,900 million in 2018, reached USD 4,738.93 million in 2024, and is anticipated to reach USD 15,349.24 million by 2032, growing at a CAGR of 15.89% during the forecast period.
| REPORT ATTRIBUTE |
DETAILS |
| Historical Period |
2020-2023 |
| Base Year |
2024 |
| Forecast Period |
2025-2032 |
| Digital Asset Management Market Size 2024 |
USD 4,738.93 million |
| Digital Asset Management Market, CAGR |
15.89% |
| Digital Asset Management Market Size 2032 |
USD 15,349.24 million |
The increasing demand for streamlined digital content workflows and rising content volumes are significantly driving the Digital Asset Management Market. Organizations across industries are focusing on enhancing brand consistency and operational efficiency by integrating digital asset management (DAM) solutions into their marketing and IT frameworks. The rapid digitalization of enterprises and the shift toward omnichannel marketing strategies have increased the need for centralized platforms to store, organize, and distribute multimedia content securely. DAM tools help reduce duplication of content creation, improve collaboration across distributed teams, and ensure regulatory compliance in media usage. It also supports enterprises in extracting maximum value from their digital media through intelligent metadata tagging, advanced search capabilities, and version control. With growing investments in digital transformation initiatives, particularly in retail, media, and BFSI sectors, the adoption of DAM solutions has become more strategic. The scalability of cloud-based DAM platforms, combined with improved integration with other enterprise software like content management and customer relationship management systems, further strengthens its market relevance.
North America leads the Digital Asset Management Market due to its mature IT infrastructure, high adoption of digital platforms, and early integration of AI in media asset management. Europe follows closely, driven by strict data regulations and the need for secure digital workflows in sectors such as manufacturing, retail, and BFSI. Asia Pacific is emerging rapidly, supported by expanding e-commerce ecosystems, digital content production, and favorable government policies toward digitization in India, China, and Southeast Asia. Latin America is also seeing steady growth owing to the adoption of DAM in marketing and advertising workflows among regional brands. The Middle East is focusing on modernization and digital economy development, especially in the UAE and Saudi Arabia, where DAM is increasingly used in public and private sector communications. Africa, though in the early stages, is slowly progressing as mobile connectivity and internet penetration rise, prompting regional media and public institutions to seek centralized content management systems.
Access crucial information at unmatched prices!
Request your sample report today & start making informed decisions powered by Credence Research Inc.!
Download Sample
Market Insights:
- The Digital Asset Management Market was valued at USD 4,738.93 million in 2024 and is expected to reach USD 15,349.24 million by 2032, growing at a CAGR of 15.89%.
- The market is primarily driven by the need for centralized content management systems to handle growing volumes of digital assets.
- High implementation costs and integration complexities pose challenges for large-scale adoption, particularly among SMEs.
- North America leads the market due to strong digital infrastructure and early enterprise adoption, while Asia Pacific is emerging as the fastest-growing region.
- Cloud-based deployment models are gaining traction due to their scalability, real-time collaboration capabilities, and ease of integration.
- The marketing and IT application segments dominate demand, with retail, BFSI, and healthcare industries among the top adopters.
- Key players such as Adobe, IBM, OpenText, and Bynder focus on AI integration, cloud offerings, and industry-specific customizations to maintain competitiveness.
Market Drivers:
Surge in Digital Content and Need for Centralized Management Platforms
The growing volume of digital content across enterprises has intensified the need for structured systems that can handle media assets efficiently. The Digital Asset Management Market is experiencing rapid growth due to increasing content generation through marketing campaigns, websites, social media, and video production. Managing scattered assets has become a challenge for teams striving to maintain brand consistency and streamline approval workflows. DAM solutions help consolidate digital content, improve retrieval speed, and reduce duplication of creative efforts. It offers centralized storage integrated with advanced metadata and tagging systems, ensuring content is both discoverable and compliant with organizational standards.
- For example, companies like CELUM and Bynder have reported a dramatic spike in enterprise digital content, with CELUM noting that their highest-volume clients manage over 250,000 new digital assets weekly and millions of files in aggregate on their cloud-based DAM platform.
Adoption of Cloud-Based Solutions Across Industries
The transition from on-premise systems to cloud-based platforms is significantly contributing to the expansion of the Digital Asset Management Market. Enterprises are turning to Software-as-a-Service (SaaS) DAM platforms for their scalability, cost-effectiveness, and remote accessibility. Cloud deployment allows real-time collaboration between teams, accelerates deployment cycles, and enables seamless integration with other enterprise applications such as CMS, CRM, and project management tools. Businesses can customize user access levels, track asset usage, and ensure secure sharing across internal and external stakeholders, making DAM an integral part of their digital transformation roadmap.
Rising Importance of Brand Consistency and Compliance
Maintaining a uniform brand image across touchpoints is critical for companies seeking competitive advantage. The Digital Asset Management Market supports organizations in controlling how assets are used, updated, and shared, which becomes especially crucial when managing campaigns across global markets. DAM platforms ensure teams access the most current versions of brand assets, eliminating inconsistencies and misuse. The system also helps enforce licensing and usage rights, minimizing legal risks. With marketing teams handling multiple campaigns concurrently, DAM ensures content accuracy, regulatory adherence, and consistent storytelling.
Integration with Advanced Technologies like AI and Automation
The integration of artificial intelligence and automation within DAM platforms is transforming how enterprises manage content at scale. The Digital Asset Management Market is leveraging AI to enhance asset tagging, facial recognition, content categorization, and automated metadata enrichment. These capabilities reduce manual effort and improve accuracy, enabling faster search and retrieval. Predictive analytics embedded in DAM tools allow marketers to optimize asset performance and make data-driven content decisions. Automation also plays a critical role in managing workflows, approvals, and content publishing, aligning teams and increasing overall productivity.
- For example, DAM technology has seen a measurable leap in automation and AI. Bynder and CELUM both employ AI-driven asset tagging and metadata enrichment, with CELUM’s system recognizing objects and scenes in uploaded images, generating metadata with over 95% accuracy, and automating alternative text for improved accessibility compliance.
Market Trends:
Increased Integration with MarTech and AdTech Ecosystems
The Digital Asset Management Market is witnessing a trend toward tighter integration with marketing and advertising technology stacks. Enterprises are embedding DAM solutions within broader digital experience platforms, enabling direct asset deployment across email marketing, social media, and digital advertising tools. This integration enhances time-to-market, improves campaign personalization, and ensures seamless brand experiences across channels. DAM is evolving into a strategic enabler of omnichannel engagement, providing marketers with visibility into asset usage, performance metrics, and customer interactions in real-time.
Rising Demand for Video and Rich Media Management
The surge in video-based content creation, especially for digital advertising and social platforms, has created new challenges for asset storage and versioning. The Digital Asset Management Market is expanding to accommodate high-definition video, animation, 3D assets, and immersive media. Modern DAM platforms are optimized for large file handling, transcoding, and multi-format publishing. As video becomes a dominant communication format across industries, organizations require tools that support advanced editing, rights management, and distribution capabilities to maximize the value of visual assets.
Customization and Industry-Specific DAM Solutions
Vendors are increasingly offering vertical-specific DAM solutions tailored to the unique needs of industries such as healthcare, media & entertainment, retail, and education. The Digital Asset Management Market is shifting toward customizable modules that align with sector-specific workflows and compliance requirements. For instance, healthcare organizations prioritize HIPAA-compliant storage, while retailers need tools for seasonal product campaign planning. This trend allows organizations to derive higher operational value and ROI from DAM investments by aligning features directly with business functions.
- For example, Vendors such as Bynder and Canto have launched sector-focused DAM modules with technical features mapped directly to regulatory and workflow requirements. For healthcare, Bynder’s solution enables HIPAA-compliant asset storage using AES-256 encryption and detailed access logging.
Increased Use of Metadata-Driven Automation and Smart Search
Enterprises are emphasizing metadata enrichment and intelligent search functionalities within their DAM systems. The Digital Asset Management Market is trending toward platforms that leverage smart metadata extraction, auto-tagging, and AI-powered search to speed up content discovery. These features enable creative and marketing teams to reduce the time spent locating assets and focus on content deployment and optimization. As digital libraries grow, metadata-driven workflows become essential for scalability, auditability, and real-time asset lifecycle management.
- For instance, Aprimo’s AI metadata agents, launched in 2025, leverage generative AI to automatically populate extensive metadata fields and organize assets based on customer-defined taxonomies. These agents enable assets to become searchable and usable immediately upon upload, significantly accelerating the transition from ingestion to deployment within digital asset workflows.
Market Challenges Analysis:
High Implementation Costs and Complexity for Large Enterprises
Deploying a full-scale digital asset management system often requires a substantial investment in time, capital, and change management. The Digital Asset Management Market faces resistance from organizations concerned about upfront costs, especially those with limited IT budgets or fragmented digital infrastructure. Customization, user training, integration with legacy systems, and ongoing support add to the total cost of ownership. Many enterprises also encounter technical complexities when scaling DAM systems across geographies and departments. Without expert deployment and consistent user adoption, organizations may struggle to realize the expected productivity and efficiency gains from DAM platforms.
Limited Awareness Among SMEs and Developing Markets
While large organizations are actively investing in DAM technologies, small and medium enterprises remain underpenetrated due to limited awareness and perceived relevance. The Digital Asset Management Market continues to face barriers in emerging economies where digital maturity and structured content strategies are still evolving. Many SMEs operate without formalized branding or centralized media processes, reducing the perceived need for DAM systems. Inadequate internet infrastructure, lack of digital skills, and a preference for low-cost file-sharing solutions also hinder adoption in several developing regions. Vendors need to address these gaps through targeted education, simplified offerings, and regional partnerships.
Market Opportunities:
Expansion Across Non-Traditional Sectors and Emerging Verticals
The Digital Asset Management Market is finding new opportunities in sectors such as education, government, construction, and energy, where digital asset workflows were previously underutilized. Institutions are adopting DAM to manage training materials, policy documents, and communication assets. Public sector organizations are exploring DAM for digital archiving and citizen engagement campaigns. These emerging use cases create fresh demand for lightweight, configurable DAM systems that can be adapted to varied organizational needs without complex setups.
Growth Potential in AI-Powered Analytics and Personalization Tools
The integration of analytics and personalization engines within DAM platforms presents a strong growth opportunity. The Digital Asset Management Market is expected to benefit from AI features that enable predictive asset recommendations, content performance analysis, and user behavior tracking. These capabilities allow enterprises to deliver more relevant content faster and improve return on marketing investments. Enhanced analytics will play a vital role in shaping future DAM evolution and expand its strategic value across content-centric industries.
Market Segmentation Analysis:
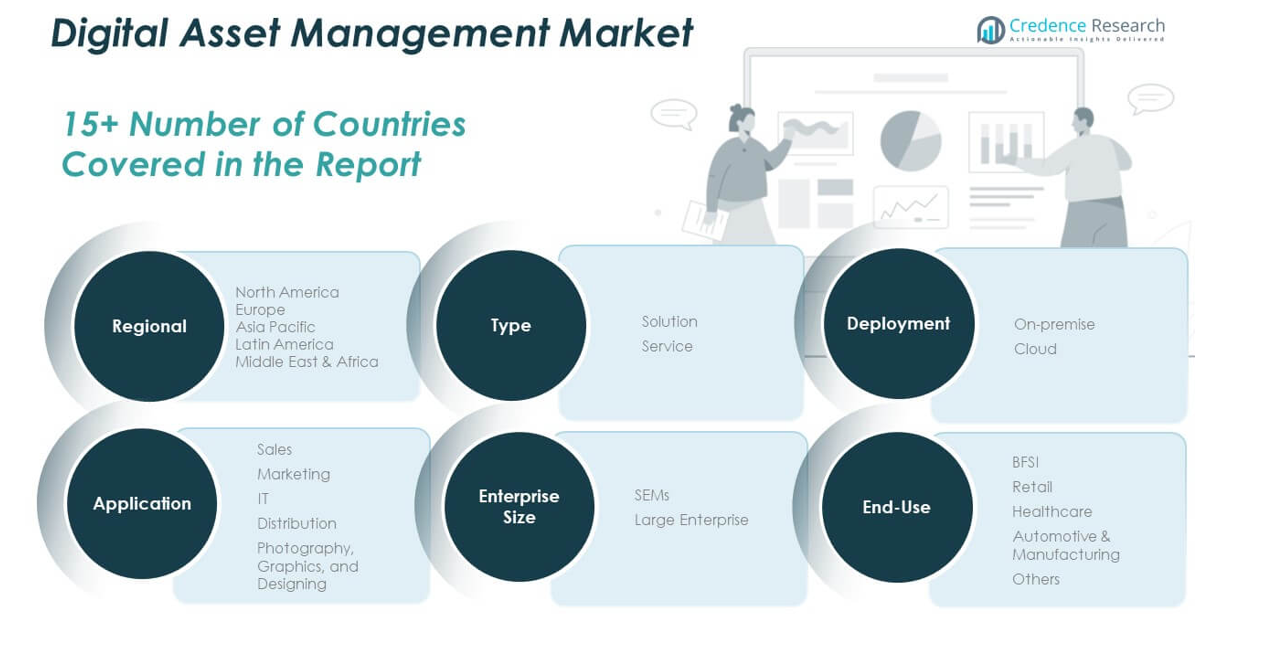
The Digital Asset Management Market is segmented by type, application, deployment, enterprise size, and end use, reflecting its widespread adoption across industries.
By type, the market includes solutions and services. Solutions dominate due to increasing demand for centralized platforms that streamline digital content storage and access. Services are growing steadily, driven by implementation, training, and support needs.
· For example, Adobe Experience Manager Assets provides an end-to-end DAM solution with AI-powered metadata extraction via Adobe Sensei. It supports direct publishing to social media, email, and advertising platforms through seamless integration with Adobe Creative Cloud, Campaign, and Target.
By application, the market spans sales, marketing, IT, distribution, and photography, graphics, and designing. Marketing holds the largest share, with enterprises prioritizing brand consistency and campaign efficiency. IT departments rely on DAM systems for asset governance and integration, while creative teams use them for seamless design collaboration.
By deployment, on-premise and cloud segments define the market landscape. Cloud-based deployment leads due to flexibility, remote access, and cost-effectiveness. On-premise solutions remain relevant in organizations with strict data control policies.
By enterprise size, large enterprises hold a significant share given their broader digital ecosystems. SMEs are increasing adoption due to scalable and affordable cloud offerings.
By end use, the market includes BFSI, retail, healthcare, automotive & manufacturing, and others. Retail and BFSI sectors lead adoption, driven by high content turnover and compliance requirements. Healthcare and manufacturing follow closely, leveraging DAM systems for operational content and technical documentation management. The market continues evolving with strong growth potential across all segments.
- For example, Bynder’s 2025 Retail Sector Reportshowcases a global apparel brand that reduced time-to-market for seasonal campaigns by 30% using automated asset workflows.
Segmentation:
By Type:
By Application:
- Sales
- Marketing
- IT
- Distribution
- Photography, Graphics, and Designing
By Deployment:
By Enterprise Size:
- Small and Medium Enterprises (SMEs)
- Large Enterprises
By End Use:
- BFSI
- Retail
- Healthcare
- Automotive & Manufacturing
- Others
By Region:
- North America
- Europe
- Germany
- France
- U.K.
- Italy
- Spain
- Rest of Europe
- Asia Pacific
- China
- Japan
- India
- South Korea
- South-east Asia
- Rest of Asia Pacific
- Latin America
- Brazil
- Argentina
- Rest of Latin America
- Middle East & Africa
- GCC Countries
- South Africa
- Rest of the Middle East and Africa
Regional Analysis:
North America
The North America Digital Asset Management Market size was valued at USD 1,122.30 million in 2018, reached USD 1,813.08 million in 2024, and is anticipated to reach USD 5,864.97 million by 2032, at a CAGR of 15.9% during the forecast period. North America leads the market due to its advanced IT infrastructure, strong digital content ecosystem, and early adoption of cloud-based solutions. The U.S. remains the primary contributor, with widespread integration of DAM in media, advertising, and retail industries. Companies in the region prioritize brand management and data compliance, which drives consistent investment in DAM systems. The presence of leading DAM vendors and higher awareness among enterprises also sustains North America’s market dominance.
Europe
The Europe Digital Asset Management Market size was valued at USD 750.81 million in 2018, reached USD 1,178.44 million in 2024, and is anticipated to reach USD 3,601.74 million by 2032, at a CAGR of 15.1% during the forecast period. Europe is a key market driven by strict data protection regulations and a growing focus on digital content governance. Countries like Germany, the UK, and France are adopting DAM for compliance, localization, and campaign automation. Enterprises prioritize GDPR-compliant platforms with robust access controls and audit trails. Retail, fashion, and manufacturing sectors are leading adopters, supported by growing demand for multilingual and regionalized content management.
Asia Pacific
The Asia Pacific Digital Asset Management Market size was valued at USD 651.92 million in 2018, reached USD 1,116.71 million in 2024, and is anticipated to reach USD 4,023.05 million by 2032, at a CAGR of 17.4% during the forecast period. Asia Pacific is emerging as the fastest-growing region, driven by expanding digital economies and growing e-commerce adoption. China, India, and Southeast Asian countries are investing in cloud infrastructure and content platforms. The rise of influencer marketing, mobile-first campaigns, and digital learning ecosystems supports DAM uptake. Multinational companies operating in the region also invest in localized DAM systems to manage cross-border marketing operations efficiently.
Latin America
The Latin America Digital Asset Management Market size was valued at USD 205.90 million in 2018, reached USD 333.57 million in 2024, and is anticipated to reach USD 1,011.05 million by 2032, at a CAGR of 15.0% during the forecast period. Latin America is gradually adopting DAM technologies, particularly in advertising, media, and retail. Brazil and Mexico are at the forefront, with increasing digitization in both public and private sectors. Regional brands are leveraging DAM to enhance content quality and campaign agility. However, infrastructure gaps and budget limitations continue to challenge widespread adoption across smaller enterprises.
Middle East
The Middle East Digital Asset Management Market size was valued at USD 100.05 million in 2018, reached USD 152.09 million in 2024, and is anticipated to reach USD 439.07 million by 2032, at a CAGR of 14.3% during the forecast period. The Middle East shows steady growth as governments and enterprises pursue digital transformation. DAM adoption is increasing across sectors such as tourism, banking, and education. The UAE and Saudi Arabia are investing in centralized content management to support public communication strategies and corporate branding. Interest in AI-driven and multilingual DAM features is rising, aligning with the region’s focus on innovation.
Africa
The Africa Digital Asset Management Market size was valued at USD 69.02 million in 2018, reached USD 145.03 million in 2024, and is anticipated to reach USD 409.35 million by 2032, at a CAGR of 13.5% during the forecast period. Africa is still in the early adoption stage due to infrastructure challenges and limited digital maturity. However, the growing use of mobile and internet services is driving content consumption, prompting media and nonprofit organizations to consider DAM solutions. South Africa and Nigeria are seeing initial adoption trends, while regional tech hubs are gradually exploring localized DAM applications.
Shape Your Report to Specific Countries or Regions & Enjoy 30% Off!
Key Player Analysis:
- Adam Software NV
- Adobe
- Bynder
- Canto, Inc.
- Celum
- Cognizant
- EMC Limited
- Hewlett-Packard Development Company, L.P.
- IBM Corporation
- OpenText Corporation
- Oracle Corporation
- North Plains Systems
- WebDAM
- Widen Enterprise Inc.
Competitive Analysis:
The Digital Asset Management Market is highly competitive, with key players focusing on innovation, cloud integration, and AI capabilities to gain market share. Major companies include Adobe Inc., OpenText Corporation, Bynder, Widen, Canto, and MediaBeacon. These players offer comprehensive DAM platforms that support enterprise content strategies, brand governance, and real-time collaboration. Vendors are investing in partnerships and acquisitions to expand their portfolios and regional presence. The market also features several niche providers catering to specific industry needs or regional markets. It continues to witness new entrants offering lightweight, cost-effective solutions for SMEs, creating competitive pressure and price sensitivity. Companies differentiate through user-friendly interfaces, flexible APIs, and scalable deployment models.
Recent Developments:
- In July 2025, EPAM partnered with European Aquatics to launch a modern DAM platform, transforming how media is handled across their organization. The new system supports efficient storage, organization, and distribution of media assets, marking a significant step forward for European Aquatics’ digital infrastructure.
- In June 2025, MediaValet announced the acquisition of Beam, a leading brand enablement provider, and introduced “Experience Portals.” This expansion enhances MediaValet’s AI-powered DAM platform with advanced brand center capabilities, enabling organizations to centralize and distribute brand elements through customizable, visually stunning portals.
- In April 2025, Cognizant expanded its partnership with Docusign with the goal of enhancing customer support services and driving global digital transformation. This collaboration aims to deliver innovative intelligent agreement management (IAM) solutions.
- In December 2024, Canto, Inc. launched “Canto PIM,” a new platform that unifies digital asset management (DAM) with product information management (PIM). The solution is designed to help organizations manage, distribute, and optimize their digital assets and product data more efficiently, addressing the rapidly growing content needs in digital marketing and sales.
Market Concentration & Characteristics:
The Digital Asset Management Market is highly competitive, with key players focusing on innovation, cloud integration, and AI capabilities to gain market share. Major companies include Adobe Inc., OpenText Corporation, Bynder, Widen, Canto, and MediaBeacon. These players offer comprehensive DAM platforms that support enterprise content strategies, brand governance, and real-time collaboration. Vendors are investing in partnerships and acquisitions to expand their portfolios and regional presence. The market also features several niche providers catering to specific industry needs or regional markets. It continues to witness new entrants offering lightweight, cost-effective solutions for SMEs, creating competitive pressure and price sensitivity. Companies differentiate through user-friendly interfaces, flexible APIs, and scalable deployment models.
Report Coverage:
The research report offers an in-depth analysis based on type, application, deployment, enterprise size, and end use. It details leading market players, providing an overview of their business, product offerings, investments, revenue streams, and key applications. Additionally, the report includes insights into the competitive environment, SWOT analysis, current market trends, as well as the primary drivers and constraints. Furthermore, it discusses various factors that have driven market expansion in recent years. The report also explores market dynamics, regulatory scenarios, and technological advancements that are shaping the industry. It assesses the impact of external factors and global economic changes on market growth. Lastly, it provides strategic recommendations for new entrants and established companies to navigate the complexities of the market.
Future Outlook:
- Cloud-based DAM adoption will accelerate as remote collaboration and content scalability become enterprise priorities.
- AI and machine learning will drive automation in metadata tagging, search, and content personalization.
- Demand for video and immersive content management will reshape platform architecture and capabilities.
- Vertical-specific DAM solutions will expand, targeting industries like healthcare, education, and public services.
- Integration with MarTech and AdTech ecosystems will become standard for omnichannel marketing strategies.
- SMEs will increasingly adopt lightweight DAM solutions due to rising digital marketing efforts.
- Data security, regulatory compliance, and digital rights management will become critical decision factors.
- Emerging markets in Asia Pacific and Latin America will witness rapid DAM uptake with digital transformation.
- Open API ecosystems and plug-and-play integration models will drive vendor differentiation.
- Advanced analytics and ROI tracking tools will elevate DAM’s role in strategic marketing decision-making.


