
U.S. luxury hotel rates outpace a flat lodging market
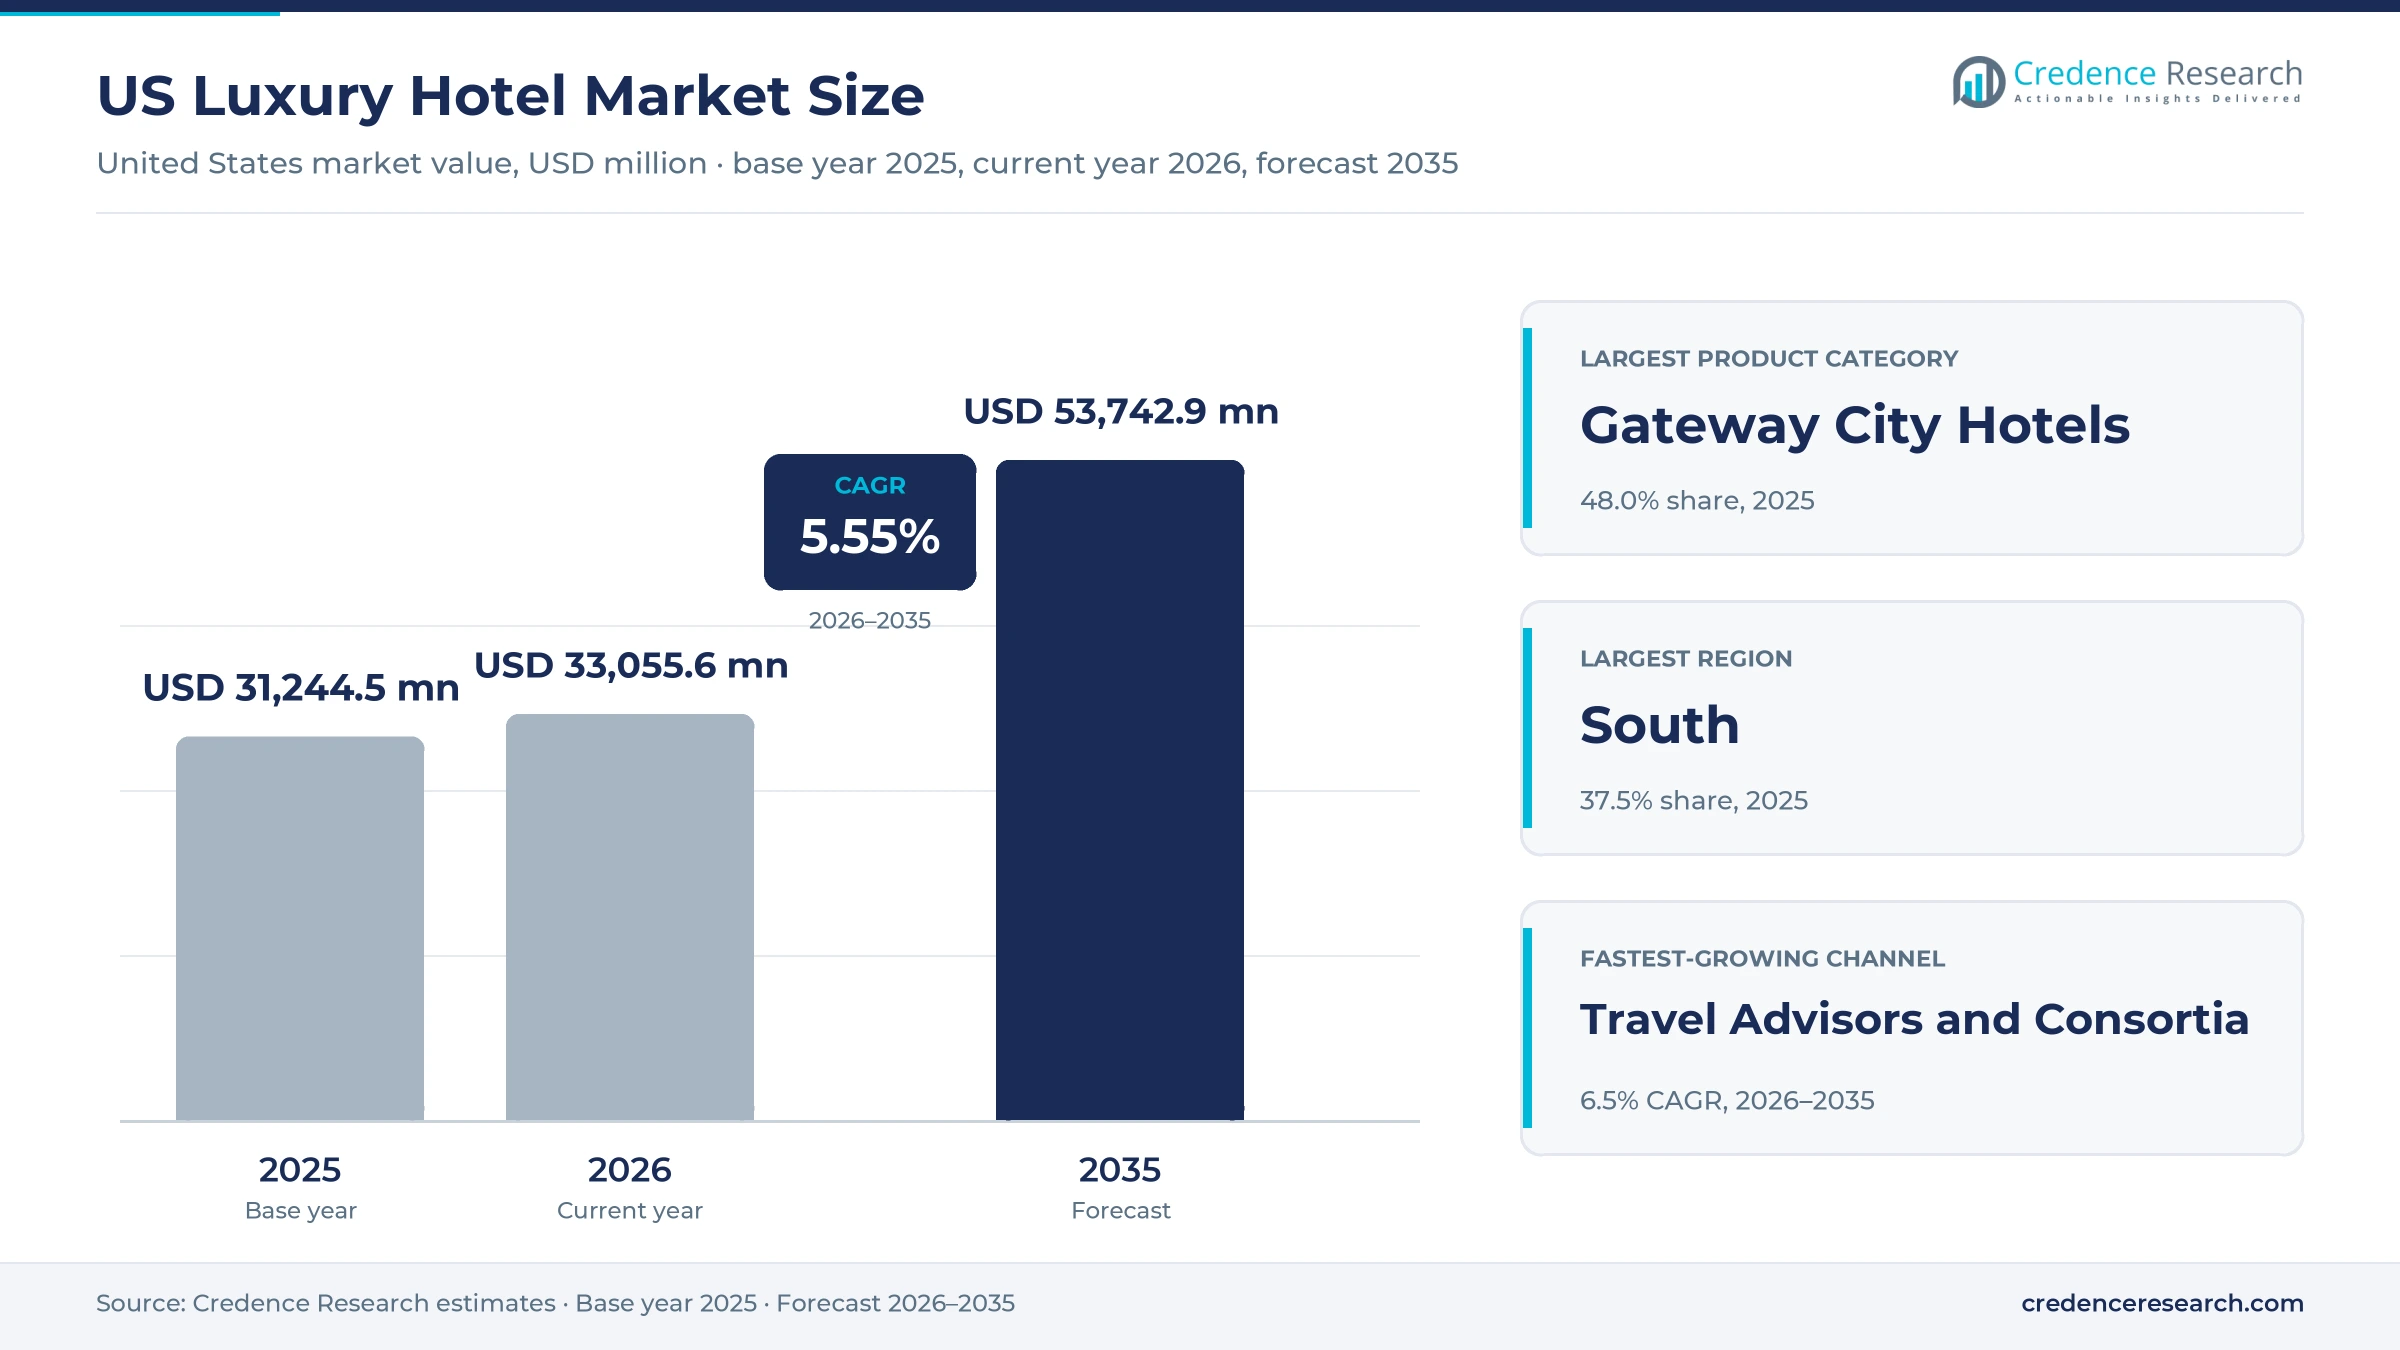
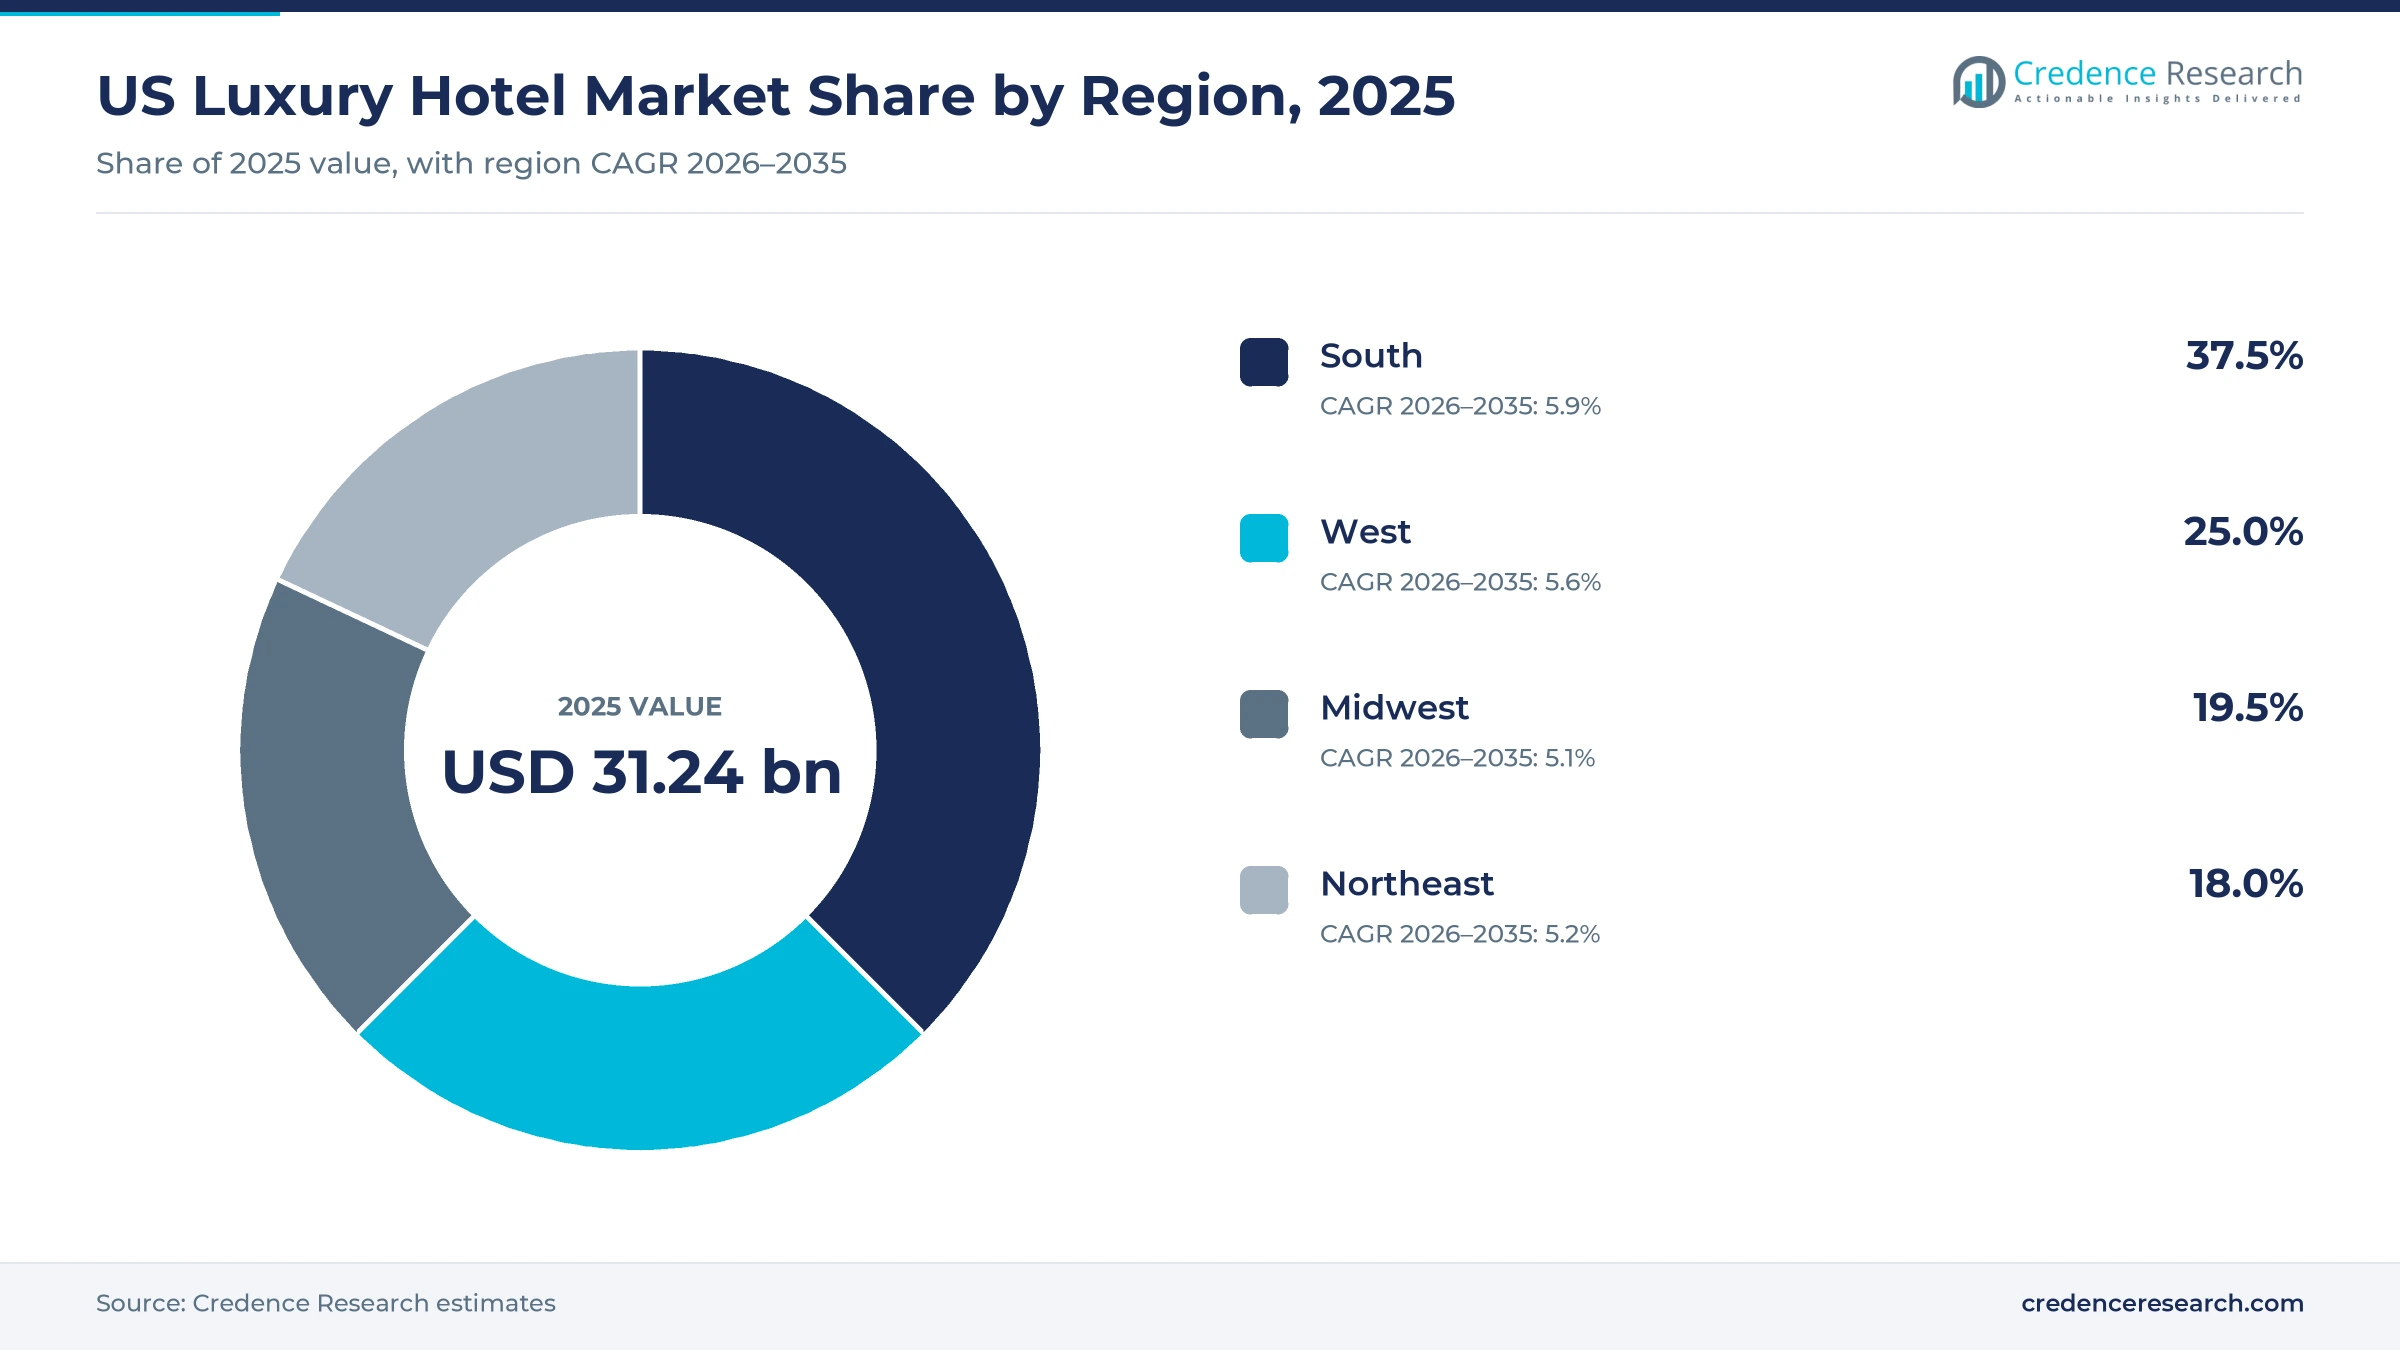
The U.S. luxury hotel market was valued at USD 31.24 billion in 2025 and is projected to increase from USD 33.06 billion in 2026 to USD 53.74 billion by 2035, registering a CAGR of 5.55% during 2026–2035. Demand comes from affluent domestic households, international leisure guests and corporate and group buyers who pay for location, service and space. The South held the largest regional share, 37.5% in 2025, and it is also the fastest-growing region at 5.9% a year, as Florida and Texas cities and resorts add new top-tier supply. Gateway city hotels hold the largest product share, while boutique retreats grow fastest from a small base. Luxury properties outperformed the wider lodging industry in 2025, when most lower classes lost revenue per available room. The main commercial change is the spread of branded residences, which now help finance many new resorts and city hotels in coastal markets.
Room, dining, spa and event spending at top-tier properties
The market counts the total revenue of hotels and resorts positioned in the luxury tier across the United States, from accessible luxury to ultra-luxury properties. It covers room nights, dining, spa and wellness services, meetings, weddings and other events, and the resort and amenity charges billed during a stay. Guests buy through hotel and brand websites, online travel agencies, travel advisors, consortia and card travel programs.
Sales of branded residences, private club memberships, cruise and yacht stays and vacation rentals are outside the scope. The value chain runs from landowners and developers through hotel owners and real estate investment trusts to brand companies and management operators, and finally to the channels that sell rooms to guests.
US Luxury Hotel Market Insights
- The U.S. luxury hotel market grows from USD 31.24 billion in 2025 to USD 53.74 billion by 2035 at a 5.55% CAGR as affluent guests keep paying premium room rates.
- The South held the largest regional share at 37.5% in 2025 and grows fastest at 5.9% a year, helped by Florida resorts and fast population growth.
- Gateway city hotels led with 48.0% of 2025 value, while boutique retreats grow fastest at 6.7% a year.
- CoStar reported that U.S. luxury hotel RevPAR rose 5.7% in 2025, while every class below upper upscale posted a decline.
- Lodging Econometrics counted a record 95 luxury projects with 22,045 rooms in the U.S. pipeline at the end of 2025, a small addition to existing supply.
Gateway hotels lead as boutique retreats grow fastest
Gateway city hotels lead while boutique retreats grow fastest
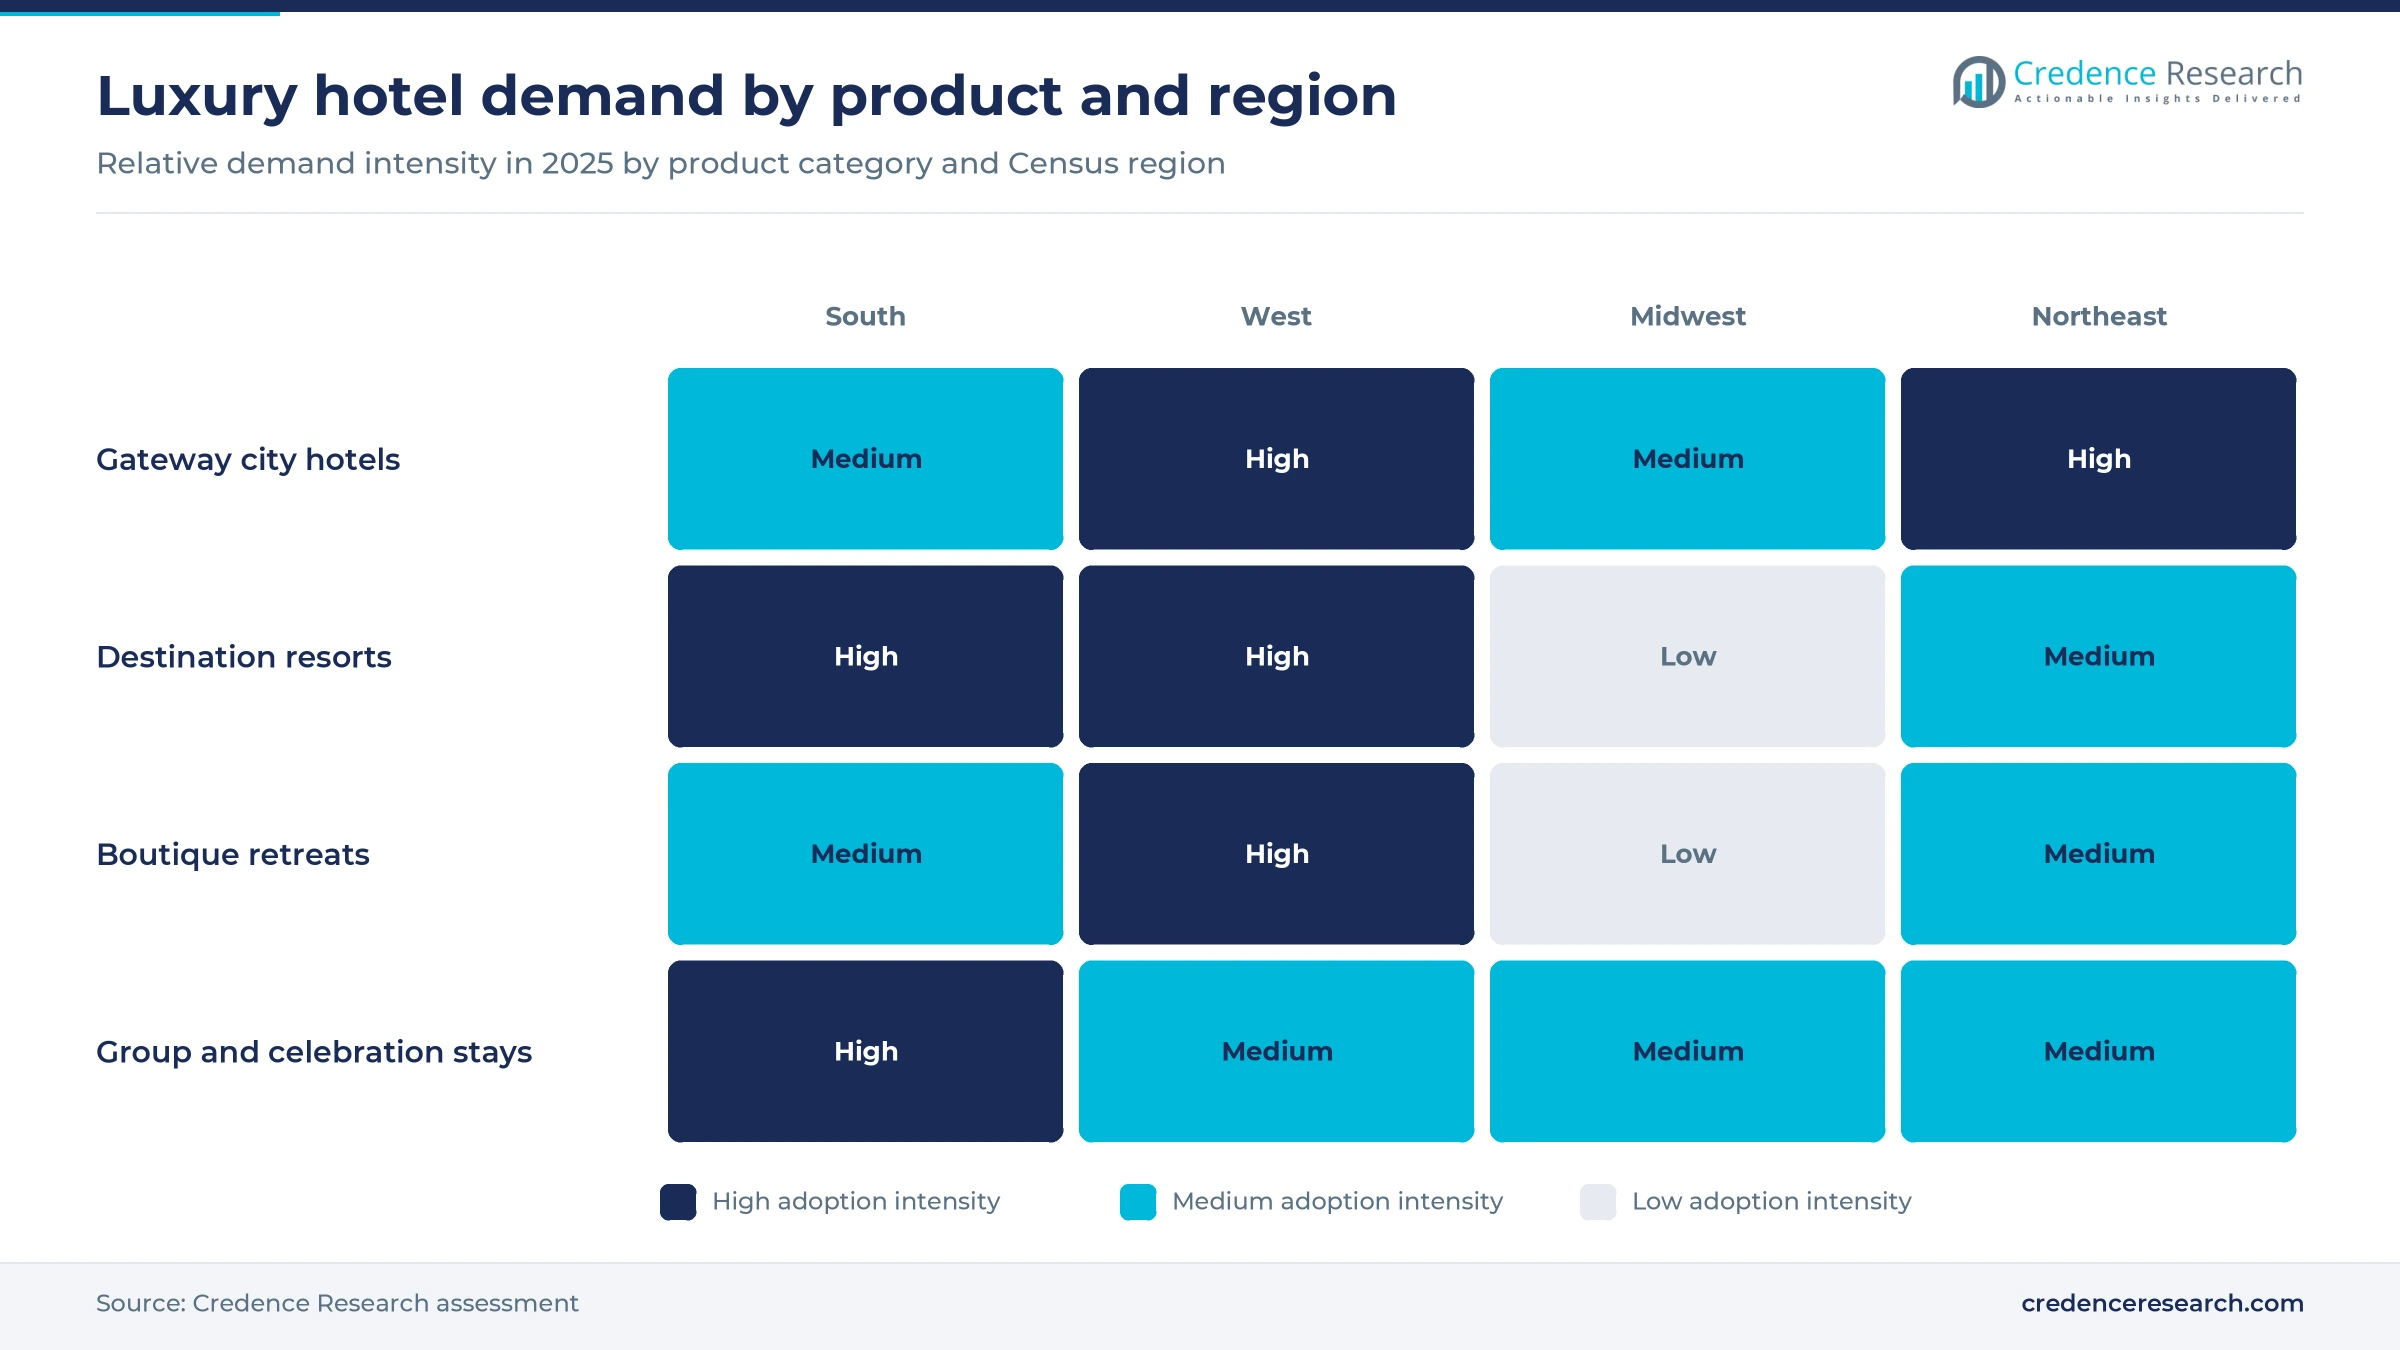
Based on product category, the market is categorized into gateway city hotels, destination resorts and boutique retreats. Gateway City Hotels led with 48.0% of 2025 value because big-city properties combine high occupancy with rates that hold all year, and CoStar put New York City occupancy at 84.1% in 2025, the highest of the top 25 markets. Boutique Retreats grow fastest at 6.7% a year as small estates open outside the cities, such as Pendry Natirar with 66 rooms on a 500-acre estate in New Jersey. These boutique properties earn high rates with few rooms, which suits owners with limited capital.
Domestic private travelers lead and also grow fastest
Based on customer type, the market is categorized into domestic private travelers, international private travelers and organizational buyers. Domestic Private Travelers led with 68.0% of 2025 value because foreign guests concentrate in a few gateway states, and overseas arrivals fell 2.5% to 34.3 million in 2025, according to the National Travel and Tourism Office. Domestic Private Travelers also grow fastest at 5.8% a year, as spending by the top 10% of households rose 62% from the third quarter of 2020 to the third quarter of 2025, according to Moody's Analytics estimates that the Minneapolis Fed notes run above official survey data. Affluent domestic guests carry most of the growth in both rooms and spending.
Leisure stays lead as celebration groups grow fastest
Based on purchase occasion, the market is categorized into leisure stays, group and celebration stays and business stays. Leisure Stays led with 58.0% of 2025 value because resorts and weekend city trips fill most luxury rooms, and Virtuoso reported that its hotel sales rose nearly 26% in the first half of 2025. Group and Celebration Stays grow fastest at 6.1% a year as weddings and milestone trips book whole room blocks for several nights. The Knot put the average U.S. wedding in 2025 at USD 34,000 with 117 guests in February 2026. Hotels with event lawns and ballrooms capture this spending well beyond the room.
Direct booking leads as advisor programs grow fastest
Based on distribution channel, the market is categorized into direct hotel booking, online travel agencies and travel advisors and consortia. Direct Hotel Booking led with 55.0% of 2025 value because brand programs route repeat guests to their own sites, and Hilton said in February 2026 that more than 243 million Honors members book directly with it. Travel Advisors and Consortia grow fastest at 6.5% a year as card and consortium programs widen, with American Express listing more than 1,900 Fine Hotels + Resorts properties. These programs add perks without public discounts, which protects rate integrity for owners.
| Segment Group | Leading Sub-segment | Share, 2025 | Fastest-growing Sub-segment | CAGR, 2026–2035 |
|---|---|---|---|---|
| By Product Category | Gateway City Hotels | 48.0% | Boutique Retreats | 6.7% |
| By Customer Type | Domestic Private Travelers | 68.0% | Domestic Private Travelers | 5.8% |
| By Purchase Occasion | Leisure Stays | 58.0% | Group and Celebration Stays | 6.1% |
| By Distribution Channel | Direct Hotel Booking | 55.0% | Travel Advisors and Consortia | 6.5% |
Luxury room rates run about 2.5 times the U.S. average
Luxury pricing rests on a high base rate plus packaged value rather than on discounting. CoStar put the 2025 luxury average daily rate at USD 397.68, up 3.6% and roughly 2.5 times the all-hotel average. Rates move with affluent confidence, event calendars and local taxes, and the federal total-price rule now puts mandatory fees inside the quoted rate. Card and consortium programs add breakfast, credits and upgrades instead of cutting prices. Owners protect margins by bundling value, which keeps published rates high even in a softer year.
| Offer or rate benchmark | Typical price or fee | Basis |
|---|---|---|
| Luxury class average daily rate, U.S., 2025 | USD 397.68, up 3.6% | CoStar via Business Travel News, 2026 |
| All U.S. hotels average daily rate, 2025 | USD 160.54, up 0.9% | CoStar, January 2026 |
| New York City all-hotel average daily rate, 2025 | USD 333.71, up 4.7% | CoStar, January 2026 |
| Hawaii state lodging tax on a USD 400 room from 2026 | USD 44 a night at the 11% rate | Travel Market Report, 2025 |
| Fine Hotels + Resorts benefits per two-night stay | About USD 550 average value | American Express lists, November 2026 |
Request a Free Sample
Fill in your details and we'll send you a free sample report.
- Sample data tables & charts
- Research methodology
Affluent spending, loyalty and scarce sites drive demand
Affluent households keep paying higher room rates
Affluent households carry luxury demand, and their spending held up in 2025 while lower-income travelers cut back. CoStar reported that U.S. luxury hotel RevPAR rose 5.7% in 2025, while every class below upper upscale posted a decline. Moody's Analytics estimates that the top 10% of households by income account for more than 45% of consumer spending, although a March 2026 Minneapolis Fed review found that official survey data show a narrower gap between income groups. Hilton reported a 9.7% gain in full-year 2025 RevPAR for Waldorf Astoria, even as RevPAR across its U.S. system fell 0.8%. This gap shows that the top tier follows the wealth of its guests rather than the wider travel cycle. Owners of top-tier properties can raise rates when midscale peers must cut them.
Loyalty networks steer affluent guests to brand hotels
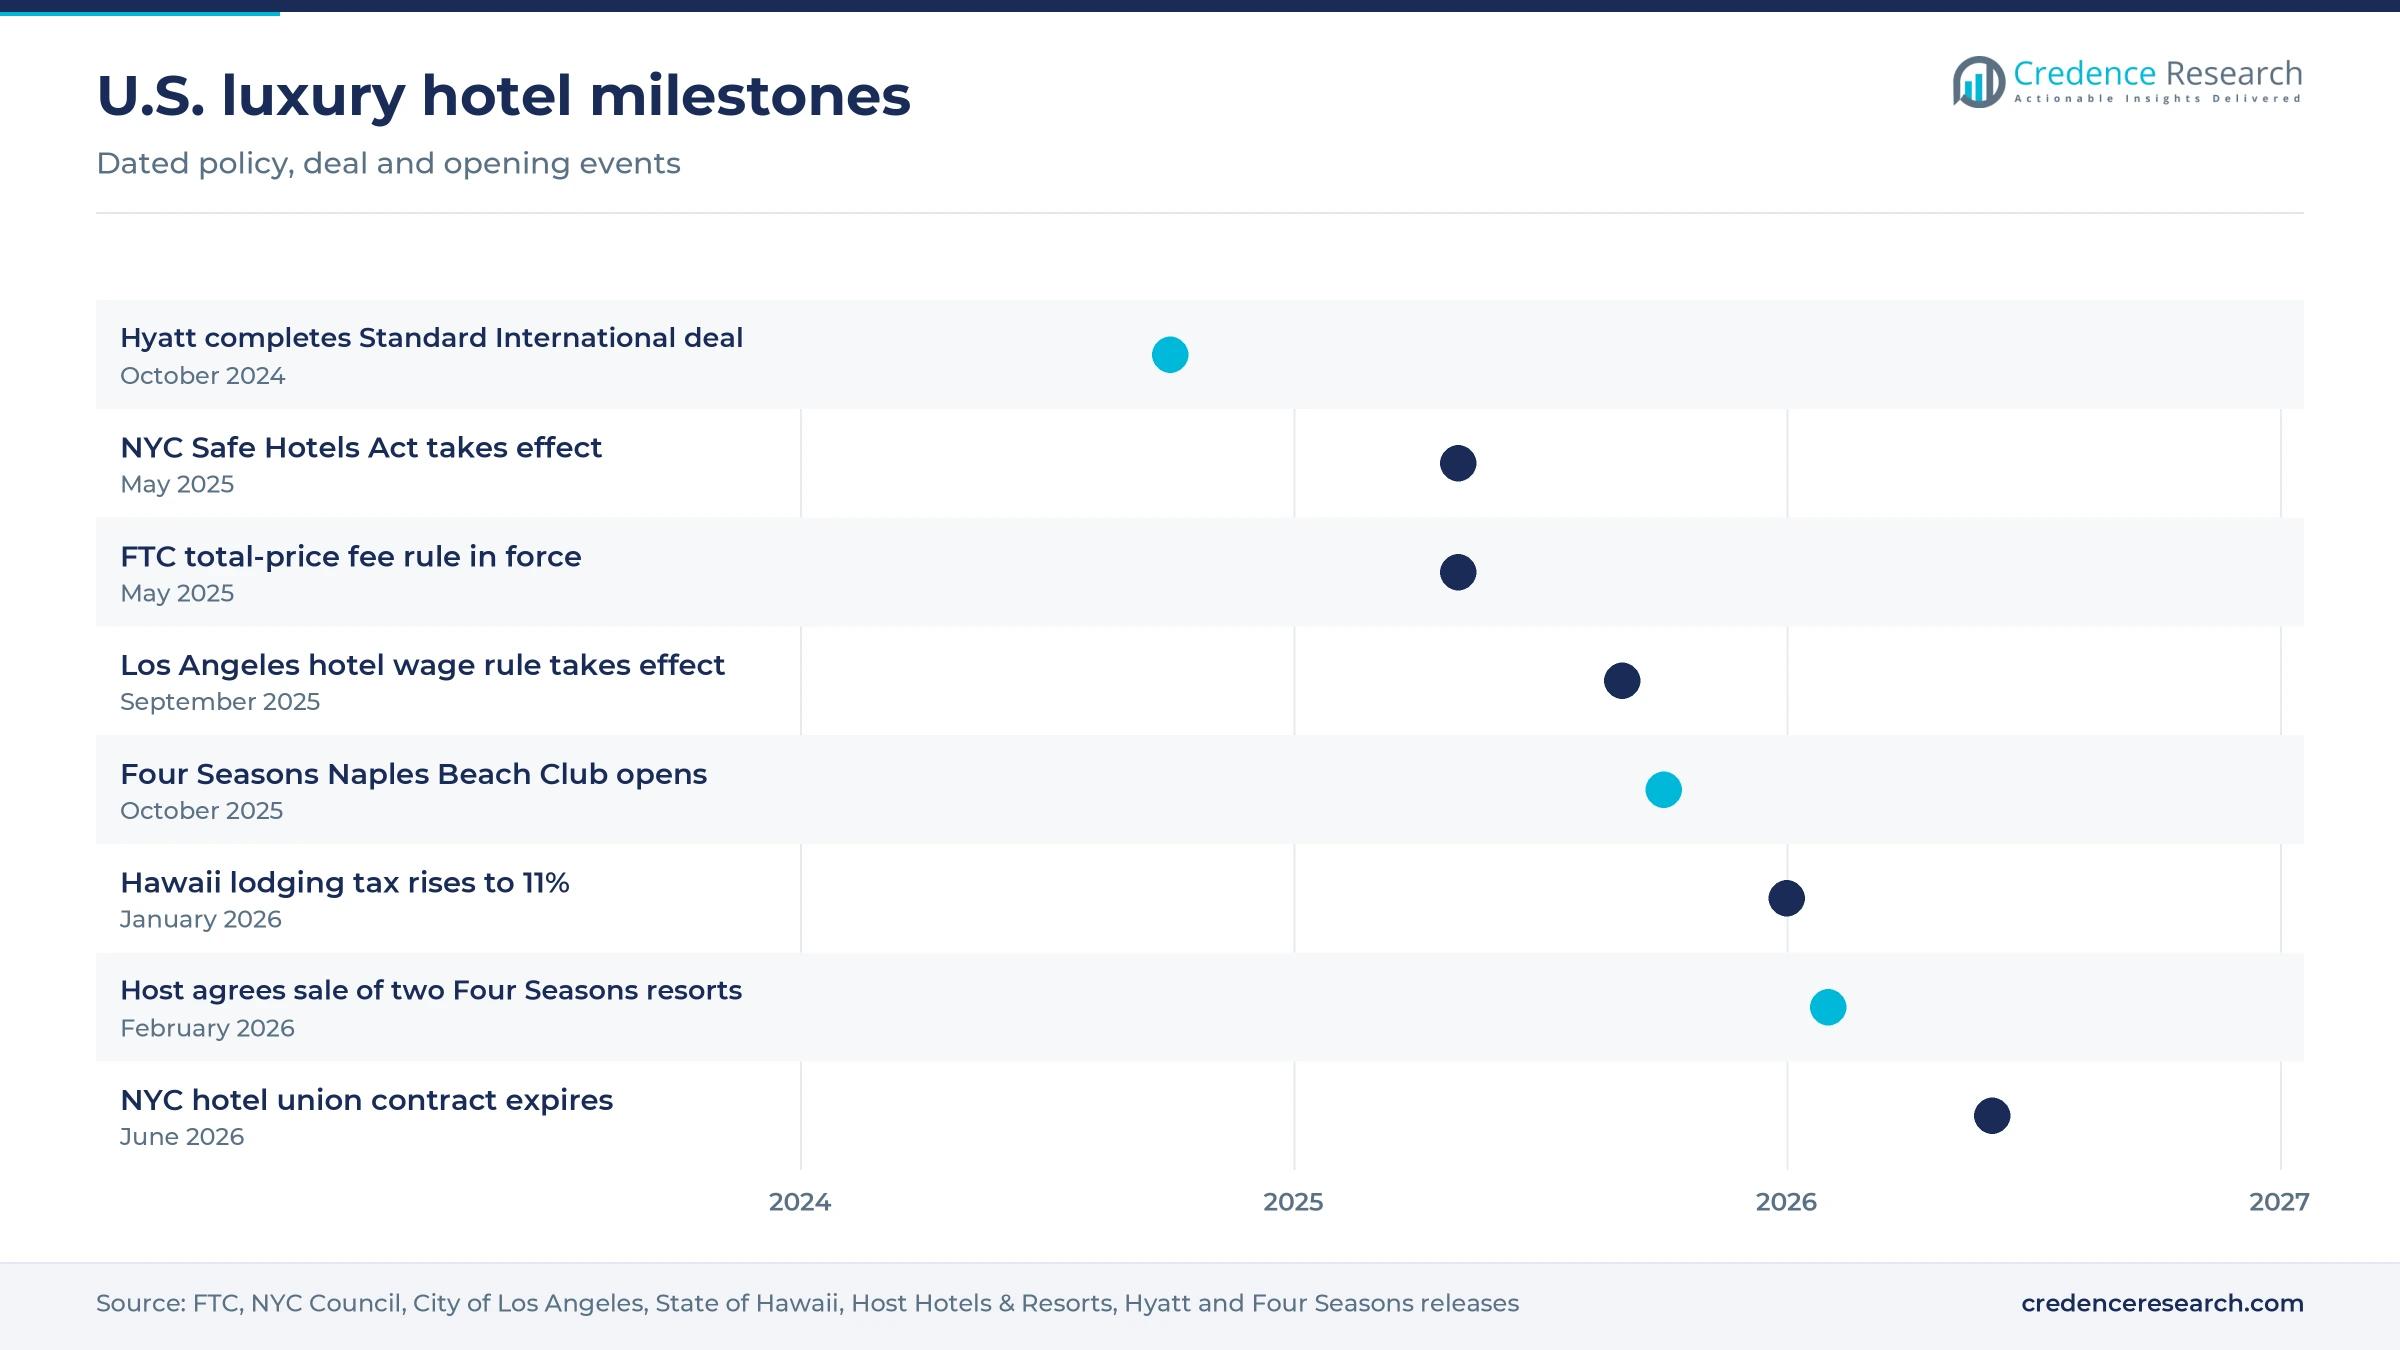
Large loyalty programs give brand-affiliated luxury hotels a cheaper path to repeat guests than commissions paid to intermediaries. Marriott ended 2025 with nearly 271 million Bonvoy members and grew its net rooms by more than 4.3%, according to its full-year results. Hyatt completed its purchase of Standard International on Oct. 1, 2024, adding 22 open hotels and more than 30 signed projects to a new lifestyle group. IHG said in January 2025 that its six luxury and lifestyle brands made up 20% of its global pipeline, nearly double the share of five years earlier. Independent owners now weigh brand fees against the direct bookings that these networks deliver, and many choose to join one.
High build costs keep new luxury supply scarce
New luxury rooms are expensive and slow to build, which protects the rate power of existing hotels in prime locations. HVS put the average development cost of a U.S. luxury hotel at USD 1,961,964 per room in its July 2026 survey, with building and site work the largest component. Lodging Econometrics counted a record 95 luxury projects with 22,045 rooms in the U.S. pipeline at the end of 2025. Host Hotels & Resorts agreed in February 2026 to sell two Four Seasons resorts with 569 keys for USD 1.1 billion, close to the cost of building them new. Investors in hospitality real estate buy scarce existing resorts rather than wait years for new ones to open.
Branded residences finance new luxury projects
Residential sales now finance many new luxury hotels, because condominium buyers pay premiums for a hotel brand and its services. Four Seasons opened Naples Beach Club in October 2025 with 220 rooms alongside 153 residences, on the site of the former Naples Beach Hotel & Golf Club in Florida. Aman plans branded residences next to Aman Miami Beach, which is set to open in 2028 as its second urban U.S. hotel. Mandarin Oriental closed its Brickell Key hotel in April 2025 to build a 121-key hotel and 228 residences, due in 2030. HVS noted that mixed-use projects with a residential element push luxury cost per room higher. Developers with presales can still start projects that a hotel-only budget would not support.
Conversions, all-in pricing and wellness resorts gain
Conversions rise as independents join brand systems
Conversions are rising as owners of independent luxury hotels join brand systems instead of building new properties. Lodging Econometrics recorded a record 1,497 conversion projects with 148,981 rooms at the end of 2025, up 12% in projects from a year earlier. Host Hotels & Resorts noted in its 2025 annual report that conversions of independent hotels to upscale and luxury brands added supply in those segments, even as overall supply growth stayed low. Auberge Resorts Collection renamed itself Auberge Collection on Sept. 29, 2025, with 30 hotels, resorts and residences. Brands gain rooms quickly this way, while owners trade some independence for distribution.
All-in pricing shifts how luxury rates are quoted
Room rates are shifting toward all-in quotes, as federal rules and new taxes make the full cost of a stay visible at booking. The Federal Trade Commission rule on unfair or deceptive fees took effect on May 12, 2025, and requires hotels to show the total price, including most mandatory fees, more prominently than other prices. Hawaii raised its transient accommodations tax by 0.75 percentage points to 11% from Jan. 1, 2026, under Act 96, the first such green fee in the country. Travel Market Report calculated that the new rate means USD 44 of state tax each night on a USD 400 room. Resorts that relied on separate amenity fees must now show them inside the advertised rate, which raises headline prices.
Wellness resorts open room for new premium demand
Wellness-led resorts are an opening because guests pay more for spas, programs and natural settings than for rooms alone. IHG has signed Six Senses Telluride in Colorado and Six Senses Riverstone Estate near Foxburg, Pennsylvania, both set to open in 2028. Its Regent Santa Monica Beach, highlighted in January 2025, includes a 10,000-square-foot Guerlain Wellness spa. Rosewood listed Rosewood Calistoga in Napa among its upcoming U.S. projects in December 2025. These projects tie the category to spa resorts and longer stays built around treatments. Operators that can staff treatment programs all year earn more per guest than room-only resorts.
Advisor and card programs open a high-value channel
Travel advisors and card travel desks are an opening because their clients book longer, higher-value stays with added perks. Virtuoso reported in August 2025 that consumers seeking advisors through its website rose 76%, and that its U.S. inbound sales rose 4% from January through July. American Express said its Fine Hotels + Resorts benefits averaged about USD 550 in value per two-night stay on 2025 bookings. From Jan. 1, 2027, those stays must last at least two nights to qualify for the Platinum lodging credit, which nudges guests toward longer trips and ties into high-end travel planning services. Hotels that fund breakfast, credits and upgrades for these programs win guests who rarely compare prices on online agencies.
Weak inbound travel and rising labor costs test owners
Fewer foreign visitors and higher visa costs cut demand
International demand weakened in 2025, which hurts gateway hotels that rely on long-stay foreign guests. International arrivals to the U.S. fell 5.5% to 68.3 million in 2025, according to National Travel and Tourism Office data, with visitors from Canada down 20.9%. The One Big Beautiful Bill Act of 2025 also created a USD 250 visa integrity fee on approved nonimmigrant visas, although the timing of its collection has remained unclear. Hotels in New York, Miami and Los Angeles must replace lost foreign nights with domestic demand, usually for shorter stays.
Wage rules and union contracts lift labor costs
Labor rules in the largest gateway cities raise fixed costs faster than room rates. Los Angeles set a hotel minimum wage of USD 22.50 an hour from July 2025, rising to USD 30 by July 2028, for hotels with more than 60 rooms. New York City's Safe Hotels Act, in effect since May 3, 2025, requires hotels with 100 or more rooms to employ core staff directly. Host Hotels & Resorts disclosed that the New York City hotel union contract expires in June 2026. Operators respond with service redesign, fewer outlets and selective rate increases.
Event demand has fallen short of hotel forecasts
Major events have not delivered the hotel demand that owners expected, which leaves rate plans exposed. Nearly 80% of more than 200 hotels in the 11 U.S. World Cup host cities said bookings were tracking below initial forecasts, according to an American Hotel & Lodging Association survey reported in May 2026. Las Vegas posted the largest RevPAR decline among the top 25 markets in 2025, down 10.9%, according to CoStar. Hotels that priced event nights early must cut rates late or accept empty rooms.
Luxury results still trailed owner budgets in 2025
Even the strongest class missed plans in 2025, which squeezes owners who set budgets on earlier rate growth. Actabl data showed luxury RevPAR finished 7.2% below budget for the year, although luxury margins still expanded. Host Hotels & Resorts said wage and benefit costs rose about 5% per available room in 2025 and expects wage and benefit inflation of about 5% again in 2026. Owners who borrowed at peak values face pressure on debt coverage when rates flatten.
Southern resorts and coastal gateways hold most value
| Region | Value, 2025 (USD billion) | Share, 2025 | CAGR, 2026–2035 |
|---|---|---|---|
| South | 11.72 | 37.5% | 5.9% |
| West | 7.81 | 25.0% | 5.6% |
| Midwest | 6.09 | 19.5% | 5.1% |
| Northeast | 5.62 | 18.0% | 5.2% |
The South leads as Florida and Texas add new resorts
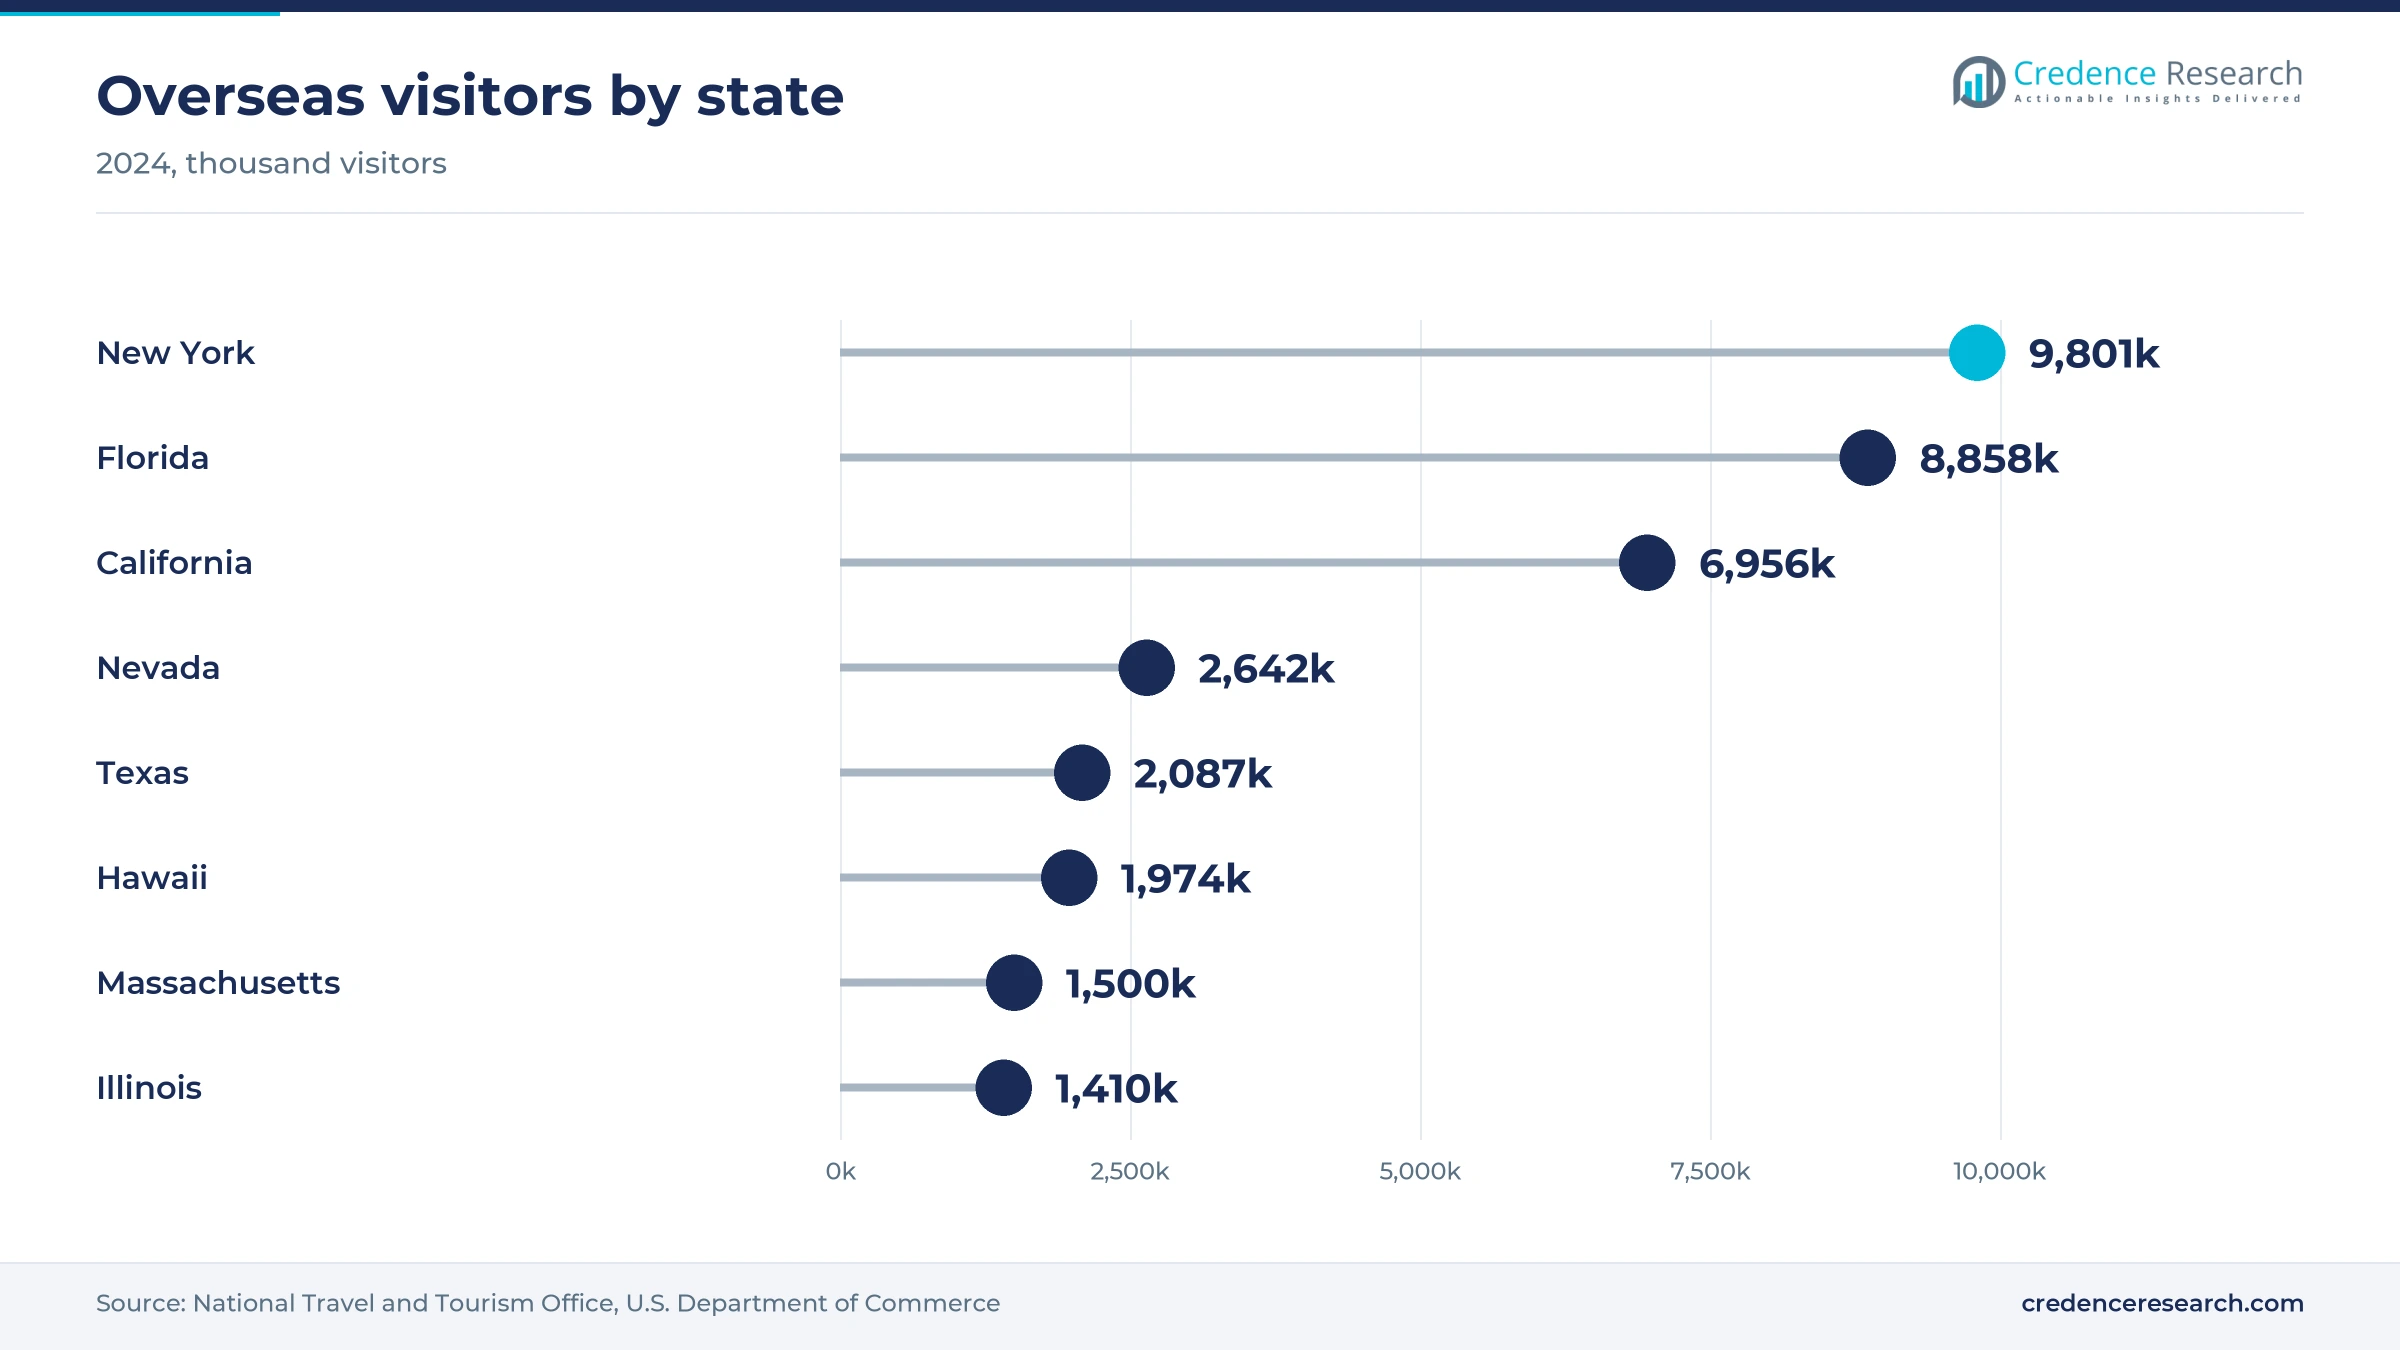
The South held 37.5% of 2025 value and grows at 5.9% a year, the fastest of the four regions. Florida drew 8.86 million overseas visitors in 2024, second only to New York, according to the National Travel and Tourism Office. The Census Bureau reported in June 2026 that all age groups in the South grew faster than in any other region from 2020 to 2025, which widens the affluent domestic base. New projects in Naples and Miami add supply, and Auberge plans openings in Dallas, Houston and Miami Beach from 2027.
The West earns high rates in resorts and coastal cities
The West held a 25.0% share of 2025 value and grows at 5.6% a year. California drew 6.96 million overseas visitors in 2024, Nevada 2.64 million and Hawaii 1.97 million, according to the National Travel and Tourism Office. San Francisco posted the largest RevPAR gain among the top 25 markets in 2025, up 11.8%, according to CoStar. Higher labor costs in Los Angeles and the new Hawaii tax weigh on margins, while the Six Senses Telluride project noted above and the Four Seasons resort in Jackson Hole show investor interest in mountain resorts.
The Midwest relies on business centers and group stays
The Midwest held a 19.5% share of 2025 value and grows at 5.1% a year, the slowest of the four regions. Illinois drew 1.41 million overseas visitors in 2024, according to the National Travel and Tourism Office, far fewer than the coastal states. St. Louis recorded the largest occupancy gain among the top 25 markets in 2025, up 6.5% to 61.7%, according to CoStar. Demand rests mostly on Chicago and other business centers, so the region depends more on corporate and group stays than coastal resort regions do.
The Northeast centers on New York City demand
The Northeast held an 18.0% share of 2025 value and grows at 5.2% a year. New York drew 9.80 million overseas visitors in 2024, the most of any state, according to the National Travel and Tourism Office, and Massachusetts drew 1.50 million. Licensing and direct-employment rules in New York City raise operating costs, as noted above. Countryside retreats are adding capacity outside the cities, as the Pendry Natirar and Riverstone Estate projects noted above show.
Acquisitions, rebrands and openings marked 2024 to 2026
| Development | Status and market relevance |
|---|---|
| In October 2024, Hyatt completed its acquisition of Standard International and its brands. | Completed; 22 open hotels and more than 30 signed projects |
| In April 2025, Mandarin Oriental closed its Miami hotel for redevelopment on Brickell Key. | Under construction; 121-key hotel and 228 residences due in 2030 |
| In September 2025, Auberge Resorts Collection rebranded as Auberge Collection. | Completed; 30 properties with new U.S. openings planned from 2027 |
| In October 2025, Four Seasons opened Naples Beach Club on the Florida Gulf Coast. | Open; 220 rooms and 153 residences |
| In February 2026, Host Hotels & Resorts agreed to sell two Four Seasons resorts for USD 1.1 billion. | Announced; Orlando and Jackson Hole resorts with 569 keys |
Loyalty data and total-price booking reshape selling
- Loyalty and guest data platforms link stays, spending and preferences across brands, which lets networks market directly to affluent members and reward them for booking on brand sites.
- Total-price booking engines show mandatory fees inside the advertised rate, which the federal fee rule now requires for lodging sold in every state.
- Branded residence models pair a hotel with condominiums sold under its brand, which funds construction before the hotel opens and gives owners an earlier return on land.
- Wellness program design turns spas, fitness and treatments into bookable packages that raise spending per guest at resorts and fill rooms during quieter weeks.
Need a Custom Version of This Report?
Tailor the scope, geography, or segments to your exact requirements.
- Custom geography or segment scope
- Direct access to our analyst team
Brand networks and specialist operators split the top tier
Competition turns on loyalty reach, brand prestige and control of scarce sites. Marriott competes with Ritz-Carlton, St. Regis and other luxury brands across gateway cities and resorts, backed by the largest loyalty program. Hilton grows Waldorf Astoria, Conrad and LXR, while Hyatt added The Standard to its lifestyle portfolio in 2024 and IHG expands Six Senses and Regent. Four Seasons, in which Cascade Investment agreed in 2021 to take a 71.25% stake, competes with Rosewood, Aman and Mandarin Oriental on service and on residential partnerships with developers. Auberge Collection and Montage International build smaller resort portfolios, and Montage also runs Pendry. Owners and real estate investment trusts choose operators by fee terms, distribution and support for residential sales. Price competition stays limited at the top, because few hotels offer the same location and service level.
Brand networks, specialist operators and owners form three layers
The luxury supply side has three layers with very different economics. Brand networks such as Marriott, Hilton, Hyatt and IHG run many luxury brands under one loyalty system and earn fees on hotels that others own. Specialist operators such as Four Seasons, Rosewood, Aman, Mandarin Oriental, Auberge and Montage manage fewer, higher-priced hotels and lean on residences for growth. Owners such as Host Hotels & Resorts, which held 76 hotels with about 41,700 rooms in February 2026, carry the capital and the labor risk. Fee earners hold the steadiest margins, while sites, build costs and brand approval form the main barriers to entry.
Companies profiled and their roles in this market
| Company | Type | Role in the market |
|---|---|---|
| Marriott International | Brand network | Runs Ritz-Carlton and St. Regis hotels in cities and resorts |
| Four Seasons Hotels and Resorts | Specialist operator | Opened Naples Beach Club in Florida in October 2025 |
| Hyatt Hotels Corporation | Brand network | Completed the Standard International purchase in October 2024 |
| Hilton Worldwide Holdings | Brand network | Grows Waldorf Astoria, Conrad and LXR with direct booking |
| IHG Hotels & Resorts | Brand network | Signed Six Senses Telluride and Riverstone Estate for 2028 |
| Rosewood Hotels & Resorts | Specialist operator | Lists Rosewood Calistoga among upcoming U.S. projects |
| Mandarin Oriental Hotel Group | Specialist operator | Rebuilds its Miami hotel with residences for 2030 |
| Aman | Specialist operator | Plans Aman Miami Beach for 2028 after Aman New York |
| Auberge Collection | Resort operator | Rebranded in September 2025 with 30 properties |
| Montage International | Specialist operator | Runs Montage and Pendry, including Pendry Natirar in New Jersey |
Rate power, not new rooms, carries growth to 2035
Credence Research's view is that U.S. luxury hotel value will grow mainly through rate power rather than through new rooms. Affluent guests kept paying more in 2025 while lower classes lost ground, and high build costs keep new supply thin. Branded residences and conversions are the main ways new rooms reach the market, which favors brands and operators with strong residential and loyalty platforms. The largest risks are a slowdown in affluent spending and labor rules in gateway cities, so owners with resort and domestic leisure exposure hold the steadier positions.
Room rates, supply and affluent spending anchor the estimate
The report uses 2025 as the base year and 2026 to 2035 as the forecast period. Market values come from the Credence Research model, which builds total hotel revenue from estimated luxury room supply, occupancy, published average daily rates and the share of revenue from dining, spa and events. Segment and regional splits are Credence Research estimates built from CoStar performance releases, Lodging Econometrics pipeline counts, National Travel and Tourism Office visitor data, Census Bureau population estimates, company filings and announcements, and published price lists. No interviews or primary surveys were conducted for this edition.
Premium rates and new resorts lift value through 2035
The U.S. luxury hotel market is expected to grow from USD 33.06 billion in 2026 to USD 53.74 billion by 2035 at a 5.55% CAGR. Rate growth should lead in the early years, while new supply arrives slowly through conversions and residential-backed resorts. Boutique retreats, celebration groups and advisor bookings will gain share, while gateway city hotels remain the largest category. The South will add the most value as Florida and Texas projects open. By 2035, a larger share of new luxury rooms is likely to sit inside mixed-use projects with branded residences.
Affluent spending and inbound recovery set the 2035 range
The 2035 range depends on how long affluent spending stays strong and on whether foreign visitors return. A downside case assumes a market correction that cuts affluent travel, inbound arrivals that stay below 2024 levels and labor costs that outpace rates. The base case assumes steady rate growth near recent trends and a gradual inbound recovery. An upside case needs a strong return of international guests after the 2026 and 2028 events and faster conversion of independent hotels into brand systems.
| Scenario | CAGR, 2026–2035 | Value, 2035 | What has to hold |
|---|---|---|---|
| Downside | 4.2% | USD 47.66 billion | Affluent travel slows, foreign arrivals stay weak and labor costs outpace room rates |
| Base | 5.55% | USD 53.74 billion | Rates rise near recent trends and inbound travel recovers gradually from 2027 |
| Upside | 6.7% | USD 59.01 billion | Foreign guests return strongly and conversions add brand rooms quickly |
Frequently Asked Questions
How big is the U.S. luxury hotel market?
Which product category leads U.S. luxury hotel spending?
Which U.S. region leads the market?
How did luxury hotels perform in 2025?
Why is new luxury supply limited?
How did international travel affect luxury hotels?
Who are the key companies in the U.S. luxury hotel market?
Which distribution channel grows fastest?
Table of Content
Chapter 1 Market Segmentation
- 1.1 Segmentation Framework
- 1.1.1 Product and Service Classification
- 1.1.2 Application and End-Use Classification
- 1.1.3 Technology and Solution Classification
- 1.1.4 Customer and Distribution Channel Classification
- 1.1.5 Geographic Segmentation
- 1.1.6 Market Segment Definitions and Boundaries
- 1.2 By Product Category
- 1.2.1 Gateway City Hotels
- 1.2.2 Destination Resorts
- 1.2.3 Boutique Retreats
- 1.3 By Customer Type
- 1.3.1 Domestic Private Travelers
- 1.3.2 International Private Travelers
- 1.3.3 Organizational Buyers
- 1.4 By Purchase Occasion
- 1.4.1 Leisure Stays
- 1.4.2 Group and Celebration Stays
- 1.4.3 Business Stays
Chapter 2 Introduction
- 2.1 Report Objectives and Scope
- 2.2 Product Definition and Industry Terminology
- 2.3 Market Inclusions and Exclusions
- 2.4 Research Process
- 2.4.1 Primary Research and Expert Interviews
- 2.4.2 Secondary Research and Source Review
- 2.4.3 Top-Down and Bottom-Up Estimation
- 2.4.4 Data Triangulation and Verification
- 2.5 Market Size Measurement Basis
- 2.5.1 2025: USD 31.24 billion → 2035: USD 53.74 billion
- 2.6 Historical and Forecast Reference Periods
- 2.6.1 Historical Period: 2018-2025
- 2.6.2 Base Year: 2025
- 2.6.3 Forecast Period: 2025-2035
- 2.7 Research Assumptions and Limitations
Chapter 3 Executive Summary
- 3.1 Market Snapshot and Key Findings
- 3.2 Base-Year Market Size, 2025
- 3.3 Forecast Market Size, 2035
- 3.4 Revenue and Volume Growth Outlook
- 3.5 Key Demand and Supply Indicators
- 3.6 Leading Market Segments
- 3.7 Fastest-Growing Market Opportunities
- 3.8 Regional Performance Highlights
- 3.9 Technology and Industry Transformation
- 3.10 Competitive Landscape Summary
- 3.11 Analyst View and Strategic Implications
Chapter 4 US Luxury Hotel Market Trends and Developments
- 4.1 Historical Industry Development, 2018-2025
- 4.2 Recent Market Trends and Developments
- 4.3 Demand and Customer Behavior Trends
- 4.4 Technology and Product Innovation
- 4.5 Artificial Intelligence, Automation and Digitalization
- 4.6 Local Manufacturing and Supply Chain Realignment
- 4.7 Industry Partnerships, Mergers and Acquisitions
- 4.8 Sustainability and Circular Economy Developments
- 4.9 Government and Private Sector Investment Trends
- 4.10 Emerging Business Models and Commercialization
- 4.11 Industry Developments and Announcements
Chapter 5 US Luxury Hotel Market Supply and Demand Analysis
- 5.1 Demand Trend and Consumption Analysis, 2018-2025
- 5.2 Demand Forecast, 2025-2035
- 5.3 Supply Chain Structure and Procurement Trends
- 5.4 Supply-Demand Gap and Bottlenecks
- 5.5 Import Dependence and Sourcing Structure
- 5.6 Regional Supply and Demand Concentration
Chapter 6 US Luxury Hotel Market Pricing Analysis
- 6.1 Pricing Structure and Measurement
- 6.2 Historical Pricing Trends, 2018-2025
- 6.3 Pricing Outlook, 2025-2035
- 6.4 Pricing by Product and Market Segment
- 6.5 Geographic Pricing Differences
- 6.6 Key Input, Energy, Labor and Logistics Costs
- 6.7 Contract Pricing and Purchasing Models
- 6.8 Pricing Sensitivity and Competitive Positioning
- 6.9 Price, Margin and Profitability Implications
Chapter 7 US Luxury Hotel Market Dynamics
- 7.1 Market Growth Drivers
- 7.1.1 Demand-Side Drivers
- 7.1.2 Technology and Innovation Drivers
- 7.1.3 Infrastructure and Investment Drivers
- 7.1.4 Regulatory and Policy Drivers
- 7.2 Market Restraints
- 7.2.1 Cost and Affordability Constraints
- 7.2.2 Technology and Adoption Barriers
- 7.2.3 Supply Chain and Operational Constraints
- 7.3 Market Challenges
- 7.3.1 Competitive Pressure and Margin Erosion
- 7.3.2 Skills, Infrastructure and Implementation Gaps
- 7.4 Emerging Market Opportunities
- 7.5 Market Dynamics Impact and Time-Horizon Assessment
Chapter 8 US Luxury Hotel Value Chain Analysis
- 8.1 Industry Value Chain Overview
- 8.2 Upstream Suppliers and Critical Inputs
- 8.3 Technology and Component Providers
- 8.4 Manufacturing or Service Delivery
- 8.5 Distribution, Channel Partners and Integrators
- 8.6 Downstream Applications and End Users
- 8.7 Value Addition and Profit Pools
- 8.8 Vertical Integration and Outsourcing
- 8.9 Supplier Concentration and Risk
- 8.10 Supply Chain Localization and Resilience
Chapter 9 US Luxury Hotel Market Regulations and Policies
- 9.1 Relevant Laws, Standards and Compliance Frameworks
- 9.2 Product, Service, Safety and Quality Requirements
- 9.3 Government Policies, Incentives and Subsidies
- 9.4 Imports, Exports and Trade Barriers
- 9.5 Public Procurement and Local Content Requirements
- 9.6 Data Protection, AI and Cybersecurity Compliance
- 9.7 Upcoming Policy Changes and Market Implications
Chapter 10 US Luxury Hotel Market Hotspots and Opportunities
- 10.1 Market Opportunity Mapping and Growth Hotspots
- 10.2 High-Growth Applications and Customer Groups
- 10.3 Underserved Markets and White-Space Opportunities
- 10.4 Emerging Technology and Product Opportunities
- 10.5 New Capacity and Investment Hotspots
- 10.6 Market Entry and Expansion Opportunities
- 10.7 Distribution and Partnership Opportunities
- 10.8 Near-Term and Long-Term Commercial Potential
- 10.9 Opportunity Attractiveness and Execution Risks
Chapter 11 US Luxury Hotel Market Outlook, 2025-2035
- 11.1 Market Size and Analysis
- 11.1.1 Revenue (Market Measurement: 2025: USD 31.24 billion → 2035: USD 53.74 billion)
- 11.1.2 Historical Market Size, 2018-2025
- 11.1.3 Base-Year Market Size, 2025
- 11.2 Market Forecast, 2025-2035
- 11.2.1 Revenue Forecast to 2035
- 11.2.2 CAGR and Year-on-Year Growth
- 11.2.3 Incremental Revenue Opportunity
- 11.3 Forecast Assumptions and Scenario Analysis
- 11.3.1 Base-Case Forecast
- 11.3.2 Optimistic and Conservative Scenarios
- 11.3.3 Technology, Pricing and Policy Sensitivities
- 11.4 Market Attractiveness and Growth Outlook
Chapter 12 US Luxury Hotel Market Segmentation and Outlook
- 12.1 Segmentation Summary and Market Shares, 2025
- 12.2 Largest and Fastest-Growing Segments
- 12.3 By Product Category - Market Size and Forecast, 2025-2035
- 12.3.1 Segment Definition and Scope
- 12.3.2 Historical Market Size, 2018-2025
- 12.3.3 Revenue Forecast, 2025-2035
- 12.3.4 Base-Year Market Share, 2025
- 12.3.5 Segment CAGR and Growth Drivers
- 12.3.6 Subsegment Market Size and Forecast
- 12.3.6.1 Gateway City Hotels
- 12.3.6.2 Destination Resorts
- 12.3.6.3 Boutique Retreats
- 12.3.7 Subsegment Pricing and Adoption Trends
- 12.3.8 Leading Suppliers and Competition
- 12.3.9 Regional Demand and Opportunities
- 12.4 By Customer Type - Market Size and Forecast, 2025-2035
- 12.4.1 Segment Definition and Scope
- 12.4.2 Historical Market Size, 2018-2025
- 12.4.3 Revenue Forecast, 2025-2035
- 12.4.4 Base-Year Market Share, 2025
- 12.4.5 Segment CAGR and Growth Drivers
- 12.4.6 Subsegment Market Size and Forecast
- 12.4.6.1 Domestic Private Travelers
- 12.4.6.2 International Private Travelers
- 12.4.6.3 Organizational Buyers
- 12.4.7 Subsegment Pricing and Adoption Trends
- 12.4.8 Leading Suppliers and Competition
- 12.4.9 Regional Demand and Opportunities
- 12.5 By Purchase Occasion - Market Size and Forecast, 2025-2035
- 12.5.1 Segment Definition and Scope
- 12.5.2 Historical Market Size, 2018-2025
- 12.5.3 Revenue Forecast, 2025-2035
- 12.5.4 Base-Year Market Share, 2025
- 12.5.5 Segment CAGR and Growth Drivers
- 12.5.6 Subsegment Market Size and Forecast
- 12.5.6.1 Leisure Stays
- 12.5.6.2 Group and Celebration Stays
- 12.5.6.3 Business Stays
- 12.5.7 Subsegment Pricing and Adoption Trends
- 12.5.8 Leading Suppliers and Competition
- 12.5.9 Regional Demand and Opportunities
- 12.6 Segment Growth Comparison
- 12.7 Segment Attractiveness and Priority Matrix
Chapter 13 US Luxury Hotel End-Use and Application Market Outlook
- 13.1 End-Use Industry and Customer Demand Structure
- 13.2 Leading Applications and Customer Groups
- 13.3 End-Use Market Size, Share and Forecast
- 13.4 Major End-Use Industry Deep Dives
- 13.4.1 Customer Requirements and Use Cases
- 13.4.2 Demand and Replacement Cycles
- 13.4.3 Technical and Regulatory Considerations
- 13.4.4 Purchasing and Procurement Models
- 13.4.5 Leading Vendors and Distribution Channels
- 13.4.6 Forecast and Commercial Opportunities
- 13.5 Emerging Applications and Cross-Segment Demand
- 13.6 End-Use Industry Investment Priorities
Chapter 14 US Luxury Hotel Geographic Market Outlook, 2025-2035
- 14.1 Domestic Market Distribution and Demand Clusters
- 14.2 State- or Province-Wise Market Size and Forecast, 2025-2035
- 14.3 City and Metropolitan Market Outlook
- 14.4 Industrial, Manufacturing and Commercial Clusters
- 14.5 Geographic Concentration of Key End Users
- 14.6 Local Pricing and Purchasing Differences
- 14.7 Domestic Production Facilities and Capacity Map
- 14.8 Local Infrastructure and Project Pipeline
- 14.9 State-Level Policy and Incentive Differences
- 14.10 Subnational Investment Hotspots and Opportunities
- 14.11 Distribution and Logistics Networks
- 14.12 Domestic Competitive Footprint
Chapter 15 US Luxury Hotel Technology, Innovation and Sustainability Outlook
- 15.1 Technology Landscape and Maturity
- 15.2 Product, Process and Service Innovation
- 15.3 AI, Automation and Digital Tools in the Industry
- 15.4 Technology Adoption and Performance Benchmarking
- 15.5 Innovation Pipeline and R&D Investment
- 15.6 Energy Efficiency and Resource Management
- 15.7 Sustainability, Recycling and Circularity
- 15.8 Technology Roadmap, 2025-2035
- 15.9 Risks of Obsolescence and Technology Substitution
Chapter 16 US Luxury Hotel Market Key Strategic Imperatives
- 16.1 Growth and Market Entry Priorities
- 16.2 High-Return Products and Segments
- 16.3 Pricing, Profitability and Cost Optimization
- 16.4 Technology Investment and Product Differentiation
- 16.5 Supply Chain Localization and Resilience
- 16.6 Distribution and Customer Acquisition
- 16.7 Partnership, Acquisition and Capacity Strategy
- 16.8 Regional Expansion Priorities
- 16.9 Short-, Medium- and Long-Term Actions
Chapter 17 Competition Outlook
- 17.1 Industry Competition Characteristics
- 17.2 Market Structure and Concentration
- 17.3 Market Share and Competitive Positioning, 2025
- 17.4 Company-Wise Revenue and Product Benchmarking
- 17.5 Production and Service Capacity Benchmarking
- 17.6 Technology, Pricing and Differentiation
- 17.7 Regional Footprint and Distribution Strength
- 17.8 Mergers, Acquisitions and Strategic Alliances
- 17.9 New Entrants and Competitive Threats
- 17.10 Porter's Five Forces and Industry Attractiveness
- 17.11 Competitive Outlook, 2025-2035
Chapter 18 Company Profiles
- 18.1 Company Coverage and Selection Criteria
- 18.2 Marriott International
- 18.2.1 Business Description
- 18.2.2 Company Ownership and Geographic Presence
- 18.2.3 Product and Service Portfolio
- 18.2.4 Manufacturing and Operating Footprint
- 18.2.5 Financial Performance and Investment
- 18.2.6 Market Share and Competitive Position
- 18.2.7 Technology and Innovation Capabilities
- 18.2.8 Strategic Alliances or Partnerships
- 18.2.9 Recent Developments
- 18.2.10 Growth Strategy and Outlook
- 18.3 Four Seasons Hotels and Resorts
- 18.4 Hyatt Hotels Corporation
- 18.5 Hilton Worldwide Holdings
- 18.6 IHG Hotels & Resorts
- 18.7 Rosewood Hotels & Resorts
- 18.8 Mandarin Oriental Hotel Group
- 18.9 Aman
- 18.10 Auberge Collection
- 18.11 Montage International
- 18.12 Other Relevant Market Participants
Note: Every listed company is profiled on the structure shown under the first company. The company list is preliminary and may change based on research findings, market developments, data availability and client requirements.
Chapter 19 Disclaimer
- 19.1 Research and Forecast Disclaimer
- 19.2 Data Source and Estimation Limitations
Note: The depth of individual sections depends on data availability for this market. Volume, capacity, trade and other unit-based metrics are included where applicable.

