
U.S. short-term rental cleaning follows every checkout
The U.S. short-term rental cleaning market was valued at USD 4.00 billion in 2025 and is projected to increase from USD 4.20 billion in 2026 to USD 6.52 billion by 2035, registering a CAGR of 5.00% during 2026–2035. Demand comes from hosts and property managers who pay crews to clean, launder linen, restock supplies and inspect homes between guest stays booked on Airbnb, Vrbo and direct sites. The Southeast held the largest regional share, 37.0% in 2025, supported by beach and mountain cabin markets, while the South Central region grows fastest at 5.50% a year as Texas cities add listings. Supply keeps expanding, and AirDNA counted 1.73 million available U.S. listings in November 2025. On the commercial side, Airbnb announced in October 2026 that hosts can no longer require guests to wash dishes or strip beds from Nov. 20, which moves more of each turnover onto paid cleaners.
What does paid cleaning for U.S. short-term rentals include?
The market counts what U.S. short-term rental hosts and property managers spend on turnover cleaning between stays, linen laundering and delivery, restocking of guest supplies and post-clean inspections. Value covers independent cleaners booked through apps, local cleaning companies on per-turnover rates and the housekeeping teams that property managers bill to owners for each stay.
The estimate excludes cleaning that owners perform themselves, routine janitorial work in hotels and apartment buildings, and repairs or maintenance sold on their own. Cleaning products and equipment bought at retail are also excluded, because they follow a different buyer path through stores and online sellers.
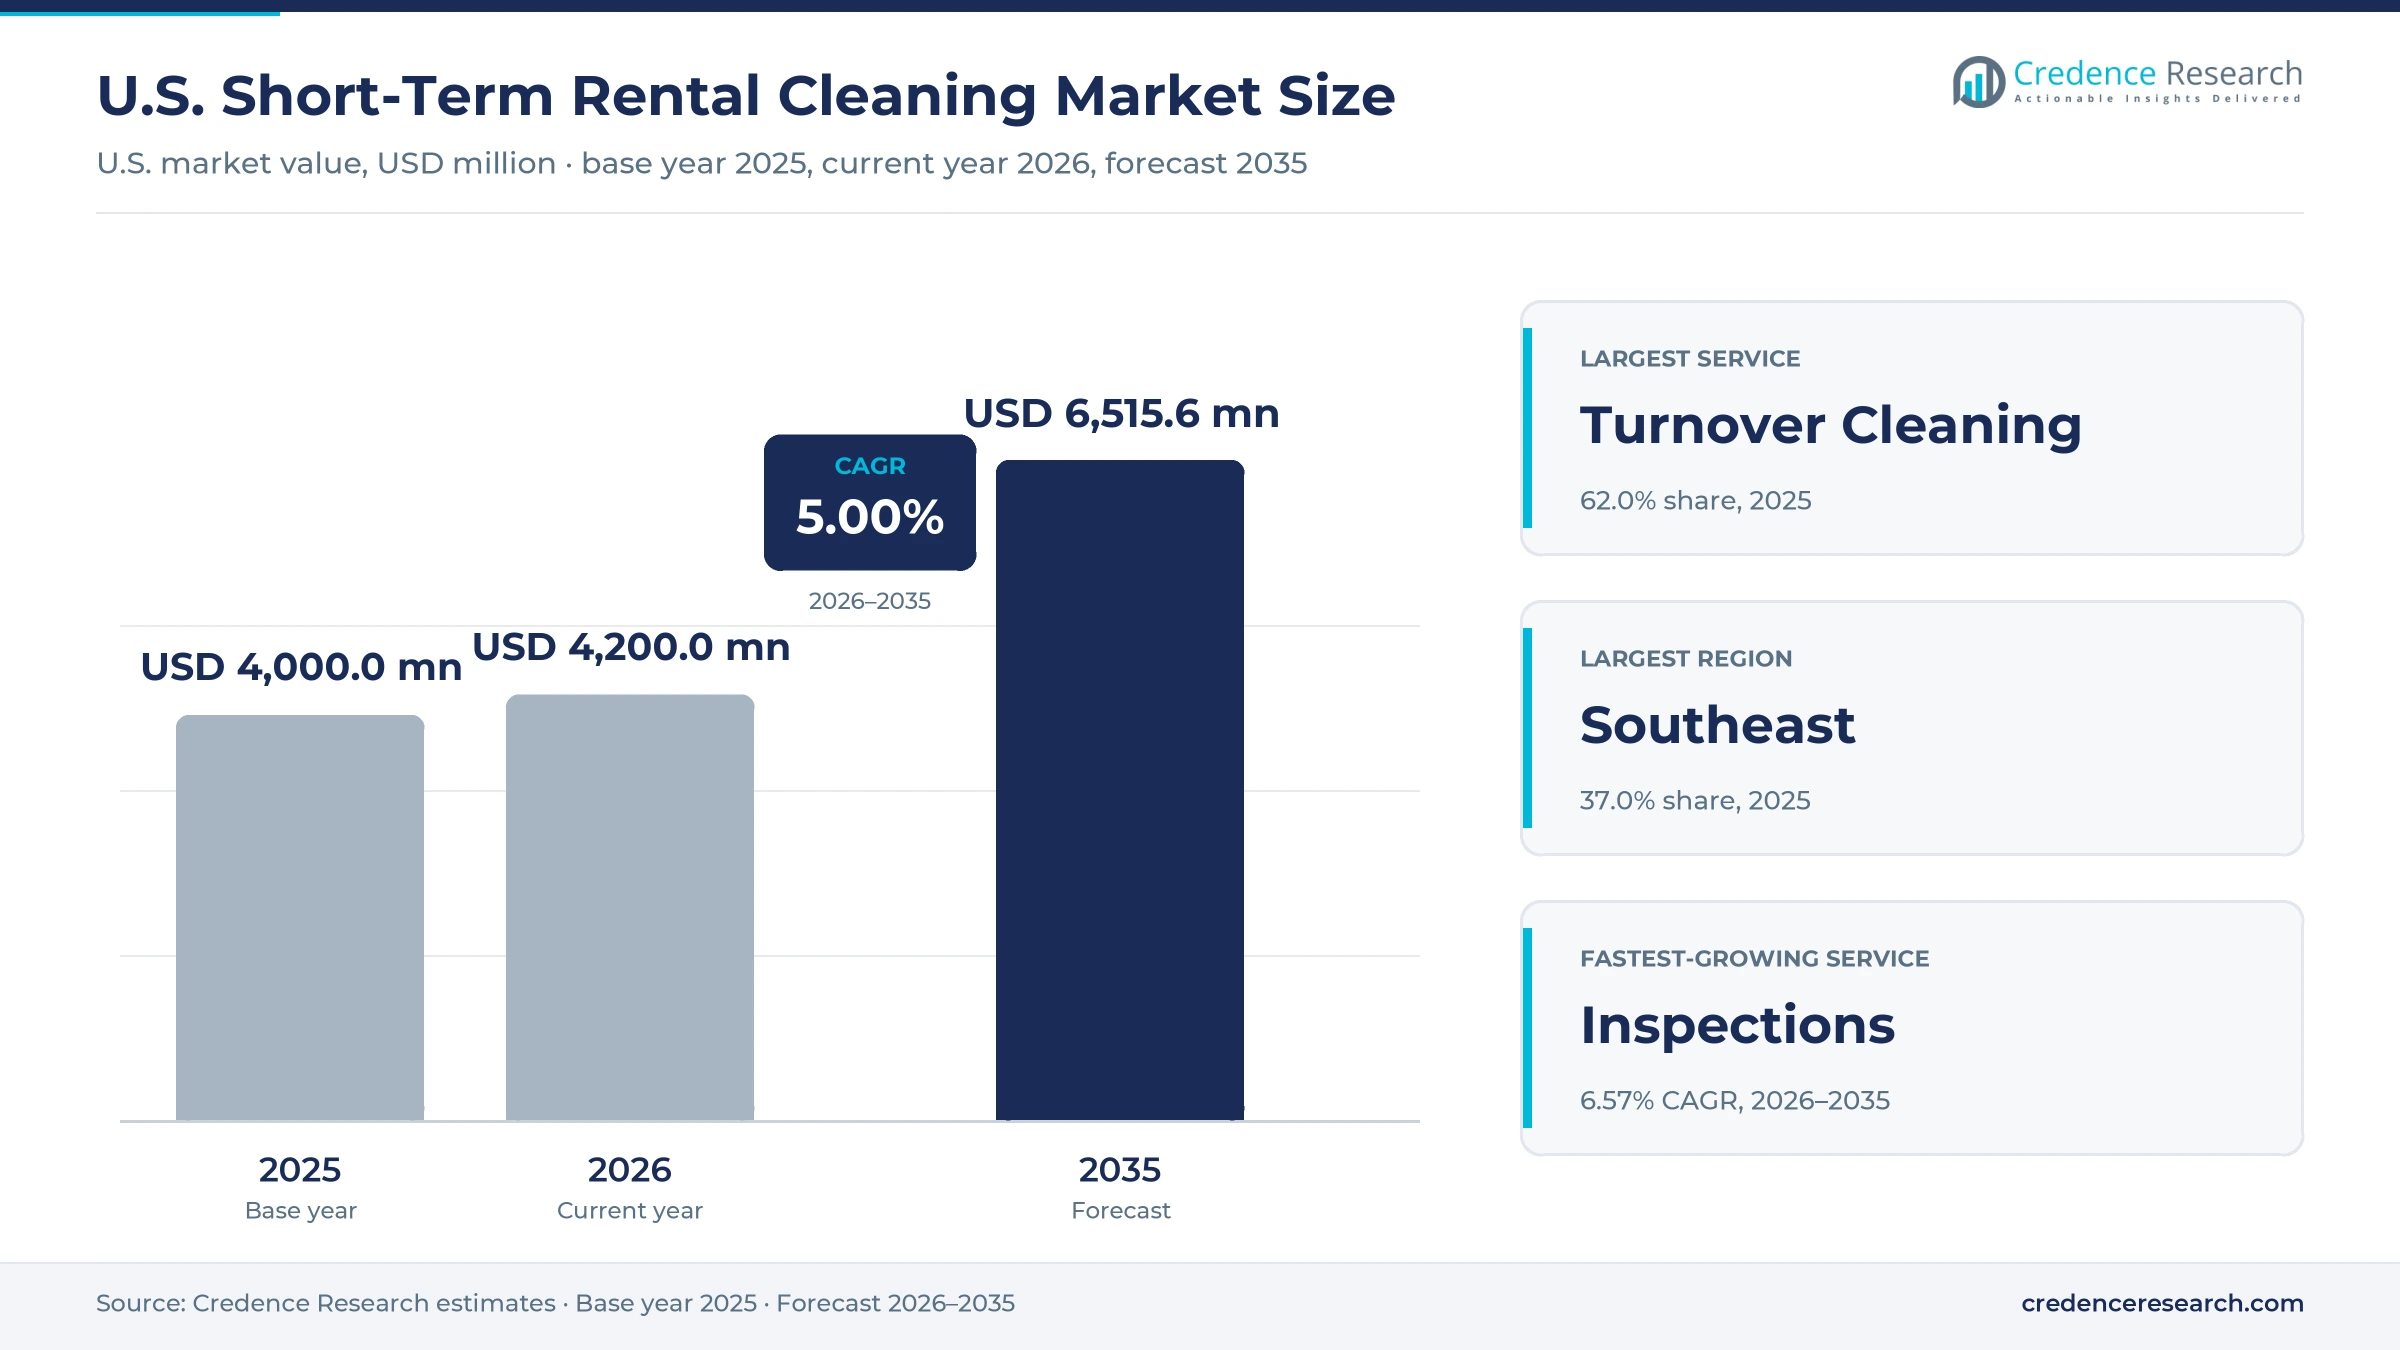
U.S. Short-Term Rental Cleaning Market Insights
- The market grows from USD 4.00 billion in 2025 to USD 6.52 billion by 2035, a 5.00% CAGR, as each booked stay creates a paid turnover for cleaners and managers.
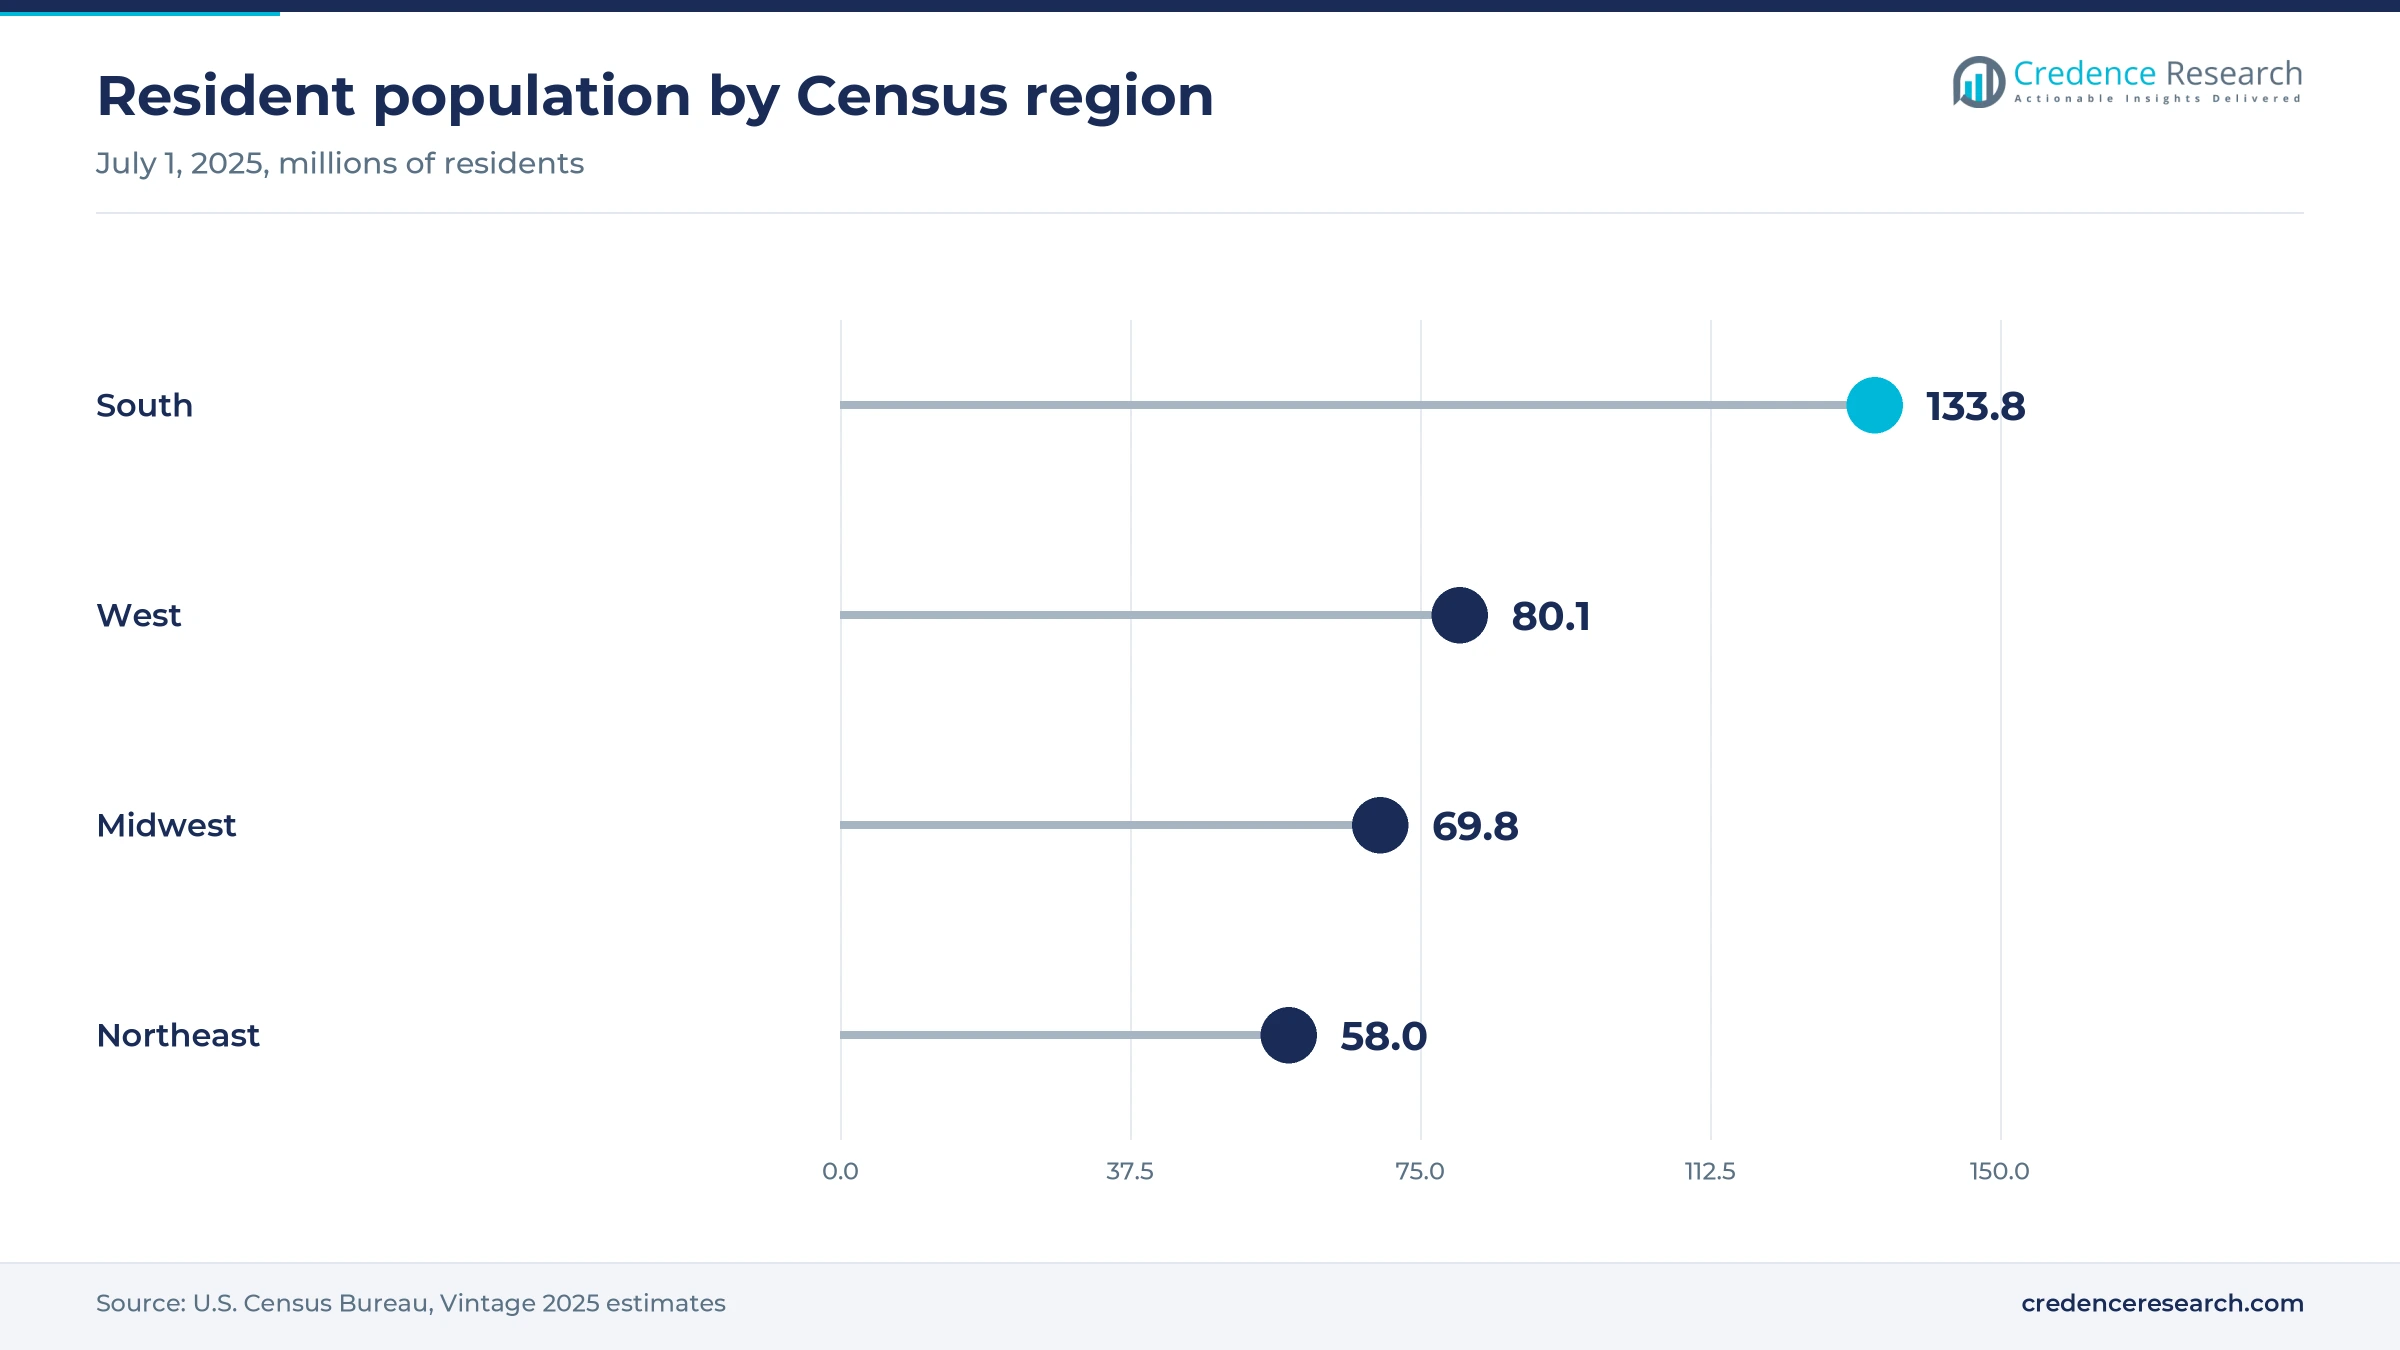
- The Southeast led with 37.0% of 2025 value, and the Census Bureau's South region, which includes the Southeast states, grew 6.0% from 2020 to 133.8 million residents in 2025.
- Turnover cleaning held 62.0% of 2025 value, as AirDNA found 89% of U.S. listings charged a cleaning fee in April 2025.
- Airbnb announced in October 2026 that from Nov. 20 hosts can no longer require guests to wash dishes, strip beds or take out trash.
- Casago completed its acquisition of Vacasa on May 1, 2025, creating a manager of more than 40,000 properties with local cleaning operations.
Turnover cleans lead while inspections grow fastest
Why does turnover cleaning lead the service mix?
Based on service, the market is categorized into turnover cleaning, linen, restocking and inspections. Turnover Cleaning led with 62.0% of 2025 value because nearly every stay ends in a full clean, and AirDNA counted about 1.5 million U.S. listings charging a cleaning fee in April 2025, with a one-bedroom average of $96. Linen and restocking are usually billed as add-ons to the same visit. Inspections grow fastest at 6.57% a year as Properly reports more than 15,000 photo inspections a month at $5 each, giving owners proof that a home meets its listing.
How do property managers and individual hosts split spending?
Based on host, the market is categorized into property managers and individual hosts. Property Managers led with 56.0% of 2025 value because large portfolios buy cleaning at scale, and Casago and Vacasa together manage more than 40,000 properties after their May 1, 2025, merger. Breezeway serves more than 3,500 such clients with housekeeping tools. Individual hosts grow fastest at 5.39% a year as Airbnb bars hosts from requiring guests to wash dishes or strip beds from Nov. 20, 2026, while Turno lists more than 126,000 cleaners for single-listing owners.
Why do marketplace stays generate most cleaning jobs?
Based on booking, the market is categorized into marketplaces and direct bookings. Marketplaces led with 78.0% of 2025 value because Airbnb and Vrbo carry most U.S. stays, and Airbnb alone booked 158 million nights and seats in North America in 2025, according to its annual report, and each of those stays triggers a paid turnover. Direct bookings grow fastest at 6.00% a year as Hospitable reported a 91% rise in direct-channel revenue to $53.7 million in 2025, and direct hosts tend to buy hotel-style cleaning to justify their rates.
| Segment Group | Leading Sub-segment | Share, 2025 | Fastest-growing Sub-segment | CAGR, 2026–2035 |
|---|---|---|---|---|
| By Service | Turnover Cleaning | 62.0% | Inspections | 6.57% |
| By Host | Property Managers | 56.0% | Individual | 5.39% |
| By Booking | Marketplaces | 78.0% | Direct | 6.00% |
Request a Free Sample
Fill in your details and we'll send you a free sample report.
- Sample data tables & charts
- Research methodology
Booked stays, manager mergers and software lift volume
Booked stays create a steady stream of turnover jobs
Every checkout creates a paid cleaning job, so booked nights translate almost directly into work for crews and cleaning companies. Airbnb reported in its annual report for 2025 that North America nights and seats booked rose 3% to 158 million, while North America gross booking value reached $40.3 billion, a figure that includes cleaning fees. According to AirDNA data published by Skift in May 2025, 89% of U.S. listings, about 1.5 million properties, charged a cleaning fee, with a one-bedroom average of $96. Because hosts rarely skip a clean between stays, this demand recurs through every season. In the Credence Research model this adds about 1.95 percentage points to annual growth to 2035.
Property managers hand turnovers to outside crews
Professional managers are consolidating portfolios, and larger portfolios lean on local cleaning partners to cover scattered homes. Casago completed its acquisition of Vacasa on May 1, 2025, creating a manager with more than 40,000 properties across North America, Belize, Costa Rica and the Caribbean, according to the company release. Evolve then bought the Guestworks portfolio of about 1,000 homeowners on Nov. 24, 2025. Evolve sends booking alerts to local cleaning partners, who schedule each turnover and are paid directly by owners. In turn, each portfolio transfer moves a block of recurring turnovers into managed contracts. In the Credence Research model this adds about 1.35 percentage points to annual growth to 2035.
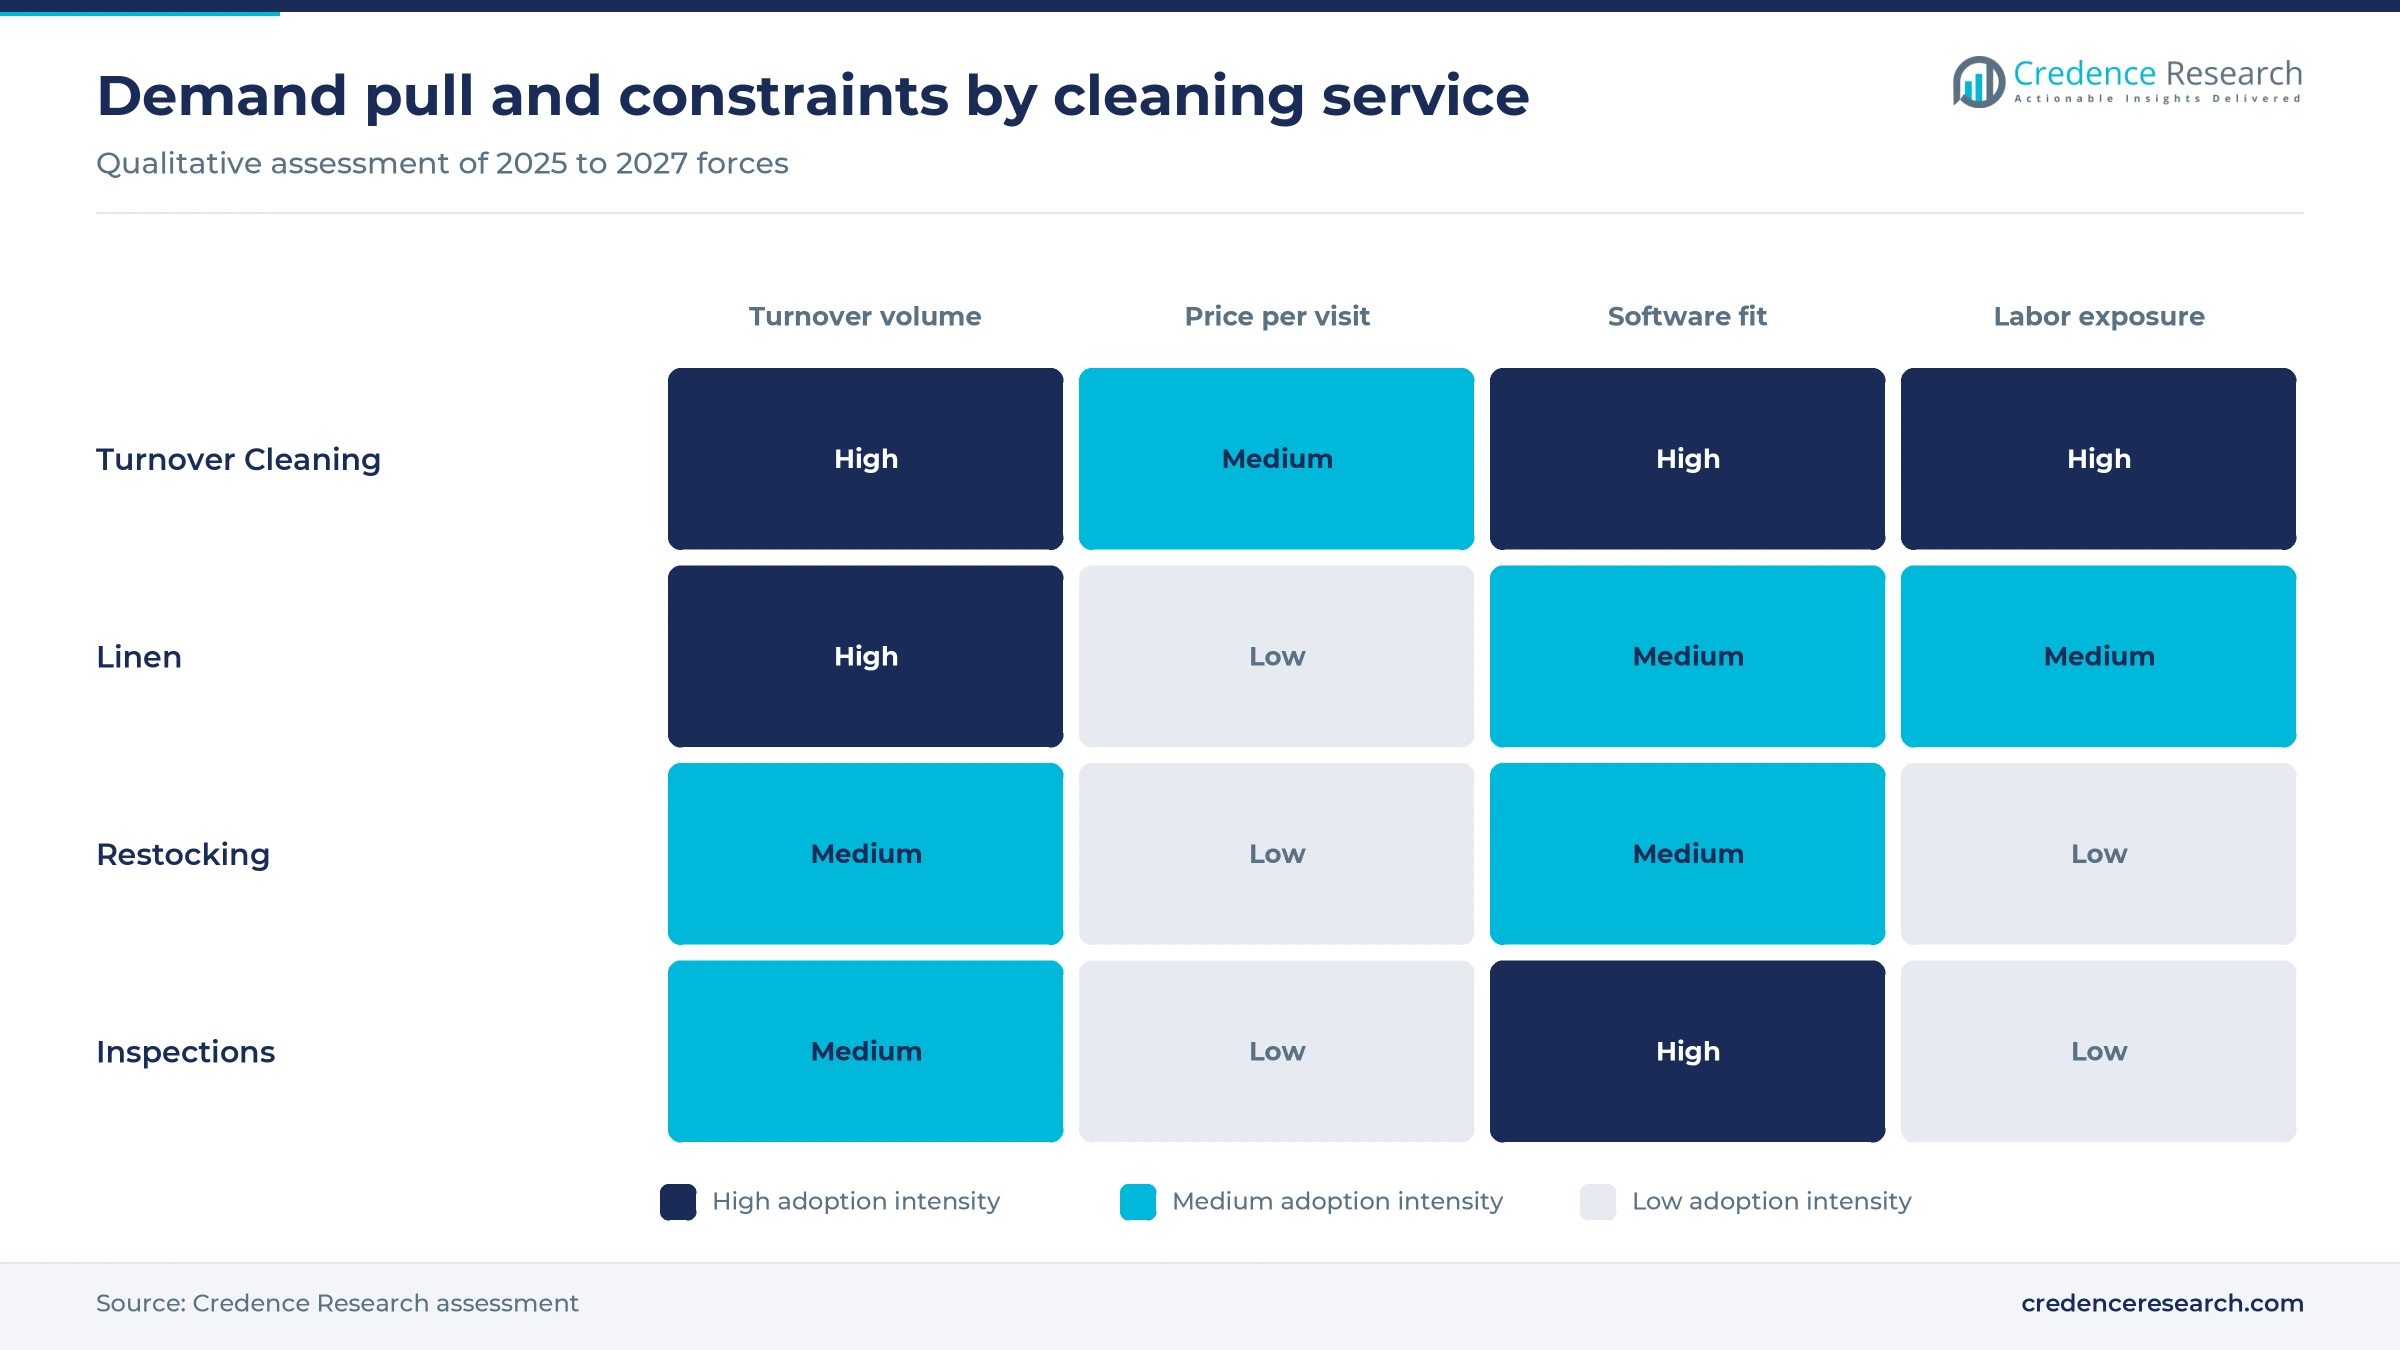
Scheduling software and service bundles lift utilization
Scheduling platforms raise the number of cleans each crew can finish, because jobs are assigned automatically from booking calendars. Breezeway, which announced a growth investment from Resurgens Technology Partners on March 3, 2026, says it powers operations for more than 265,000 properties across 85 countries. Hostaway raised $365 million at a $925 million valuation on Dec. 17, 2024, according to TechCrunch, to expand property management software that links bookings with task tools. Turno, founded in 2016, lists more than 126,000 cleaners in its marketplace for hosts who need cover. In the Credence Research model this adds about 0.90 percentage points to annual growth to 2035.
Event travel adds bursts of short stays and new listings
Major events pack many short stays into a few weeks, which multiplies turnovers per listing and brings first-time hosts into the market. U.S. host cities added more than 52,000 listings during the 2026 World Cup group stage, a 12% rise, according to the Financial Times as summarized by Guesty on July 22, 2026. Kansas City created a $50 major-event permit valid from May 3 to July 31, 2026, and received 234 permit applications between Dec. 12, 2025, and January, KCUR reported. AirDNA forecast in December 2025 that Philadelphia RevPAR would rise 6.3% in 2026. Each new event listing needs a cleaner from its first booking, which favors app-based marketplaces.
Checkout rules and photo inspections reshape turnovers
Shift of checkout chores from guests to paid crews
Platform rules are moving chores from guests to paid crews, which adds minutes and money to each turnover. Airbnb announced that from Nov. 20, 2026, hosts can no longer require guests to wash dishes, strip beds or take out the trash, as News4JAX reported on Oct. 22, 2026. Hosts may still ask guests to gather used towels and leave dishes in the sink. Airbnb is also standardizing house rules into seven categories that must be listed before booking. As a result, the cleaner absorbs tasks that guests often performed, and Individual hosts grow at 5.39% a year as single-listing owners buy that extra crew time.
Rise of photo-verified inspections after each clean
Photo inspections are emerging as a separate paid step, because owners want proof that each turnover meets the listing. Properly charges $5 for each expert-reviewed photo inspection and reports more than 15,000 inspections a month across its platform. Its Guest Support Plus service for small hosts costs $149 per listing a month and bundles turnover support with guest care. Breezeway, a provider of vacation property software, automates housekeeping and vendor coordination for more than 265,000 properties. Airbnb lists deep cleaning protection under AirCover for Hosts, which also rewards photo evidence after a damaging stay. These per-visit fees help Inspections grow at 6.57% a year.
Opening in linen pickup and delivery for hosts
Linen logistics offer an opening for laundries that can serve scattered homes on a fixed turnover schedule. Press Cleaners of Austin launched a specialized Airbnb linen service on July 22, 2025, letting hosts schedule pickups and deliveries in an app across Austin, Dallas, Fort Worth, Houston, San Antonio, Seattle, Chicago, Oklahoma City and Miami. The company says its gentle ironers can nearly double the life of sheets and towels, which lowers replacement costs for hosts. Linen work suits managers with many homes, as Casago and Vacasa now oversee more than 40,000 properties. AirDNA counted about 1.5 million U.S. listings charging a cleaning fee in April 2025, and each needs fresh sheets after every stay, so outsourced laundry frees crews to finish more cleans each day.
Opening in service bundles for direct-booking hosts
Direct-booking hosts create an opening for cleaning firms that sell bundled turnover, restocking and inspection packages. Hospitable reported on Dec. 17, 2025, that direct-channel revenue on its platform rose 91% to $53.7 million in 2025, saving hosts about $6.9 million in booking fees. Its platform data covered 7.02 million reservations booked during that year. Hosts who keep those fees often reinvest in hotel-style service to justify direct rates and win repeat guests. Evolve already introduces local cleaning partners to owners and sends them booking alerts, a model that direct hosts can copy. Direct bookings grow fastest at 6.00% a year in the Credence Research estimate.
Local limits, wage floors and fee pushback squeeze crews
Do local rental limits remove cleaning jobs?
City and county limits shrink the pool of listings that need turnovers. New York City began enforcing Local Law 18 on Sept. 5, 2023, and Airbnb describes the rules in its annual report as a de facto ban on short-term rentals in the city. Maui County Mayor Richard Bissen signed Bill 9 in December 2025, phasing out about 7,000 apartment-district rentals by Jan. 1, 2031, according to Hawaii Public Radio. Cleaning firms in those markets must move crews toward hotel and commercial work, where janitorial contractors already compete for labor.
How do rising wage floors squeeze turnover margins?
Wage floors push up labor cost per turnover faster than many hosts can raise fees. Florida raised its minimum wage to $14 an hour on Sept. 30, 2025, and set a further step to $15 on Sept. 30, 2026, according to ClickOrlando. Florida also requires human trafficking awareness training for vacation rental employees who clean units, according to a Florida Realtors guide. Small cleaning firms in the Southeast therefore carry higher payroll and training costs, which they recover only by raising per-clean prices.
Will guest pushback on fees cap cleaning prices?
Guest resistance to visible fees limits how far hosts can pass on cleaning costs. AirDNA found that 89% of U.S. listings carried a cleaning fee in April 2025, and a one-bedroom averaged $96, according to Skift. Airbnb has acknowledged that cleaning fees can create different expectations between hosts and travelers. Hosts facing fee comparisons often cut cleaner rates or clean the home themselves, which slows paid demand among single-listing owners and pushes crews to prove value.
Does softer occupancy cut the number of turnovers?
Softer occupancy means fewer stays per listing, so cleaners earn fewer jobs from each property they serve. AirDNA reported U.S. occupancy of 51.2% in November 2025, down 2.6% from a year earlier, as available listings rose 4.7% to 1.73 million. AirDNA's 2026 Outlook Report, as published by Albany CEO on Dec. 18, 2025, forecast a further 1% occupancy decline for 2026, with supply growing 4.6%. Crews in oversupplied markets therefore face idle days, and firms respond by bundling inspections and restocking to raise revenue per visit.
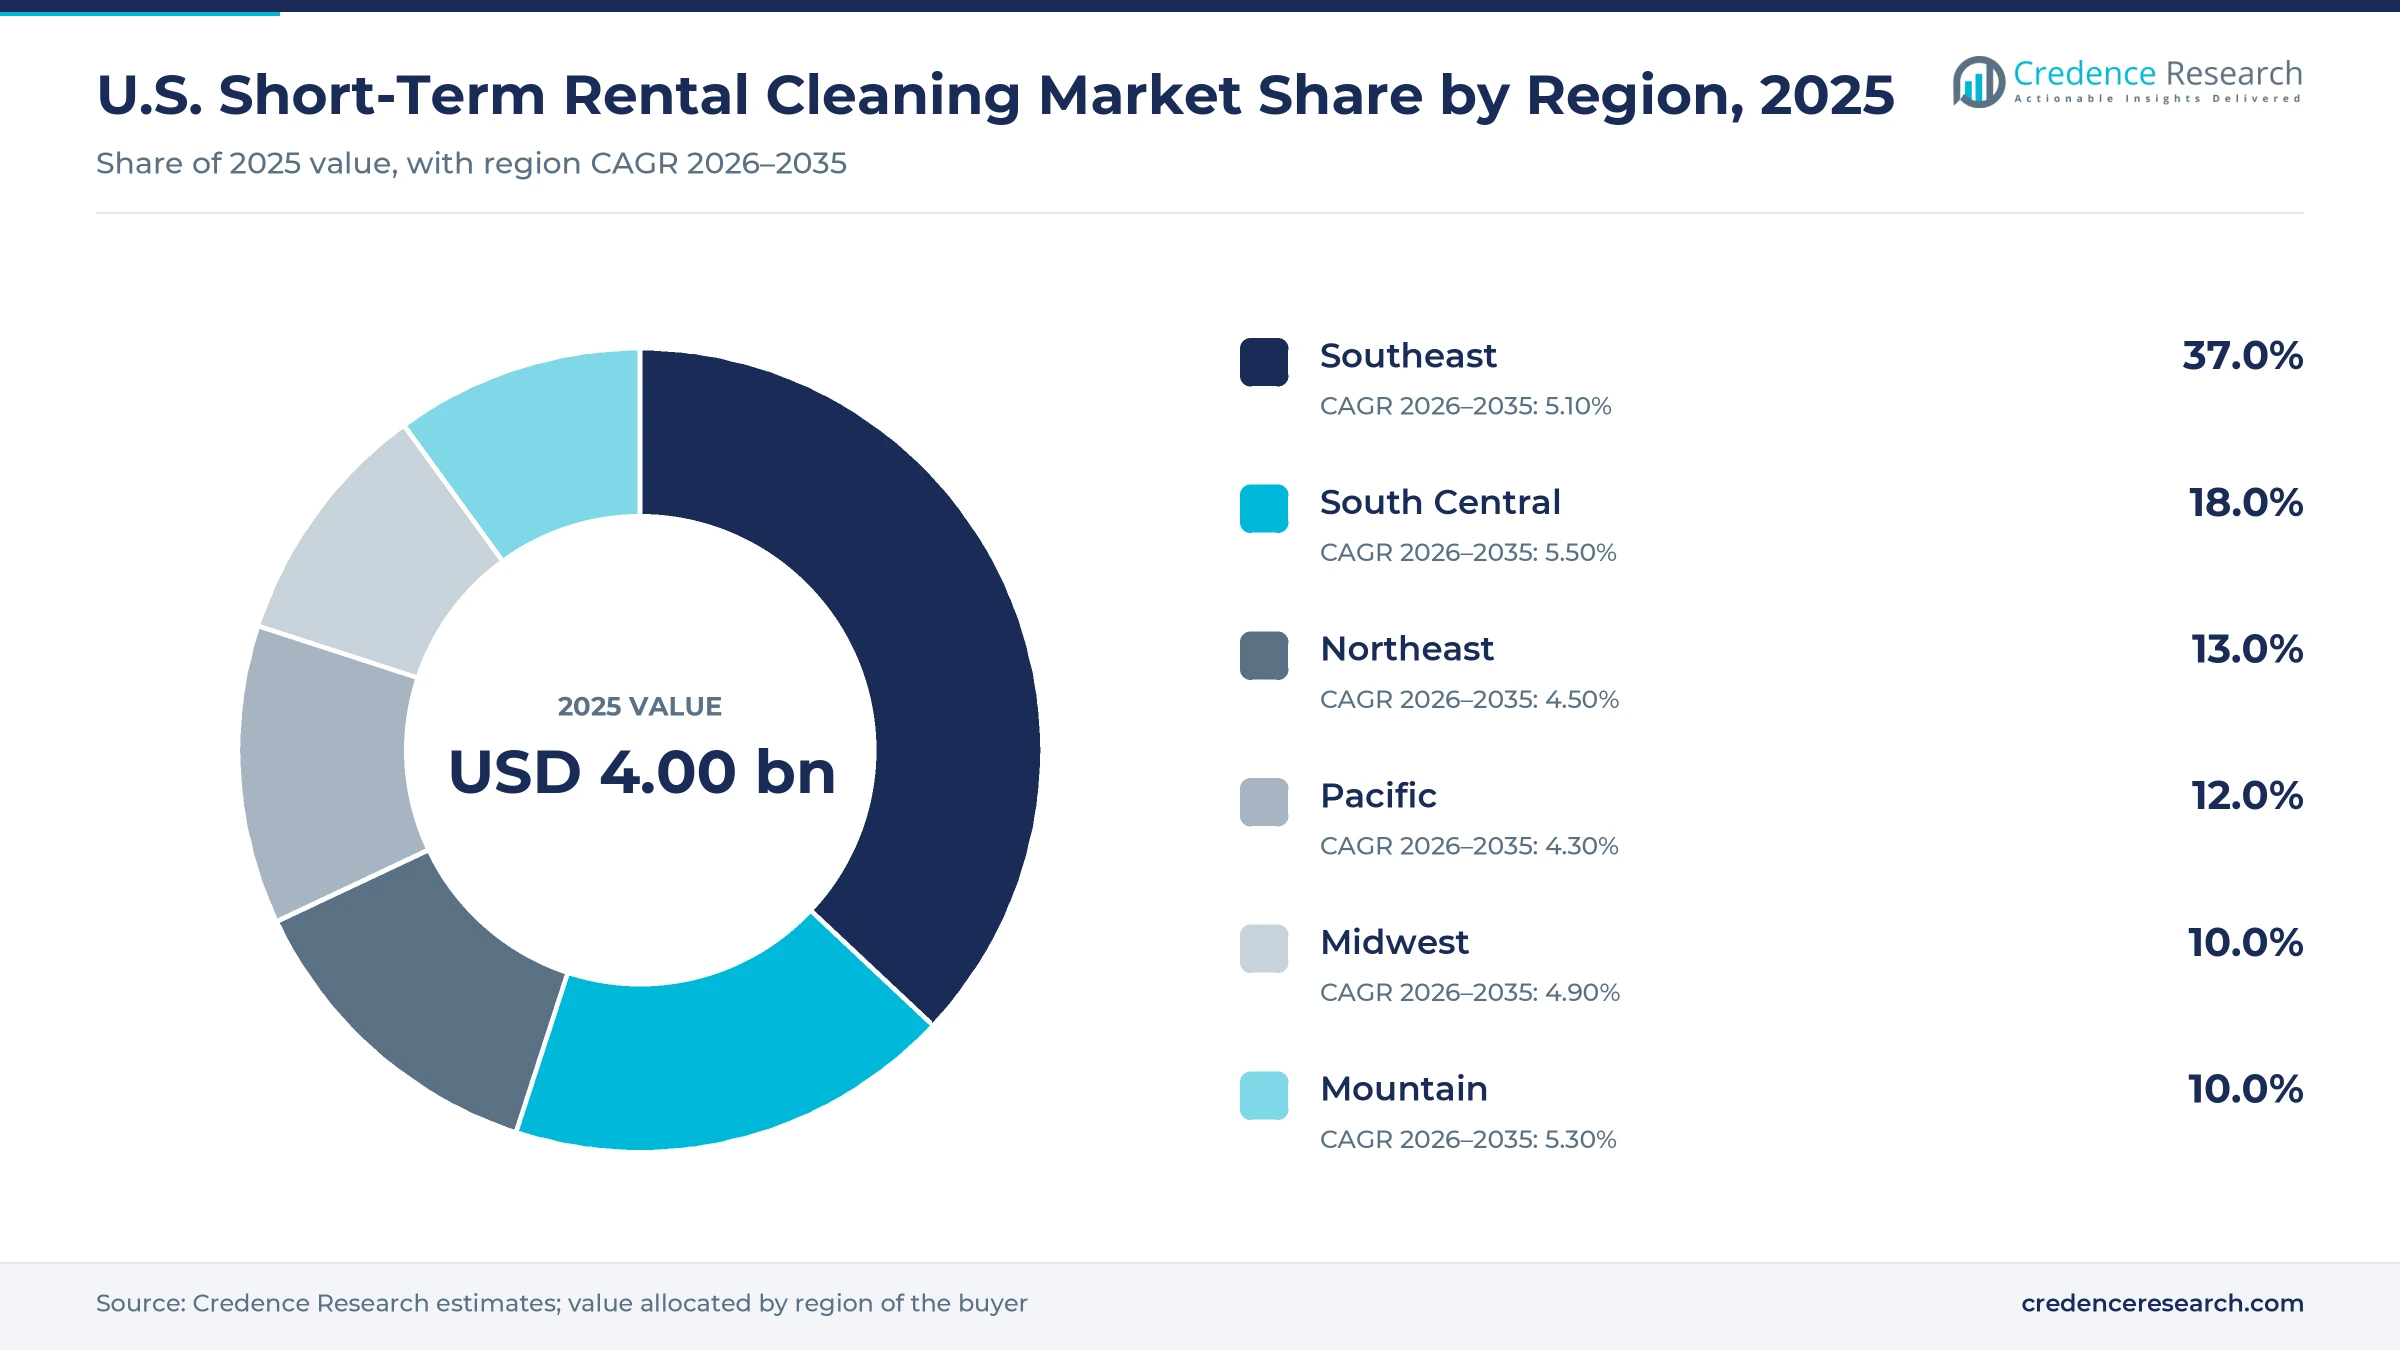
The Southeast holds the largest share of turnover work
| Region | Value, 2025 (USD billion) | Share, 2025 | CAGR, 2026–2035 |
|---|---|---|---|
| Southeast | 1.48 | 37.0% | 5.10% |
| South Central | 0.72 | 18.0% | 5.50% |
| Northeast | 0.52 | 13.0% | 4.50% |
| Pacific | 0.48 | 12.0% | 4.30% |
| Midwest | 0.40 | 10.0% | 4.90% |
| Mountain | 0.40 | 10.0% | 5.30% |
The Southeast leads on beach and mountain cabin stays
The Southeast held 37.0% of 2025 value and grows at 5.10% a year, the largest share among the six zones. Mountain cabin and beach markets drive volume, as AirDNA counted nearly 17,000 short-term rental units around Gatlinburg and Pigeon Forge in April 2023, according to WBIR. The Census Bureau's South region, which spans the Southeast and South Central zones, counted 133.8 million residents in 2025, up 6.0% since 2020. Florida also moved to a $14 minimum wage in September 2025, which lifts per-clean prices across the state.
South Central grows fastest on Texas city demand
The South Central region held 18.0% of 2025 value and grows at 5.50% a year, the fastest pace in the country. Texas cities lead the zone, and Guesty reported that Fort Worth booked rates rose 41% and Dallas rates rose 28% on July 14, 2026, during the World Cup. Press Cleaners, based in Austin, runs host linen pickups in Austin, Dallas, Fort Worth, Houston, San Antonio and Oklahoma City. AirDNA forecast in December 2025 that Dallas RevPAR would rise 5.5% in 2026.
The Northeast recovers outside New York City
The Northeast held 13.0% of 2025 value and grows at 4.50% a year, below the national rate. New York City enforced Local Law 18 from Sept. 5, 2023, which removed most short-term supply in the largest city of the zone. Elsewhere demand holds up, as Boston added about 1,000 new listings and occupancy rose to 81% during the 2026 World Cup, according to Guesty. AirDNA expects Philadelphia RevPAR to rise 6.3% in 2026, which supports cleaning volume in Pennsylvania.
The Pacific region absorbs the Maui phase-out
The Pacific region held 12.0% of 2025 value and grows at 4.30% a year, the slowest pace among the zones. Maui County Bill 9 phases out about 7,000 apartment-district rentals, with a West Maui deadline of Jan. 1, 2029, and Jan. 1, 2031, for the rest of the county. Transient vacation rentals make up 21% of county housing, according to Hawaii Public Radio. Los Angeles listings on Guesty posted 31% higher ADR during the 2026 World Cup, which helped city crews offset island losses.
The Midwest gains from event hosting in Kansas City
The Midwest held 10.0% of 2025 value and grows at 4.90% a year, close to the national rate. Lake and city markets dominate, and Kansas City drew 234 short-term rental permit applications from Dec. 12, 2025, through January 2026, according to KCUR. The city expected 800 to 1,000 rentals to be operating by the World Cup, and Guesty reported a 43% jump in Kansas City listings during the tournament. Press Cleaners also serves Chicago hosts with scheduled linen pickups.
The mountain region formalizes resort rentals
The Mountain region held 10.0% of 2025 value and grows at 5.30% a year, faster than the national rate. Ski and resort counties carry the zone, and Summit County, Utah, estimated 5,000 to 6,000 short-term rentals in June 2025, of which about 1,200 were licensed, according to KPCW. Licensing drives in areas with high vacation home ownership push owners toward managers that document each clean. Large resort cabins also need longer cleans and more linen per stay.
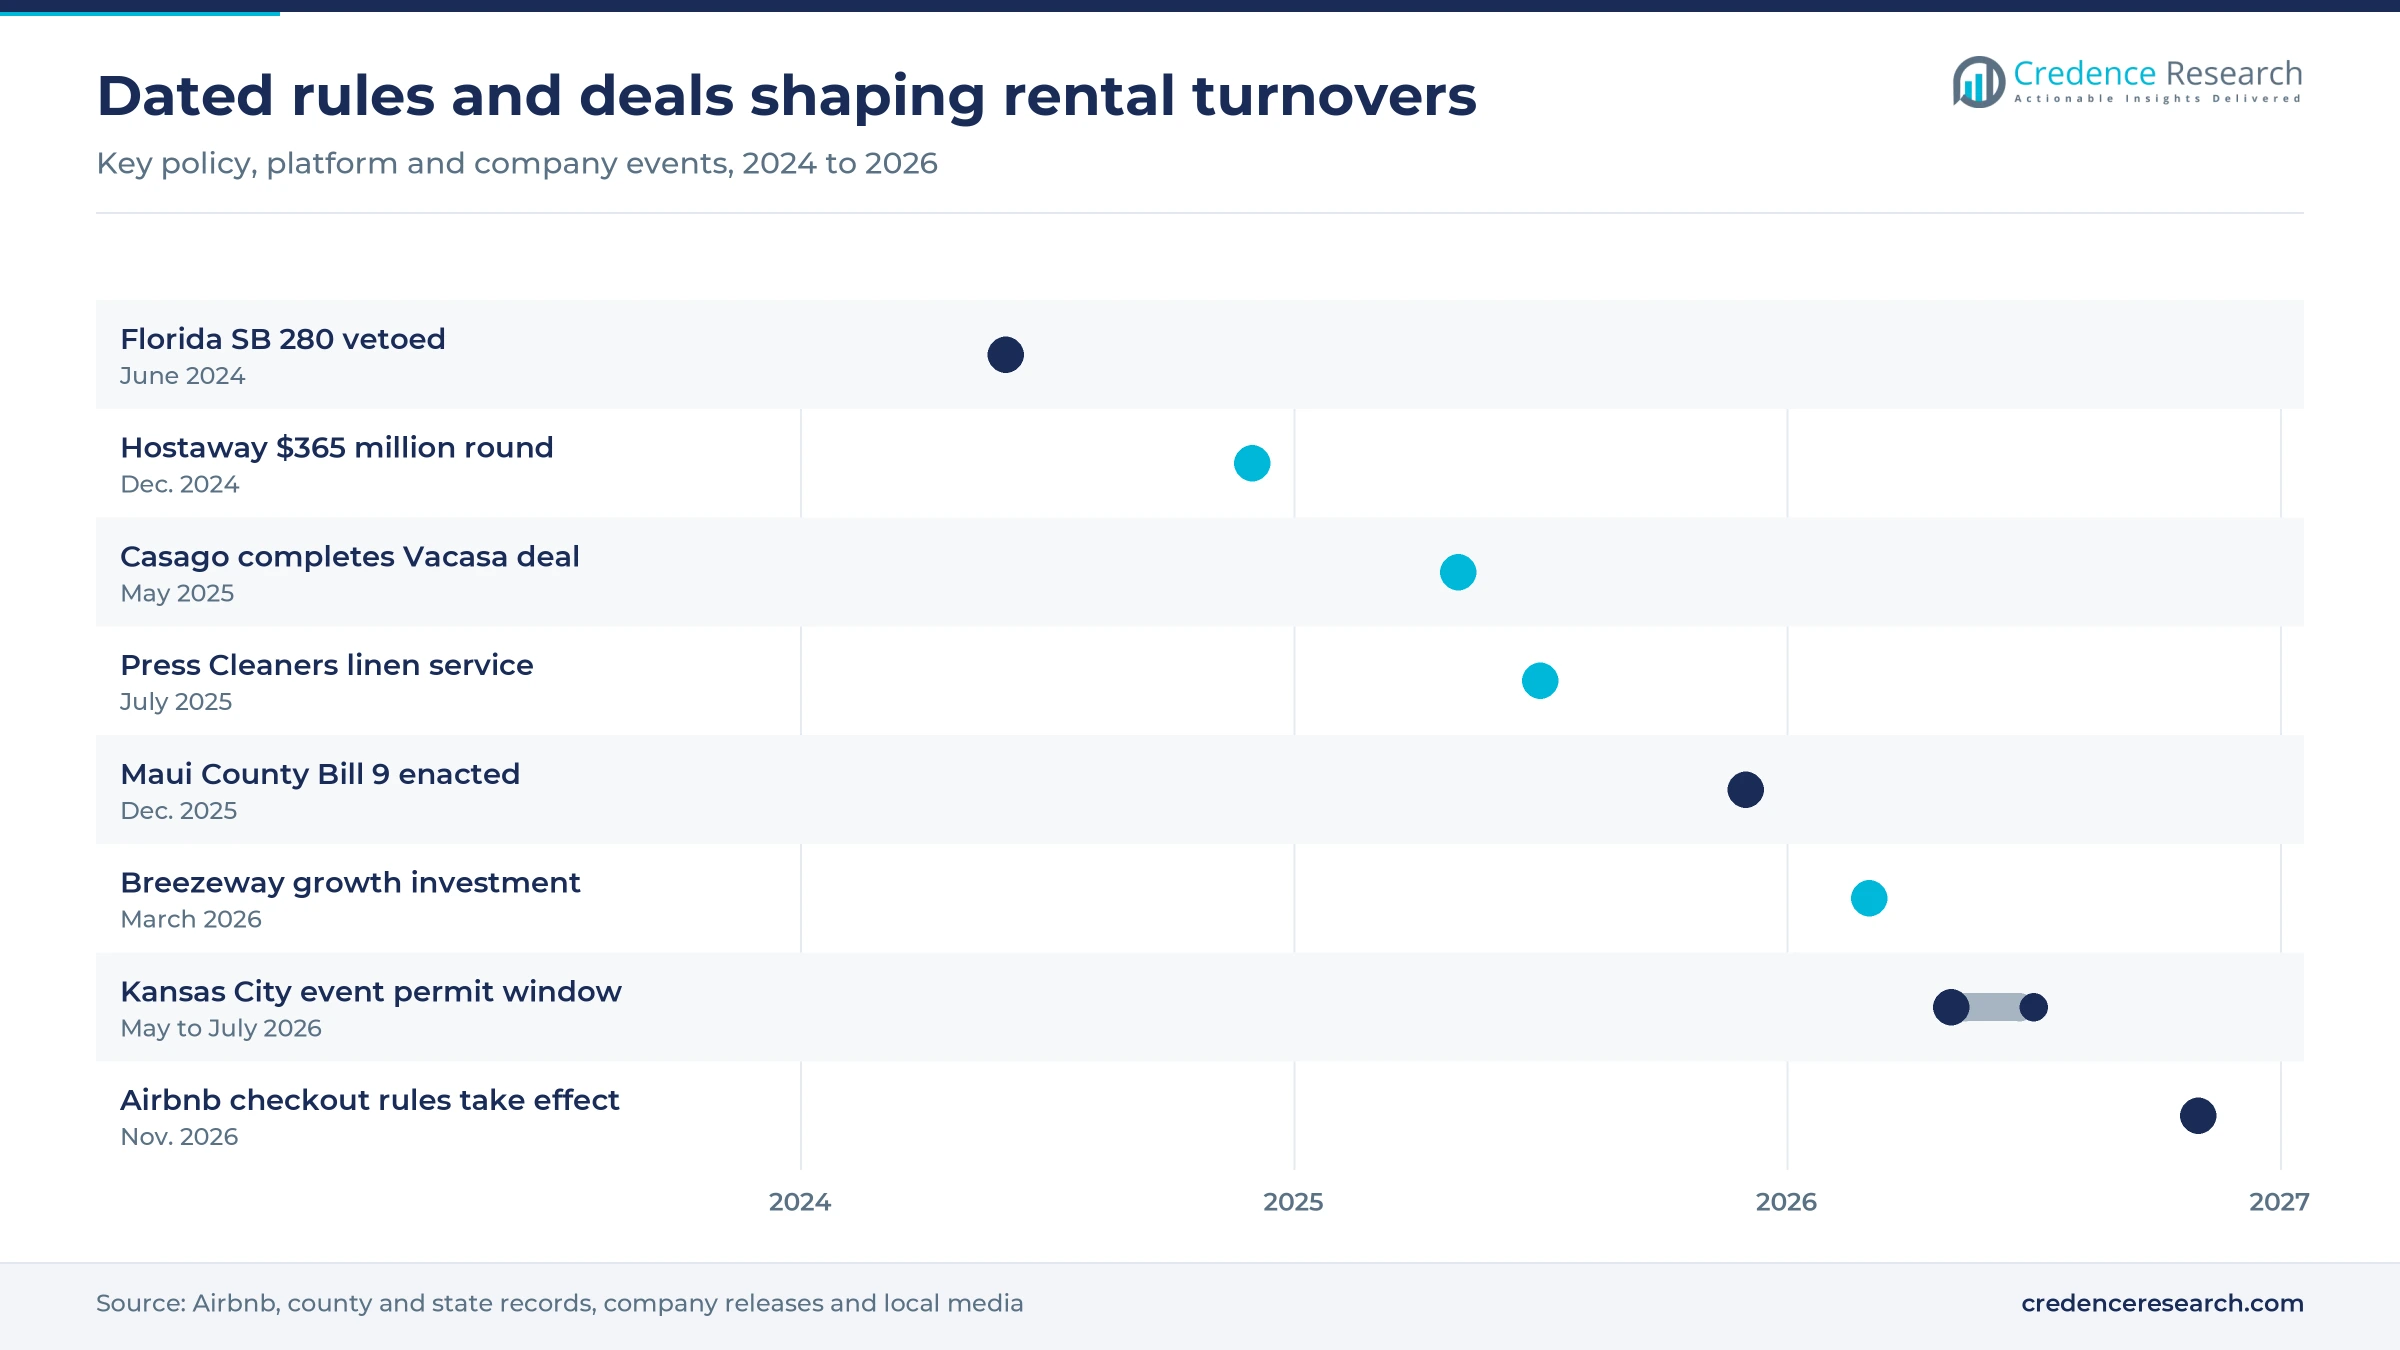
Mergers, funding rounds and platform rules from 2024 to 2026
| Development | Status and market relevance |
|---|---|
| In May 2025, Casago completed its acquisition of Vacasa, creating a manager of more than 40,000 properties. | Completed; consolidates managed turnovers |
| In July 2025, Press Cleaners launched a specialized Airbnb linen service across nine U.S. cities. | Launched; app-scheduled linen pickups |
| In December 2025, Maui County enacted Bill 9, phasing out about 7,000 apartment-district vacation rentals. | Enacted; deadlines in 2029 and 2031 |
| In March 2026, Breezeway announced a growth investment from Resurgens Technology Partners. | Closed; adds housekeeping automation |
| In October 2026, Airbnb announced checkout rules that bar hosts from requiring guests to wash dishes or strip beds. | Effective Nov. 20, 2026; shifts chores to cleaners |
Scheduling apps and photo checklists run the turnover
- Automated scheduling assigns cleans from booking calendars, and Turno connects hosts with more than 126,000 marketplace cleaners and runs annual background checks on U.S. cleaners.
- Photo checklists record each room after a clean, and Properly says hosts using its checklists and inspections eliminate four in five turnover mistakes.
- Operations platforms from Breezeway coordinate housekeeping, property care and vendors for more than 265,000 properties in 85 countries.
- Linen logistics apps let hosts book pickups and deliveries, as Press Cleaners has offered in nine U.S. cities since July 2025.
Need a Custom Version of This Report?
Tailor the scope, geography, or segments to your exact requirements.
- Custom geography or segment scope
- Direct access to our analyst team
Cleaner marketplaces and managers compete for turnovers
Competition in U.S. short-term rental cleaning pits app-based marketplaces against property managers with their own crews and against thousands of local firms. Turno leads the marketplace model, matching hosts with independent cleaners, automating schedules from booking calendars and handling payments. Properly competes on quality control, selling photo checklists and expert-reviewed inspections by the visit. Breezeway sells operations software that property managers use to run housekeeping teams and vendors. Casago, after buying Vacasa, runs a franchise-based model with local teams, while Evolve introduces local cleaning partners to the owners it serves. Press Cleaners competes in linen, with app-booked pickups in Texas and other cities. Hosts compare providers on reliability during same-day turnovers, review scores and price per clean, and switching costs stay low for single-listing owners.
How do the leading turnover service providers position their offer?
| Company | Type | Role in the market |
|---|---|---|
| Turno | Cleaner marketplace and software | Matches hosts with more than 126,000 cleaners and automates scheduling |
| Properly | Inspection software and services | Sells photo inspections at $5 each and managed turnover support |
| Breezeway | Operations software | Runs housekeeping workflows for more than 265,000 properties |
| Casago | Property manager | Manages more than 40,000 properties after buying Vacasa in May 2025 |
| Evolve | Property manager | Connects owners with local cleaning partners and bought Guestworks in November 2025 |
| Press Cleaners | Linen and laundry service | Offers app-scheduled linen pickups for hosts in nine cities |
| Hostaway | Property management software | Raised $365 million in December 2024 to expand its platform |
Crew capacity and proof of quality decide vendor growth
Credence Research's view is that crew capacity and proof of quality, rather than price alone, will decide which providers gain share in U.S. short-term rental cleaning. Airbnb's November 2026 checkout rules add work to every turnover, and softer occupancy pushes hosts to demand more from each visit. Providers that combine scheduling software, photo inspections and linen logistics should win property manager contracts. Individual hosts will keep switching among marketplace cleaners, so app-based platforms that screen and rate crews are best placed to capture that faster-growing demand. Turnover cleaning held 62.0% of U.S. short-term rental cleaning value in 2025, and that core visit remains the anchor for every add-on service.
How paid turnover cleaning spending was modeled
The report uses 2025 as the base year and 2035 as the forecast year, with market values taken from the Credence Research model. Service, host, booking and regional splits are Credence Research estimates informed by public data and are not reported statistics. Sources include Airbnb annual filings, U.S. Census Bureau population estimates, AirDNA market reviews, company releases and pricing pages, state and county records reported by local media, and trade press reports.
Steady supply growth carries turnover demand to 2035
From USD 4.20 billion in 2026, the market is expected to reach USD 6.52 billion by 2035 as listing supply keeps growing and platform rules move more chores to paid crews. Property managers will keep the larger share of spending, although individual hosts will grow faster as marketplace cleaners become easier to book. Inspections and linen services should gain share as owners pay for proof of quality and longer-lasting sheets. Local rental limits in New York City and Maui will hold back the Northeast and Pacific zones, while Texas cities lead growth.
Frequently Asked Questions
How big is the U.S. short-term rental cleaning market?
Which service holds the largest share?
Why do hosts pay for professional turnover cleaning?
Which region leads and which grows fastest?
How does the Airbnb checkout policy affect cleaners?
How fast are individual hosts adopting paid cleaning?
What limits growth in short-term rental cleaning?
Who are the leading companies?
Table of Content
Chapter 1 Market Segmentation
- 1.1 Segmentation Framework
- 1.1.1 Product and Service Classification
- 1.1.2 Application and End-Use Classification
- 1.1.3 Technology and Solution Classification
- 1.1.4 Customer and Distribution Channel Classification
- 1.1.5 Geographic Segmentation
- 1.1.6 Market Segment Definitions and Boundaries
- 1.2 By Service
- 1.2.1 Turnover Cleaning
- 1.2.2 Linen
- 1.2.3 Restocking
- 1.2.4 Inspections
- 1.3 By Host
- 1.3.1 Property Managers
- 1.3.2 Individual
- 1.4 By Booking
- 1.4.1 Marketplaces
- 1.4.2 Direct
Chapter 2 Introduction
- 2.1 Report Objectives and Scope
- 2.2 Product Definition and Industry Terminology
- 2.3 Market Inclusions and Exclusions
- 2.4 Research Process
- 2.4.1 Primary Research and Expert Interviews
- 2.4.2 Secondary Research and Source Review
- 2.4.3 Top-Down and Bottom-Up Estimation
- 2.4.4 Data Triangulation and Verification
- 2.5 Market Size Measurement Basis
- 2.5.1 2025: USD 4.00 billion → 2035: USD 6.52 billion
- 2.6 Historical and Forecast Reference Periods
- 2.6.1 Historical Period: 2018-2025
- 2.6.2 Base Year: 2025
- 2.6.3 Forecast Period: 2025-2035
- 2.7 Research Assumptions and Limitations
Chapter 3 Executive Summary
- 3.1 Market Snapshot and Key Findings
- 3.2 Base-Year Market Size, 2025
- 3.3 Forecast Market Size, 2035
- 3.4 Revenue and Volume Growth Outlook
- 3.5 Key Demand and Supply Indicators
- 3.6 Leading Market Segments
- 3.7 Fastest-Growing Market Opportunities
- 3.8 Regional Performance Highlights
- 3.9 Technology and Industry Transformation
- 3.10 Competitive Landscape Summary
- 3.11 Analyst View and Strategic Implications
Chapter 4 U.S. Short-Term Rental Cleaning Market Trends and Developments
- 4.1 Historical Industry Development, 2018-2025
- 4.2 Recent Market Trends and Developments
- 4.3 Demand and Customer Behavior Trends
- 4.4 Technology and Product Innovation
- 4.5 Artificial Intelligence, Automation and Digitalization
- 4.6 Local Manufacturing and Supply Chain Realignment
- 4.7 Industry Partnerships, Mergers and Acquisitions
- 4.8 Sustainability and Circular Economy Developments
- 4.9 Government and Private Sector Investment Trends
- 4.10 Emerging Business Models and Commercialization
- 4.11 Industry Developments and Announcements
Chapter 5 U.S. Short-Term Rental Cleaning Market Supply and Demand Analysis
- 5.1 Demand Trend and Consumption Analysis, 2018-2025
- 5.2 Demand Forecast, 2025-2035
- 5.3 Supply Chain Structure and Procurement Trends
- 5.4 Supply-Demand Gap and Bottlenecks
- 5.5 Import Dependence and Sourcing Structure
- 5.6 Regional Supply and Demand Concentration
Chapter 6 U.S. Short-Term Rental Cleaning Market Pricing Analysis
- 6.1 Pricing Structure and Measurement
- 6.2 Historical Pricing Trends, 2018-2025
- 6.3 Pricing Outlook, 2025-2035
- 6.4 Pricing by Product and Market Segment
- 6.5 Geographic Pricing Differences
- 6.6 Key Input, Energy, Labor and Logistics Costs
- 6.7 Contract Pricing and Purchasing Models
- 6.8 Pricing Sensitivity and Competitive Positioning
- 6.9 Price, Margin and Profitability Implications
Chapter 7 U.S. Short-Term Rental Cleaning Market Dynamics
- 7.1 Market Growth Drivers
- 7.1.1 Demand-Side Drivers
- 7.1.2 Technology and Innovation Drivers
- 7.1.3 Infrastructure and Investment Drivers
- 7.1.4 Regulatory and Policy Drivers
- 7.2 Market Restraints
- 7.2.1 Cost and Affordability Constraints
- 7.2.2 Technology and Adoption Barriers
- 7.2.3 Supply Chain and Operational Constraints
- 7.3 Market Challenges
- 7.3.1 Competitive Pressure and Margin Erosion
- 7.3.2 Skills, Infrastructure and Implementation Gaps
- 7.4 Emerging Market Opportunities
- 7.5 Market Dynamics Impact and Time-Horizon Assessment
Chapter 8 U.S. Short-Term Rental Cleaning Value Chain Analysis
- 8.1 Industry Value Chain Overview
- 8.2 Upstream Suppliers and Critical Inputs
- 8.3 Technology and Component Providers
- 8.4 Manufacturing or Service Delivery
- 8.5 Distribution, Channel Partners and Integrators
- 8.6 Downstream Applications and End Users
- 8.7 Value Addition and Profit Pools
- 8.8 Vertical Integration and Outsourcing
- 8.9 Supplier Concentration and Risk
- 8.10 Supply Chain Localization and Resilience
Chapter 9 U.S. Short-Term Rental Cleaning Market Regulations and Policies
- 9.1 Relevant Laws, Standards and Compliance Frameworks
- 9.2 Product, Service, Safety and Quality Requirements
- 9.3 Government Policies, Incentives and Subsidies
- 9.4 Imports, Exports and Trade Barriers
- 9.5 Public Procurement and Local Content Requirements
- 9.6 Data Protection, AI and Cybersecurity Compliance
- 9.7 Upcoming Policy Changes and Market Implications
Chapter 10 U.S. Short-Term Rental Cleaning Market Hotspots and Opportunities
- 10.1 Market Opportunity Mapping and Growth Hotspots
- 10.2 High-Growth Applications and Customer Groups
- 10.3 Underserved Markets and White-Space Opportunities
- 10.4 Emerging Technology and Product Opportunities
- 10.5 New Capacity and Investment Hotspots
- 10.6 Market Entry and Expansion Opportunities
- 10.7 Distribution and Partnership Opportunities
- 10.8 Near-Term and Long-Term Commercial Potential
- 10.9 Opportunity Attractiveness and Execution Risks
Chapter 11 U.S. Short-Term Rental Cleaning Market Outlook, 2025-2035
- 11.1 Market Size and Analysis
- 11.1.1 Revenue (Market Measurement: 2025: USD 4.00 billion → 2035: USD 6.52 billion)
- 11.1.2 Historical Market Size, 2018-2025
- 11.1.3 Base-Year Market Size, 2025
- 11.2 Market Forecast, 2025-2035
- 11.2.1 Revenue Forecast to 2035
- 11.2.2 CAGR and Year-on-Year Growth
- 11.2.3 Incremental Revenue Opportunity
- 11.3 Forecast Assumptions and Scenario Analysis
- 11.3.1 Base-Case Forecast
- 11.3.2 Optimistic and Conservative Scenarios
- 11.3.3 Technology, Pricing and Policy Sensitivities
- 11.4 Market Attractiveness and Growth Outlook
Chapter 12 U.S. Short-Term Rental Cleaning Market Segmentation and Outlook
- 12.1 Segmentation Summary and Market Shares, 2025
- 12.2 Largest and Fastest-Growing Segments
- 12.3 By Service - Market Size and Forecast, 2025-2035
- 12.3.1 Segment Definition and Scope
- 12.3.2 Historical Market Size, 2018-2025
- 12.3.3 Revenue Forecast, 2025-2035
- 12.3.4 Base-Year Market Share, 2025
- 12.3.5 Segment CAGR and Growth Drivers
- 12.3.6 Subsegment Market Size and Forecast
- 12.3.6.1 Turnover Cleaning
- 12.3.6.2 Linen
- 12.3.6.3 Restocking
- 12.3.6.4 Inspections
- 12.3.7 Subsegment Pricing and Adoption Trends
- 12.3.8 Leading Suppliers and Competition
- 12.3.9 Regional Demand and Opportunities
- 12.4 By Host - Market Size and Forecast, 2025-2035
- 12.4.1 Segment Definition and Scope
- 12.4.2 Historical Market Size, 2018-2025
- 12.4.3 Revenue Forecast, 2025-2035
- 12.4.4 Base-Year Market Share, 2025
- 12.4.5 Segment CAGR and Growth Drivers
- 12.4.6 Subsegment Market Size and Forecast
- 12.4.6.1 Property Managers
- 12.4.6.2 Individual
- 12.4.7 Subsegment Pricing and Adoption Trends
- 12.4.8 Leading Suppliers and Competition
- 12.4.9 Regional Demand and Opportunities
- 12.5 By Booking - Market Size and Forecast, 2025-2035
- 12.5.1 Segment Definition and Scope
- 12.5.2 Historical Market Size, 2018-2025
- 12.5.3 Revenue Forecast, 2025-2035
- 12.5.4 Base-Year Market Share, 2025
- 12.5.5 Segment CAGR and Growth Drivers
- 12.5.6 Subsegment Market Size and Forecast
- 12.5.6.1 Marketplaces
- 12.5.6.2 Direct
- 12.5.7 Subsegment Pricing and Adoption Trends
- 12.5.8 Leading Suppliers and Competition
- 12.5.9 Regional Demand and Opportunities
- 12.6 Segment Growth Comparison
- 12.7 Segment Attractiveness and Priority Matrix
Chapter 13 U.S. Short-Term Rental Cleaning Geographic Market Outlook, 2025-2035
- 13.1 Domestic Market Distribution and Demand Clusters
- 13.2 State- or Province-Wise Market Size and Forecast, 2025-2035
- 13.3 City and Metropolitan Market Outlook
- 13.4 Industrial, Manufacturing and Commercial Clusters
- 13.5 Geographic Concentration of Key End Users
- 13.6 Local Pricing and Purchasing Differences
- 13.7 Domestic Production Facilities and Capacity Map
- 13.8 Local Infrastructure and Project Pipeline
- 13.9 State-Level Policy and Incentive Differences
- 13.10 Subnational Investment Hotspots and Opportunities
- 13.11 Distribution and Logistics Networks
- 13.12 Domestic Competitive Footprint
Chapter 14 U.S. Short-Term Rental Cleaning Technology, Innovation and Sustainability Outlook
- 14.1 Technology Landscape and Maturity
- 14.2 Product, Process and Service Innovation
- 14.3 AI, Automation and Digital Tools in the Industry
- 14.4 Technology Adoption and Performance Benchmarking
- 14.5 Innovation Pipeline and R&D Investment
- 14.6 Energy Efficiency and Resource Management
- 14.7 Sustainability, Recycling and Circularity
- 14.8 Technology Roadmap, 2025-2035
- 14.9 Risks of Obsolescence and Technology Substitution
Chapter 15 U.S. Short-Term Rental Cleaning Market Key Strategic Imperatives
- 15.1 Growth and Market Entry Priorities
- 15.2 High-Return Products and Segments
- 15.3 Pricing, Profitability and Cost Optimization
- 15.4 Technology Investment and Product Differentiation
- 15.5 Supply Chain Localization and Resilience
- 15.6 Distribution and Customer Acquisition
- 15.7 Partnership, Acquisition and Capacity Strategy
- 15.8 Regional Expansion Priorities
- 15.9 Short-, Medium- and Long-Term Actions
Chapter 16 Competition Outlook
- 16.1 Industry Competition Characteristics
- 16.2 Market Structure and Concentration
- 16.3 Market Share and Competitive Positioning, 2025
- 16.4 Company-Wise Revenue and Product Benchmarking
- 16.5 Production and Service Capacity Benchmarking
- 16.6 Technology, Pricing and Differentiation
- 16.7 Regional Footprint and Distribution Strength
- 16.8 Mergers, Acquisitions and Strategic Alliances
- 16.9 New Entrants and Competitive Threats
- 16.10 Porter's Five Forces and Industry Attractiveness
- 16.11 Competitive Outlook, 2025-2035
Chapter 17 Company Profiles
- 17.1 Company Coverage and Selection Criteria
- 17.2 Turno
- 17.2.1 Business Description
- 17.2.2 Company Ownership and Geographic Presence
- 17.2.3 Product and Service Portfolio
- 17.2.4 Manufacturing and Operating Footprint
- 17.2.5 Financial Performance and Investment
- 17.2.6 Market Share and Competitive Position
- 17.2.7 Technology and Innovation Capabilities
- 17.2.8 Strategic Alliances or Partnerships
- 17.2.9 Recent Developments
- 17.2.10 Growth Strategy and Outlook
- 17.3 Properly
- 17.4 Breezeway
- 17.5 Casago
- 17.6 Evolve
- 17.7 Press Cleaners
- 17.8 Hostaway
- 17.9 Other Relevant Market Participants
Note: Every listed company is profiled on the structure shown under the first company. The company list is preliminary and may change based on research findings, market developments, data availability and client requirements.
Chapter 18 Disclaimer
- 18.1 Research and Forecast Disclaimer
- 18.2 Data Source and Estimation Limitations
Note: The depth of individual sections depends on data availability for this market. Volume, capacity, trade and other unit-based metrics are included where applicable.

