
Programmable drone fleets move into mainstream event budgets
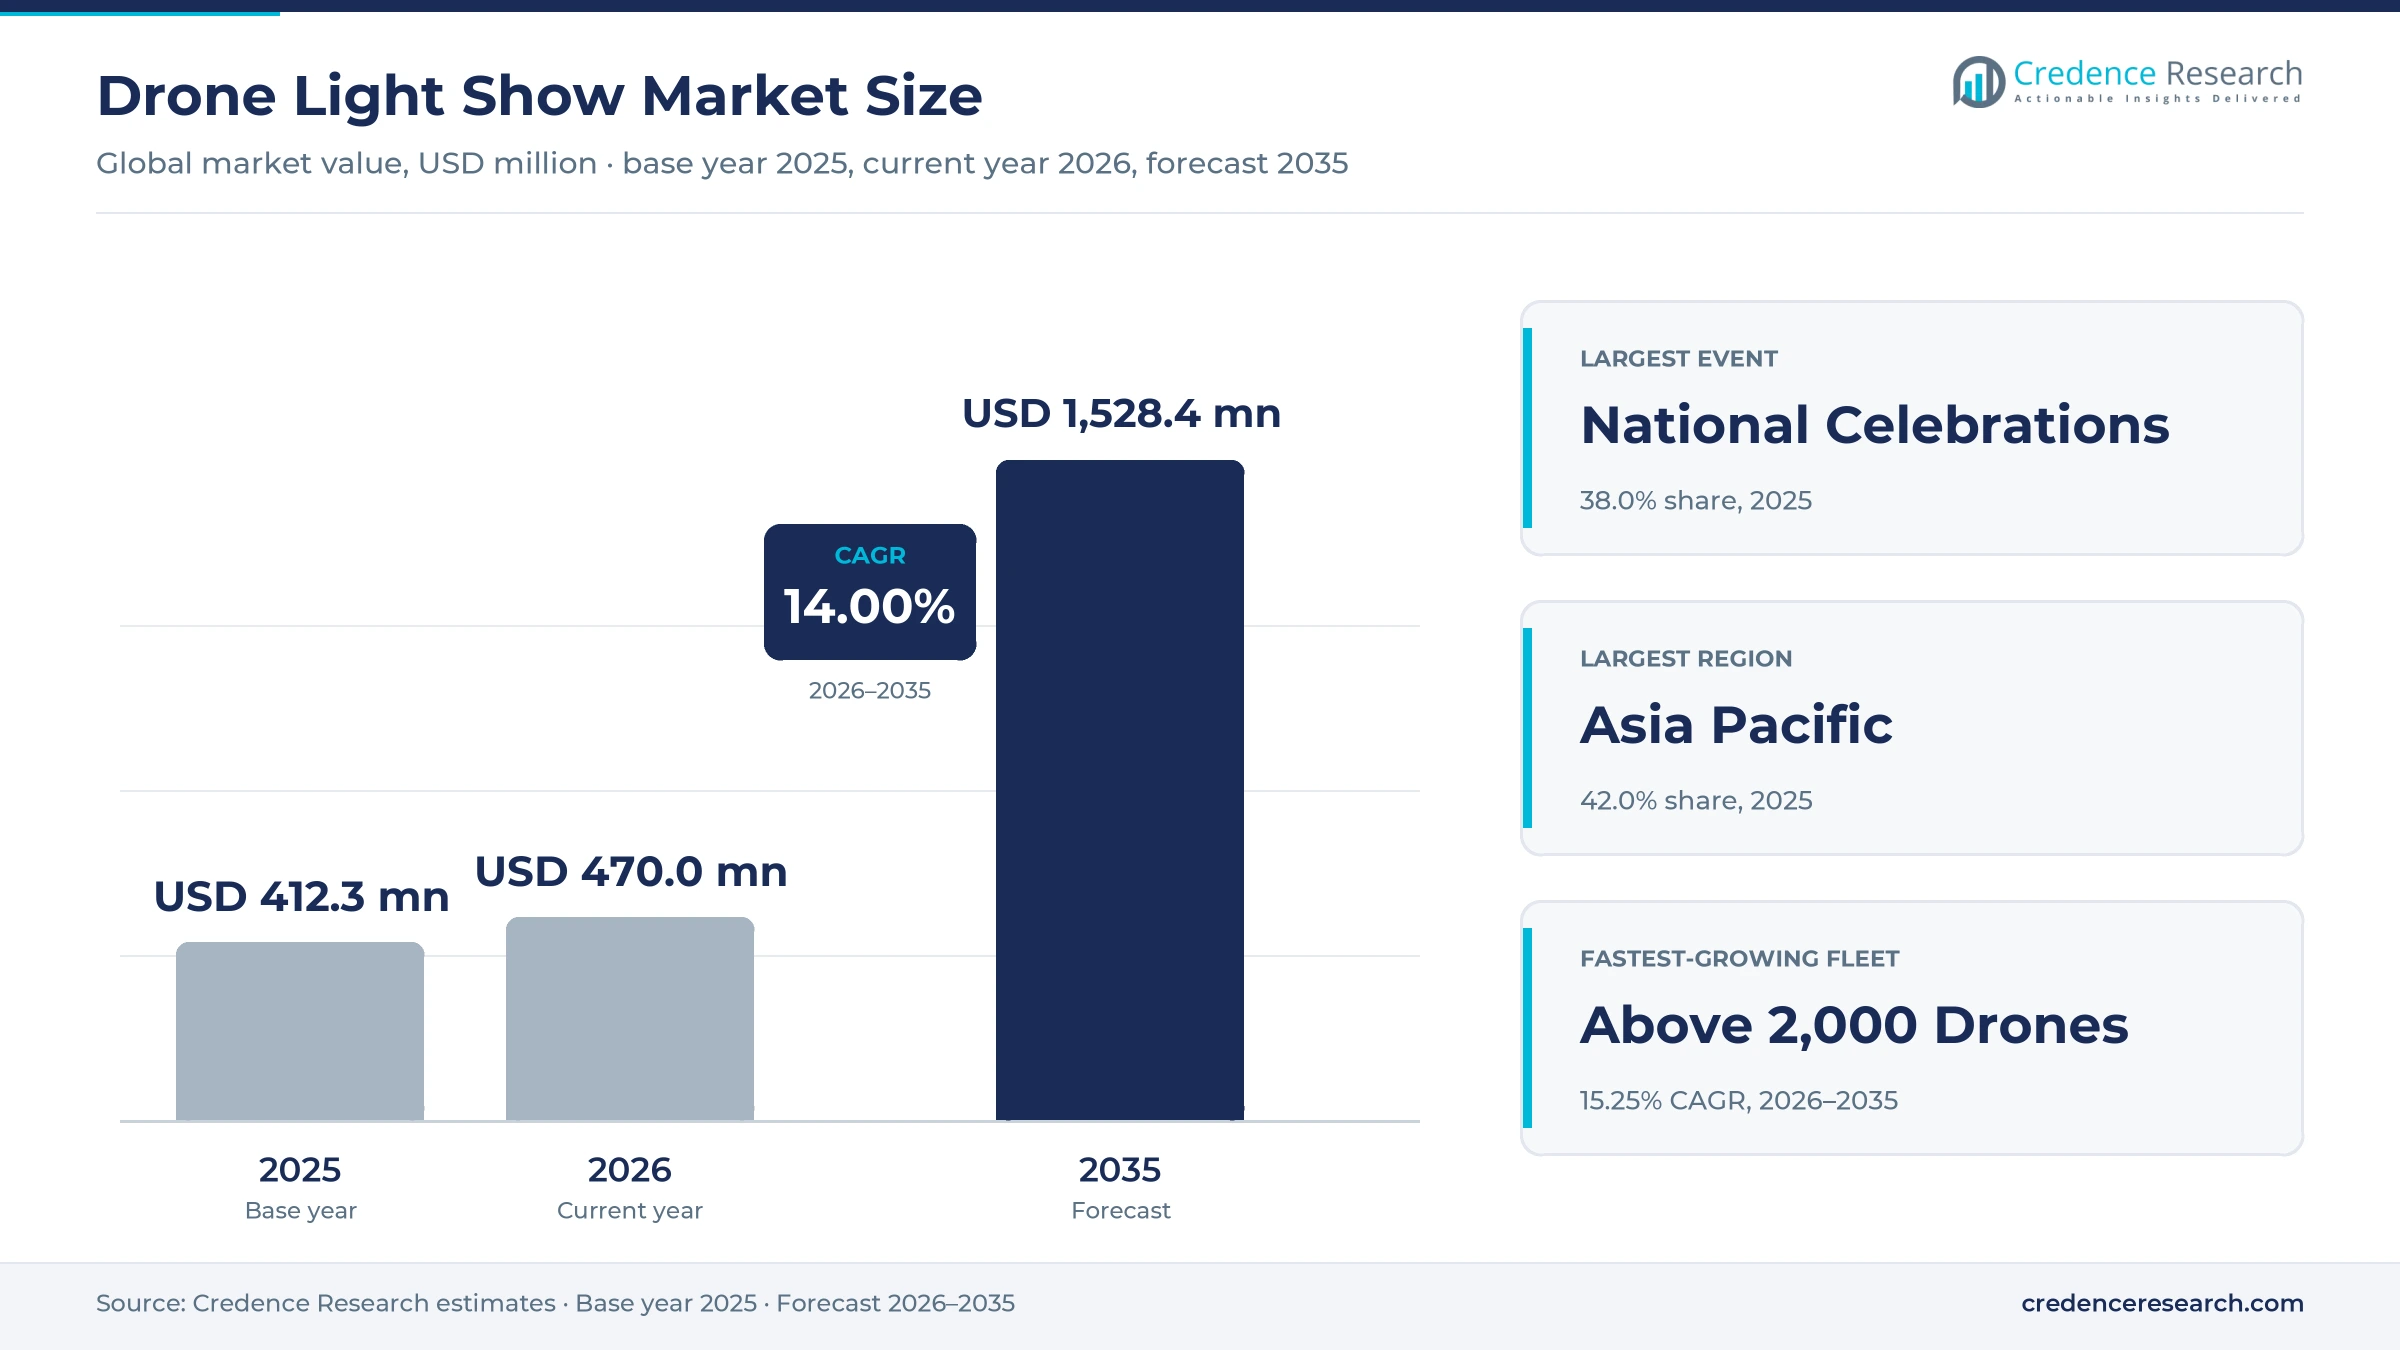
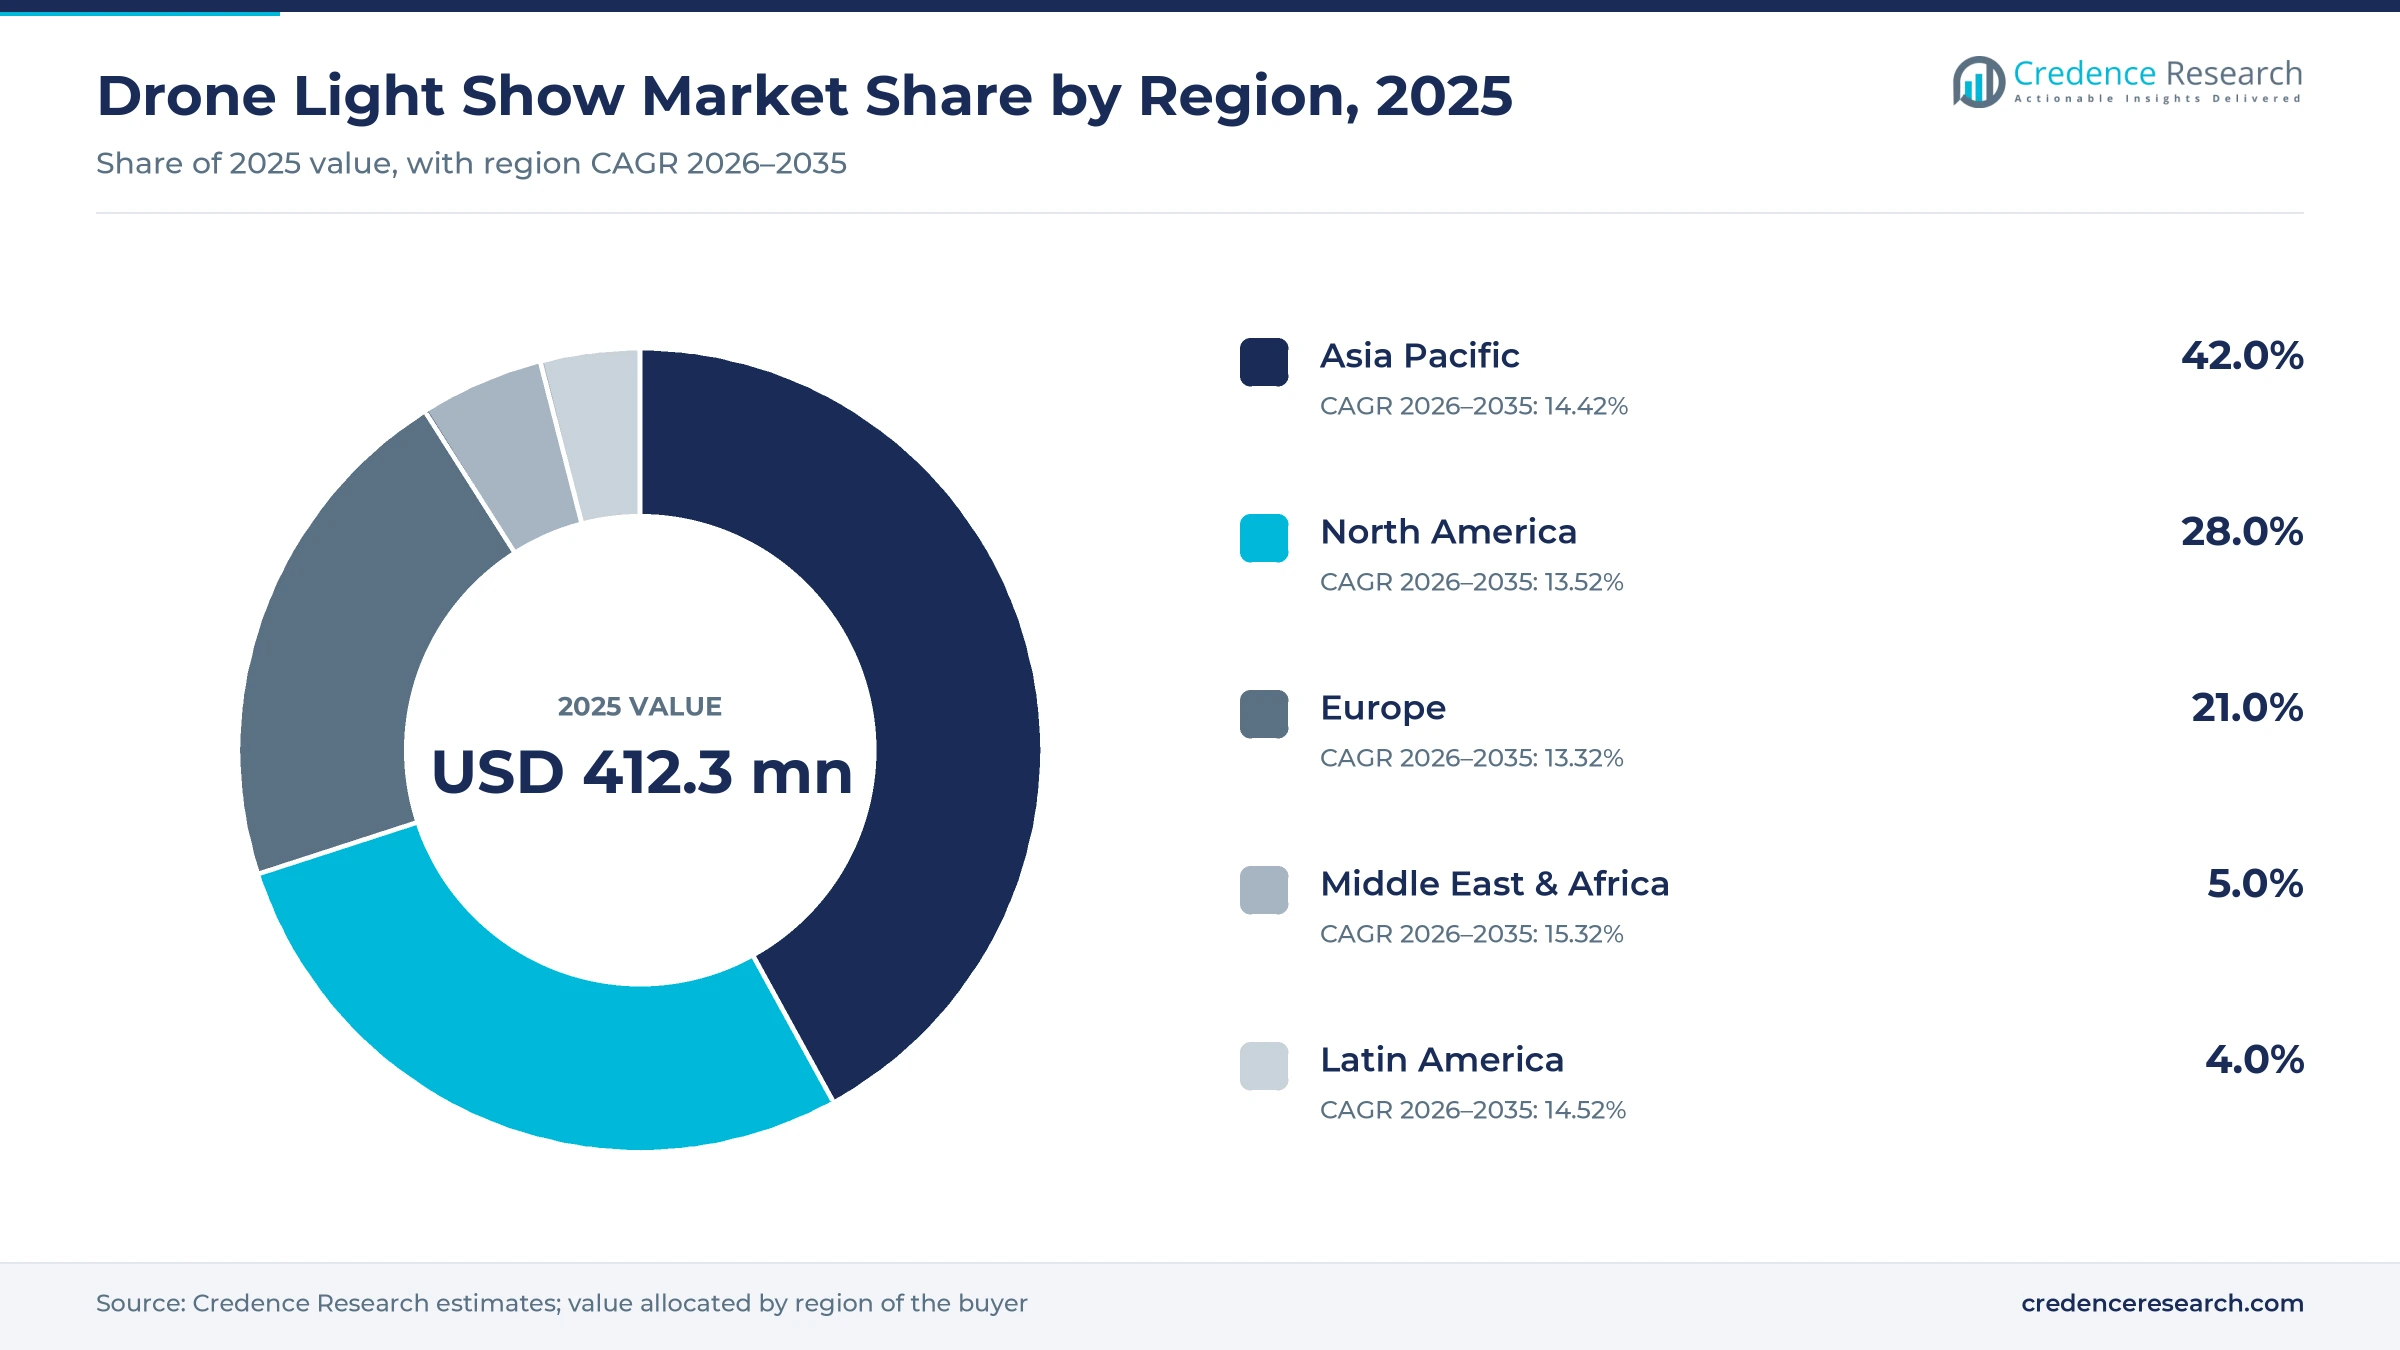
The global drone light show market was valued at USD 412.3 million in 2025 and is projected to increase from USD 470.0 million in 2026 to USD 1.53 billion by 2035, registering a CAGR of 14.00% during 2026–2035. Demand comes from city governments, tourism boards, festival organizers, brands and private hosts that want a quiet, reusable and programmable alternative to aerial fireworks. Asia Pacific held the largest regional share, 42.0% in 2025, because Chinese manufacturers supply most show drones and Chinese cities stage record displays for holidays and televised galas. Middle East & Africa is the fastest-growing region at 15.32% a year as Gulf tourism authorities commission permanent fleets and New Year displays. A major technology change is automation, as single computers now control more than 20,000 drones and charging trays launch fleets without manual setup. Pyrotechnic payloads are also turning drones into partners of fireworks displays rather than simple replacements for them.
What does the drone light show market include?
The drone light show market covers paid aerial displays in which fleets of LED-equipped drones fly programmed formations, images and animations for an audience. Value is counted as show fees paid by event hosts, ticket revenue of producer-run shows and sales or leases of show drones, ground stations and design software to operators.
The scope excludes drone cinematography, aerial advertising banners towed by aircraft, ground-based laser and fireworks displays without drones and hobby drone sales. The value chain runs from hardware and software makers to show producers, event agencies and the final host, who usually buys a turnkey show.
Drone Light Show Market Insights
- The market is valued at USD 412.3 million in 2025 and is projected to reach USD 1.53 billion by 2035, growing at a 14.00% CAGR as event hosts replace aerial fireworks.
- Asia Pacific led with 42.0% of 2025 value, supported by Chinese record shows such as the 22,580-drone display in Hefei on Feb. 16, 2026.
- National Celebrations held 38.0% of 2025 value, as national anniversaries in Vietnam, India and the United States commissioned large public displays.
- Fleet automation is changing show economics, and DAMODA says its vehicle system cut setup from four hours with 20 people to 60 seconds with one operator.
- Producers are raising capital and signing brands, with Nova Sky Stories raising a $50 million round in August 2025 and Stellantis joining DroneArt Show in August 2026.
National celebrations lead as weddings grow fastest
Why do national celebrations lead event value?
Based on event, the market is categorized into national celebrations, brand launches, festivals and weddings. National Celebrations led with 38.0% of 2025 value because governments pay for the largest fleets. Ho Chi Minh City flew 10,500 drones on April 28, 2025 for the 50th anniversary of national reunification, according to Viet Nam News, and EHang flew 22,580 drones for the 2026 Spring Festival Gala. Weddings grow fastest at 15.49% a year as private hosts book smaller fleets. BotLab Dynamics has staged more than 100 wedding shows in India, according to Khaleej Times in May 2025.
Why do fleets below 500 drones lead fleet value?
Based on fleet size, the market is categorized into fleets below 500 drones, 500 to 2,000 drones and above 2,000 drones. Below 500 Drones led with 52.0% of 2025 value because most towns, brands and hosts buy compact shows. The Drone Girl reported in July 2025 that most companies charge $200 to $300 per drone with a 100-drone minimum. Above 2,000 Drones grow fastest at 15.25% a year as record displays scale up. Sky Elements and Damoda America launched 71,207 drones across seven shows in Texas in September 2026, according to DroneXL.
Why does China lead country value?
Based on key country, the market is categorized into China, the United States, India, the Middle East and the rest of the world. China led with 35.0% of 2025 value because its makers build most show fleets. DAMODA runs regular shows in more than 50 Chinese cities and works with over 100 tourism sites, according to Shenzhen Daily in April 2025. The Middle East grows fastest at 15.77% a year as Gulf emirates commission permanent fleets. Abu Dhabi announced a 10,000-drone fleet with Nova Sky Stories in March 2025, according to DroneDJ.
| Segment Group | Leading Sub-segment | Share, 2025 | Fastest-growing Sub-segment | CAGR, 2026–2035 |
|---|---|---|---|---|
| By Event | National Celebrations | 38.0% | Weddings | 15.49% |
| By Fleet Size | Below 500 Drones | 52.0% | Above 2,000 Drones | 15.25% |
| By Key Country | China | 35.0% | Middle East | 15.77% |
Request a Free Sample
Fill in your details and we'll send you a free sample report.
- Sample data tables & charts
- Research methodology
Fireworks substitution and cheaper fleet control lead
Organizers replace aerial fireworks with drone displays
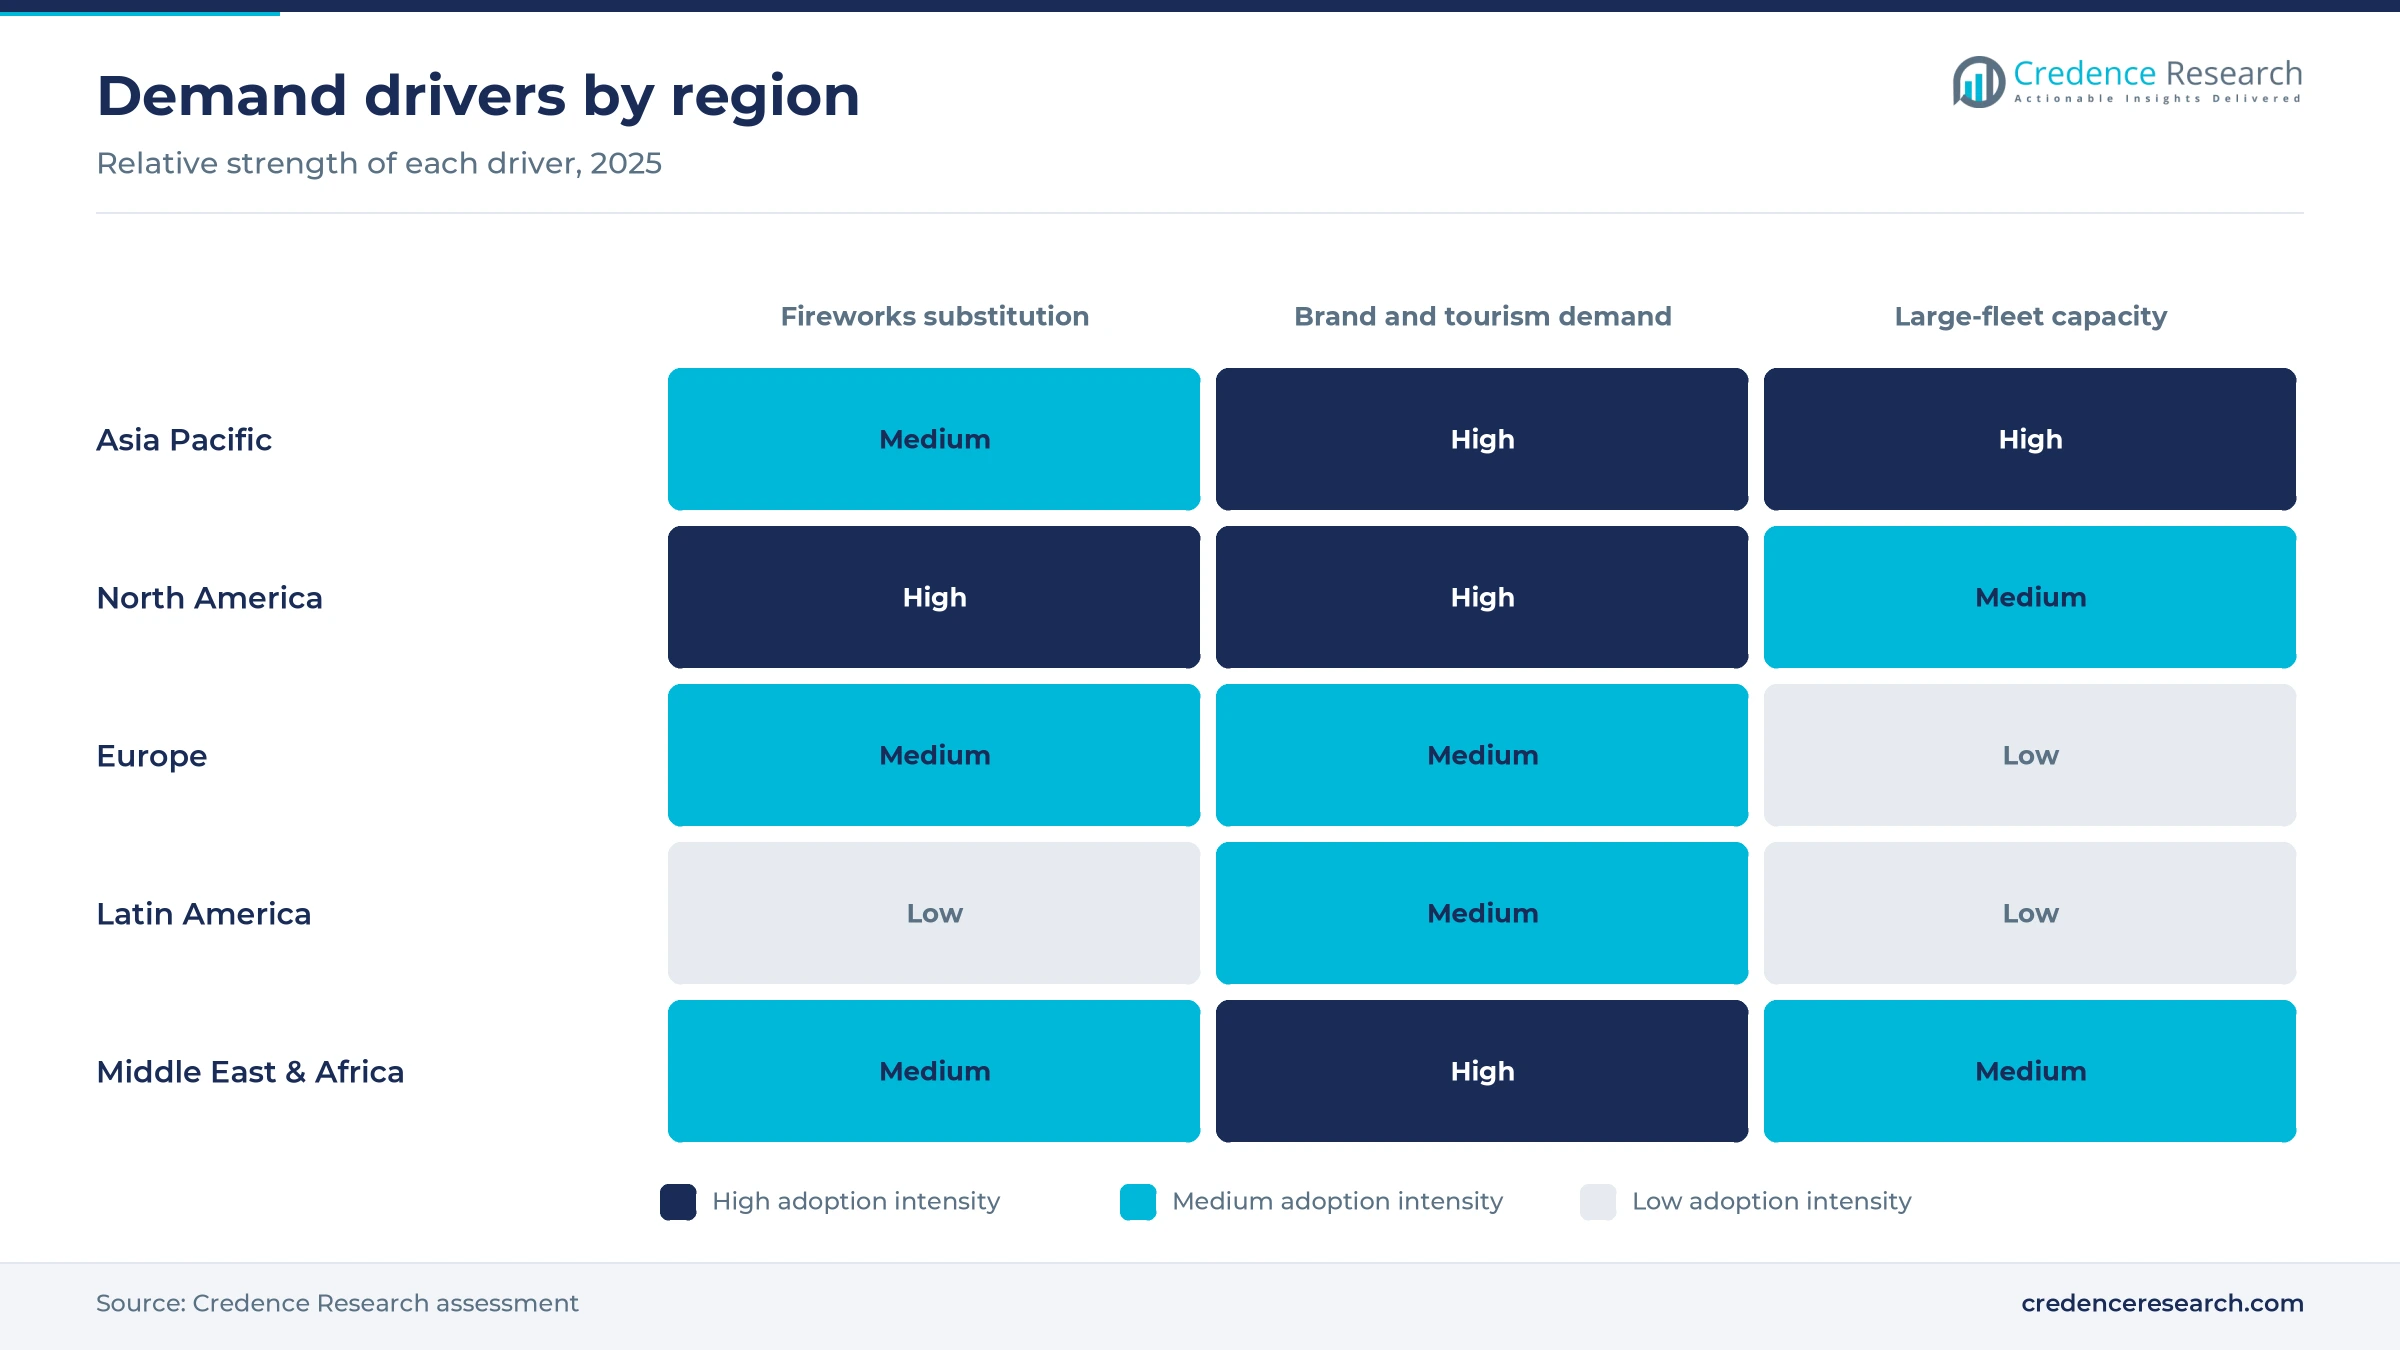
Event organizers are replacing aerial fireworks because drones cut fire risk, noise and smoke at crowded public sites. The U.S. Consumer Product Safety Commission estimated 14,700 fireworks injuries and 11 deaths in 2024, according to its June 2025 safety release ahead of the July Fourth holiday. The Rose Bowl replaced its 2025 Fourth of July fireworks with a drone show because of fire danger near Eaton Fire burn scars, according to ABC7 in June 2025. Salt Lake City and Boulder had already swapped fireworks for drones in July 2023, citing wildfire risk, according to CNN. In the Credence Research model this adds about 5.18 percentage points to annual growth to 2035, the largest single effect.
Fleet control technology cuts large show production costs
Fleet control technology lowers the cost of large shows because one crew can now run thousands of drones. DAMODA said its 2022 automated system cut venue space by 80% and labor costs by 50%, according to Xinhua in March 2025. Its vehicle-mounted system 2.0 reduced setup from four hours with 20 people to 60 seconds with one operator, the company said in July 2026. EHang then flew 22,580 drones from a single computer on Feb. 16, 2026. Verge Aero added an AI show design tool in September 2025. In the Credence Research model this adds about 3.78 percentage points to annual growth to 2035.
Brand activations and tourism events add repeat bookings
Brand activations and tourism programs add repeat bookings because hosts can rerun a show with new content each season. Stellantis named Chrysler, Dodge, Jeep and Ram exclusive automotive partners of DroneArt Show on Aug. 5, 2026, with hundreds of U.S. shows expected by the end of the year. Such deals pull budgets from events and exhibitions marketing into the sky. Sky Elements also scheduled 1,500 drones for Coca-Cola's New Year's Eve Bash in Austin in 2025. In China, DAMODA has run a resident show at Zhuhai Chimelong Ocean Kingdom since 2017, according to Shenzhen Daily. In the Credence Research model this adds about 2.80 percentage points to annual growth to 2035, as Weddings and brand launches widen the client base.
National anniversaries fund record-scale public displays
National anniversaries and televised galas fund record-scale displays, which keep demand high for fleets above 2,000 drones. Vietnam flew 10,500 drones over Ho Chi Minh City on April 28, 2025, and China staged 15,947 drones at the Liuyang Fireworks Festival on Oct. 21, 2025, according to CGTN. In the United States, roughly 1,500 drone shows were scheduled in 2026 around the nation's 250th anniversary, against fewer than 30 a year five years earlier, according to DroneXL. India's Ministry of Defence also commissioned a 1,000-drone show for the 2022 Beating Retreat ceremony, according to ThePrint. These programs support national celebrations, the largest event type in the Credence Research model.
Pyro drones and ticketed sky stories reshape displays
Shift toward pyro drones and hybrid fireworks shows
Producers are shifting toward drones that carry pyrotechnics, so shows now combine light formations with sparks and gerbs. Malta-based Pyroemotions launched 3,865 fireworks from 500 drones in Lusail, Qatar, on Jan. 1, 2025, according to Guinness World Records. Liuyang then flew 15,947 drones carrying fireworks on Oct. 21, 2025, and Ras Al Khaimah used 2,300 drones, including 1,000 pyro drones, for a phoenix on New Year's Eve 2025, according to Gulf News. Sky Elements says it was the first U.S. company to gain FAA approval to mount pyrotechnics on drones. As a result, fireworks makers increasingly sell into drone shows rather than lose budgets to them.
Rise of ticketed sky storytelling productions
Producer-owned, ticketed shows are rising as companies sell drone stories directly to audiences rather than only to hosts. Nova Sky Stories was raising a $50 million round in August 2025, with Jeffrey Katzenberg's WndrCo among the investors, according to Fortune. The company bought Intel's drone business and 9,000 drones in 2022 and planned to build up to 25,000 drones in 2026. Variety reported that ticket sales rose from 6,000 a year earlier to a pace of more than 500,000, while Stellantis added branded segments to DroneArt Show in August 2026. This model turns shows into touring entertainment with recurring revenue.
Weddings and private celebrations open a premium niche
Weddings, proposals and private parties are an opening because hosts pay premium prices for personalized messages in the sky. BotLab Dynamics has staged more than 100 wedding shows across Indian cities, and requests in the UAE spiked in 2025, according to Khaleej Times. A Dubai wedding used 200 drones in May 2025, while a 2024 Ambani pre-wedding show used 5,500 drones. Proposal Dubai launched a 1,000-drone proposal experience on Feb. 24, 2026, according to Business Wire. Entry prices also help, since basic Sky Elements shows start at about $15,000, according to estimates by The Drone Girl in July 2025. As a result, Weddings grow fastest at 15.49% a year in the Credence Research model.
Expos and tourism boards create new show cities
Expos and tourism boards are an opening because they buy multi-night programs that justify local fleets and crews. Red Cliff flew 2,500 drones on April 13, 2025, the opening day of Expo 2025 Osaka, setting a Guinness record for the largest aerial tree, according to Japan Travel. Nice staged 2,025 drones with Dronisos on June 6, 2025, ahead of the UN Ocean Conference, according to EAP Magazin. Abu Dhabi's Department of Culture and Tourism also signed a multi-year deal for 10,000 drones with Nova Sky Stories in March 2025. Such programs also compete with outdoor LED displays for tourism budgets, and they support Middle East & Africa, the fastest-growing region in the Credence Research model.
Safety rules, tariffs and costs slow wider adoption
Safety incidents trigger waiver suspensions and cancellations
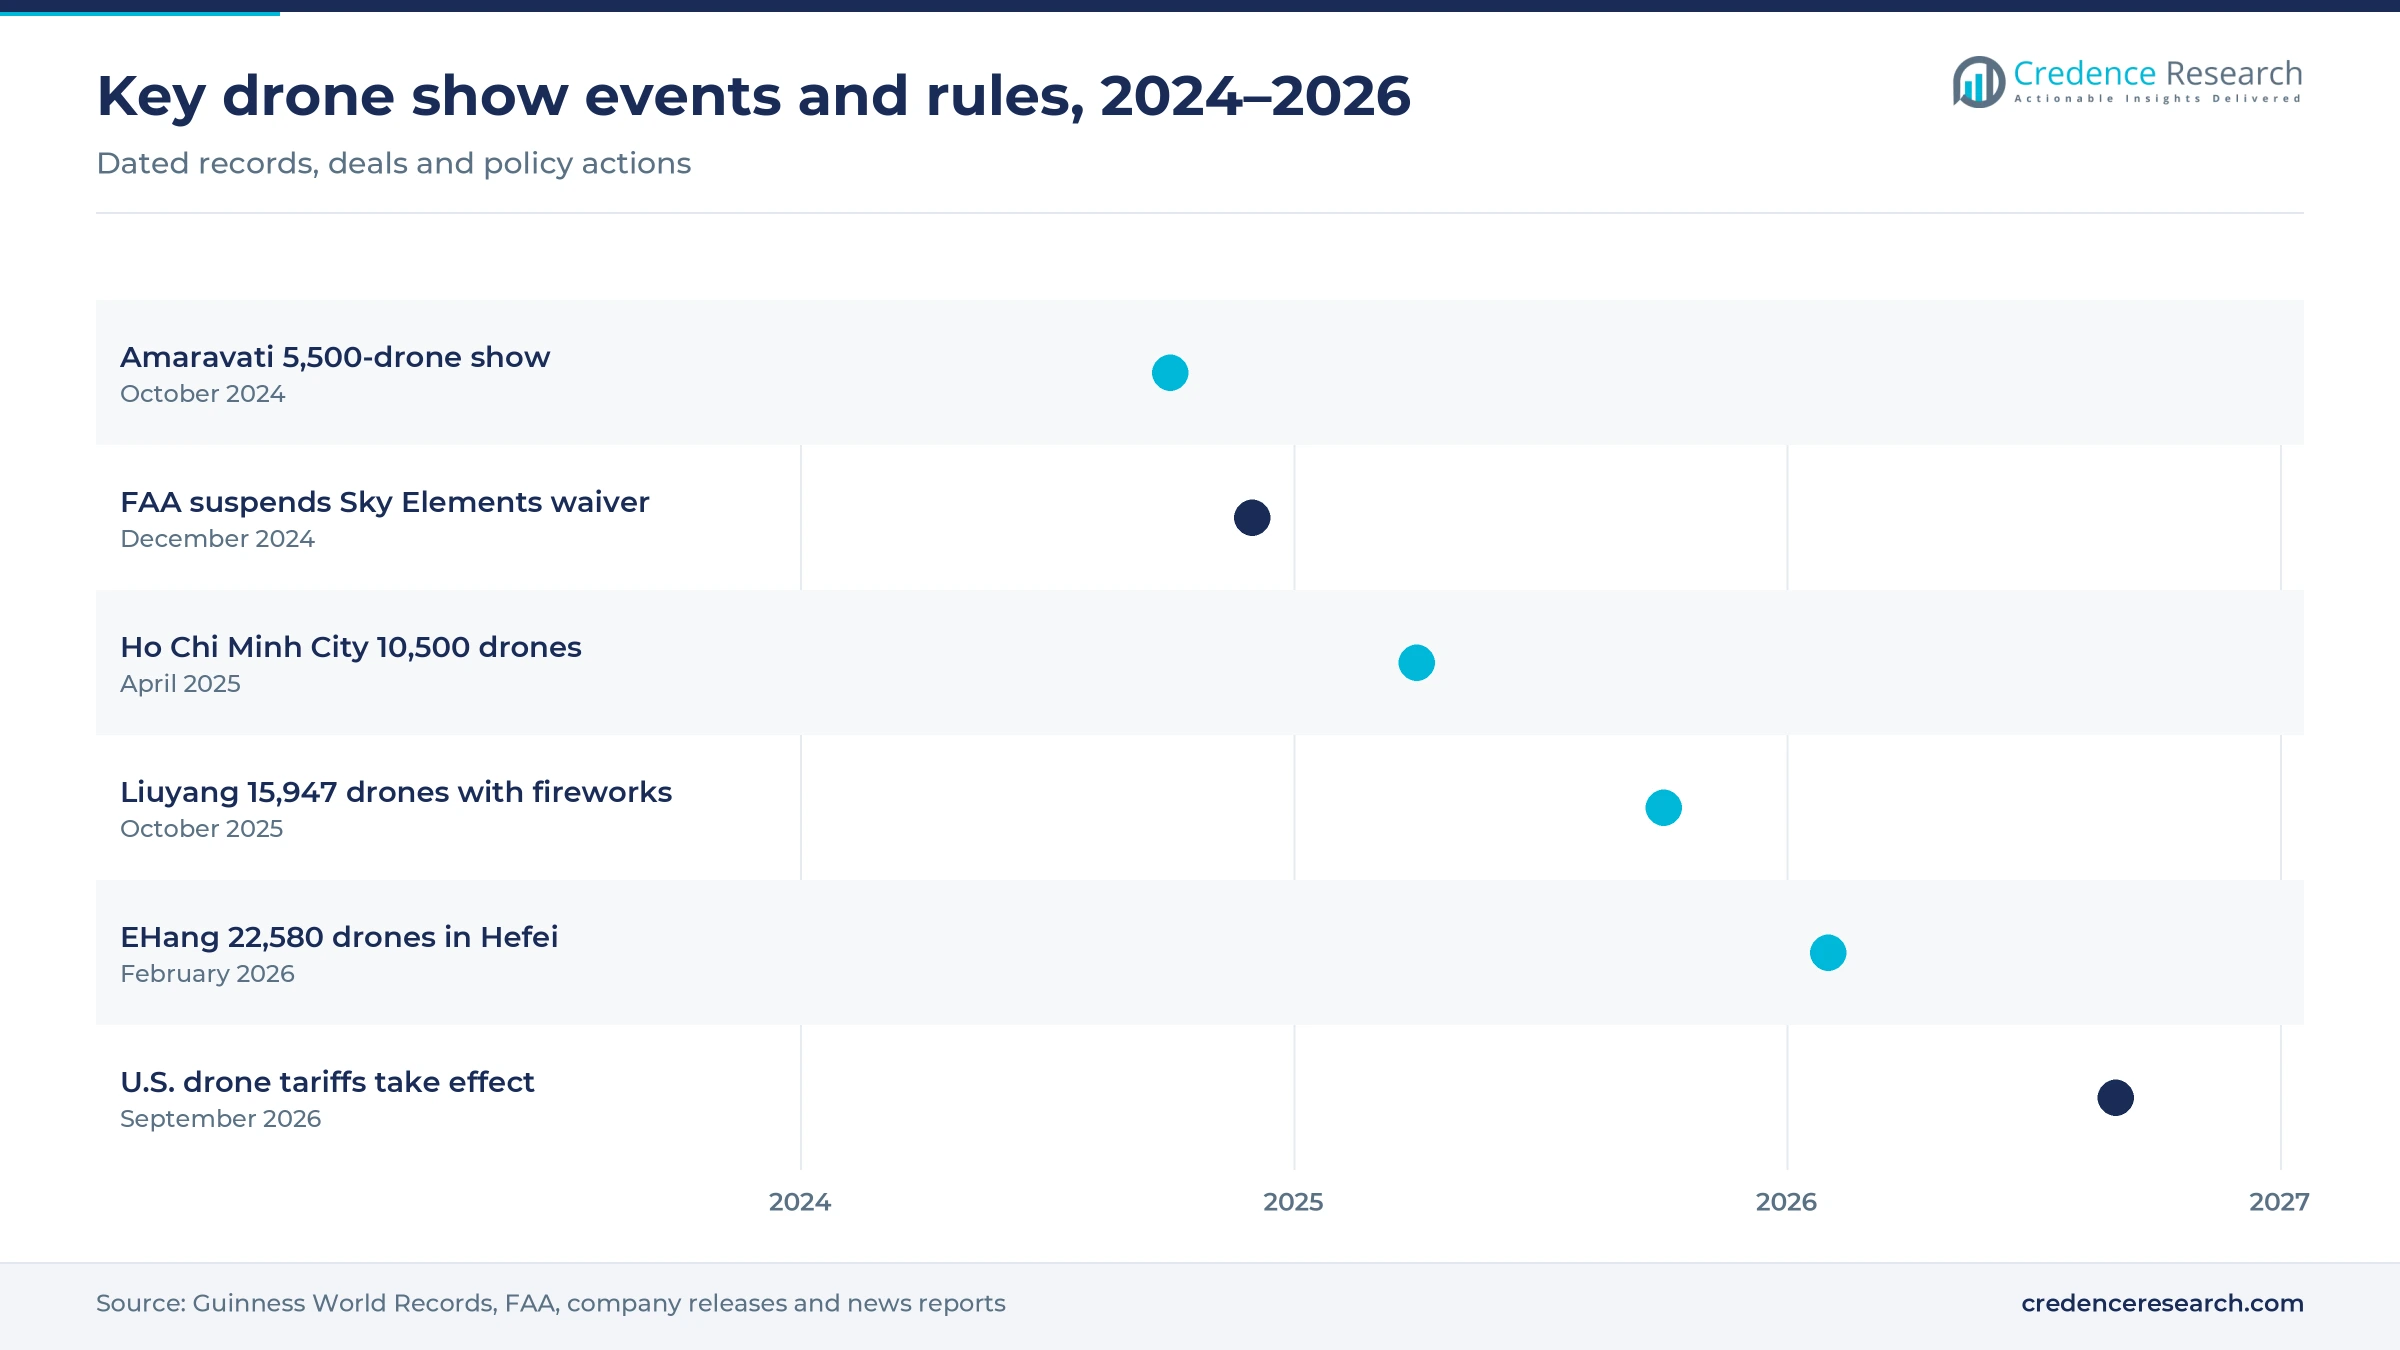
Safety incidents can halt operators and cancel booked shows across a season. On Dec. 21, 2024, falling drones at a Sky Elements show in Orlando struck a 7-year-old boy, and the FAA suspended the company's Part 107 waiver on Dec. 29, 2024, according to DroneXL. The New York Road Runners then dropped its New Year's Eve drone show in Central Park. Sky Elements now flies two pilots per show with a motor-cutting geofence, according to DroneXL in July 2026.
Show prices remain far above small fireworks displays
Price is a barrier for small towns because a basic drone show costs several times a local fireworks display. The Drone Girl reported in July 2025 that a 100-drone show costs $20,000 to $30,000, while small-town fireworks displays cost $2,000 to $7,000. As a result, many municipalities keep fireworks or share one drone show across several events. Producers respond with smaller packages and multi-year contracts that spread the cost.
U.S. drone tariffs raise fleet replacement costs
New U.S. tariffs raise the cost of fleets built in China, where most show drones are made. The United States imposed a 25% tariff on smaller drones and up to 100% on docking stations and larger drones from Sept. 3, 2026, with component duties from Feb. 9, 2027, according to Euronews. U.S. producers that fly Chinese hardware, including the Sky Elements and Damoda America partnership, therefore face higher replacement costs and may delay fleet expansion.
Short flight times limit show length and formats
Battery limits cap show length, which restricts storytelling and the price a host will pay per minute. A typical show drone weighs about 0.9 kilograms and flies for 15 to 20 minutes, according to DroneXL in July 2026, and Verge Aero rates its X7 at 17 minutes of flight. Longer ticketed shows therefore need relays of fleets, spare batteries and more crew, which raises cost. Wind and rain also force postponements, so hosts often plan backup dates.
Asia Pacific leads as Middle East & Africa grows fastest
| Region | Value, 2025 (USD million) | Share, 2025 | CAGR, 2026–2035 |
|---|---|---|---|
| Asia Pacific | 173.2 | 42.0% | 14.42% |
| North America | 115.4 | 28.0% | 13.52% |
| Europe | 86.6 | 21.0% | 13.32% |
| Middle East & Africa | 20.6 | 5.0% | 15.32% |
| Latin America | 16.5 | 4.0% | 14.52% |
Asia Pacific leads on Chinese fleets and record shows
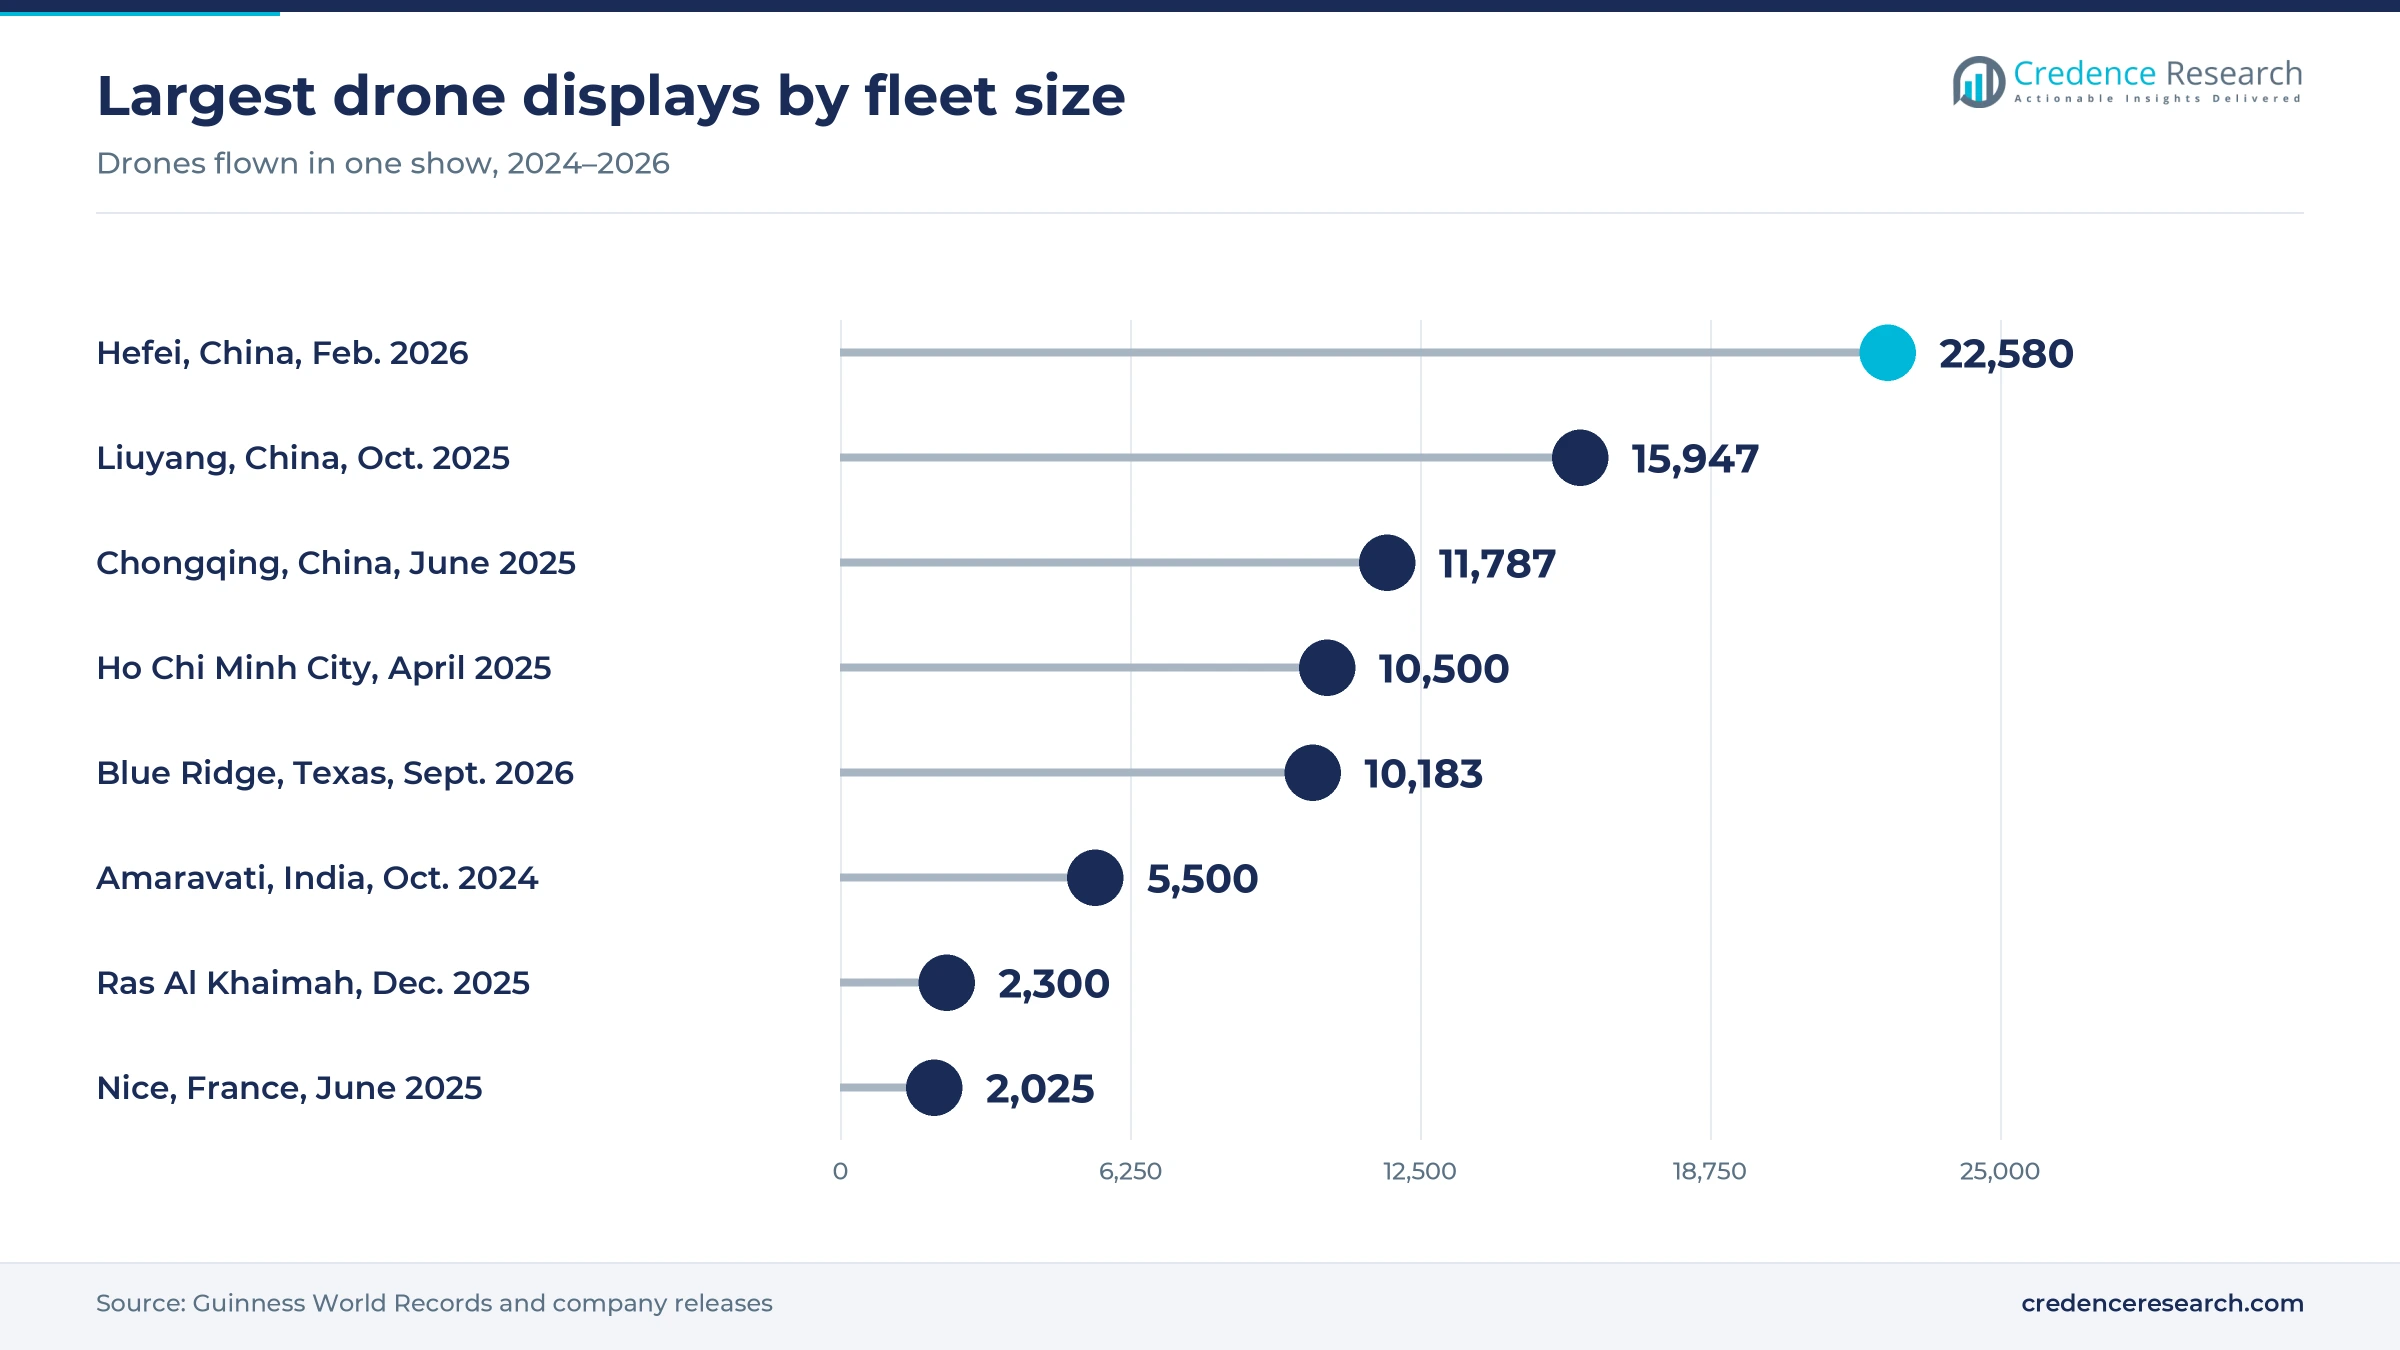
Asia Pacific held 42.0% of 2025 value and grows at 14.42% a year to 2035. China leads because DAMODA and EHang build and fly the largest fleets, including 11,787 drones over Chongqing on June 17, 2025 and 22,580 drones in Hefei in February 2026. India adds scale, as BotLab Dynamics flew 5,500 Indian-made drones at the Amaravati Drone Summit on Oct. 22, 2024, according to DroneLife. Vietnam and Japan also staged Guinness record shows in April 2025.
North America grows on holiday and municipal demand
North America held 28.0% of 2025 value and grows at 13.52% a year. The FAA counted 481,760 certificated remote pilots and 453,635 commercial registrations of unmanned aerial vehicles in November 2025, a deep pool for show crews. Sky Elements scheduled more than 80 holiday shows for December 2025 and about 90 shows around July 4, 2026. However, the December 2024 Orlando incident made municipal buyers ask for stricter safety plans.
Europe builds on festivals and city celebrations
Europe held 21.0% of 2025 value and grows at 13.32% a year. Dronisos flew 2,025 drones over the Promenade des Anglais in Nice on June 6, 2025, promoted by the city as the largest drone show in Europe to date. Germany grants light show swarms exemptions from per-drone lights and remote identification in the specific category, according to the federal dipul portal. These permits favor experienced operators, which keeps fleets smaller than in China.
Latin America adopts shows through visiting producers
Latin America held 4.0% of 2025 value and grows at 14.52% a year. Sky Elements scheduled 550 drones, including 100 pyrotechnic drones, over Guatemala City on Nov. 30, 2025, which shows how U.S. producers serve the region. Local fleets remain small, so many shows are flown by visiting crews with imported drones. Smaller event budgets also keep most regional bookings below 500 drones.
Middle East & Africa is the fastest-growing region
Middle East & Africa held 5.0% of 2025 value and grows fastest at 15.32% a year. Abu Dhabi plans a 10,000-drone fleet with Nova Sky Stories, and Ras Al Khaimah set a Guinness record with 2,300 drones on New Year's Eve 2025. Qatar hosted a record 3,865 drone-launched fireworks in Lusail on Jan. 1, 2025. Weddings in Dubai add private demand, while Africa remains a small market served mostly by visiting producers.
Record fleets and brand deals marked 2024 to 2026
| Development | Status and market relevance |
|---|---|
| In February 2026, EHang flew 22,580 drones from a single computer at the CMG Spring Festival Gala venue in Hefei. | Guinness record; largest fleet flown at once |
| In October 2025, the Liuyang Fireworks Festival flew 15,947 drones carrying fireworks and set two world records. | Completed; links drones with fireworks makers |
| In August 2025, Nova Sky Stories was raising a $50 million round, with WndrCo among the investors. | Funded; scales ticketed sky stories |
| In August 2026, Stellantis became the exclusive automotive partner of DroneArt Show across the United States. | Live; expands brand-funded shows |
| In September 2026, Sky Elements and Damoda America flew a 10,183-drone dragon in Texas and launched 71,207 drones in one week. | Guinness records; largest U.S. displays |
Swarm control, pyro payloads and automated docks shape shows
- Swarm control software plans every flight path and lets one computer fly fleets, as EHang did with 22,580 drones in 2026.
- High-precision positioning gives each drone millimeter-level accuracy, according to DAMODA, so formations about 0.6 meters apart hold their shape.
- Pyrotechnic payloads attach fireworks to drones, which Ras Al Khaimah used with 1,000 pyro drones on New Year's Eve 2025.
- Automated charging trays serve as launch and landing pads, so DAMODA fleets fly repeated shows without crews placing drones by hand.
Need a Custom Version of This Report?
Tailor the scope, geography, or segments to your exact requirements.
- Custom geography or segment scope
- Direct access to our analyst team
Chinese hardware makers and U.S. producers compete on scale
Competition centers on fleet scale, safety records, show design and price per drone. DAMODA and EHang build hardware in China and sell fleets to operators in more than 50 countries, while also flying record shows at home. Sky Elements is the largest U.S. producer and now partners with Damoda America for its largest displays. Verge Aero sells U.S.-designed drones and design software to operators, and BotLab Dynamics builds its own drones for Indian state and wedding shows. Nova Sky Stories runs ticketed shows with Fever and brand partners. Producers also compete with pyrotechnics suppliers and with LED screen rental firms for the same event budgets. Operators with clean safety records and in-house animation teams win repeat city contracts, and Sky Elements alone scheduled more than 80 drone light show dates for December 2025.
Companies profiled and their roles in this market
| Company | Type | Role in the market |
|---|---|---|
| Sky Elements | Show producer | Largest U.S. producer with FAA approval for pyro drones and 19 Guinness titles |
| Verge Aero | Hardware and software maker | X7 show drone, Design Studio software and AI show design tool |
| DAMODA | Hardware maker and producer | Shenzhen maker of show fleets, docks and the V4 automated show system |
| Botlab Dynamics | Hardware maker and producer | Indian-built fleets for state ceremonies and more than 100 wedding shows |
| Nova Sky Stories | Show producer | Ticketed DroneArt Show productions and the Abu Dhabi 10,000-drone program |
| EHang | Hardware maker and producer | GD4.0 show drones flown 22,580 at once in February 2026 |
| Dronisos | Show producer | French producer behind the 2,025-drone Nice show in June 2025 |
Safety records and fleet scale will decide share
Credence Research's view is that the drone light show market will be decided by safety records and fleet scale rather than by novelty. Chinese makers hold a cost and scale lead, as shown by displays of more than 20,000 drones, while U.S. and European producers win on design, local permits and brand relationships. However, the Orlando incident of December 2024 and the U.S. drone tariffs of September 2026 show how quickly one event or rule can change a producer's season. Producers that combine pyro drones, ticketed formats and strict safety systems will gain share through 2035. Drone light show demand from Gulf tourism boards already includes a planned fleet of 10,000 drones in Abu Dhabi.
Show activity model checked against public records
The report uses 2025 as the base year and forecasts to 2035. Market values come from the Credence Research model, built from show counts, fleet sizes and public per-drone prices. Event, fleet size, country and regional splits are Credence Research estimates based on Guinness World Records entries, company releases, municipal event notices and FAA drone statistics. Trade and news coverage was used to date the events described in this report. No interviews or surveys were conducted for this edition of the report.
Larger fleets and private events extend growth to 2035
The market is expected to grow from USD 470.0 million in 2026 to USD 1.53 billion by 2035 as cities, brands and private hosts book drones in place of or alongside fireworks. National celebrations will remain the largest event type after holding 38.0% of 2025 value, while weddings grow fastest as entry prices fall. Asia Pacific will stay the largest region, and Middle East & Africa will add new permanent fleets. In the drone light show market, fleets above 2,000 drones grow fastest at 15.25% a year to 2035 as record displays become routine. The main risks are safety incidents, trade barriers on Chinese hardware and battery limits on show length.
Frequently Asked Questions
How big is the drone light show market?
Which region leads the drone light show market?
Which region grows fastest?
Which event type leads demand?
Why are cities replacing fireworks with drones?
How much does a drone light show cost?
Who are the main companies in the market?
What are the main challenges for the market?
Table of Content
Chapter 1 Market Segmentation
- 1.1 Segmentation Framework
- 1.1.1 Product and Service Classification
- 1.1.2 Application and End-Use Classification
- 1.1.3 Technology and Solution Classification
- 1.1.4 Customer and Distribution Channel Classification
- 1.1.5 Geographic Segmentation
- 1.1.6 Market Segment Definitions and Boundaries
- 1.2 By Event
- 1.2.1 National Celebrations
- 1.2.2 Festivals
- 1.2.3 Brand Launches
- 1.2.4 Weddings
- 1.3 By Fleet Size
- 1.3.1 Below 500 Drones
- 1.3.2 500 to 2,000 Drones
- 1.3.3 Above 2,000 Drones
- 1.4 By Key Country
- 1.4.1 China
- 1.4.2 United States
- 1.4.3 India
- 1.4.4 Middle East
- 1.4.5 Rest of World
Chapter 2 Introduction
- 2.1 Report Objectives and Scope
- 2.2 Product Definition and Industry Terminology
- 2.3 Market Inclusions and Exclusions
- 2.4 Research Process
- 2.4.1 Primary Research and Expert Interviews
- 2.4.2 Secondary Research and Source Review
- 2.4.3 Top-Down and Bottom-Up Estimation
- 2.4.4 Data Triangulation and Verification
- 2.5 Market Size Measurement Basis
- 2.5.1 2025: USD 412.3 million → 2035: USD 1.53 billion
- 2.6 Historical and Forecast Reference Periods
- 2.6.1 Historical Period: 2018-2025
- 2.6.2 Base Year: 2025
- 2.6.3 Forecast Period: 2025-2035
- 2.7 Research Assumptions and Limitations
Chapter 3 Executive Summary
- 3.1 Market Snapshot and Key Findings
- 3.2 Base-Year Market Size, 2025
- 3.3 Forecast Market Size, 2035
- 3.4 Revenue and Volume Growth Outlook
- 3.5 Key Demand and Supply Indicators
- 3.6 Leading Market Segments
- 3.7 Fastest-Growing Market Opportunities
- 3.8 Regional Performance Highlights
- 3.9 Technology and Industry Transformation
- 3.10 Competitive Landscape Summary
- 3.11 Analyst View and Strategic Implications
Chapter 4 Global Drone Light Show Market Trends and Developments
- 4.1 Historical Industry Development, 2018-2025
- 4.2 Recent Market Trends and Developments
- 4.3 Demand and Customer Behavior Trends
- 4.4 Technology and Product Innovation
- 4.5 Artificial Intelligence, Automation and Digitalization
- 4.6 Local Manufacturing and Supply Chain Realignment
- 4.7 Industry Partnerships, Mergers and Acquisitions
- 4.8 Sustainability and Circular Economy Developments
- 4.9 Government and Private Sector Investment Trends
- 4.10 Emerging Business Models and Commercialization
- 4.11 Industry Developments and Announcements
Chapter 5 Global Drone Light Show Market Supply and Demand Analysis
- 5.1 Demand Trend and Consumption Analysis, 2018-2025
- 5.2 Demand Forecast, 2025-2035
- 5.3 Supply Chain Structure and Procurement Trends
- 5.4 Supply-Demand Gap and Bottlenecks
- 5.5 Import Dependence and Sourcing Structure
- 5.6 Regional Supply and Demand Concentration
Chapter 6 Global Drone Light Show Market Pricing Analysis
- 6.1 Pricing Structure and Measurement
- 6.2 Historical Pricing Trends, 2018-2025
- 6.3 Pricing Outlook, 2025-2035
- 6.4 Pricing by Product and Market Segment
- 6.5 Geographic Pricing Differences
- 6.6 Key Input, Energy, Labor and Logistics Costs
- 6.7 Contract Pricing and Purchasing Models
- 6.8 Pricing Sensitivity and Competitive Positioning
- 6.9 Price, Margin and Profitability Implications
Chapter 7 Global Drone Light Show Market Dynamics
- 7.1 Market Growth Drivers
- 7.1.1 Demand-Side Drivers
- 7.1.2 Technology and Innovation Drivers
- 7.1.3 Infrastructure and Investment Drivers
- 7.1.4 Regulatory and Policy Drivers
- 7.2 Market Restraints
- 7.2.1 Cost and Affordability Constraints
- 7.2.2 Technology and Adoption Barriers
- 7.2.3 Supply Chain and Operational Constraints
- 7.3 Market Challenges
- 7.3.1 Competitive Pressure and Margin Erosion
- 7.3.2 Skills, Infrastructure and Implementation Gaps
- 7.4 Emerging Market Opportunities
- 7.5 Market Dynamics Impact and Time-Horizon Assessment
Chapter 8 Global Drone Light Show Value Chain Analysis
- 8.1 Industry Value Chain Overview
- 8.2 Upstream Suppliers and Critical Inputs
- 8.3 Technology and Component Providers
- 8.4 Manufacturing or Service Delivery
- 8.5 Distribution, Channel Partners and Integrators
- 8.6 Downstream Applications and End Users
- 8.7 Value Addition and Profit Pools
- 8.8 Vertical Integration and Outsourcing
- 8.9 Supplier Concentration and Risk
- 8.10 Supply Chain Localization and Resilience
Chapter 9 Global Drone Light Show Market Regulations and Policies
- 9.1 Relevant Laws, Standards and Compliance Frameworks
- 9.2 Product, Service, Safety and Quality Requirements
- 9.3 Government Policies, Incentives and Subsidies
- 9.4 Imports, Exports and Trade Barriers
- 9.5 Public Procurement and Local Content Requirements
- 9.6 Data Protection, AI and Cybersecurity Compliance
- 9.7 Upcoming Policy Changes and Market Implications
Chapter 10 Global Drone Light Show Market Hotspots and Opportunities
- 10.1 Market Opportunity Mapping and Growth Hotspots
- 10.2 High-Growth Applications and Customer Groups
- 10.3 Underserved Markets and White-Space Opportunities
- 10.4 Emerging Technology and Product Opportunities
- 10.5 New Capacity and Investment Hotspots
- 10.6 Market Entry and Expansion Opportunities
- 10.7 Distribution and Partnership Opportunities
- 10.8 Near-Term and Long-Term Commercial Potential
- 10.9 Opportunity Attractiveness and Execution Risks
Chapter 11 Global Drone Light Show Market Outlook, 2025-2035
- 11.1 Market Size and Analysis
- 11.1.1 Revenue (Market Measurement: 2025: USD 412.3 million → 2035: USD 1.53 billion)
- 11.1.2 Historical Market Size, 2018-2025
- 11.1.3 Base-Year Market Size, 2025
- 11.2 Market Forecast, 2025-2035
- 11.2.1 Revenue Forecast to 2035
- 11.2.2 CAGR and Year-on-Year Growth
- 11.2.3 Incremental Revenue Opportunity
- 11.3 Forecast Assumptions and Scenario Analysis
- 11.3.1 Base-Case Forecast
- 11.3.2 Optimistic and Conservative Scenarios
- 11.3.3 Technology, Pricing and Policy Sensitivities
- 11.4 Market Attractiveness and Growth Outlook
Chapter 12 Global Drone Light Show Market Segmentation and Outlook
- 12.1 Segmentation Summary and Market Shares, 2025
- 12.2 Largest and Fastest-Growing Segments
- 12.3 By Event - Market Size and Forecast, 2025-2035
- 12.3.1 Segment Definition and Scope
- 12.3.2 Historical Market Size, 2018-2025
- 12.3.3 Revenue Forecast, 2025-2035
- 12.3.4 Base-Year Market Share, 2025
- 12.3.5 Segment CAGR and Growth Drivers
- 12.3.6 Subsegment Market Size and Forecast
- 12.3.6.1 National Celebrations
- 12.3.6.2 Festivals
- 12.3.6.3 Brand Launches
- 12.3.6.4 Weddings
- 12.3.7 Subsegment Pricing and Adoption Trends
- 12.3.8 Leading Suppliers and Competition
- 12.3.9 Regional Demand and Opportunities
- 12.4 By Fleet Size - Market Size and Forecast, 2025-2035
- 12.4.1 Segment Definition and Scope
- 12.4.2 Historical Market Size, 2018-2025
- 12.4.3 Revenue Forecast, 2025-2035
- 12.4.4 Base-Year Market Share, 2025
- 12.4.5 Segment CAGR and Growth Drivers
- 12.4.6 Subsegment Market Size and Forecast
- 12.4.6.1 Below 500 Drones
- 12.4.6.2 500 to 2,000 Drones
- 12.4.6.3 Above 2,000 Drones
- 12.4.7 Subsegment Pricing and Adoption Trends
- 12.4.8 Leading Suppliers and Competition
- 12.4.9 Regional Demand and Opportunities
- 12.5 By Key Country - Market Size and Forecast, 2025-2035
- 12.5.1 Segment Definition and Scope
- 12.5.2 Historical Market Size, 2018-2025
- 12.5.3 Revenue Forecast, 2025-2035
- 12.5.4 Base-Year Market Share, 2025
- 12.5.5 Segment CAGR and Growth Drivers
- 12.5.6 Subsegment Market Size and Forecast
- 12.5.6.1 China
- 12.5.6.2 United States
- 12.5.6.3 India
- 12.5.6.4 Middle East
- 12.5.6.5 Rest of World
- 12.5.7 Subsegment Pricing and Adoption Trends
- 12.5.8 Leading Suppliers and Competition
- 12.5.9 Regional Demand and Opportunities
- 12.6 Segment Growth Comparison
- 12.7 Segment Attractiveness and Priority Matrix
Chapter 13 Global Drone Light Show Geographic Market Outlook, 2025-2035
- 13.1 Regional Market Size and Share, 2025
- 13.2 Regional Market Forecast, 2025-2035
- 13.3 Regional Pricing, Production and Demand Differences
- 13.4 North America
- 13.4.1 United States
- 13.4.2 Canada
- 13.4.3 Mexico
- 13.5 Europe
- 13.5.1 Germany
- 13.5.2 France
- 13.5.3 Italy
- 13.5.4 United Kingdom
- 13.5.5 Spain
- 13.5.6 Poland
- 13.5.7 Russia
- 13.5.8 Netherlands
- 13.5.9 Belgium
- 13.5.10 Sweden
- 13.5.11 Denmark
- 13.5.12 Norway
- 13.5.13 Rest of Europe
- 13.6 Asia Pacific
- 13.6.1 China
- 13.6.2 India
- 13.6.3 Japan
- 13.6.4 South Korea
- 13.6.5 Thailand
- 13.6.6 Indonesia
- 13.6.7 Vietnam
- 13.6.8 Malaysia
- 13.6.9 Australia
- 13.6.10 Rest of Asia Pacific
- 13.7 Latin America
- 13.7.1 Brazil
- 13.7.2 Argentina
- 13.7.3 Colombia
- 13.7.4 Chile
- 13.7.5 Rest of Latin America
- 13.8 Middle East
- 13.8.1 Saudi Arabia
- 13.8.2 United Arab Emirates
- 13.8.3 Turkey
- 13.8.4 Israel
- 13.8.5 Iran
- 13.8.6 Rest of the Middle East
- 13.9 Africa
- 13.9.1 South Africa
- 13.9.2 Egypt
- 13.9.3 Nigeria
- 13.9.4 Morocco
- 13.9.5 Rest of Africa
- 13.10 Regional Investment, Policy and Supply Chain Differences
- 13.11 Regional Competitive Landscape
- 13.12 Geographic Growth Hotspots
Chapter 14 Global Drone Light Show Technology, Innovation and Sustainability Outlook
- 14.1 Technology Landscape and Maturity
- 14.2 Product, Process and Service Innovation
- 14.3 AI, Automation and Digital Tools in the Industry
- 14.4 Technology Adoption and Performance Benchmarking
- 14.5 Innovation Pipeline and R&D Investment
- 14.6 Energy Efficiency and Resource Management
- 14.7 Sustainability, Recycling and Circularity
- 14.8 Technology Roadmap, 2025-2035
- 14.9 Risks of Obsolescence and Technology Substitution
Chapter 15 Global Drone Light Show Market Key Strategic Imperatives
- 15.1 Growth and Market Entry Priorities
- 15.2 High-Return Products and Segments
- 15.3 Pricing, Profitability and Cost Optimization
- 15.4 Technology Investment and Product Differentiation
- 15.5 Supply Chain Localization and Resilience
- 15.6 Distribution and Customer Acquisition
- 15.7 Partnership, Acquisition and Capacity Strategy
- 15.8 Regional Expansion Priorities
- 15.9 Short-, Medium- and Long-Term Actions
Chapter 16 Competition Outlook
- 16.1 Industry Competition Characteristics
- 16.2 Market Structure and Concentration
- 16.3 Market Share and Competitive Positioning, 2025
- 16.4 Company-Wise Revenue and Product Benchmarking
- 16.5 Production and Service Capacity Benchmarking
- 16.6 Technology, Pricing and Differentiation
- 16.7 Regional Footprint and Distribution Strength
- 16.8 Mergers, Acquisitions and Strategic Alliances
- 16.9 New Entrants and Competitive Threats
- 16.10 Porter's Five Forces and Industry Attractiveness
- 16.11 Competitive Outlook, 2025-2035
Chapter 17 Company Profiles
- 17.1 Company Coverage and Selection Criteria
- 17.2 Sky Elements
- 17.2.1 Business Description
- 17.2.2 Company Ownership and Geographic Presence
- 17.2.3 Product and Service Portfolio
- 17.2.4 Manufacturing and Operating Footprint
- 17.2.5 Financial Performance and Investment
- 17.2.6 Market Share and Competitive Position
- 17.2.7 Technology and Innovation Capabilities
- 17.2.8 Strategic Alliances or Partnerships
- 17.2.9 Recent Developments
- 17.2.10 Growth Strategy and Outlook
- 17.3 Verge Aero
- 17.4 DAMODA
- 17.5 Botlab Dynamics
- 17.6 Nova Sky Stories
- 17.7 EHang
- 17.8 Dronisos
- 17.9 Other Relevant Market Participants
Note: Every listed company is profiled on the structure shown under the first company. The company list is preliminary and may change based on research findings, market developments, data availability and client requirements.
Chapter 18 Disclaimer
- 18.1 Research and Forecast Disclaimer
- 18.2 Data Source and Estimation Limitations
Note: The depth of individual sections depends on data availability for this market. Volume, capacity, trade and other unit-based metrics are included where applicable.

