
Prepaid flight hours make private flying a retail product
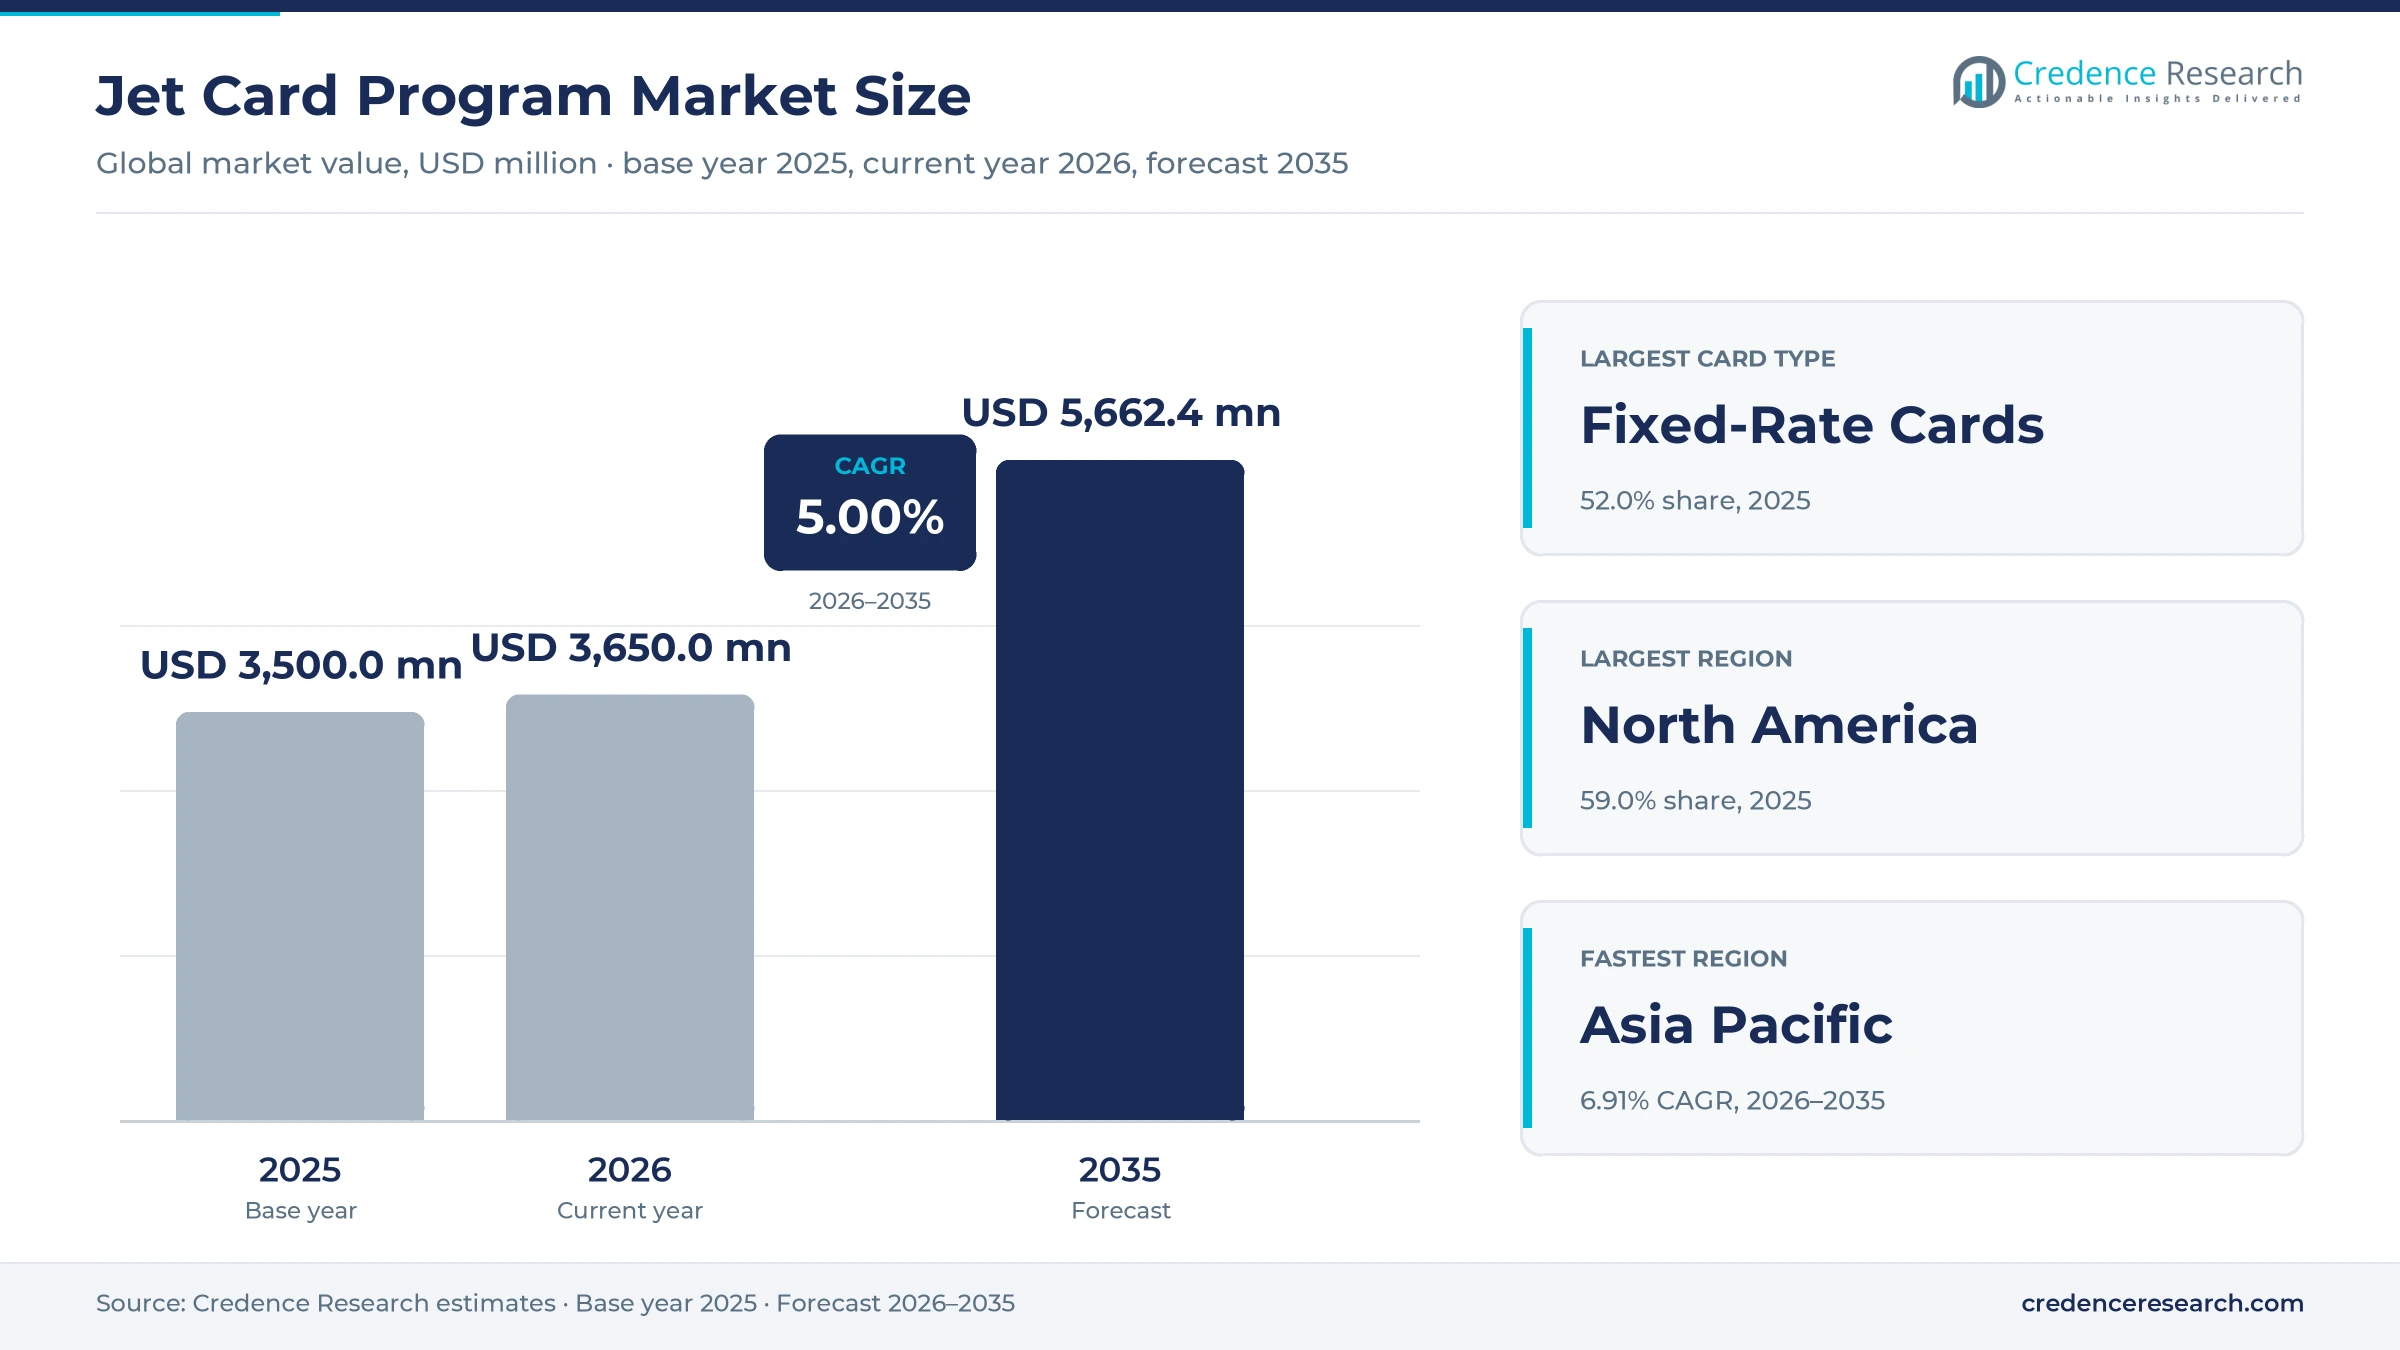
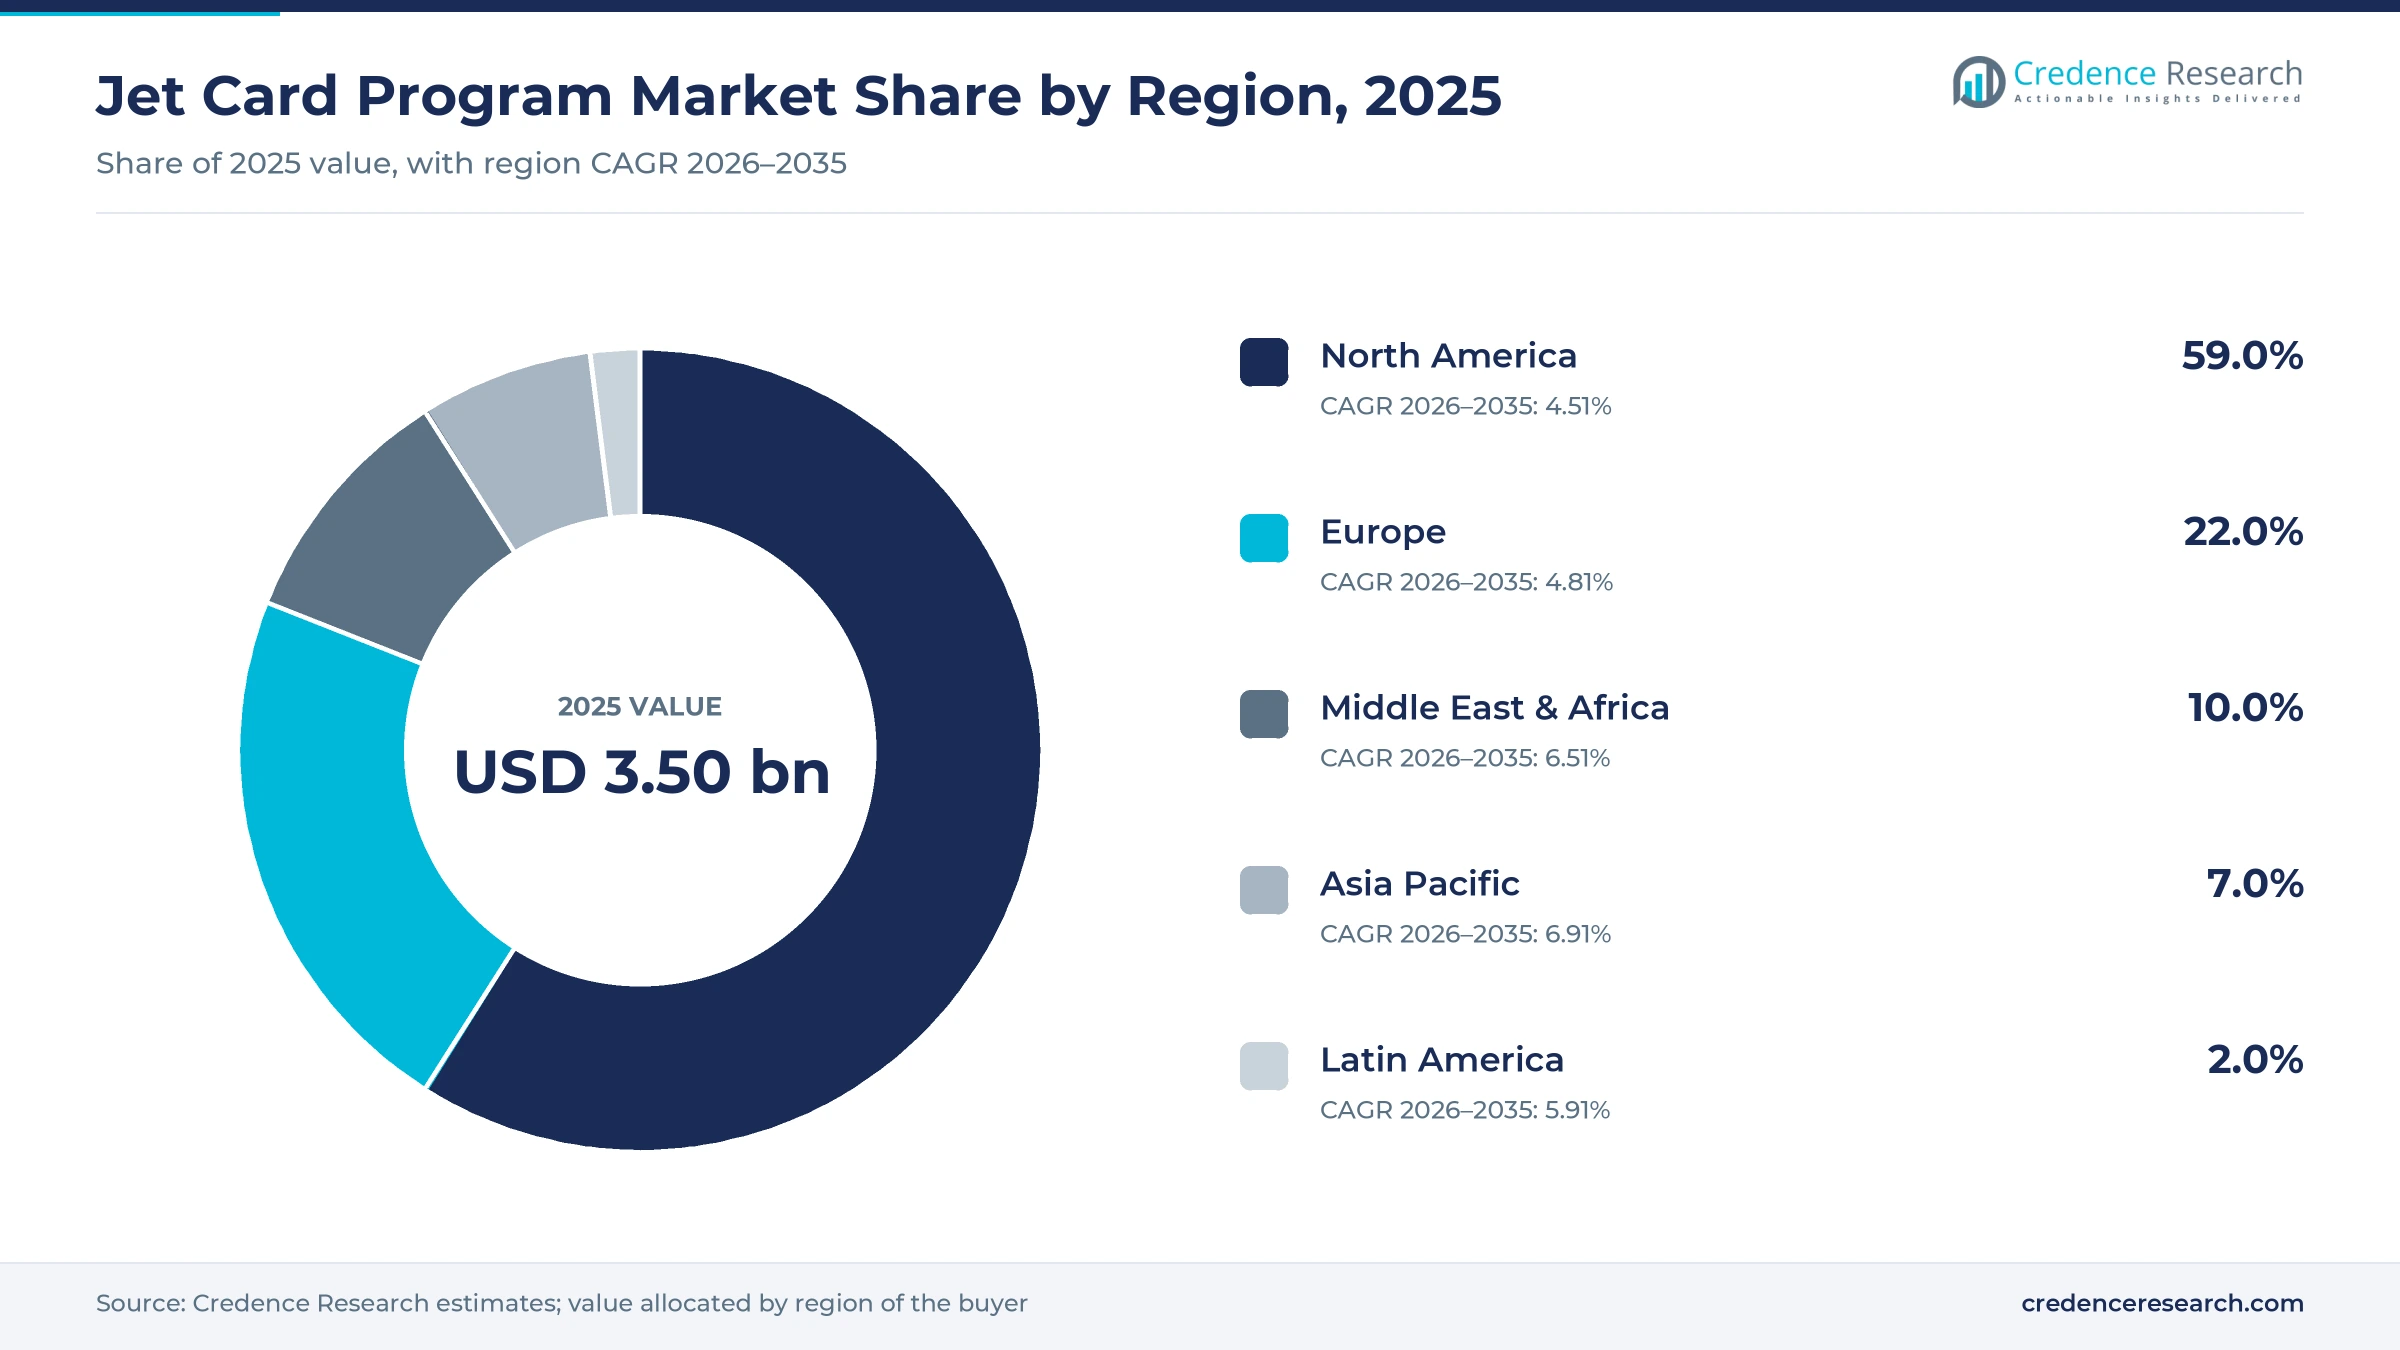
The global jet card program market was valued at USD 3.50 billion in 2025 and is projected to increase from USD 3.65 billion in 2026 to USD 5.66 billion by 2035, registering a CAGR of 5.00% during 2026–2035. Demand comes from wealthy families, executives and companies that want private aircraft on short notice without buying or co-owning one, so they prepay a fund or a block of hours at an agreed rate. North America held the largest regional share, 59.0% in 2025, because the U.S. has the deepest fleet of fractional and charter operators and the largest population of millionaires. Asia Pacific is the fastest-growing region at 6.91% a year, as operators add membership sales teams in Japan, Singapore and Hong Kong. The main commercial change is a move from flat hourly cards toward deposit-based memberships that blend fixed and dynamic pricing. Operators are also tying card products to their own new aircraft deliveries, which makes guaranteed availability easier to promise.
What does a jet card program include, and what sits outside it?
The market counts the value of prepaid private flight access sold as jet cards, flight funds and membership programs, where a customer deposits money or buys a block of hours and then books flights at set or capped terms. Fixed-rate cards quote an hourly price by cabin class, dynamic-pricing cards draw down a fund at the market price of each trip, and memberships add a fee for access and priority. Most programs promise aircraft availability with a set call-out time, often 24 to 48 hours outside peak days.
The market excludes ad hoc charter bought trip by trip, fractional share purchases, whole aircraft ownership and scheduled shared flights sold by the seat. Value passes from the program seller, which may operate its own fleet or broker third-party aircraft, to operators, crews, fuel suppliers and airports that serve each flight.
Jet Card Program Market Insights
- The jet card program market of USD 3.50 billion in 2025 is forecast to reach USD 5.66 billion by 2035, growing at a 5.00% CAGR over 2026–2035 as prepaid flying spreads beyond the U.S.
- North America held 59.0% of 2025 value, while Asia Pacific grows fastest at 6.91% a year as Program memberships rise in Japan and Singapore.
- Fixed-rate cards led the card type split with 52.0% in 2025, because NetJets, Wheels Up and Sentient Jet all sell hourly rates set in advance.
- Average jet card hourly rates ended 2025 at $11,244, up only 1.7% from a year earlier and 26.9% above the fourth quarter of 2019.
- Embraer and Flexjet agreed an order valued at up to $7 billion in February 2025, including 182 firm aircraft, the largest firm order for both companies.
Fixed-rate cards, midsize jets and wealthy flyers hold value
Why do fixed-rate cards still carry most prepaid hours?
Based on card type, the market is categorized into fixed-rate cards, dynamic-pricing cards and memberships. Fixed-Rate Cards led with 52.0% of 2025 value because large operators quote set hourly prices, and NetJets priced its Card275 Phenom 300 option at $8,600 an hour, or $215,000 for 25 hours, in January 2025. Dynamic-Pricing Cards grow fastest at 6.22% a year as brokers add fund-based products, including the Bitlux Premier program launched in November 2025 with a $150,000 deposit. Memberships hold the middle ground, since Wheels Up now charges a $500 monthly fee on its Signature Membership.
Which cabin class do card buyers fly most often?
Based on aircraft type, the market is categorized into light jets, midsize jets and heavy jets. Midsize Jets led with 39.0% of 2025 value because they cover most two- to four-hour U.S. trips, and the Wheels Up Signature program quotes its Challenger 300 at $12,695 an hour at the $1 million deposit tier. Light jets stay cheaper, at an average card rate of $8,320 an hour in the fourth quarter of 2025. Heavy Jets grow fastest at 5.47% a year as Sentient Jet launched a Large Cabin Edition card in November 2025 with fixed transatlantic rates.
How much prepaid flying comes from private wealth?
Based on end user, the market is categorized into high-net-worth individuals, corporate clients and others. High-Net-Worth Individuals led with 63.0% of 2025 value because most cards are bought by families and owners of private companies, and UBS counted nearly one million new dollar millionaires worldwide in 2025. Corporate Clients grow fastest at 5.49% a year as programs build products for company travel departments, such as the PJS Corporate Jet Card, which starts at a $500,000 refundable deposit held with JPMorgan Chase. Others include sports teams, entertainment tours and government users that book occasional blocks.
| Segment Group | Leading Sub-segment | Share, 2025 | Fastest-growing Sub-segment | CAGR, 2026–2035 |
|---|---|---|---|---|
| By Card Type | Fixed-Rate Cards | 52.0% | Dynamic-Pricing Cards | 6.22% |
| By Aircraft Type | Midsize Jets | 39.0% | Heavy Jets | 5.47% |
| By End User | High-Net-Worth Individuals | 63.0% | Corporate Clients | 5.49% |
Request a Free Sample
Fill in your details and we'll send you a free sample report.
- Sample data tables & charts
- Research methodology
New wealth, fixed rates and fleet orders lift card sales
New wealth is widening the pool of private flyers
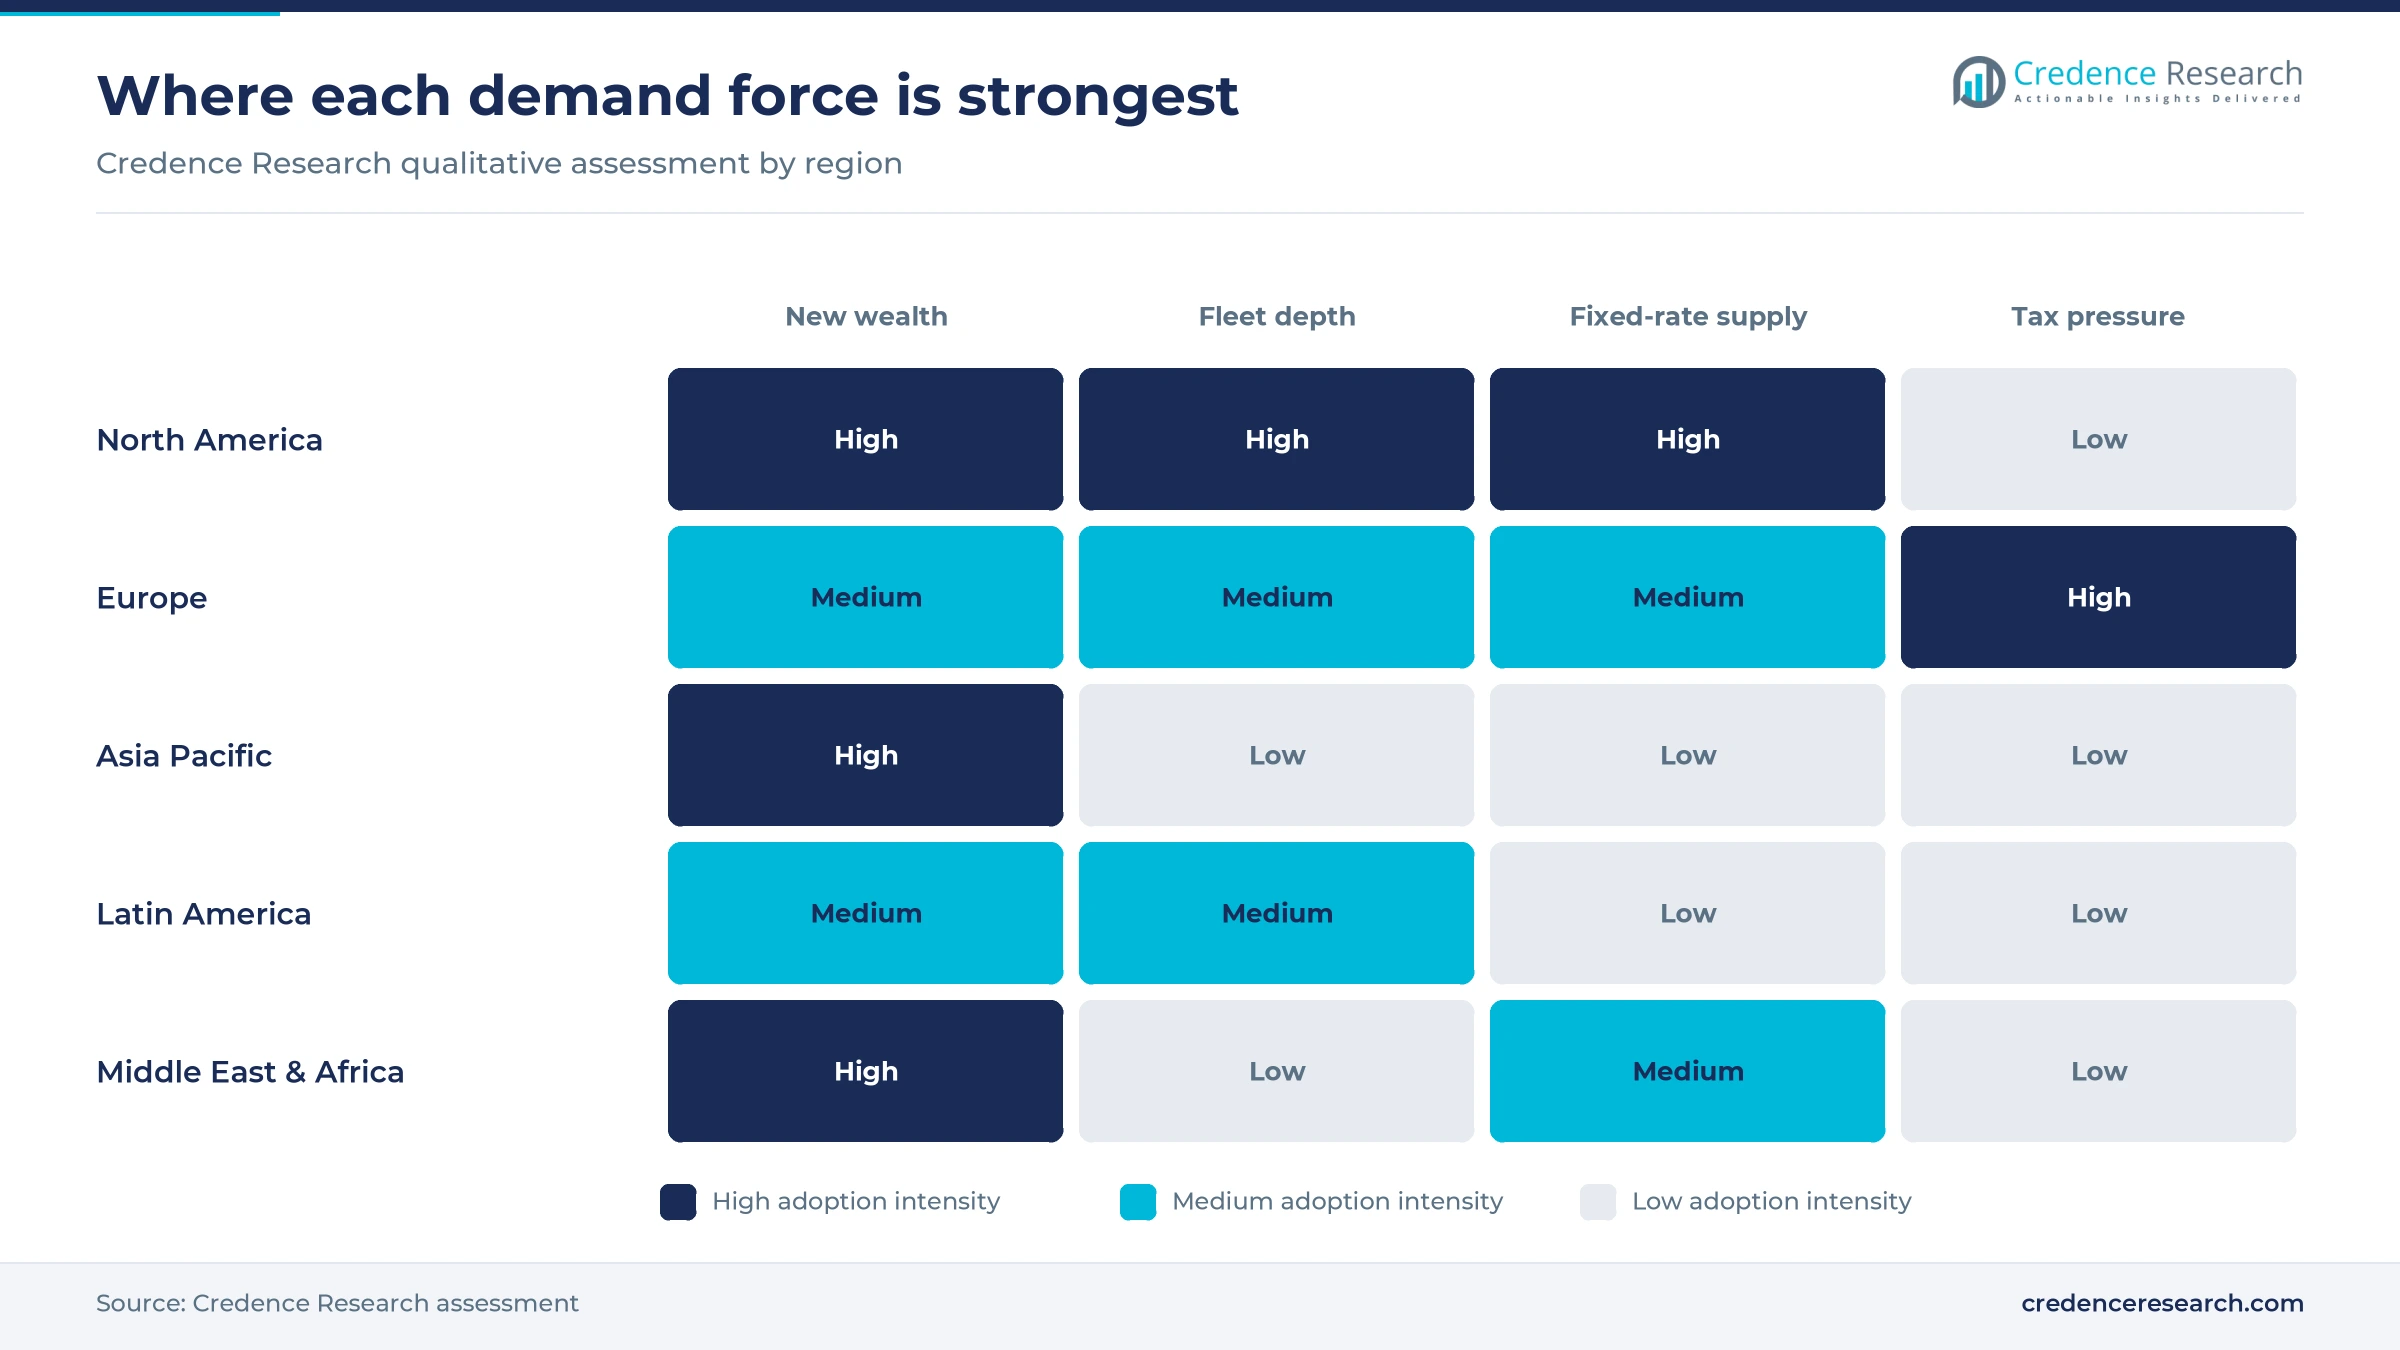
Each wave of new wealth adds buyers who want private access without the cost of ownership. UBS said in its June 2026 Global Wealth Report that nearly one million people became dollar millionaires in 2025, with the U.S. adding more than 440,000 of them. Knight Frank counted 713,626 people worth more than $30 million in 2026, up from 551,435 in 2021, and India alone rose 63% over that period. VistaJet reported a 12% rise in its Program member base in 2025, according to data in the Knight Frank Wealth Report. In the Credence Research model this demand adds about 1.85 percentage points to annual growth to 2035, the largest single driver.
Fixed rates and guaranteed access make pricing simple
Cards remove the price swings of trip-by-trip charter, which is why many first-time flyers start with one. Average hourly card rates reached $11,244 in the fourth quarter of 2025, up only 1.7% from a year earlier, while U.S. consumer prices rose 26.3% since 2019, according to Private Jet Card Comparisons. Peak days fell 20.1% to an average of 35.6 per program over the same year, so buyers face fewer blackout surcharges. Wheels Up took fixed rates nationwide on Sept. 3, 2025, quoting the Phenom 300 at $8,695 an hour at the $1 million tier. In the Credence Research model this simplicity adds about 1.50 percentage points to annual growth.
Business and leisure trips keep flight-hour blocks renewing
Cards are used up and renewed, so steady trip volumes translate directly into repeat sales of flight hours. WingX counted a record 3,878,336 private jet departures worldwide in 2025, up about 4.6% from 2024. Charter and fractional departures reached 2,010,143, up from 1,906,287 in 2024 and 36% above 2019, and the U.S. share of that flying rose 6%. ARGUS TRAQPak data showed NetJets flying 719,086 hours in 2025, up 8.08%, while Flexjet flew 284,533 hours, up 19.64%. Card buyers often combine these trips with luxury travel bookings. In the Credence Research model this repeat demand adds about 0.90 percentage points to annual growth.
Fleet orders give sellers aircraft to guarantee
A card is only as good as the aircraft behind it, so new deliveries let operators sell more guaranteed hours. Flexjet placed an order valued at up to $7 billion with Embraer in February 2025 that included 182 firm aircraft, the largest firm order for both companies. NetJets expects more than 80 factory-new aircraft in 2026 and holds options for well over 1,500 deliveries from Bombardier, Embraer and Textron Aviation. Wheels Up plans to double its Phenom 300 and Challenger 300 fleets in 2026. Honeywell forecast 8,500 new business jet deliveries worth $283 billion over the next decade in its October 2025 outlook, which supports capacity across all cabin classes.
Deposit memberships and large-cabin cards reshape the offer
The shift to deposit-based memberships replaces legacy cards
Sellers are moving from flat-rate blocks to funds that customers top up, which spreads risk and keeps deposits on account. Wheels Up launched its Signature Membership in September 2025 with deposit tiers of $250,000 to $1 million, and it closed sales of legacy memberships on March 31, 2026, according to Corporate Jet Investor. Bitlux added a dynamic-pricing membership in November 2025 beside its fixed-rate program. PJS Group holds corporate card deposits with JPMorgan Chase and refunds unused funds. As a result, dynamic-pricing cards grow at 6.22% a year in the Credence Research estimate, the quickest rate among card types.
The rise of large-cabin cards follows long-range flying
Long-range trips are lifting demand for card products built around larger aircraft. Sentient Jet launched a Large Cabin Edition card in November 2025, covering Falcon 900, Gulfstream and Bombardier Global jets with fixed domestic and transatlantic rates. Large-cabin card rates averaged $15,264 an hour in the fourth quarter of 2025, up 0.4% on the year, while light jet rates rose 3.0%. VistaJet data showed Middle East to North America flights up 28% in 2025, and Flexjet added Gulfstream G700s to its fleet. Heavy jets therefore grow at 5.47% a year, faster than other cabin classes, in the Credence Research estimate.
An opening in the Gulf and Asia for membership sales
Fast wealth creation in the Gulf and Asia gives sellers new buyers who have little access to local fractional fleets. VistaJet became the first foreign operator permitted to fly domestic flights within Saudi Arabia, the company said on Aug. 20, 2025, after a 32% rise in Program Members in the Kingdom in the first half. Vista said in October 2025 that Asia Pacific Program memberships rose 26%, with Japan up 67% and Singapore up 50%. Europe to Middle East flights rose 17% in 2025, according to VistaJet data. Operators that place sales staff in Riyadh, Dubai, Tokyo and Singapore can therefore win buyers before rivals build local fleets.
An opening for shared models in Latin America
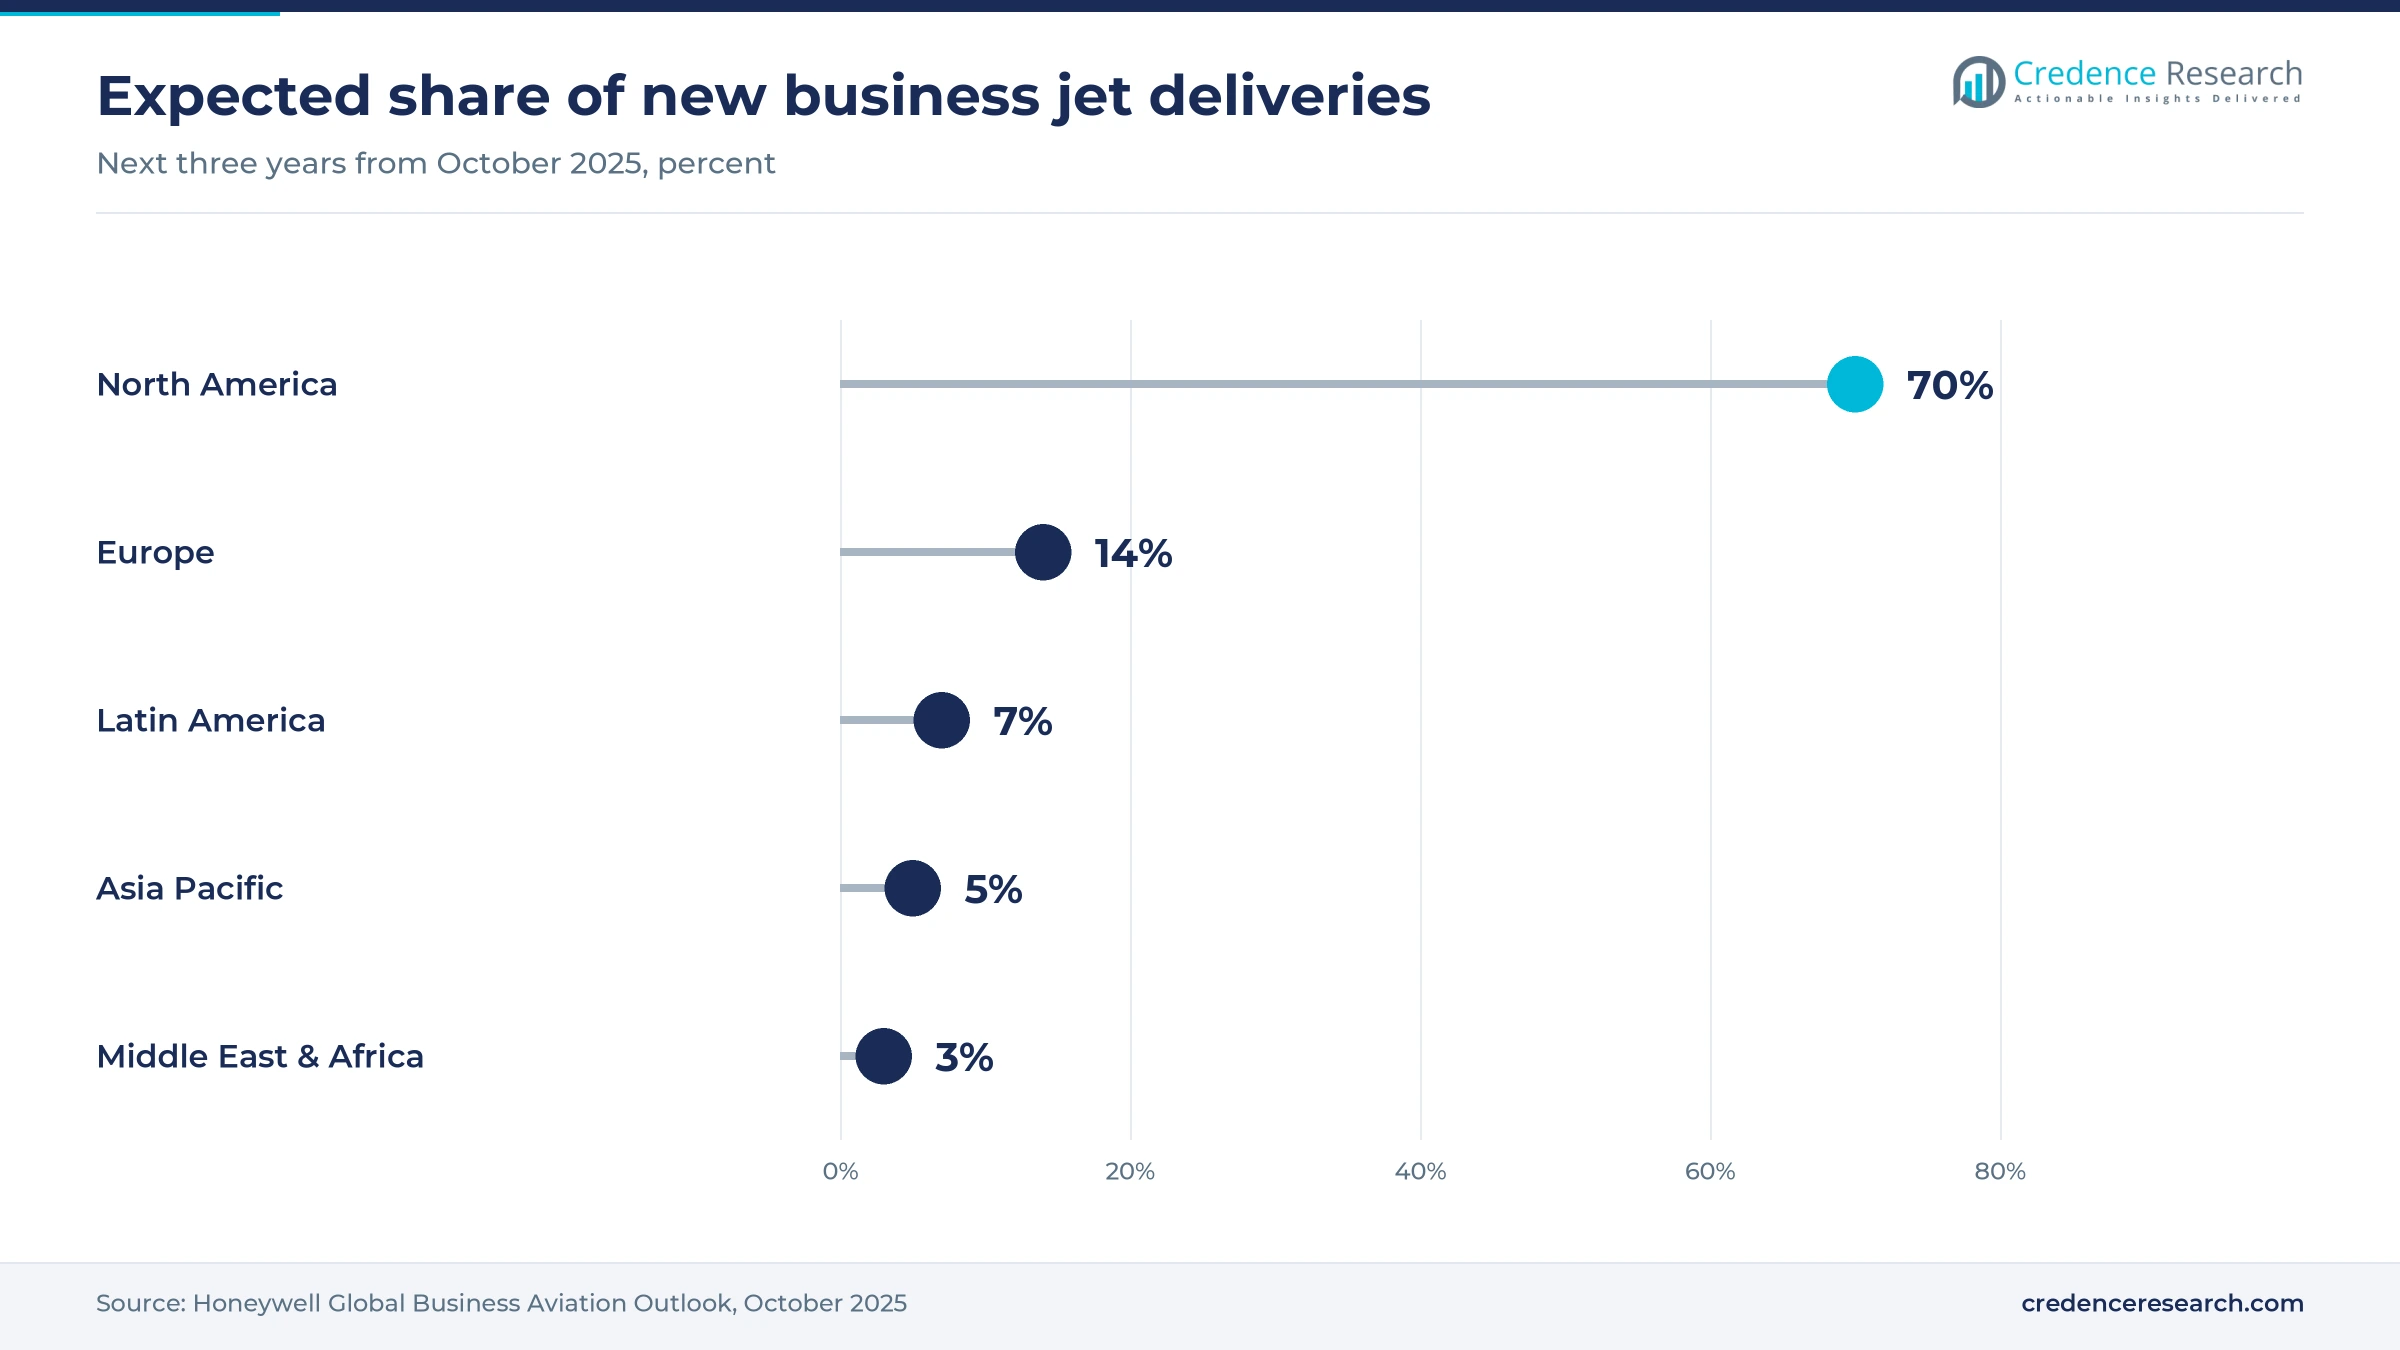
Latin America has a large fleet but few prepaid programs, so card and quota models have room to expand. Flapper launched a shared jet ownership program in Brazil in June 2025, with Hawker 400XP quotas from $550,000 and about R$12,000 per flight hour in variable costs. Honeywell estimated that Latin America holds 15% of the global business jet fleet but only about 7% of new deliveries over the next three years. VistaJet recorded a 28% rise in South America to Europe flights in 2025. Sellers that pair cards with air taxi services on the Sao Paulo and Rio de Janeiro corridor can therefore reach first-time flyers.
Flight taxes, peak days and ownership incentives test growth
New flight taxes raise trip costs in Europe
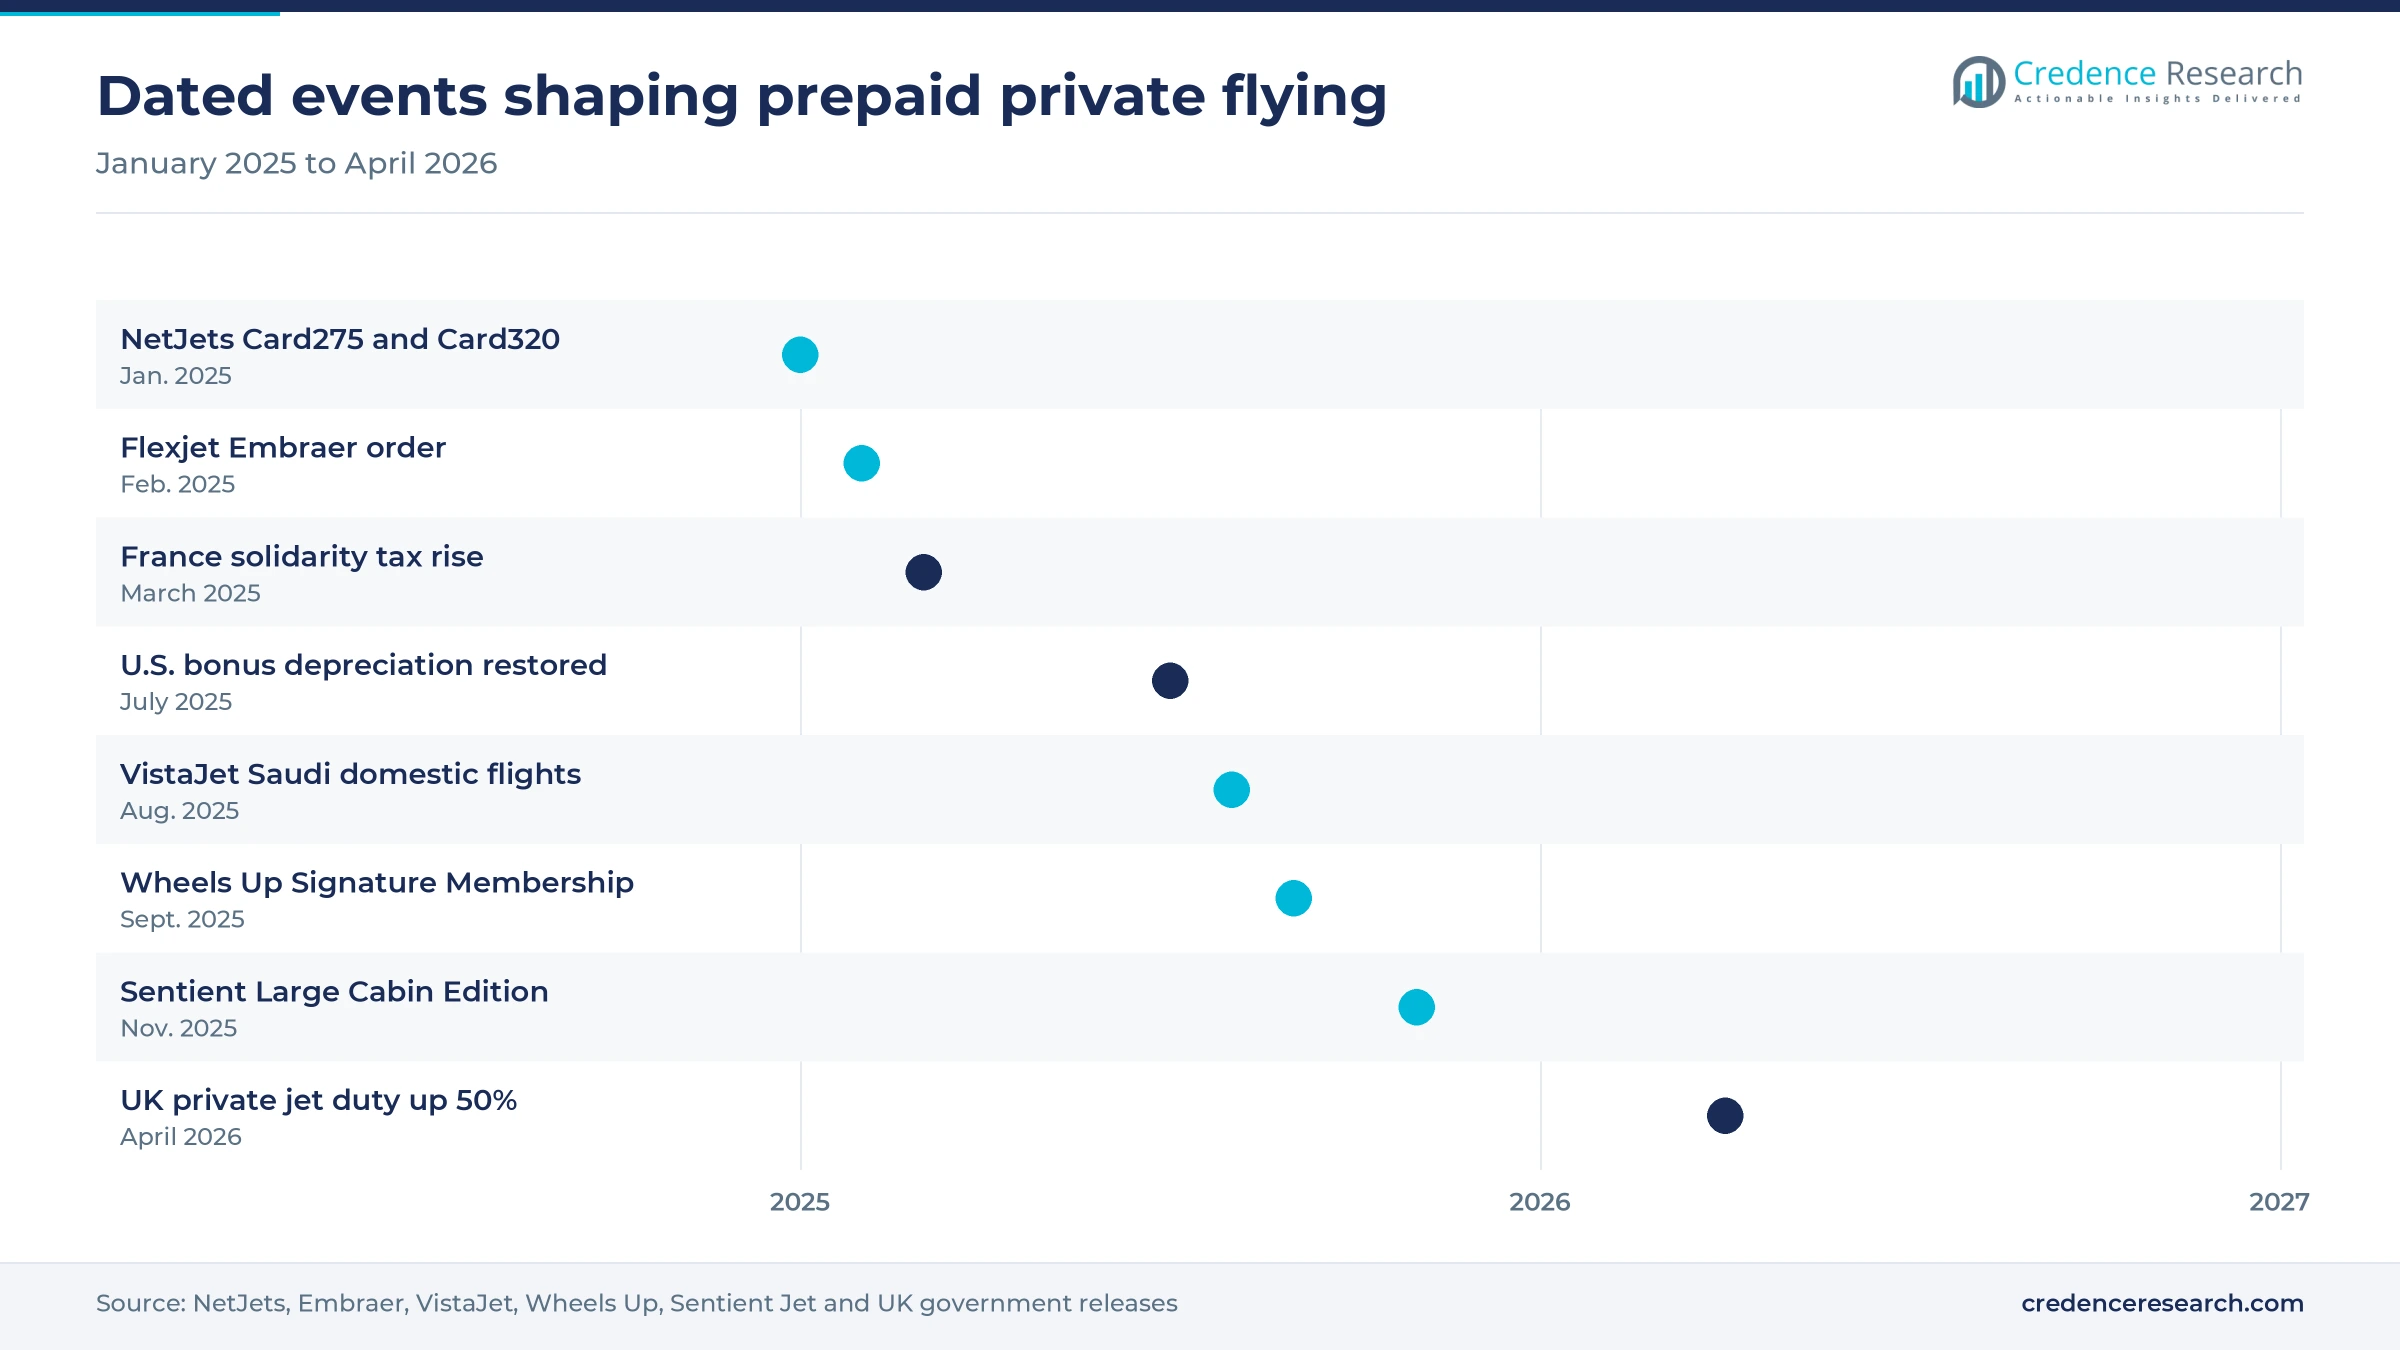
European governments are taxing private flights more heavily, which raises the cost of every card hour flown there. France set its solidarity tax at up to €2,100 per passenger on long-haul turbojet flights from March 1, 2025, according to Universal Weather. The U.K. raised the higher Air Passenger Duty rates for larger private jets by a further 50% from April 1, 2026. Card sellers usually pass these charges on, so European trips cost more than U.S. flights.
Peak-day limits and product changes frustrate buyers
Programs still restrict access on the busiest travel days, which weakens the promise of guaranteed availability. Card programs averaged 35.6 peak days in the fourth quarter of 2025, which was 56.1% above the 22.8 days recorded in late 2019. NetJets stopped selling Citation XLS cards in mid-December 2025 as its fleet moved toward the Citation Ascend, according to AIN. Buyers who must switch aircraft or face surcharges may move to charter, so sellers need clearer renewal terms.
Ownership tax breaks pull heavy flyers away from cards
Tax incentives for ownership can draw the heaviest card users into fractional shares or whole aircraft. The tax law signed on July 4, 2025 restored 100% bonus depreciation for business aircraft placed in service on or after Jan. 19, 2025, according to Flying magazine. Honeywell found that 12% of wholly owned operators also own fractional shares and another 15% are considering them. Card sellers that also offer shares can keep these customers, while pure brokers risk losing them.
Fleet restructuring strains some program operators
Some sellers are cutting fleets and flight hours while they rebuild, which can disrupt member service. Wheels Up flew 82,318 hours in 2025, down 14.42% from 2024, according to ARGUS TRAQPak data. Its annual filing describes a plan, announced in October 2024, to move from four legacy jet models to two newer types. Members of shrinking programs face fewer guaranteed aircraft during the transition, so contract protection and refundable deposits matter more to buyers.
North America leads while Asia Pacific grows the fastest
| Region | Value, 2025 (USD billion) | Share, 2025 | CAGR, 2026–2035 |
|---|---|---|---|
| North America | 2.06 | 59.0% | 4.51% |
| Europe | 0.77 | 22.0% | 4.81% |
| Middle East & Africa | 0.35 | 10.0% | 6.51% |
| Asia Pacific | 0.24 | 7.0% | 6.91% |
| Latin America | 0.07 | 2.0% | 5.91% |
North America leads on fleet depth and card choice
North America held 59.0% of 2025 value and grows at 4.51% a year, because the U.S. has the largest fractional and charter fleets. WingX counted 2,633,282 U.S. private jet departures in 2025, up 5% and about 29% above 2019. Honeywell expects North America to take about 70% of new business jet deliveries over the next three years. Card buyers in the region can compare more than 80 providers and over 1,000 program options, which keeps prices competitive.
Europe grows slowly under higher flight taxes
Europe held 22.0% of 2025 value and grows at 4.81% a year, with demand centered on London, Paris, Geneva and the Mediterranean. WingX counted 555,254 European departures in 2025, up only about 1% and still below the 2022 peak of 600,382. Flexjet runs a European operations center at Farnborough, according to Corporate Jet Investor in March 2026. Summer demand often links card hours with yacht charters along the Riviera, although new taxes in France and the U.K. raise trip costs.
Middle East and Africa gain on Gulf wealth and new corridors
Middle East and Africa held 10.0% of 2025 value and grow at 6.51% a year, led by Saudi Arabia and the UAE. VistaJet member flight hours rose 32% in the Middle East and 30% in Africa in 2025, according to data published in the Knight Frank Wealth Report. The Jeddah to Riyadh city pair rose 269%, and the Africa to Asia corridor grew 42%. Regional conflict and airspace closures remain the main risk to bookings.
Asia Pacific grows fastest from a small base
Asia Pacific held 7.0% of 2025 value and grows fastest at 6.91% a year, as Japan, Singapore and India add wealthy flyers. Vista brought its XO booking platform to Asia in October 2025, offering real-time pricing from Hong Kong and Singapore. Knight Frank reported that India's ultra-wealthy population rose 63% between 2021 and 2026. Airport slot limits and fewer local fleets still make guaranteed access more expensive than in the U.S.
Latin America builds prepaid flying around Brazil
Latin America held 2.0% of 2025 value and grows at 5.91% a year, with Brazil as the largest buyer base. Flapper said in June 2025 that it has served more than 30,000 customers and can access more than 3,550 certified aircraft. Its new quota program targets the Sao Paulo to Rio de Janeiro corridor first. Currency swings raise the cost of dollar-priced cards, which keeps many buyers on trip-by-trip charter.
Dated moves that changed how flight hours are sold
| Development | Status and market relevance |
|---|---|
| In January 2025, NetJets rebranded its card lineup as Card275 and Card320, pricing the Phenom 300 from $8,600 an hour. | Active; lowered the entry price for a 25-hour card to $215,000. |
| In February 2025, Embraer and Flexjet announced an order valued at up to $7 billion, including 182 firm aircraft. | Firm order; adds guaranteed fleet capacity for Flexjet programs. |
| In August 2025, VistaJet received approval to operate domestic flights within Saudi Arabia. | Active; first foreign operator allowed to fly inside the Kingdom. |
| In September 2025, Wheels Up launched its Signature Membership with nationwide fixed rates. | Active; legacy membership sales closed on March 31, 2026. |
| In November 2025, Sentient Jet introduced a Large Cabin Edition card with fixed transatlantic rates. | Active; extends card pricing to long-range aircraft. |
Booking apps, live pricing and fleet data shape the card
- Booking apps now handle most card requests, and Wheels Up added Delta commercial flight self-booking to its app in January 2026, according to its annual filing.
- Real-time pricing engines quote fund-based trips at market prices, as Vista does through the XO app it brought to Asia in October 2025.
- Flight-hour tracking data lets buyers compare operators, since ARGUS TRAQPak publishes yearly hours flown by each fleet.
- Sustainable aviation fuel and carbon programs add a per-hour fee on some cards, as Wheels Up bills a carbon offset charge per flight hour.
Need a Custom Version of This Report?
Tailor the scope, geography, or segments to your exact requirements.
- Custom geography or segment scope
- Direct access to our analyst team
Fleet operators and brokers compete for prepaid hours
Competition runs along two lines, control of aircraft and control of the customer. NetJets and Flexjet own or manage the largest fractional fleets and use them to guarantee card hours, which lets them promise service on peak days that brokers cannot. VistaJet competes on long-range, large-cabin flying and on its Program membership, which is strongest in Europe, the Middle East and Asia. Wheels Up is rebuilding its offer around two aircraft types and a deposit-based Signature Membership. Sentient Jet, part of Directional Aviation, operates as a broker that sources aircraft from vetted operators and competes on fixed rates and service. Smaller sellers such as Bitlux, Jetvia and PJS Group compete on lower deposits and dynamic pricing. Buyers should expect more blended products, with fixed rates on core routes and market pricing elsewhere.
Which companies shape prepaid private flying, and what does each control?
| Company | Type | Role in the market |
|---|---|---|
| NetJets | Fractional operator | Berkshire Hathaway unit selling Card275 and Card320, with about 826 jets |
| Flexjet | Fractional operator | Ordered 182 firm Embraer jets in 2025 and runs a Farnborough base |
| Wheels Up | Membership operator | Sells the Signature Membership on Phenom 300 and Challenger 300 jets |
| Sentient Jet (Directional Aviation) | Card broker | Launched a Large Cabin Edition card in November 2025 |
| VistaJet | Global operator | Program membership seller, first foreign operator flying inside Saudi Arabia |
Why guaranteed aircraft supply matters more than price
Credence Research's view is that guaranteed aircraft supply matters more than headline hourly price. Card rates rose only 1.7% in 2025, so price is no longer the main way sellers win. The buyers who renew are those whose aircraft arrived on time during peak weeks, which favors operators with large owned fleets and firm delivery slots. Brokers can still compete, but only by moving toward deposit funds and transparent dynamic pricing. The most useful signal for buyers is therefore the number of peak days and the call-out time in each contract.
How Credence Research built this market estimate
The report uses 2025 as the base year and 2026 to 2035 as the forecast period. Market values come from the Credence Research model, built from estimated card and membership flight hours multiplied by average hourly rates by cabin class, and checked against published operator flight-hour data. All segment and regional splits shown here are Credence Research estimates. Sources are company releases, regulatory filings, government tax notices, flight activity data and news reports, and no interviews or surveys were conducted for this edition.
Gulf, Asian and large-cabin demand shape growth to 2035
Prepaid flying should reach USD 5.66 billion by 2035 as new wealth in the Gulf and Asia creates buyers and operators take delivery of hundreds of new jets. Honeywell expects 2026 deliveries to run about 5% above 2025, which supports guaranteed capacity. Growth should stay steady rather than rapid, because card rates are rising slowly and the heaviest users can move to ownership. The main uncertainties are flight taxes in Europe, peak-day capacity and operator finances. Sellers that combine owned fleets with flexible deposit products should capture most of the new demand.
Frequently Asked Questions
How big is the jet card program market?
What is a jet card?
How much does a jet card cost per hour?
Which region leads the jet card market?
What is the difference between a fixed-rate and a dynamic-pricing card?
Who are the main jet card providers?
Is a jet card better than fractional ownership?
Which card type grows fastest?
Table of Content
Chapter 1 Market Segmentation
- 1.1 Segmentation Framework
- 1.1.1 Product and Service Classification
- 1.1.2 Application and End-Use Classification
- 1.1.3 Technology and Solution Classification
- 1.1.4 Customer and Distribution Channel Classification
- 1.1.5 Geographic Segmentation
- 1.1.6 Market Segment Definitions and Boundaries
- 1.2 By Card Type
- 1.2.1 Fixed-Rate Cards
- 1.2.2 Dynamic-Pricing Cards
- 1.2.3 Memberships
- 1.3 By Aircraft Type
- 1.3.1 Light Jets
- 1.3.2 Midsize Jets
- 1.3.3 Heavy Jets
- 1.4 By End User
- 1.4.1 High-Net-Worth Individuals
- 1.4.2 Corporate Clients
- 1.4.3 Others
Chapter 2 Introduction
- 2.1 Report Objectives and Scope
- 2.2 Product Definition and Industry Terminology
- 2.3 Market Inclusions and Exclusions
- 2.4 Research Process
- 2.4.1 Primary Research and Expert Interviews
- 2.4.2 Secondary Research and Source Review
- 2.4.3 Top-Down and Bottom-Up Estimation
- 2.4.4 Data Triangulation and Verification
- 2.5 Market Size Measurement Basis
- 2.5.1 2025: USD 3.50 billion → 2035: USD 5.66 billion
- 2.6 Historical and Forecast Reference Periods
- 2.6.1 Historical Period: 2018-2025
- 2.6.2 Base Year: 2025
- 2.6.3 Forecast Period: 2025-2035
- 2.7 Research Assumptions and Limitations
Chapter 3 Executive Summary
- 3.1 Market Snapshot and Key Findings
- 3.2 Base-Year Market Size, 2025
- 3.3 Forecast Market Size, 2035
- 3.4 Revenue and Volume Growth Outlook
- 3.5 Key Demand and Supply Indicators
- 3.6 Leading Market Segments
- 3.7 Fastest-Growing Market Opportunities
- 3.8 Regional Performance Highlights
- 3.9 Technology and Industry Transformation
- 3.10 Competitive Landscape Summary
- 3.11 Analyst View and Strategic Implications
Chapter 4 Global Jet Card Program Market Trends and Developments
- 4.1 Historical Industry Development, 2018-2025
- 4.2 Recent Market Trends and Developments
- 4.3 Demand and Customer Behavior Trends
- 4.4 Technology and Product Innovation
- 4.5 Artificial Intelligence, Automation and Digitalization
- 4.6 Local Manufacturing and Supply Chain Realignment
- 4.7 Industry Partnerships, Mergers and Acquisitions
- 4.8 Sustainability and Circular Economy Developments
- 4.9 Government and Private Sector Investment Trends
- 4.10 Emerging Business Models and Commercialization
- 4.11 Industry Developments and Announcements
Chapter 5 Global Jet Card Program Market Supply and Demand Analysis
- 5.1 Demand Trend and Consumption Analysis, 2018-2025
- 5.2 Demand Forecast, 2025-2035
- 5.3 Supply Chain Structure and Procurement Trends
- 5.4 Supply-Demand Gap and Bottlenecks
- 5.5 Import Dependence and Sourcing Structure
- 5.6 Regional Supply and Demand Concentration
Chapter 6 Global Jet Card Program Market Pricing Analysis
- 6.1 Pricing Structure and Measurement
- 6.2 Historical Pricing Trends, 2018-2025
- 6.3 Pricing Outlook, 2025-2035
- 6.4 Pricing by Product and Market Segment
- 6.5 Geographic Pricing Differences
- 6.6 Key Input, Energy, Labor and Logistics Costs
- 6.7 Contract Pricing and Purchasing Models
- 6.8 Pricing Sensitivity and Competitive Positioning
- 6.9 Price, Margin and Profitability Implications
Chapter 7 Global Jet Card Program Market Dynamics
- 7.1 Market Growth Drivers
- 7.1.1 Demand-Side Drivers
- 7.1.2 Technology and Innovation Drivers
- 7.1.3 Infrastructure and Investment Drivers
- 7.1.4 Regulatory and Policy Drivers
- 7.2 Market Restraints
- 7.2.1 Cost and Affordability Constraints
- 7.2.2 Technology and Adoption Barriers
- 7.2.3 Supply Chain and Operational Constraints
- 7.3 Market Challenges
- 7.3.1 Competitive Pressure and Margin Erosion
- 7.3.2 Skills, Infrastructure and Implementation Gaps
- 7.4 Emerging Market Opportunities
- 7.5 Market Dynamics Impact and Time-Horizon Assessment
Chapter 8 Global Jet Card Program Value Chain Analysis
- 8.1 Industry Value Chain Overview
- 8.2 Upstream Suppliers and Critical Inputs
- 8.3 Technology and Component Providers
- 8.4 Manufacturing or Service Delivery
- 8.5 Distribution, Channel Partners and Integrators
- 8.6 Downstream Applications and End Users
- 8.7 Value Addition and Profit Pools
- 8.8 Vertical Integration and Outsourcing
- 8.9 Supplier Concentration and Risk
- 8.10 Supply Chain Localization and Resilience
Chapter 9 Global Jet Card Program Market Regulations and Policies
- 9.1 Relevant Laws, Standards and Compliance Frameworks
- 9.2 Product, Service, Safety and Quality Requirements
- 9.3 Government Policies, Incentives and Subsidies
- 9.4 Imports, Exports and Trade Barriers
- 9.5 Public Procurement and Local Content Requirements
- 9.6 Data Protection, AI and Cybersecurity Compliance
- 9.7 Upcoming Policy Changes and Market Implications
Chapter 10 Global Jet Card Program Market Hotspots and Opportunities
- 10.1 Market Opportunity Mapping and Growth Hotspots
- 10.2 High-Growth Applications and Customer Groups
- 10.3 Underserved Markets and White-Space Opportunities
- 10.4 Emerging Technology and Product Opportunities
- 10.5 New Capacity and Investment Hotspots
- 10.6 Market Entry and Expansion Opportunities
- 10.7 Distribution and Partnership Opportunities
- 10.8 Near-Term and Long-Term Commercial Potential
- 10.9 Opportunity Attractiveness and Execution Risks
Chapter 11 Global Jet Card Program Market Outlook, 2025-2035
- 11.1 Market Size and Analysis
- 11.1.1 Revenue (Market Measurement: 2025: USD 3.50 billion → 2035: USD 5.66 billion)
- 11.1.2 Historical Market Size, 2018-2025
- 11.1.3 Base-Year Market Size, 2025
- 11.2 Market Forecast, 2025-2035
- 11.2.1 Revenue Forecast to 2035
- 11.2.2 CAGR and Year-on-Year Growth
- 11.2.3 Incremental Revenue Opportunity
- 11.3 Forecast Assumptions and Scenario Analysis
- 11.3.1 Base-Case Forecast
- 11.3.2 Optimistic and Conservative Scenarios
- 11.3.3 Technology, Pricing and Policy Sensitivities
- 11.4 Market Attractiveness and Growth Outlook
Chapter 12 Global Jet Card Program Market Segmentation and Outlook
- 12.1 Segmentation Summary and Market Shares, 2025
- 12.2 Largest and Fastest-Growing Segments
- 12.3 By Card Type - Market Size and Forecast, 2025-2035
- 12.3.1 Segment Definition and Scope
- 12.3.2 Historical Market Size, 2018-2025
- 12.3.3 Revenue Forecast, 2025-2035
- 12.3.4 Base-Year Market Share, 2025
- 12.3.5 Segment CAGR and Growth Drivers
- 12.3.6 Subsegment Market Size and Forecast
- 12.3.6.1 Fixed-Rate Cards
- 12.3.6.2 Dynamic-Pricing Cards
- 12.3.6.3 Memberships
- 12.3.7 Subsegment Pricing and Adoption Trends
- 12.3.8 Leading Suppliers and Competition
- 12.3.9 Regional Demand and Opportunities
- 12.4 By Aircraft Type - Market Size and Forecast, 2025-2035
- 12.4.1 Segment Definition and Scope
- 12.4.2 Historical Market Size, 2018-2025
- 12.4.3 Revenue Forecast, 2025-2035
- 12.4.4 Base-Year Market Share, 2025
- 12.4.5 Segment CAGR and Growth Drivers
- 12.4.6 Subsegment Market Size and Forecast
- 12.4.6.1 Light Jets
- 12.4.6.2 Midsize Jets
- 12.4.6.3 Heavy Jets
- 12.4.7 Subsegment Pricing and Adoption Trends
- 12.4.8 Leading Suppliers and Competition
- 12.4.9 Regional Demand and Opportunities
- 12.5 By End User - Market Size and Forecast, 2025-2035
- 12.5.1 Segment Definition and Scope
- 12.5.2 Historical Market Size, 2018-2025
- 12.5.3 Revenue Forecast, 2025-2035
- 12.5.4 Base-Year Market Share, 2025
- 12.5.5 Segment CAGR and Growth Drivers
- 12.5.6 Subsegment Market Size and Forecast
- 12.5.6.1 High-Net-Worth Individuals
- 12.5.6.2 Corporate Clients
- 12.5.6.3 Others
- 12.5.7 Subsegment Pricing and Adoption Trends
- 12.5.8 Leading Suppliers and Competition
- 12.5.9 Regional Demand and Opportunities
- 12.6 Segment Growth Comparison
- 12.7 Segment Attractiveness and Priority Matrix
Chapter 13 Global Jet Card Program End-Use and Application Market Outlook
- 13.1 End-Use Industry and Customer Demand Structure
- 13.2 Leading Applications and Customer Groups
- 13.3 End-Use Market Size, Share and Forecast
- 13.4 Major End-Use Industry Deep Dives
- 13.4.1 Customer Requirements and Use Cases
- 13.4.2 Demand and Replacement Cycles
- 13.4.3 Technical and Regulatory Considerations
- 13.4.4 Purchasing and Procurement Models
- 13.4.5 Leading Vendors and Distribution Channels
- 13.4.6 Forecast and Commercial Opportunities
- 13.5 Emerging Applications and Cross-Segment Demand
- 13.6 End-Use Industry Investment Priorities
Chapter 14 Global Jet Card Program Geographic Market Outlook, 2025-2035
- 14.1 Regional Market Size and Share, 2025
- 14.2 Regional Market Forecast, 2025-2035
- 14.3 Regional Pricing, Production and Demand Differences
- 14.4 North America
- 14.4.1 United States
- 14.4.2 Canada
- 14.4.3 Mexico
- 14.5 Europe
- 14.5.1 Germany
- 14.5.2 France
- 14.5.3 Italy
- 14.5.4 United Kingdom
- 14.5.5 Spain
- 14.5.6 Poland
- 14.5.7 Russia
- 14.5.8 Netherlands
- 14.5.9 Belgium
- 14.5.10 Sweden
- 14.5.11 Denmark
- 14.5.12 Norway
- 14.5.13 Rest of Europe
- 14.6 Asia Pacific
- 14.6.1 China
- 14.6.2 India
- 14.6.3 Japan
- 14.6.4 South Korea
- 14.6.5 Thailand
- 14.6.6 Indonesia
- 14.6.7 Vietnam
- 14.6.8 Malaysia
- 14.6.9 Australia
- 14.6.10 Rest of Asia Pacific
- 14.7 Latin America
- 14.7.1 Brazil
- 14.7.2 Argentina
- 14.7.3 Colombia
- 14.7.4 Chile
- 14.7.5 Rest of Latin America
- 14.8 Middle East
- 14.8.1 Saudi Arabia
- 14.8.2 United Arab Emirates
- 14.8.3 Turkey
- 14.8.4 Israel
- 14.8.5 Iran
- 14.8.6 Rest of the Middle East
- 14.9 Africa
- 14.9.1 South Africa
- 14.9.2 Egypt
- 14.9.3 Nigeria
- 14.9.4 Morocco
- 14.9.5 Rest of Africa
- 14.10 Regional Investment, Policy and Supply Chain Differences
- 14.11 Regional Competitive Landscape
- 14.12 Geographic Growth Hotspots
Chapter 15 Global Jet Card Program Technology, Innovation and Sustainability Outlook
- 15.1 Technology Landscape and Maturity
- 15.2 Product, Process and Service Innovation
- 15.3 AI, Automation and Digital Tools in the Industry
- 15.4 Technology Adoption and Performance Benchmarking
- 15.5 Innovation Pipeline and R&D Investment
- 15.6 Energy Efficiency and Resource Management
- 15.7 Sustainability, Recycling and Circularity
- 15.8 Technology Roadmap, 2025-2035
- 15.9 Risks of Obsolescence and Technology Substitution
Chapter 16 Global Jet Card Program Market Key Strategic Imperatives
- 16.1 Growth and Market Entry Priorities
- 16.2 High-Return Products and Segments
- 16.3 Pricing, Profitability and Cost Optimization
- 16.4 Technology Investment and Product Differentiation
- 16.5 Supply Chain Localization and Resilience
- 16.6 Distribution and Customer Acquisition
- 16.7 Partnership, Acquisition and Capacity Strategy
- 16.8 Regional Expansion Priorities
- 16.9 Short-, Medium- and Long-Term Actions
Chapter 17 Competition Outlook
- 17.1 Industry Competition Characteristics
- 17.2 Market Structure and Concentration
- 17.3 Market Share and Competitive Positioning, 2025
- 17.4 Company-Wise Revenue and Product Benchmarking
- 17.5 Production and Service Capacity Benchmarking
- 17.6 Technology, Pricing and Differentiation
- 17.7 Regional Footprint and Distribution Strength
- 17.8 Mergers, Acquisitions and Strategic Alliances
- 17.9 New Entrants and Competitive Threats
- 17.10 Porter's Five Forces and Industry Attractiveness
- 17.11 Competitive Outlook, 2025-2035
Chapter 18 Company Profiles
- 18.1 Company Coverage and Selection Criteria
- 18.2 NetJets
- 18.2.1 Business Description
- 18.2.2 Company Ownership and Geographic Presence
- 18.2.3 Product and Service Portfolio
- 18.2.4 Manufacturing and Operating Footprint
- 18.2.5 Financial Performance and Investment
- 18.2.6 Market Share and Competitive Position
- 18.2.7 Technology and Innovation Capabilities
- 18.2.8 Strategic Alliances or Partnerships
- 18.2.9 Recent Developments
- 18.2.10 Growth Strategy and Outlook
- 18.3 Flexjet
- 18.4 Wheels Up
- 18.5 Sentient Jet (Directional Aviation)
- 18.6 VistaJet
- 18.7 Other Relevant Market Participants
Note: Every listed company is profiled on the structure shown under the first company. The company list is preliminary and may change based on research findings, market developments, data availability and client requirements.
Chapter 19 Disclaimer
- 19.1 Research and Forecast Disclaimer
- 19.2 Data Source and Estimation Limitations
Note: The depth of individual sections depends on data availability for this market. Volume, capacity, trade and other unit-based metrics are included where applicable.

