
Port tours turn record cruise traffic into onshore spend
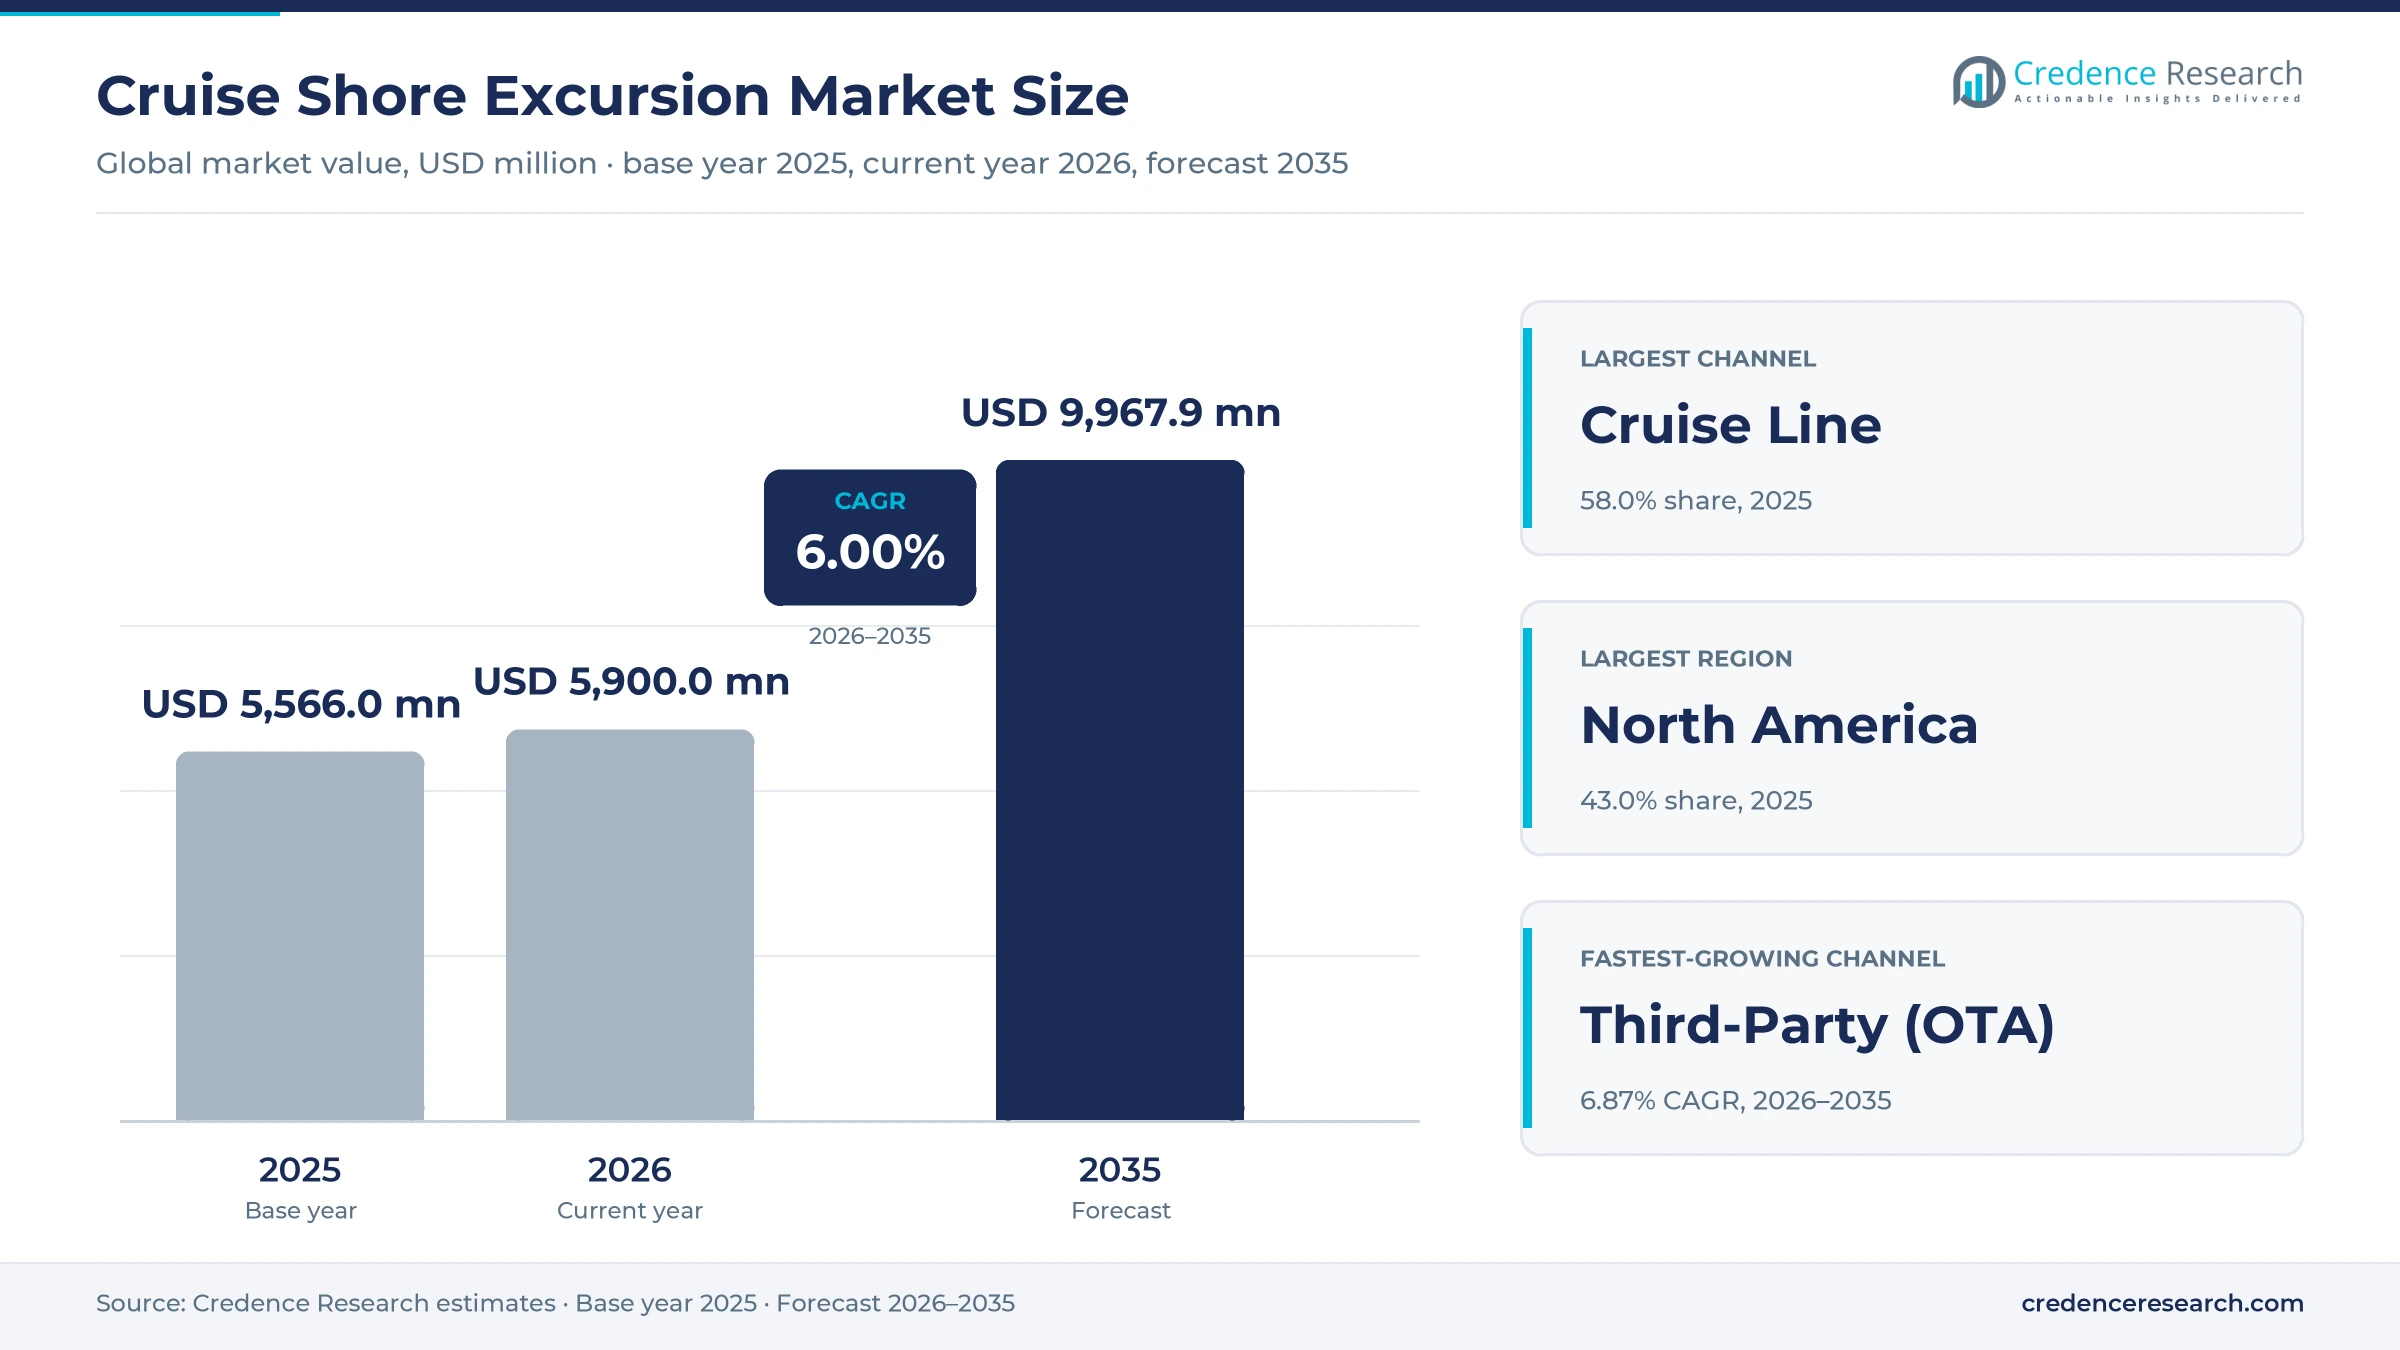
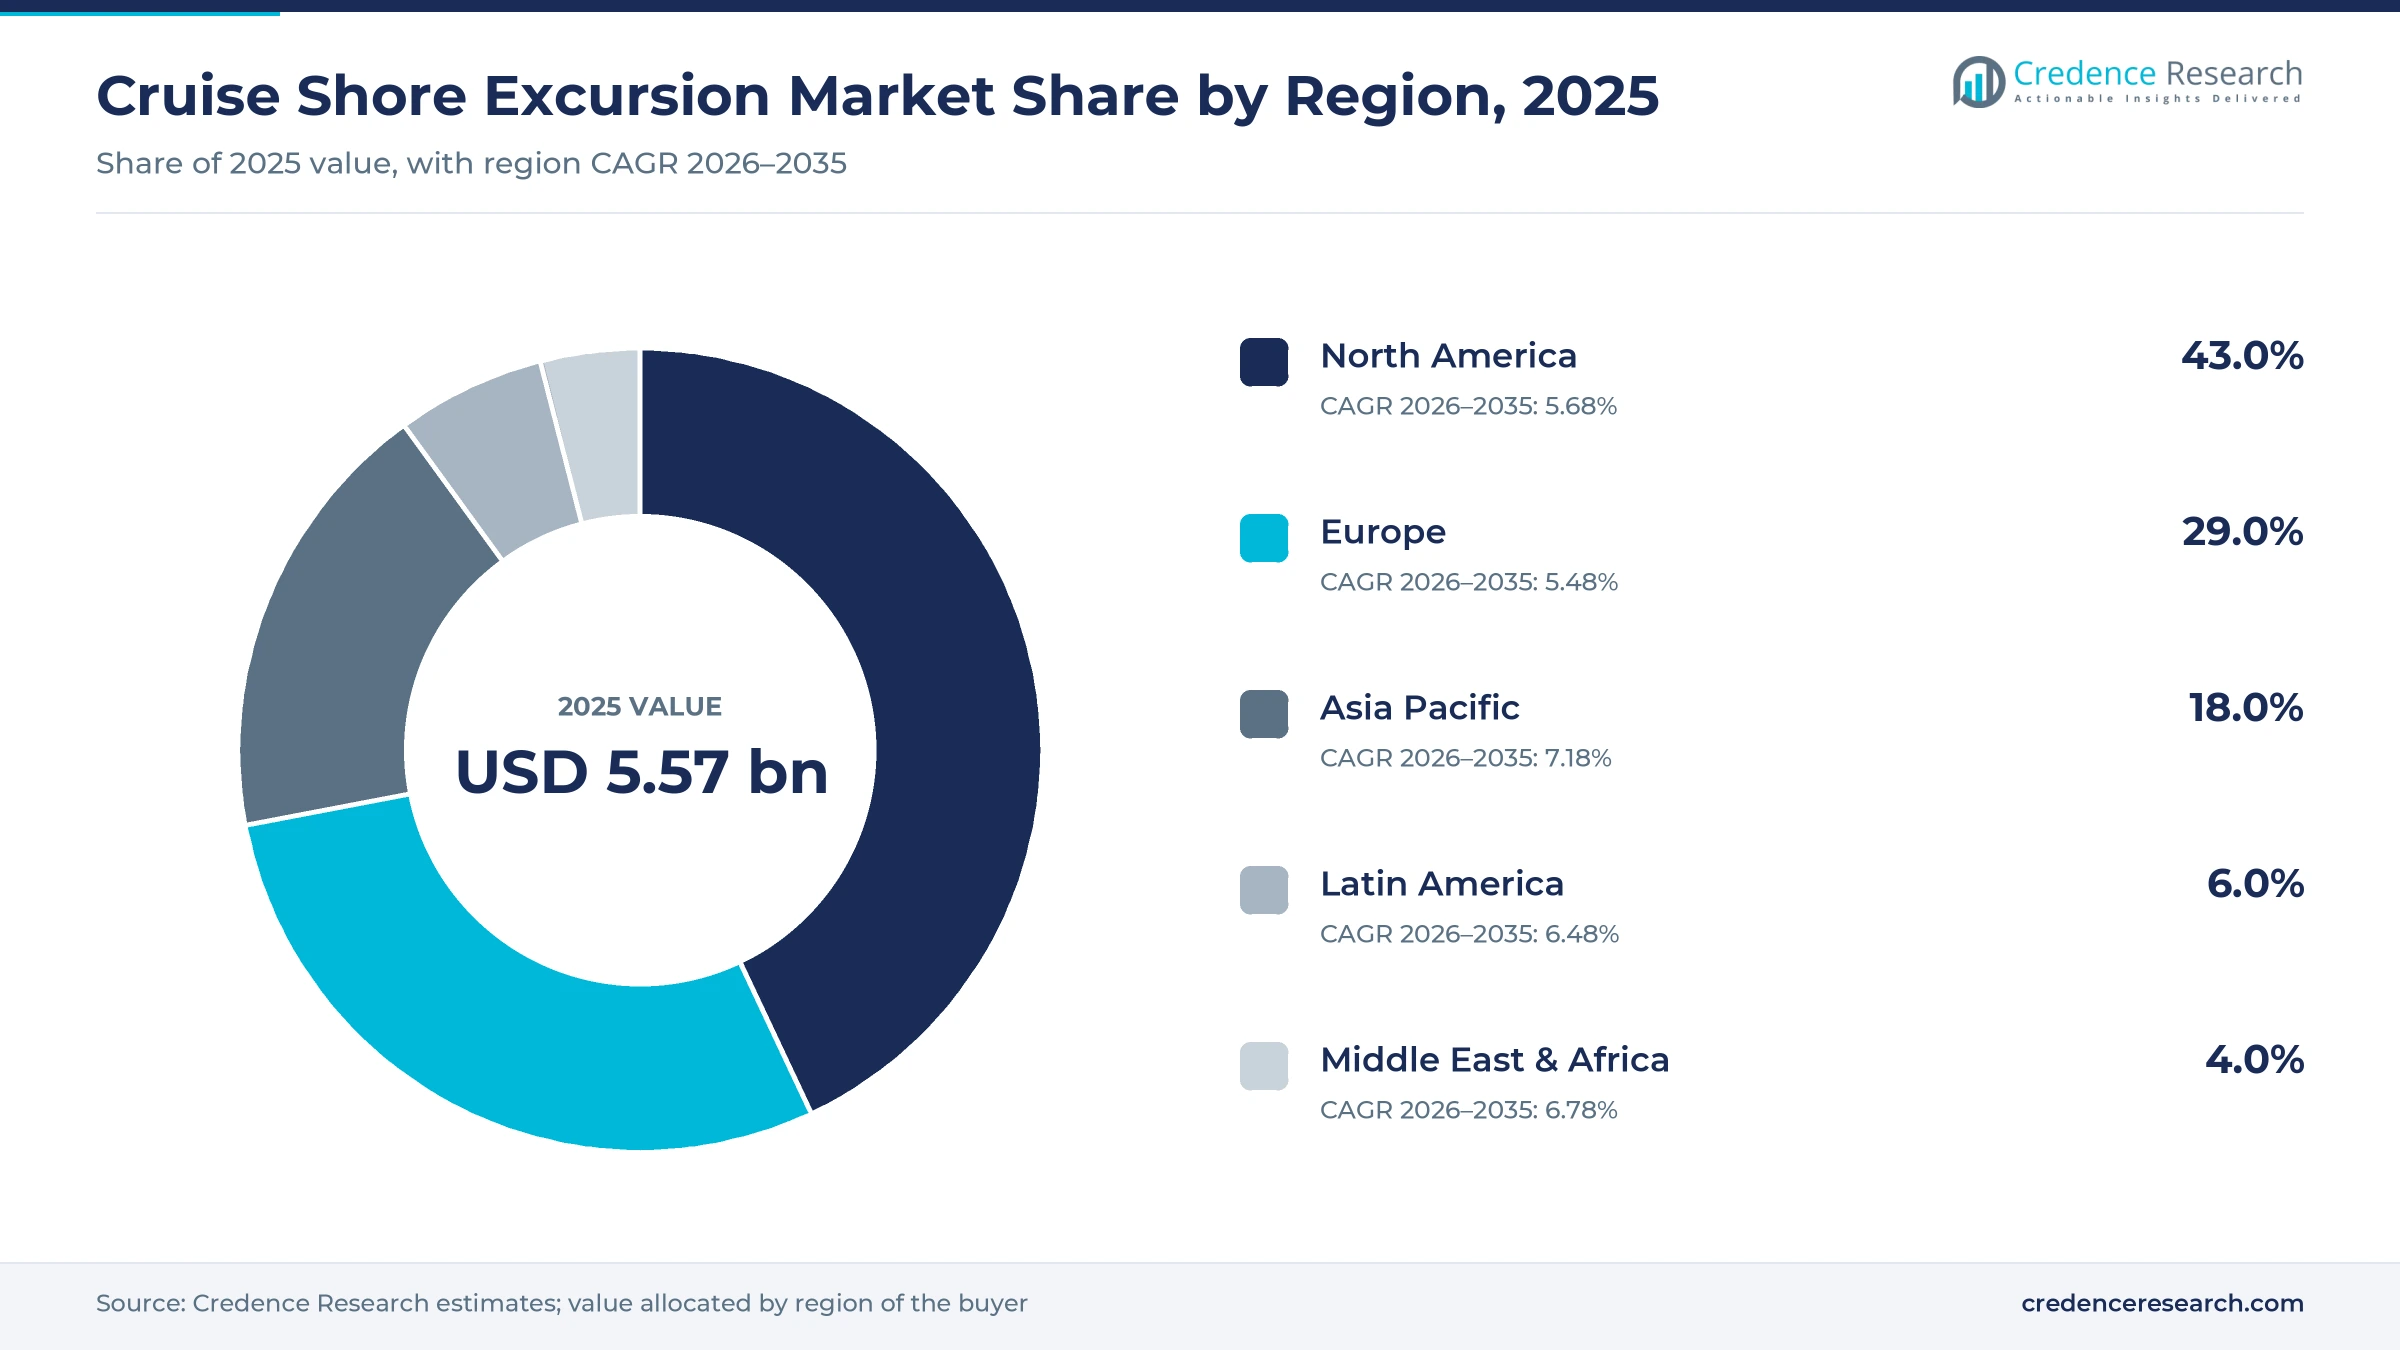
The global cruise shore excursion market was valued at USD 5.57 billion in 2025 and is projected to increase from USD 5.90 billion in 2026 to USD 9.97 billion by 2035, registering a CAGR of 6.00% during 2026–2035. Demand comes from cruise passengers who buy guided sightseeing, active outings and food or culture tours at each port call, booked through the cruise line, an online platform or a local operator on the pier. North America held the largest regional share, 43.0% in 2025, because U.S. and Canadian travelers make up most ocean cruisers. Asia Pacific is the fastest-growing region at 7.18% a year, as Hong Kong, Busan and Penang add calls and new homeported ships. On the commercial side, cruise lines now sell more tours before sailing through their apps, while lines invest in private islands and beach clubs that keep paid activities inside their own destinations.
What do cruise passengers pay for when they go ashore?
The market covers the money cruise passengers spend on organized activities during port calls, including guided sightseeing tours, adventure outings such as glacier flights, snorkeling and zip lines, and food, wine and culture experiences. Passengers book them from the cruise line before or during the voyage, from online travel platforms and specialist resellers, or directly from local operators at the port.
The scope excludes cruise fares, onboard spending, port fees and taxes, and general shopping or dining ashore that is not part of a sold activity. Paid activities inside line-owned private islands and beach clubs are included. The value chain runs from local tour and transport operators, through cruise line shore programs and online resellers, to passengers.
Cruise Shore Excursion Market Insights
- The market grows from USD 5.57 billion in 2025 to USD 9.97 billion by 2035 at a 6.00% CAGR, as record passenger numbers raise tour sales at each port call.
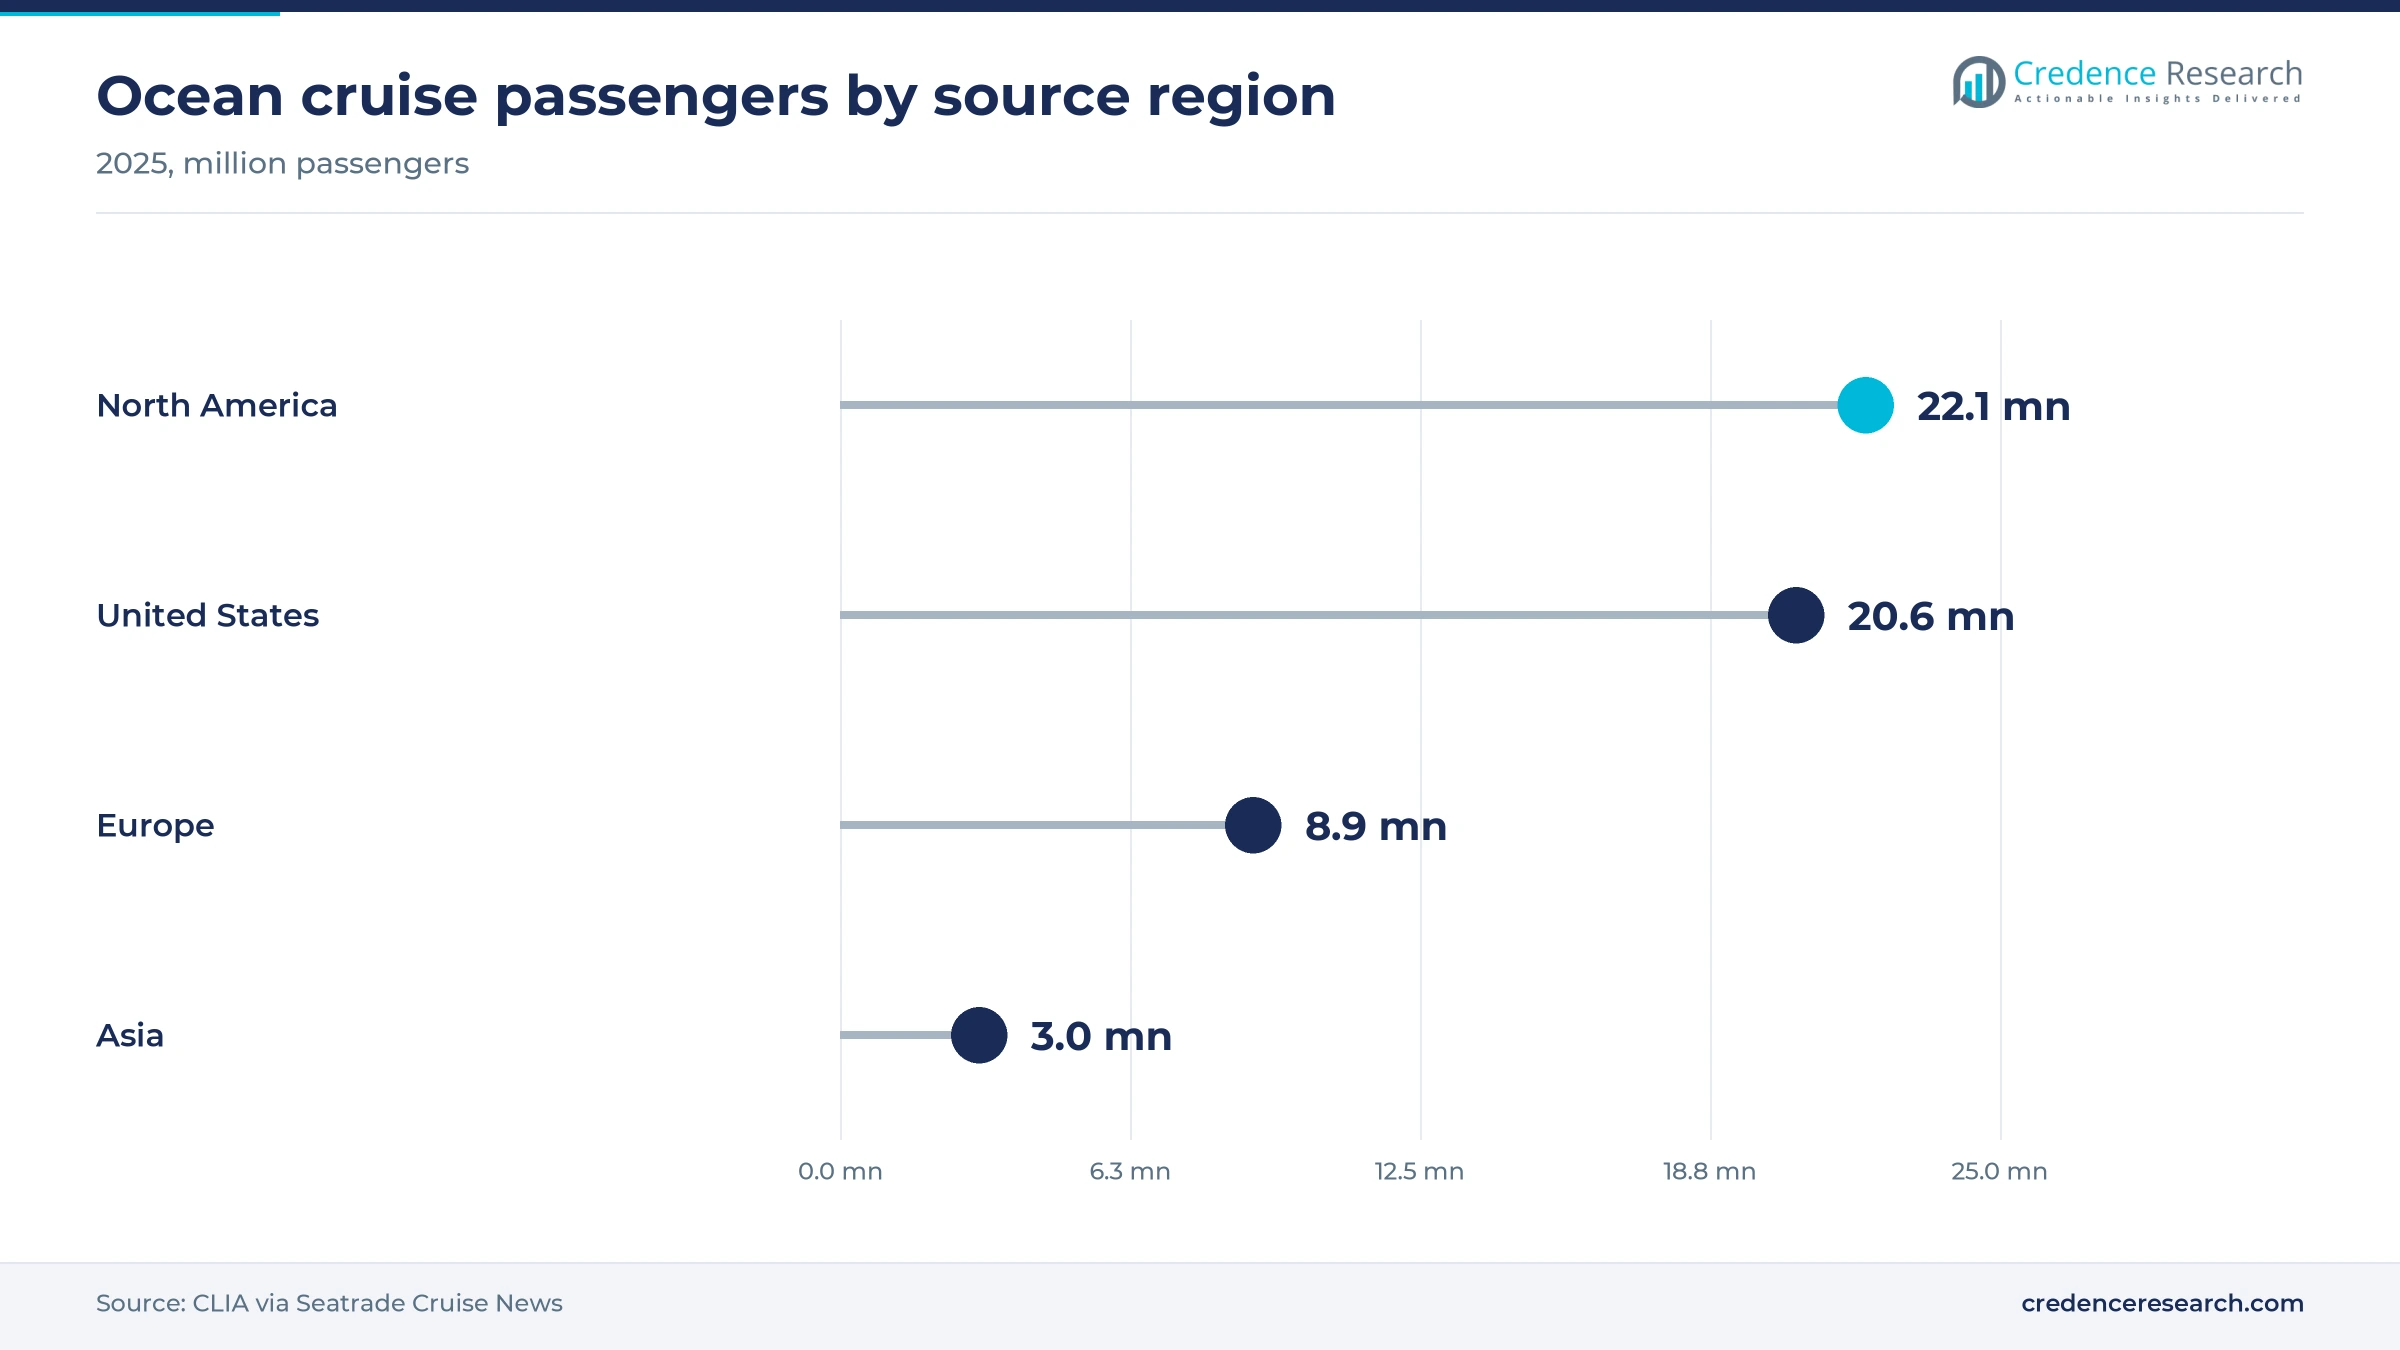
- North America held 43.0% of 2025 value, as North America supplied about 22.1 million of the 37.2 million ocean cruisers in 2025.
- Cruise Line sales led with 58.0% of 2025 value, because lines control timing, pier access and the return-to-ship promise.
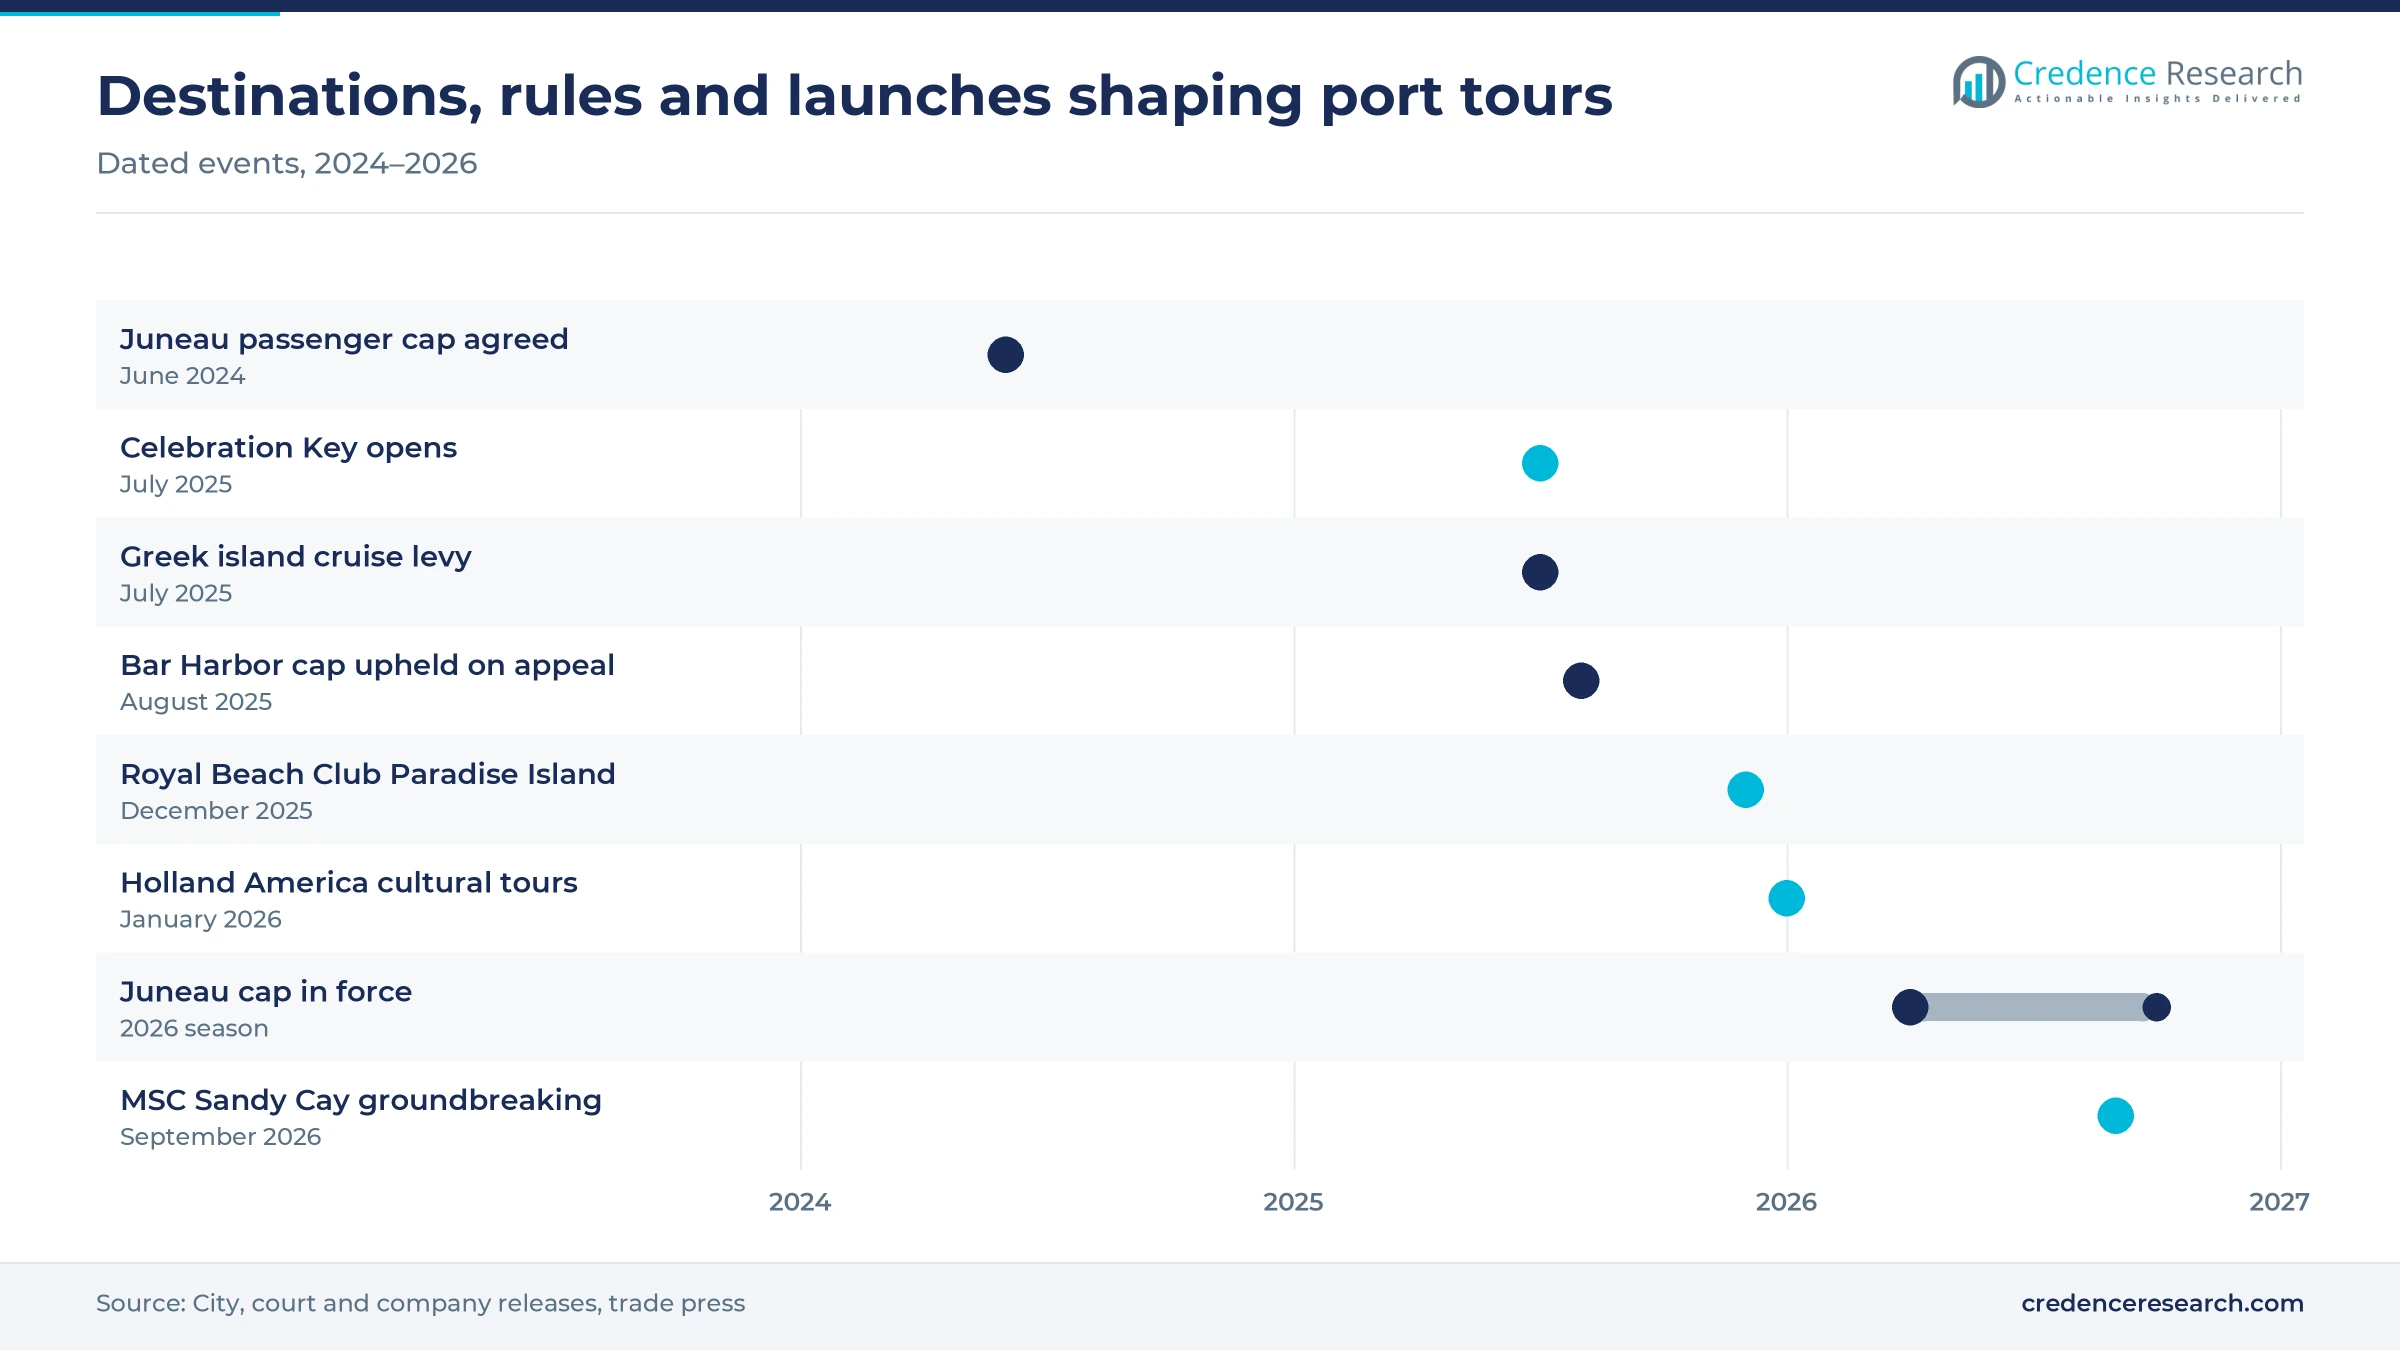
- Royal Caribbean opened Royal Beach Club Paradise Island on Dec. 23, 2025, adding another line-owned destination with paid day experiences.
- Juneau began a cap of 16,000 cruise passengers a day, 12,000 on Saturdays, in 2026, which limits tour volumes at its busiest port.
Cruise lines lead sales while OTA bookings grow fastest
Why do cruise lines still sell most port tours?
Based on booking channel, the market is categorized into cruise line, third-party (OTA) and independent bookings. Cruise Line sales led with 58.0% of 2025 value because lines guarantee the ship waits for their tours, and Royal Caribbean said in October 2025 that a record share of onboard revenue is now booked before sailing, according to Cruise Industry News. Third-Party (OTA) bookings grow fastest at 6.87% a year, as GetYourGuide booked a record 10 million experiences in the third quarter of 2025, according to Skift. Independent bookings with pier operators keep a steady place at short Caribbean calls.
Which kinds of port tours draw the most spending?
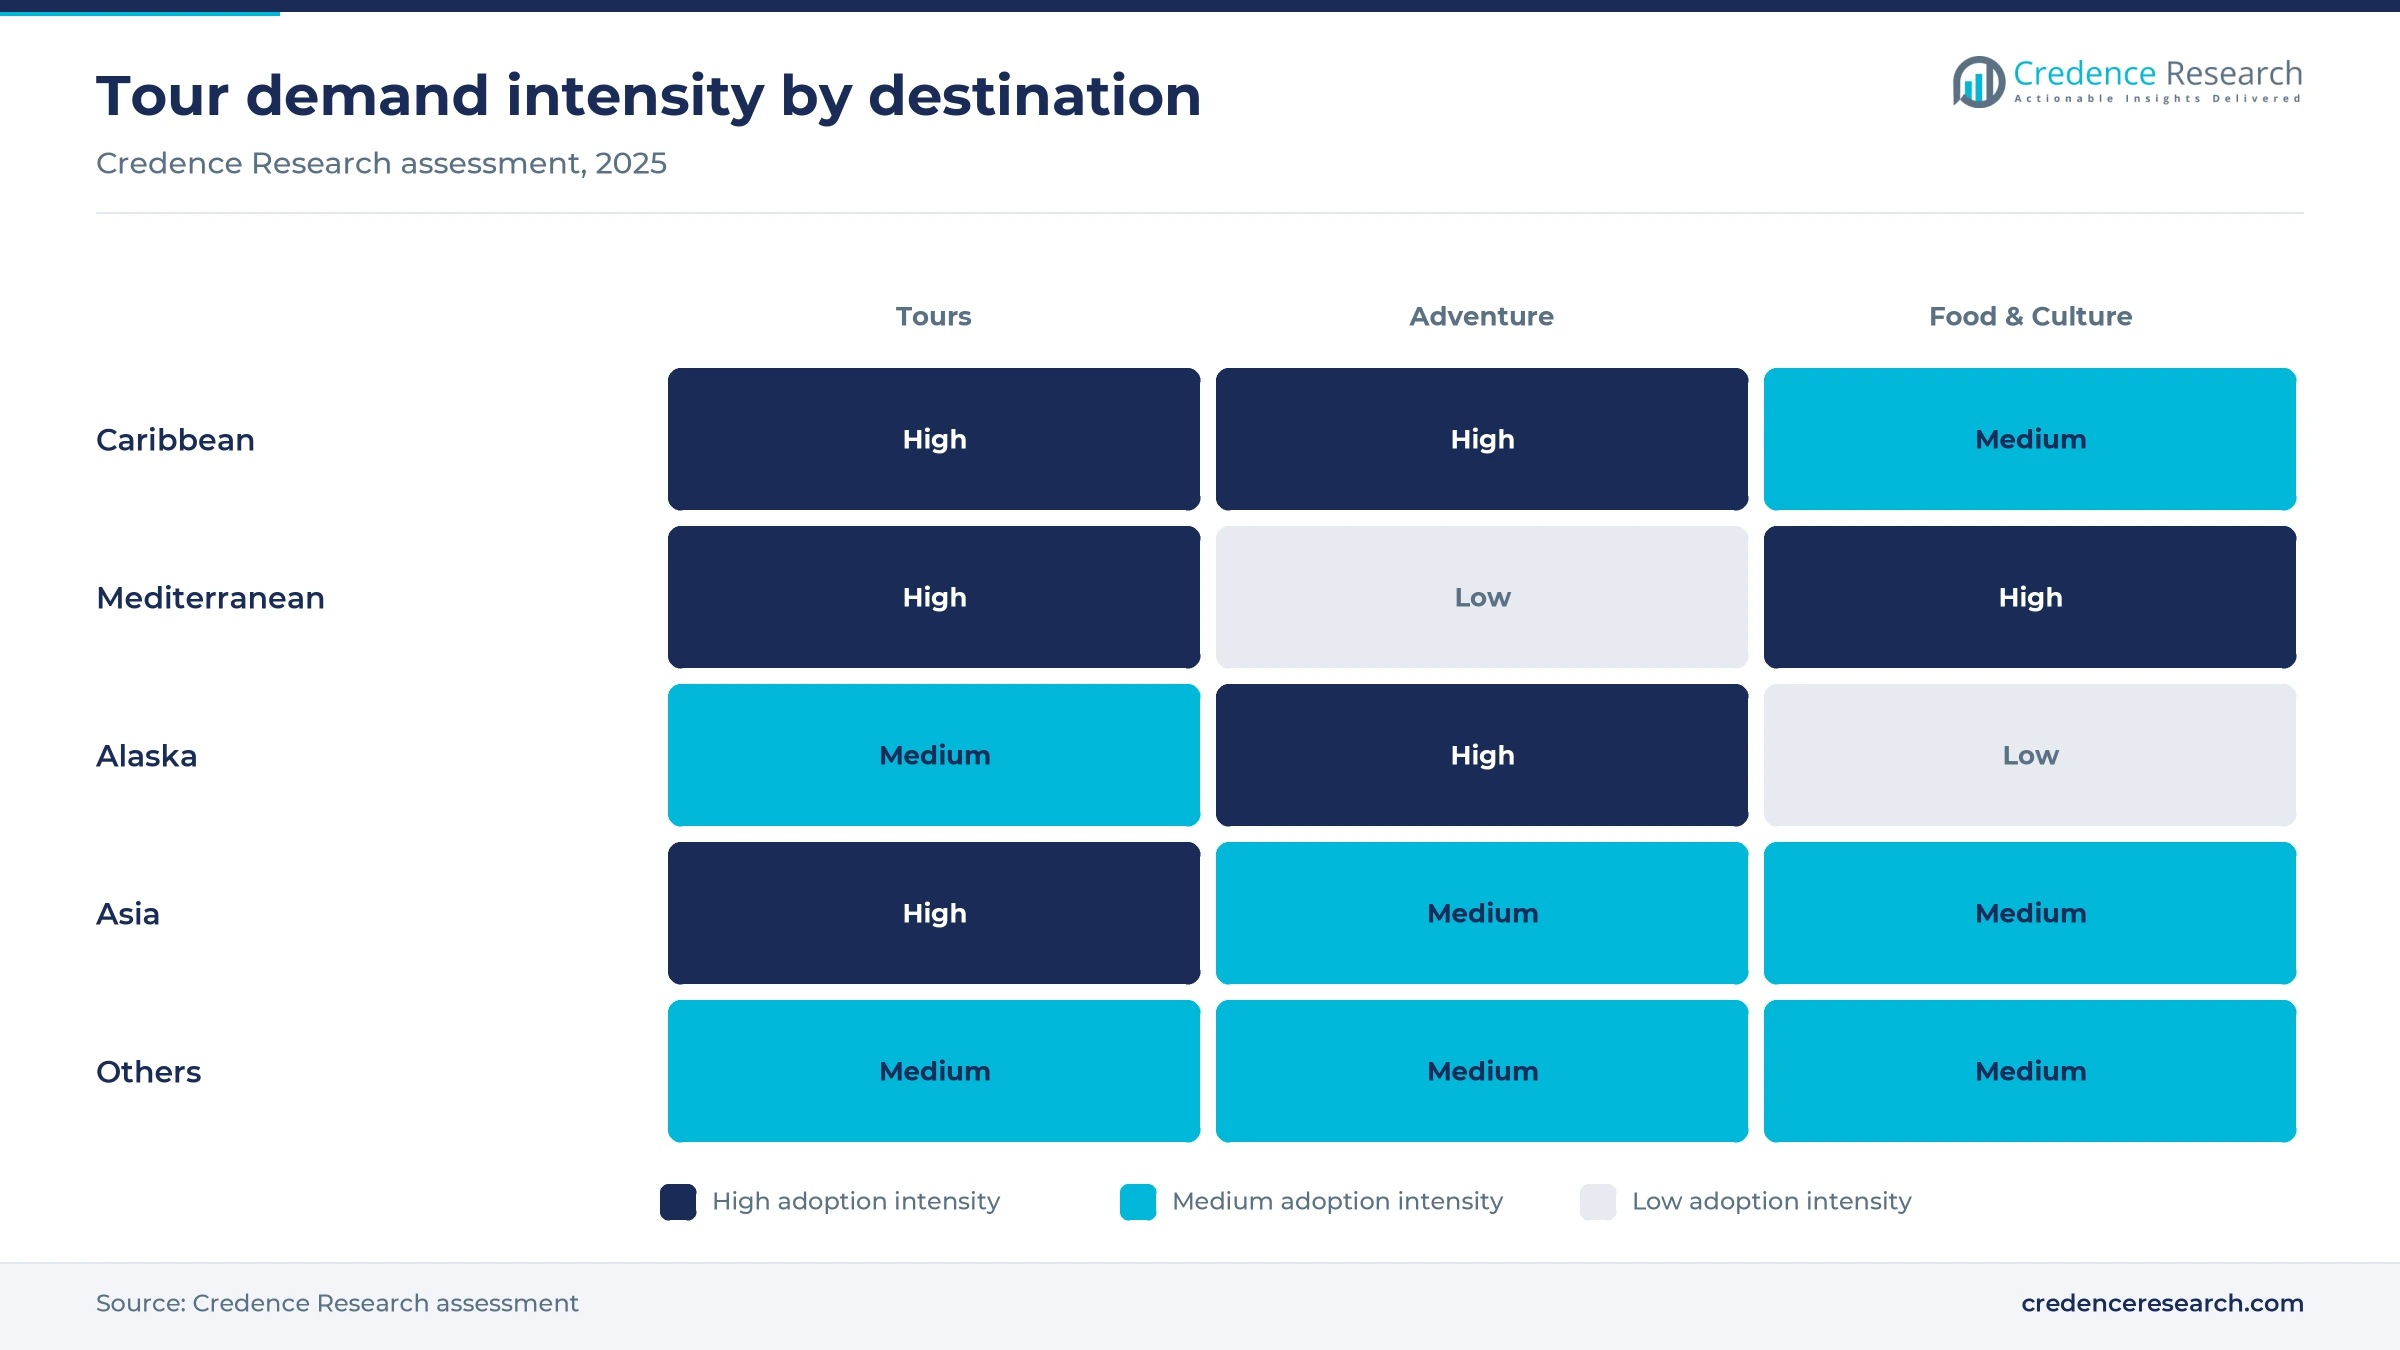
Based on excursion type, the market is categorized into tours, adventure and food and culture experiences. Tours led with 52.0% of 2025 value because city and landmark visits suit short calls, and Shore Excursions Group named Rome, Athens and Barcelona as its top European sellers in November 2024. Adventure outings such as Juneau helicopter icefield flights link the market to adventure tourism spending. Food & Culture experiences grow fastest at 6.96% a year, as Holland America Line added more than 150 cultural tours in January 2026, including farm visits and home-cooked meals.
How do Caribbean, Mediterranean, Alaska and Asia compare?
Based on destination, the market is categorized into the Caribbean, the Mediterranean, Alaska, Asia and others. The Caribbean led with 42.0% of 2025 value because it carries the most passengers, and Seatrade Cruise News reported 16.27 million Caribbean, Bahamas and Bermuda cruisers in 2025, up 8.4%. The Florida-Caribbean Cruise Association counted $4.27 billion of direct cruise tourism spending in 2023-2024, of which passengers spent about $3.07 billion, an average of $104.36 per onshore visit. Asia grows fastest at 7.54% a year, as Hong Kong handled about 630,000 cruise passengers in 2025, up 26%, according to Travel Weekly Asia.
| Segment Group | Leading Sub-segment | Share, 2025 | Fastest-growing Sub-segment | CAGR, 2026–2035 |
|---|---|---|---|---|
| By Booking Channel | Cruise Line | 58.0% | Third-Party (OTA) | 6.87% |
| By Excursion Type | Tours | 52.0% | Food & Culture | 6.96% |
| By Destination | Caribbean | 42.0% | Asia | 7.54% |
Request a Free Sample
Fill in your details and we'll send you a free sample report.
- Sample data tables & charts
- Research methodology
More passengers, app bookings and private tours lift demand
Record cruise passenger growth lifts port tour bookings
Every new cruise passenger adds several port calls, and each call is a chance to sell a paid tour ashore. Cruise Lines International Association said in April 2026 that global passenger volume reached a record 37.2 million in 2025, and nearly 90% of cruisers said they intend to sail again. Seatrade Cruise News reported that this total was 7.5% above the 34.6 million carried in 2024, with North America supplying 22.1 million passengers. CLIA members ran 325 ocean ships with about 690,000 lower berths in 2026, according to the same release. In the Credence Research model this adds about 2.22 percentage points to annual growth to 2035.
Online prebooking improves passenger tour conversion
Passengers who plan tours before boarding buy more of them, because popular slots sell out and planning removes doubt about timing. Royal Caribbean said in October 2025 that a record share of onboard revenue was booked before the cruise, with 90% of it coming through digital channels, according to Cruise Industry News. Viator now offers a search that matches tours to a chosen ship's arrival and departure times at each port, according to Travel Codex in January 2026. These tools sit alongside wider tours and activities reservations platforms, and GetYourGuide booked a record 10 million experiences in the third quarter of 2025. In the Credence Research model this adds about 1.80 percentage points to annual growth to 2035.
Premium private tours and partnerships raise tour yields
Smaller groups, private guides and line-owned destinations lift the average amount each passenger spends ashore. Shore Excursions Group, founded in 2008, keeps its average group size at 12 guests and added more than 1,000 tours in December 2024, taking its range above 4,000 tours in more than 300 ports. Carnival opened Celebration Key on Grand Bahama in July 2025, and its expanded pier now takes more than 13,000 passengers a day, according to Caribbean Journal in June 2026. Royal Caribbean plans Perfect Day Mexico on more than 200 acres at Costa Maya for fall 2027. In the Credence Research model this adds about 1.08 percentage points to annual growth to 2035.
New Alaska ships and gateway ports widen tour demand
Alaska sells some of the highest-priced tours in cruising, from glacier flights to dog sledding, so added capacity there lifts spending quickly. The Port of Seattle expected about 2.1 million cruise passengers in 2026, up from 1.9 million in 2025, while Vancouver expected about 1.4 million, according to The Maritime Executive in May 2026. MSC Cruises, Virgin Voyages and The Ritz-Carlton Yacht Collection planned Alaska sailings for 2026, with Explora Journeys following in 2027. Juneau handled about 1.7 million cruise passengers in the 2024-2025 season, almost 4% more than the year before, according to Alaska Public Media. As a result, Alaska tours keep North American demand growing at 5.68% a year.
Private islands and port caps reshape where tours run
Private islands shift tour spending to line-owned sites
Cruise lines are shifting more of the day ashore to destinations they own, where they sell cabanas, water parks and beach club passes directly. Royal Caribbean said Royal Beach Club Paradise Island would welcome its first guests on Dec. 23, 2025, with all-inclusive experiences and day pass options. Norwegian Cruise Line planned a two-ship pier at Great Stirrup Cay for late 2025 and a Great Tides Waterpark with 19 slides for summer 2026, according to Cruise Industry News. MSC broke ground on Sandy Cay, a luxury island for MSC Cruises and Explora Journeys guests, on Sept. 28, 2026, with opening set for 2028. Celebration Key expected about 3.5 million visitors in its second year.
Port caps push tour volumes toward smaller ports
Daily passenger limits at the busiest ports are shifting tour sales toward smaller or less crowded calls. Juneau capped arrivals at 16,000 passengers a day, 12,000 on Saturdays, from 2026, and limits calls to five ships a day under a voluntary agreement. The Alaska Travel Industry Association said in March 2026 that the caps push lines toward other ports, and Klawock saw about 17,000 cruise passengers in 2025, a jump of more than 400%, according to Alaska Public Media. In Maine, Bar Harbor limits disembarkations to 1,000 passengers a day, a rule the 1st U.S. Circuit Court of Appeals upheld in August 2025.
Food and culture tours open a premium niche for lines
Passengers who return to the same ports want deeper experiences, which opens room for food, craft and home-visit tours priced above a standard coach tour. Holland America Line introduced more than 150 cultural tours in January 2026 under its Meet the Makers and Community Connections programs. Its examples include a Magna Grecia farm visit in Katákolon, Greece and a Tassie Tasting Trail in Tasmania with chocolate, cheese and cider stops. These tours draw on wider culinary tourism demand, and Shore Excursions Group said its new tours in December 2024 aimed at more immersive and personalized experiences. As a result, Food & Culture experiences grow at 6.96% a year.
Asian homeports and new calls open fresh tour networks
Asia offers new port networks where tour supply is still thin, which favors operators that can build products early. Hong Kong handled about 630,000 cruise passengers in 2025, up 26%, and Busan recorded 238 cruise calls, according to Travel Weekly Asia. Penang received about 700,000 cruise arrivals in 2025 and targets 1 million in 2026. Taiwan saw an estimated 1.135 million cruise passengers from 567 port calls, 8% above 2019. Seatrade Cruise News reported that Asian source passengers rose 15% to about 3 million in 2025. These gains make Asia the fastest-growing destination for port tours, at 7.54% a year.
Port caps, cruise taxes and crowded sites limit volumes
Daily passenger caps limit tour volumes at busy ports
Daily caps put a ceiling on how many tours a busy port can sell on peak days. Juneau agreed with the cruise industry in June 2024 to limit arrivals to 16,000 passengers a day from 2026, according to the Juneau Empire, down from days with more than 20,000. Bar Harbor's 1,000-passenger limit remains enforceable in July and August after a federal ruling on May 15, 2026. Operators in these ports must spread tours across weekdays and shoulder months to protect sales.
Rising cruise taxes add cost to short port calls
New port taxes raise the cost of a day ashore and can push lines to shorten or drop calls. Barcelona plans to charge passengers staying under 12 hours €24 instead of €5, rising to €30 by 2030, according to The Olive Press in September 2026. Greece began charging €20 per passenger at Santorini and Mykonos in peak months on July 21, 2025. Dubrovnik's port authority caps simultaneous cruise visitors at 4,000 under its 2026 berthing rules, which limits Mediterranean tour slots.
Crowded natural sites cap adventure tour permits
Popular natural sites have fixed visitor limits, which cap adventure and sightseeing tours late in the season. The U.S. Forest Service set a commercial visitor limit of 517,650 a year at Mendenhall Glacier in 2015 and raised it by 55,000 in 2019, and tour operators now reach the cap in late summer, according to the Alaska Beacon. In May 2026, a federal court barred the agency from raising the cap until it fixed a legal flaw in its $25 million expansion plan, according to Alaska Public Media.
Line-owned islands divert spending from local operators
Private destinations keep passengers inside line-owned sites, which reduces sales for independent tour operators in nearby ports. Carnival's expanded Celebration Key pier was expected to add about 200 ship calls and 700,000 passenger visits a year, according to Caribbean Journal in June 2026. Royal Caribbean plans six destinations by 2027, including beach clubs in Nassau and Cozumel. Local operators respond by partnering with lines or selling longer tours at mainland ports.
North America leads buyers as Asia Pacific grows fastest
| Region | Value, 2025 (USD billion) | Share, 2025 | CAGR, 2026–2035 |
|---|---|---|---|
| North America | 2.39 | 43.0% | 5.68% |
| Europe | 1.61 | 29.0% | 5.48% |
| Asia Pacific | 1.00 | 18.0% | 7.18% |
| Latin America | 0.33 | 6.0% | 6.48% |
| Middle East & Africa | 0.22 | 4.0% | 6.78% |
North America leads on U.S. cruisers and Alaska tours
North America held 43.0% of 2025 value and grows at 5.68% a year, the largest regional pool of tour buyers. U.S. travelers made up about 20.6 million of the 22.1 million North American cruisers in 2025, according to Seatrade Cruise News. These passengers fill Caribbean, Bahamas and Alaska itineraries, where Shore Excursions Group lists Juneau, Skagway and Ketchikan among its top sellers. Smaller expedition ships also add higher-priced wildlife tours in Alaska. The U.S. Forest Service staffed Mendenhall Glacier from the first Juneau cruise call on April 14, 2025 to support outfitters, guides and tour buses.
Europe grows slowly as Mediterranean ports add charges
Europe held 29.0% of 2025 value and grows at 5.48% a year, the slowest pace among regions. European source passengers rose 5.3% to 8.9 million in 2025, while Mediterranean cruisers rose 3.4% to 3.22 million, according to Seatrade Cruise News. Barcelona handled about four million cruise passenger movements in 2025, Europe's busiest hub, according to The Olive Press. Its planned €24 charge and the Greek island levy raise the cost of short calls.
Asia Pacific grows fastest on new ports and homeports
Asia Pacific held 18.0% of 2025 value and grows at 7.18% a year, the fastest pace of any region. Asian source passengers rose 15% to about 3 million in 2025, according to Seatrade Cruise News. Disney Adventure began sailing from Singapore on March 10, 2026, under a five-year homeport deal, according to TTG Asia. Japan aims for 1 million cruise passengers by 2030, against 224,000 in 2024, according to Travel Weekly Asia, which points to new port tour demand.
Latin America gains from Mexican and central American calls
Latin America held 6.0% of 2025 value and grows at 6.48% a year. The region hosts many of the busiest tour ports, and Shore Excursions Group lists Cozumel and Roatán among its top-selling destinations. Royal Caribbean plans a beach club in Cozumel and Perfect Day Mexico at Costa Maya for fall 2027. The Florida-Caribbean Cruise Association study covered 33 Caribbean and Latin American destinations in 2023-2024.
Middle East & Africa builds a winter tour season
Middle East & Africa held 4.0% of 2025 value and grows at 6.78% a year. More than 150 cruise ships visit the UAE each winter, and Dubai Harbour Cruise Terminal handled about 300,000 passengers in a season, according to The National in July 2025. Red Sea attacks have kept most lines from using the Suez Canal, which raises repositioning costs, although MSC and Costa kept winter Gulf programs.
Private destinations and port rules shaped 2025–2026
| Development | Status and market relevance |
|---|---|
| In July 2025, Carnival opened Celebration Key on Grand Bahama, its first private destination built on the island. | Open, pier later expanded to take four ships at once |
| In July 2025, Greece began charging €20 per cruise passenger at Santorini and Mykonos during peak months. | In force, raises the cost of island calls |
| In December 2025, Royal Caribbean opened Royal Beach Club Paradise Island in Nassau, its first beach club. | Open, sells all-inclusive and day pass experiences |
| In January 2026, Holland America Line introduced more than 150 cultural tours across its global itineraries. | Live, expands food and culture experiences |
| In September 2026, MSC broke ground on Sandy Cay, a luxury private island next to Ocean Cay in The Bahamas. | Under construction, opening planned for 2028 |
Ship-timed search, cruise apps and timed-entry tools
- Ship-timed tour search from Viator lets passengers pick a cruise line and ship and see only tours that fit each port's arrival and departure times.
- Cruise line apps carry a record share of prebooked onboard spending, and Royal Caribbean said 90% of it comes through digital channels.
- Return-to-ship guarantees such as the $1,000 per guest policy of Shore Excursions Group reduce the risk of booking outside the cruise line.
- Berth scheduling systems such as Dubrovnik's two-phase submission process cap simultaneous visitors and set when tours can run.
Need a Custom Version of This Report?
Tailor the scope, geography, or segments to your exact requirements.
- Custom geography or segment scope
- Direct access to our analyst team
Lines own the pier while platforms win on choice and price
Competition splits between cruise lines that run their own shore programs, online platforms that resell local tours and specialist resellers built for cruise timing. Royal Caribbean Group, Carnival Corporation, MSC Cruises and Norwegian Cruise Line Holdings sell tours through their apps and own private islands such as Perfect Day at CocoCay, Celebration Key, Ocean Cay and Great Stirrup Cay, where they capture paid activity directly. Viator, part of Tripadvisor and GetYourGuide list thousands of port tours and add tools that match tours to ship times. Shore Excursions Group, with more than 4,000 tours in over 300 ports, competes with a $1,000 return-to-ship policy and commissions for travel advisors. Holland America Line competes on cultural depth through its Meet the Makers tours. Sellers win on pier access, timing guarantees, guide quality and price rather than on catalog size alone.
Companies profiled and their roles in this market
| Company | Type | Role in the market |
|---|---|---|
| Royal Caribbean Group | Cruise line | App prebooking, CocoCay and Royal Beach Clubs |
| Carnival Corporation | Cruise line | Celebration Key on Grand Bahama since July 2025 |
| MSC Cruises | Cruise line | Ocean Cay and Sandy Cay, opening 2028 |
| Viator (Tripadvisor) | Online platform | Ship-timed port tour search |
| GetYourGuide | Online platform | Record 10 million experiences in Q3 2025 |
| Shore Excursions Group | Specialist reseller | More than 4,000 tours in over 300 ports |
| Norwegian Cruise Line Holdings | Cruise line | Great Stirrup Cay pier and water park |
Port access will matter more than tour catalogs
Credence Research's view is that access to ports and sites will decide growth more than the size of tour catalogs. Passenger numbers keep rising, but caps in Juneau, Bar Harbor and Dubrovnik and permit limits at Mendenhall Glacier fix how many tours the busiest calls can run. Cruise lines are answering with private islands, which keep spending in their own hands, while online platforms win on choice at large ports. Operators that build products in Asian and secondary Alaska ports, and that sell food and culture tours, will gain the most new volume.
Model built from cruise traffic and port spending data
The report uses 2025 as the base year and forecasts to 2035. Market values come from the Credence Research model, which links cruise passenger volumes, port calls, the share of passengers who buy tours and typical tour prices, and regional and segment splits are Credence Research estimates. Inputs came from Cruise Lines International Association and Florida-Caribbean Cruise Association statistics, port and city releases, court records, company announcements and trade press. No interviews or surveys were conducted by Credence Research for this edition.
Private islands and Asian ports carry growth to 2035
The market is set to grow from USD 5.90 billion in 2026 to USD 9.97 billion by 2035 at a 6.00% CAGR. Private islands in The Bahamas and Mexico will take a larger share of the day ashore, while Asian ports add new tour networks. Port caps and higher Mediterranean charges will slow growth at the busiest calls. Online platforms will keep gaining bookings as ship-timed search spreads, and cruise lines will defend their share with app prebooking and owned destinations through the forecast period.
Frequently Asked Questions
How big is the cruise shore excursion market?
Which booking channel leads the market?
Which booking channel grows fastest?
Which region holds the largest share?
Which region grows fastest?
How do private islands affect the market?
How do port caps and taxes affect tour sales?
Who are the main companies in the market?
Table of Content
Chapter 1 Market Segmentation
- 1.1 Segmentation Framework
- 1.1.1 Product and Service Classification
- 1.1.2 Application and End-Use Classification
- 1.1.3 Technology and Solution Classification
- 1.1.4 Customer and Distribution Channel Classification
- 1.1.5 Geographic Segmentation
- 1.1.6 Market Segment Definitions and Boundaries
- 1.2 By Booking Channel
- 1.2.1 Cruise Line
- 1.2.2 Third-Party (OTA)
- 1.2.3 Independent
- 1.3 By Excursion Type
- 1.3.1 Tours
- 1.3.2 Adventure
- 1.3.3 Food & Culture
- 1.4 By Destination
- 1.4.1 Caribbean
- 1.4.2 Mediterranean
- 1.4.3 Alaska
- 1.4.4 Asia
- 1.4.5 Others
Chapter 2 Introduction
- 2.1 Report Objectives and Scope
- 2.2 Product Definition and Industry Terminology
- 2.3 Market Inclusions and Exclusions
- 2.4 Research Process
- 2.4.1 Primary Research and Expert Interviews
- 2.4.2 Secondary Research and Source Review
- 2.4.3 Top-Down and Bottom-Up Estimation
- 2.4.4 Data Triangulation and Verification
- 2.5 Market Size Measurement Basis
- 2.5.1 2025: USD 5.57 billion → 2035: USD 9.97 billion
- 2.6 Historical and Forecast Reference Periods
- 2.6.1 Historical Period: 2018-2025
- 2.6.2 Base Year: 2025
- 2.6.3 Forecast Period: 2025-2035
- 2.7 Research Assumptions and Limitations
Chapter 3 Executive Summary
- 3.1 Market Snapshot and Key Findings
- 3.2 Base-Year Market Size, 2025
- 3.3 Forecast Market Size, 2035
- 3.4 Revenue and Volume Growth Outlook
- 3.5 Key Demand and Supply Indicators
- 3.6 Leading Market Segments
- 3.7 Fastest-Growing Market Opportunities
- 3.8 Regional Performance Highlights
- 3.9 Technology and Industry Transformation
- 3.10 Competitive Landscape Summary
- 3.11 Analyst View and Strategic Implications
Chapter 4 Global Cruise Shore Excursion Market Trends and Developments
- 4.1 Historical Industry Development, 2018-2025
- 4.2 Recent Market Trends and Developments
- 4.3 Demand and Customer Behavior Trends
- 4.4 Technology and Product Innovation
- 4.5 Artificial Intelligence, Automation and Digitalization
- 4.6 Local Manufacturing and Supply Chain Realignment
- 4.7 Industry Partnerships, Mergers and Acquisitions
- 4.8 Sustainability and Circular Economy Developments
- 4.9 Government and Private Sector Investment Trends
- 4.10 Emerging Business Models and Commercialization
- 4.11 Industry Developments and Announcements
Chapter 5 Global Cruise Shore Excursion Market Supply and Demand Analysis
- 5.1 Demand Trend and Consumption Analysis, 2018-2025
- 5.2 Demand Forecast, 2025-2035
- 5.3 Supply Chain Structure and Procurement Trends
- 5.4 Supply-Demand Gap and Bottlenecks
- 5.5 Import Dependence and Sourcing Structure
- 5.6 Regional Supply and Demand Concentration
Chapter 6 Global Cruise Shore Excursion Market Pricing Analysis
- 6.1 Pricing Structure and Measurement
- 6.2 Historical Pricing Trends, 2018-2025
- 6.3 Pricing Outlook, 2025-2035
- 6.4 Pricing by Product and Market Segment
- 6.5 Geographic Pricing Differences
- 6.6 Key Input, Energy, Labor and Logistics Costs
- 6.7 Contract Pricing and Purchasing Models
- 6.8 Pricing Sensitivity and Competitive Positioning
- 6.9 Price, Margin and Profitability Implications
Chapter 7 Global Cruise Shore Excursion Market Dynamics
- 7.1 Market Growth Drivers
- 7.1.1 Demand-Side Drivers
- 7.1.2 Technology and Innovation Drivers
- 7.1.3 Infrastructure and Investment Drivers
- 7.1.4 Regulatory and Policy Drivers
- 7.2 Market Restraints
- 7.2.1 Cost and Affordability Constraints
- 7.2.2 Technology and Adoption Barriers
- 7.2.3 Supply Chain and Operational Constraints
- 7.3 Market Challenges
- 7.3.1 Competitive Pressure and Margin Erosion
- 7.3.2 Skills, Infrastructure and Implementation Gaps
- 7.4 Emerging Market Opportunities
- 7.5 Market Dynamics Impact and Time-Horizon Assessment
Chapter 8 Global Cruise Shore Excursion Value Chain Analysis
- 8.1 Industry Value Chain Overview
- 8.2 Upstream Suppliers and Critical Inputs
- 8.3 Technology and Component Providers
- 8.4 Manufacturing or Service Delivery
- 8.5 Distribution, Channel Partners and Integrators
- 8.6 Downstream Applications and End Users
- 8.7 Value Addition and Profit Pools
- 8.8 Vertical Integration and Outsourcing
- 8.9 Supplier Concentration and Risk
- 8.10 Supply Chain Localization and Resilience
Chapter 9 Global Cruise Shore Excursion Market Regulations and Policies
- 9.1 Relevant Laws, Standards and Compliance Frameworks
- 9.2 Product, Service, Safety and Quality Requirements
- 9.3 Government Policies, Incentives and Subsidies
- 9.4 Imports, Exports and Trade Barriers
- 9.5 Public Procurement and Local Content Requirements
- 9.6 Data Protection, AI and Cybersecurity Compliance
- 9.7 Upcoming Policy Changes and Market Implications
Chapter 10 Global Cruise Shore Excursion Market Hotspots and Opportunities
- 10.1 Market Opportunity Mapping and Growth Hotspots
- 10.2 High-Growth Applications and Customer Groups
- 10.3 Underserved Markets and White-Space Opportunities
- 10.4 Emerging Technology and Product Opportunities
- 10.5 New Capacity and Investment Hotspots
- 10.6 Market Entry and Expansion Opportunities
- 10.7 Distribution and Partnership Opportunities
- 10.8 Near-Term and Long-Term Commercial Potential
- 10.9 Opportunity Attractiveness and Execution Risks
Chapter 11 Global Cruise Shore Excursion Market Outlook, 2025-2035
- 11.1 Market Size and Analysis
- 11.1.1 Revenue (Market Measurement: 2025: USD 5.57 billion → 2035: USD 9.97 billion)
- 11.1.2 Historical Market Size, 2018-2025
- 11.1.3 Base-Year Market Size, 2025
- 11.2 Market Forecast, 2025-2035
- 11.2.1 Revenue Forecast to 2035
- 11.2.2 CAGR and Year-on-Year Growth
- 11.2.3 Incremental Revenue Opportunity
- 11.3 Forecast Assumptions and Scenario Analysis
- 11.3.1 Base-Case Forecast
- 11.3.2 Optimistic and Conservative Scenarios
- 11.3.3 Technology, Pricing and Policy Sensitivities
- 11.4 Market Attractiveness and Growth Outlook
Chapter 12 Global Cruise Shore Excursion Market Segmentation and Outlook
- 12.1 Segmentation Summary and Market Shares, 2025
- 12.2 Largest and Fastest-Growing Segments
- 12.3 By Booking Channel - Market Size and Forecast, 2025-2035
- 12.3.1 Segment Definition and Scope
- 12.3.2 Historical Market Size, 2018-2025
- 12.3.3 Revenue Forecast, 2025-2035
- 12.3.4 Base-Year Market Share, 2025
- 12.3.5 Segment CAGR and Growth Drivers
- 12.3.6 Subsegment Market Size and Forecast
- 12.3.6.1 Cruise Line
- 12.3.6.2 Third-Party (OTA)
- 12.3.6.3 Independent
- 12.3.7 Subsegment Pricing and Adoption Trends
- 12.3.8 Leading Suppliers and Competition
- 12.3.9 Regional Demand and Opportunities
- 12.4 By Excursion Type - Market Size and Forecast, 2025-2035
- 12.4.1 Segment Definition and Scope
- 12.4.2 Historical Market Size, 2018-2025
- 12.4.3 Revenue Forecast, 2025-2035
- 12.4.4 Base-Year Market Share, 2025
- 12.4.5 Segment CAGR and Growth Drivers
- 12.4.6 Subsegment Market Size and Forecast
- 12.4.6.1 Tours
- 12.4.6.2 Adventure
- 12.4.6.3 Food & Culture
- 12.4.7 Subsegment Pricing and Adoption Trends
- 12.4.8 Leading Suppliers and Competition
- 12.4.9 Regional Demand and Opportunities
- 12.5 By Destination - Market Size and Forecast, 2025-2035
- 12.5.1 Segment Definition and Scope
- 12.5.2 Historical Market Size, 2018-2025
- 12.5.3 Revenue Forecast, 2025-2035
- 12.5.4 Base-Year Market Share, 2025
- 12.5.5 Segment CAGR and Growth Drivers
- 12.5.6 Subsegment Market Size and Forecast
- 12.5.6.1 Caribbean
- 12.5.6.2 Mediterranean
- 12.5.6.3 Alaska
- 12.5.6.4 Asia
- 12.5.6.5 Others
- 12.5.7 Subsegment Pricing and Adoption Trends
- 12.5.8 Leading Suppliers and Competition
- 12.5.9 Regional Demand and Opportunities
- 12.6 Segment Growth Comparison
- 12.7 Segment Attractiveness and Priority Matrix
Chapter 13 Global Cruise Shore Excursion Geographic Market Outlook, 2025-2035
- 13.1 Regional Market Size and Share, 2025
- 13.2 Regional Market Forecast, 2025-2035
- 13.3 Regional Pricing, Production and Demand Differences
- 13.4 North America
- 13.4.1 United States
- 13.4.2 Canada
- 13.4.3 Mexico
- 13.5 Europe
- 13.5.1 Germany
- 13.5.2 France
- 13.5.3 Italy
- 13.5.4 United Kingdom
- 13.5.5 Spain
- 13.5.6 Poland
- 13.5.7 Russia
- 13.5.8 Netherlands
- 13.5.9 Belgium
- 13.5.10 Sweden
- 13.5.11 Denmark
- 13.5.12 Norway
- 13.5.13 Rest of Europe
- 13.6 Asia Pacific
- 13.6.1 China
- 13.6.2 India
- 13.6.3 Japan
- 13.6.4 South Korea
- 13.6.5 Thailand
- 13.6.6 Indonesia
- 13.6.7 Vietnam
- 13.6.8 Malaysia
- 13.6.9 Australia
- 13.6.10 Rest of Asia Pacific
- 13.7 Latin America
- 13.7.1 Brazil
- 13.7.2 Argentina
- 13.7.3 Colombia
- 13.7.4 Chile
- 13.7.5 Rest of Latin America
- 13.8 Middle East
- 13.8.1 Saudi Arabia
- 13.8.2 United Arab Emirates
- 13.8.3 Turkey
- 13.8.4 Israel
- 13.8.5 Iran
- 13.8.6 Rest of the Middle East
- 13.9 Africa
- 13.9.1 South Africa
- 13.9.2 Egypt
- 13.9.3 Nigeria
- 13.9.4 Morocco
- 13.9.5 Rest of Africa
- 13.10 Regional Investment, Policy and Supply Chain Differences
- 13.11 Regional Competitive Landscape
- 13.12 Geographic Growth Hotspots
Chapter 14 Global Cruise Shore Excursion Technology, Innovation and Sustainability Outlook
- 14.1 Technology Landscape and Maturity
- 14.2 Product, Process and Service Innovation
- 14.3 AI, Automation and Digital Tools in the Industry
- 14.4 Technology Adoption and Performance Benchmarking
- 14.5 Innovation Pipeline and R&D Investment
- 14.6 Energy Efficiency and Resource Management
- 14.7 Sustainability, Recycling and Circularity
- 14.8 Technology Roadmap, 2025-2035
- 14.9 Risks of Obsolescence and Technology Substitution
Chapter 15 Global Cruise Shore Excursion Market Key Strategic Imperatives
- 15.1 Growth and Market Entry Priorities
- 15.2 High-Return Products and Segments
- 15.3 Pricing, Profitability and Cost Optimization
- 15.4 Technology Investment and Product Differentiation
- 15.5 Supply Chain Localization and Resilience
- 15.6 Distribution and Customer Acquisition
- 15.7 Partnership, Acquisition and Capacity Strategy
- 15.8 Regional Expansion Priorities
- 15.9 Short-, Medium- and Long-Term Actions
Chapter 16 Competition Outlook
- 16.1 Industry Competition Characteristics
- 16.2 Market Structure and Concentration
- 16.3 Market Share and Competitive Positioning, 2025
- 16.4 Company-Wise Revenue and Product Benchmarking
- 16.5 Production and Service Capacity Benchmarking
- 16.6 Technology, Pricing and Differentiation
- 16.7 Regional Footprint and Distribution Strength
- 16.8 Mergers, Acquisitions and Strategic Alliances
- 16.9 New Entrants and Competitive Threats
- 16.10 Porter's Five Forces and Industry Attractiveness
- 16.11 Competitive Outlook, 2025-2035
Chapter 17 Company Profiles
- 17.1 Company Coverage and Selection Criteria
- 17.2 Royal Caribbean Group
- 17.2.1 Business Description
- 17.2.2 Company Ownership and Geographic Presence
- 17.2.3 Product and Service Portfolio
- 17.2.4 Manufacturing and Operating Footprint
- 17.2.5 Financial Performance and Investment
- 17.2.6 Market Share and Competitive Position
- 17.2.7 Technology and Innovation Capabilities
- 17.2.8 Strategic Alliances or Partnerships
- 17.2.9 Recent Developments
- 17.2.10 Growth Strategy and Outlook
- 17.3 Carnival Corporation
- 17.4 MSC Cruises
- 17.5 Viator (Tripadvisor)
- 17.6 GetYourGuide
- 17.7 Shore Excursions Group
- 17.8 Norwegian Cruise Line Holdings
- 17.9 Holland America Line
- 17.10 Other Relevant Market Participants
Note: Every listed company is profiled on the structure shown under the first company. The company list is preliminary and may change based on research findings, market developments, data availability and client requirements.
Chapter 18 Disclaimer
- 18.1 Research and Forecast Disclaimer
- 18.2 Data Source and Estimation Limitations
Note: The depth of individual sections depends on data availability for this market. Volume, capacity, trade and other unit-based metrics are included where applicable.

