
Repeat buying and menus keep American heat demand rising
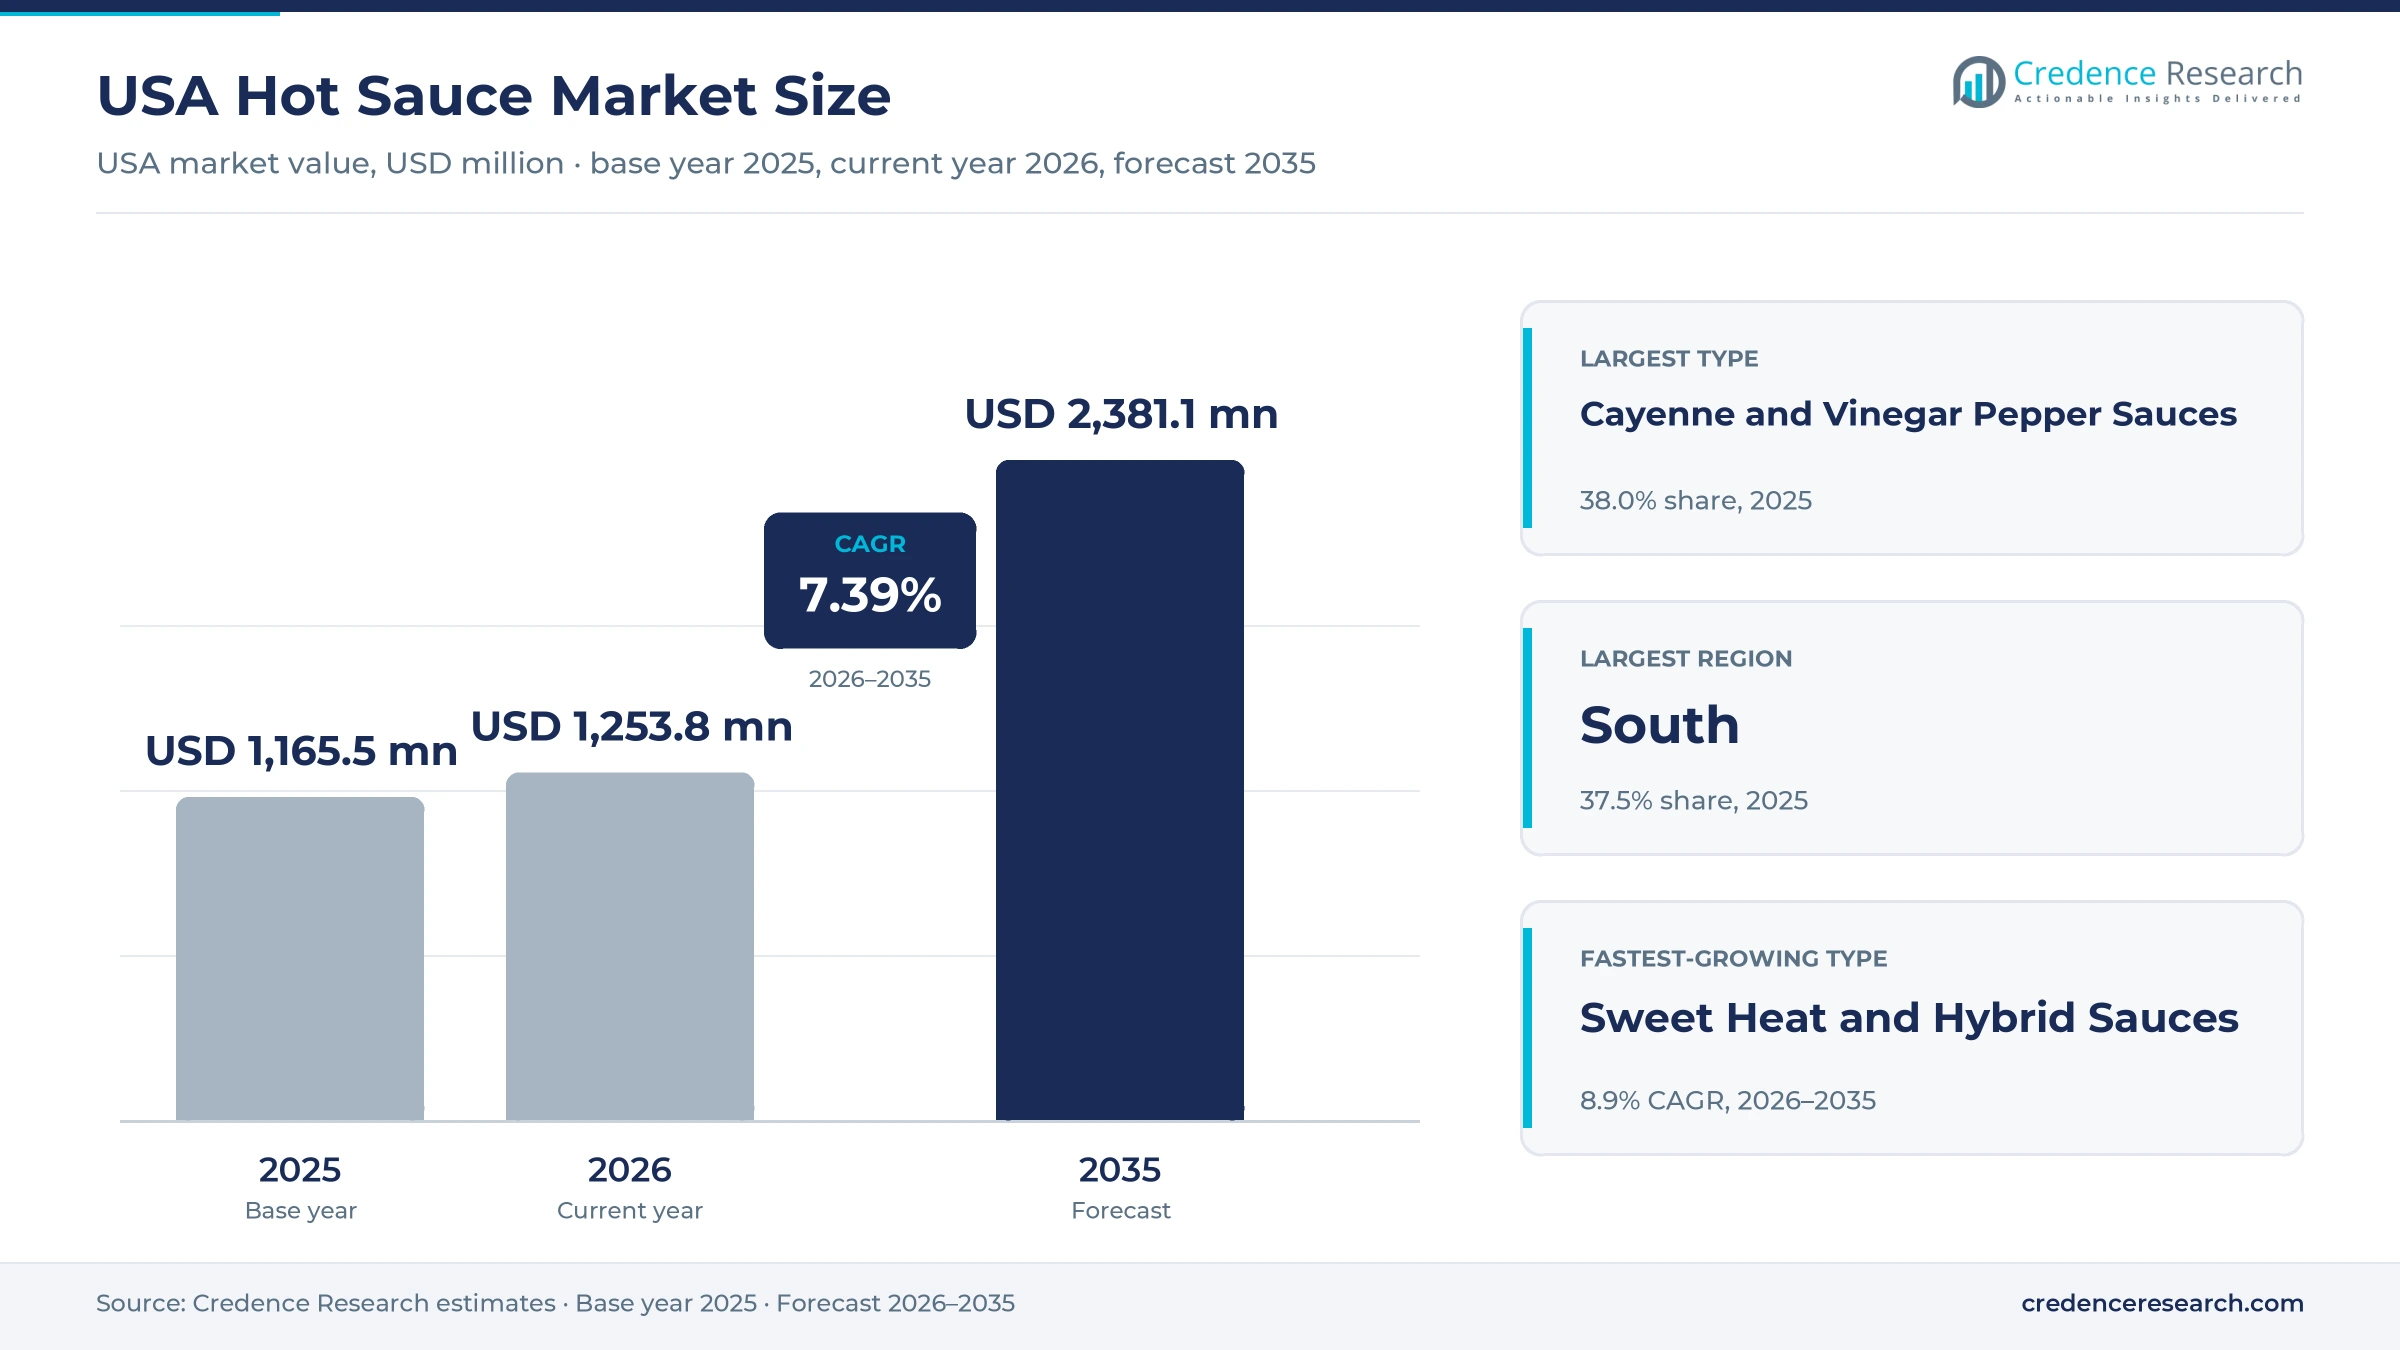
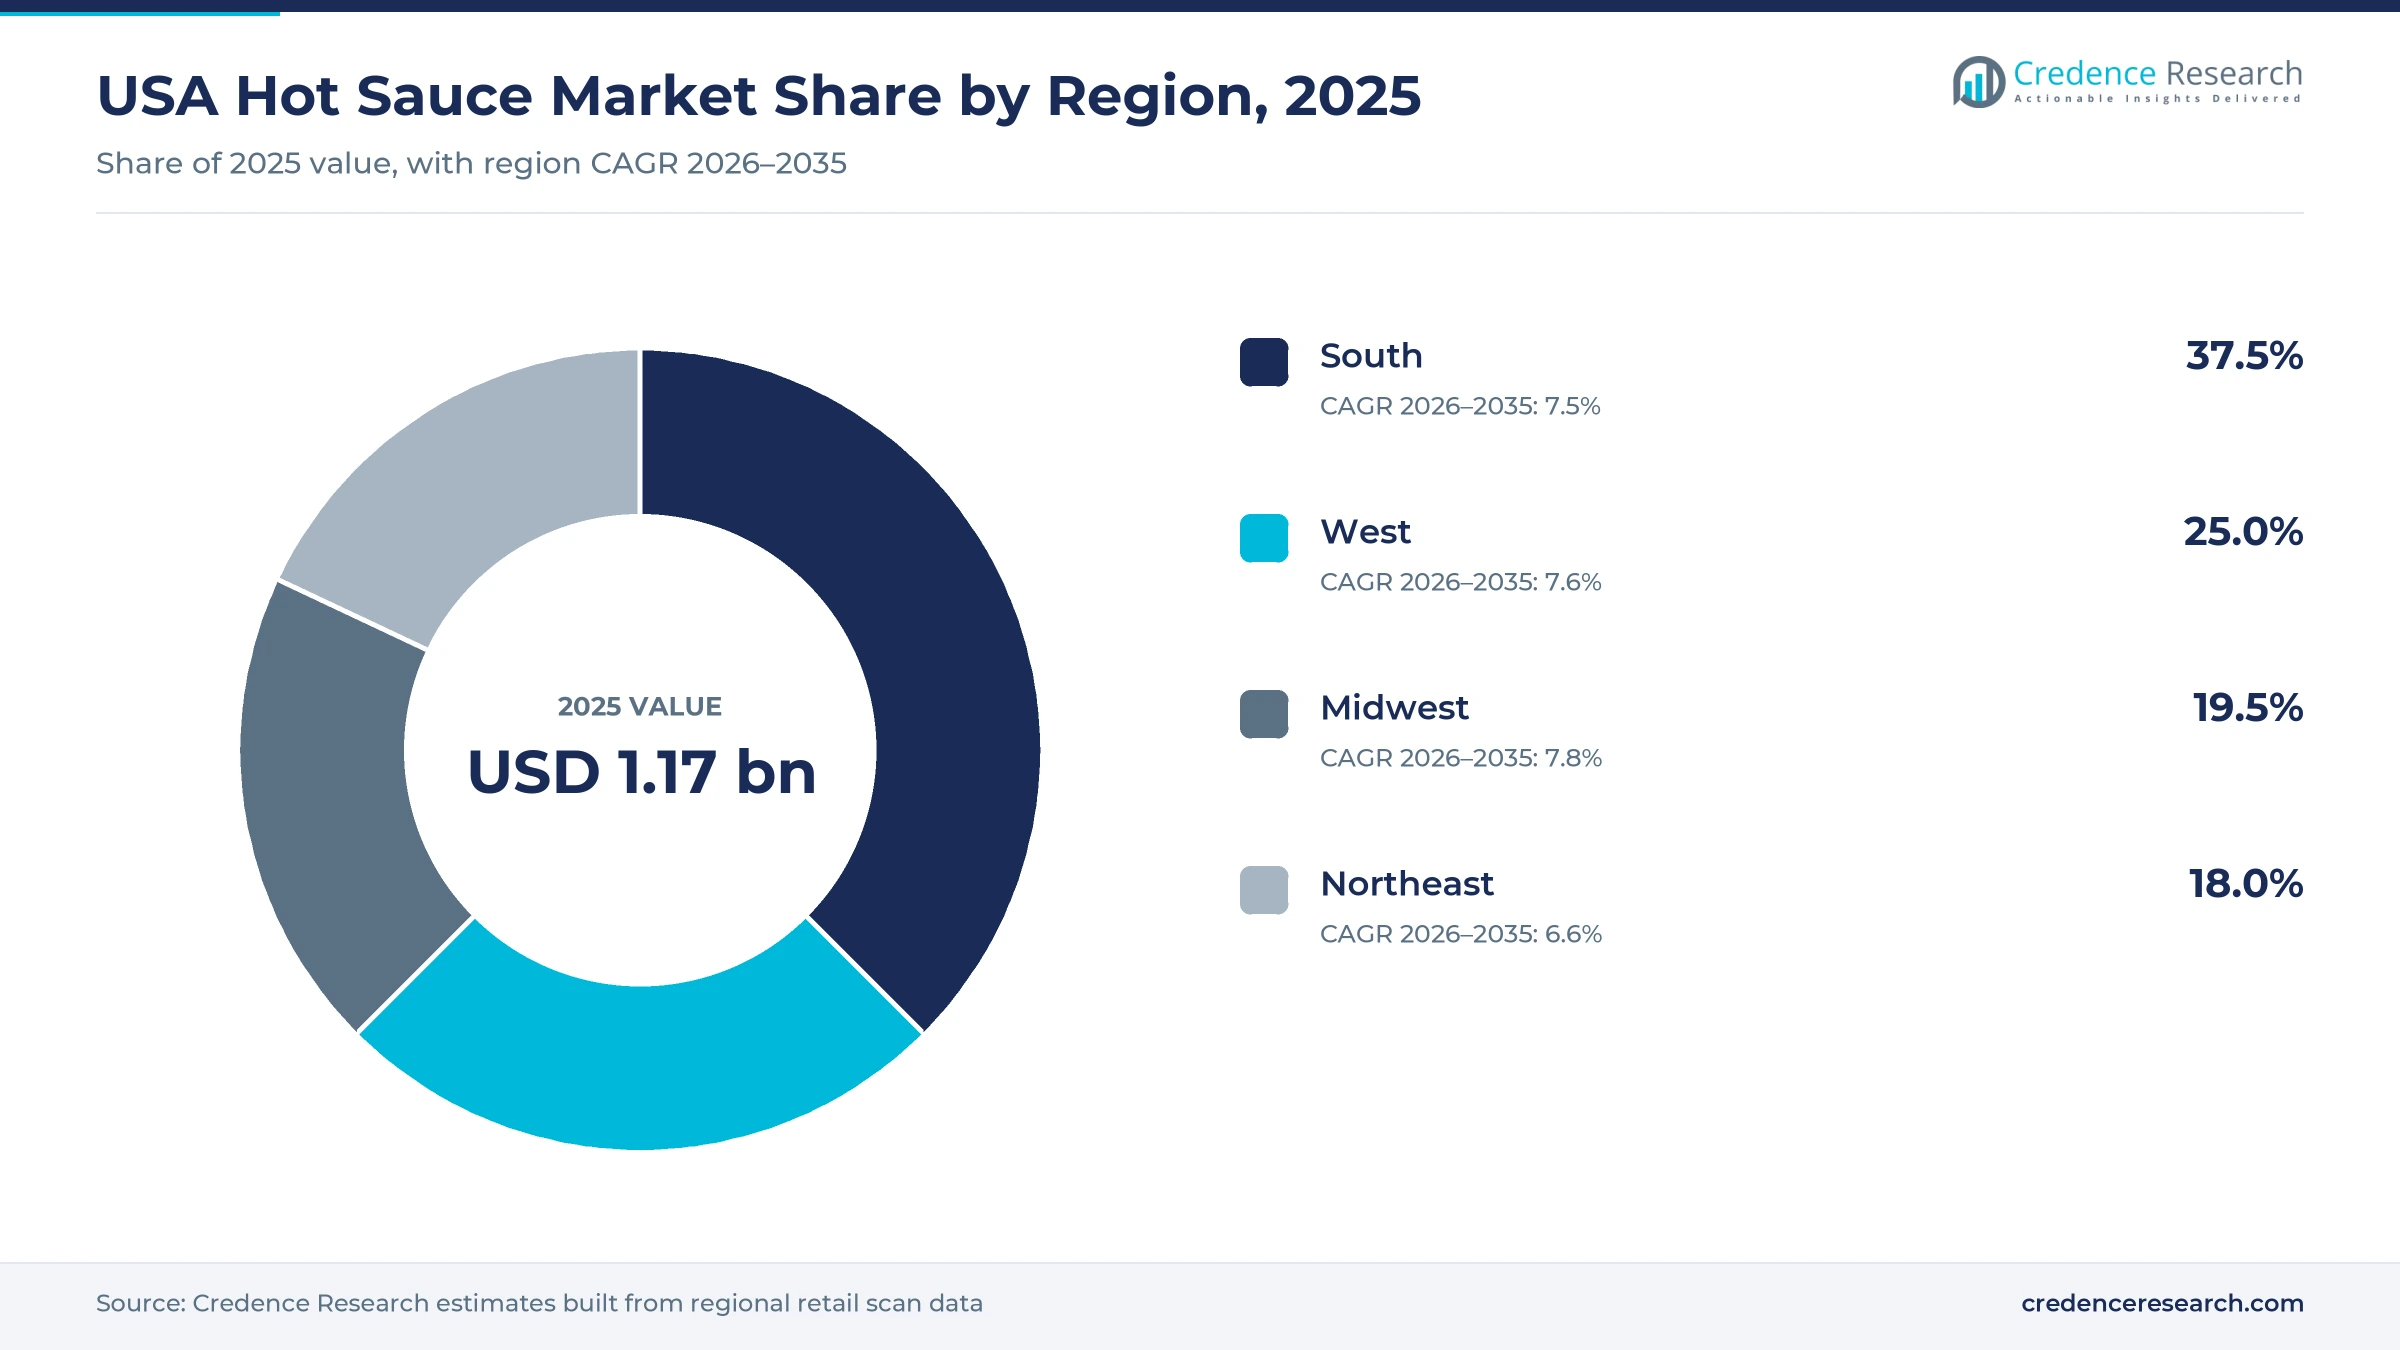
The USA hot sauce market was valued at USD 1.17 billion in 2025 and is projected to increase from USD 1.25 billion in 2026 to USD 2.38 billion by 2035, registering a CAGR of 7.39% during 2026–2035. Demand rests on a condiment habit that most households repeat every few weeks, on restaurant chains that build wings, tacos and chicken sandwiches around branded heat, and on Latino and Asian households whose cooking brings Mexican-style and chili sauces into the mainstream aisle. The South held 37.5% of 2025 value, the largest share of any region, because Louisiana and Texas brands dominate shelves there and tracked retail sales run well ahead of other regions. The Midwest is the fastest-growing region at 7.8% a year, as chain wing restaurants and mass merchants widen their ranges. On the commercial side, heritage makers are moving into sriracha and Mexican-style recipes, and private investors are buying regional brands to take them national, which is widening competition across every price tier.
Bottled, packet and bulk pepper sauces form one estimate
The estimate measures sales of ready-to-use pepper sauces sold in the United States, at manufacturer selling value for foodservice and ingredient sales and at retail value for household purchases. It covers cayenne and vinegar sauces, sriracha and Asian chili sauces, Mexican-style sauces, habanero and superhot sauces, and sweet heat and hybrid sauces, in bottles, packets, jugs and gift sets.
The estimate excludes salsas, chili crisp oils sold as cooking oils, dry chili seasonings, spicy ketchups and mayonnaise, and exports of U.S.-made sauces. The value chain runs from pepper growers and mash producers through bottlers and co-packers to grocery chains, foodservice distributors, restaurants and online sellers.
USA Hot Sauce Market Insights
- The USA hot sauce market was valued at USD 1.17 billion in 2025 and is projected to reach USD 2.38 billion by 2035, registering a CAGR of 7.39% during 2026–2035.
- The South held 37.5% of 2025 value, because Louisiana and Texas brands dominate its shelves and tracked retail sales there reached $364.1 million.
- Cayenne and vinegar pepper sauces led with 38.0% of 2025 value, because Frank's RedHot, Tabasco, Texas Pete and Crystal anchor most grocery shelves.
- Tracked U.S. hot sauce retail sales reached $877.6 million in the 52 weeks to April 20, 2025, up 5.5%, according to retail scan data compiled by Maine DECD.
- In January 2026, Highlander Partners bought the Tapatío brand with plans to enter new geographic markets and broaden its distribution channels.
Cayenne vinegar sauces lead as sweet heat grows fastest
Why do cayenne vinegar sauces still hold the most value?
Based on product type, the market is categorized into cayenne and vinegar pepper sauces, sriracha and Asian chili sauces, Mexican-style pepper sauces, habanero and superhot sauces, and sweet heat and hybrid sauces. Cayenne and Vinegar Pepper Sauces led with 38.0% of 2025 value, because Frank's RedHot reached Northeast multi-outlet stores with 90.4% weighted distribution in the year to April 2025, according to Maine DECD retail data. Sweet Heat and Hybrid Sauces grow fastest at 8.9% a year, as MegaMex added a Sweet & Spicy topping sauce to its La Victoria line on Aug. 26, 2025, and Texas Pete sells a Sweet CHAbanero sriracha habanero blend.
How do households and restaurants split hot sauce spending?
Based on customer type, the market is categorized into household consumers, foodservice operators, food manufacturers and institutional buyers. Household Consumers led with 78.0% of 2025 value, because hot sauce sits in most pantries and is bought again every few weeks, and Northeast multi-outlet shoppers alone bought 32.3 million bottles in the year to April 2025, according to Maine DECD retail data. Foodservice Operators grow fastest at 8.6% a year, as McCormick said on Oct. 7, 2025, that Cholula was driving strong growth in front-of-house foodservice. Restaurant tables put a brand in front of diners who then look for it in stores.
Which channels move the most hot sauce to buyers?
Based on distribution channel, the market is categorized into supermarkets and mass merchandisers, foodservice distributors, convenience and specialty retailers, online retail and direct-to-consumer, and direct institutional and private label. Supermarkets and Mass Merchandisers led with 62.0% of 2025 value, because Kroger and Walmart carry national and regional brands side by side, and multi-outlet stores accounted for $848.8 million of tracked sales in the year to April 2025, against $28.8 million in natural stores. Online Retail and Direct-to-Consumer grows fastest at 9.5% a year, as the San Antonio Current reports that Yellowbird sauces often rank as top sellers on Amazon, while Heatonist sells a wider range on its own website than in stores.
Why are squeeze bottles gaining on classic glass?
Based on packaging format, the market is categorized into glass bottles, plastic squeeze bottles, single-serve packets, bulk jugs and pails, and multi-pack and gift sets. Glass Bottles led with 50.0% of 2025 value, because heritage brands such as Tabasco, Crystal and Cholula still sell mainly in glass, and Crystal imports its bottles from Mexico. Plastic Squeeze Bottles grow fastest at 8.6% a year, as McCormick cited Frank's squeeze bottles on its Oct. 7, 2025, earnings call as a 2024 launch still lifting results. Squeeze packs let households pour larger amounts onto wings, eggs and sandwiches, so each bottle empties faster.
| Segment Group | Leading Sub-segment | Share, 2025 | Fastest-growing Sub-segment | CAGR, 2026–2035 |
|---|---|---|---|---|
| By Product Type | Cayenne and Vinegar Pepper Sauces | 38.0% | Sweet Heat and Hybrid Sauces | 8.9% |
| By Customer Type | Household Consumers | 78.0% | Foodservice Operators | 8.6% |
| By Distribution Channel | Supermarkets and Mass Merchandisers | 62.0% | Online Retail and Direct-to-Consumer | 9.5% |
| By Packaging Format | Glass Bottles | 50.0% | Plastic Squeeze Bottles | 8.6% |
Shelf prices run from $2 store brands to $18 truffle bottles
Pricing in the USA hot sauce market follows brand tier and pack size more than pepper type. Private label and regional value brands sell near $2 a bottle, mainstream national brands at $3.40 to $5.30, and premium and craft sauces at $10 to $18. Large brands fund frequent promotions, while premium brands rely on flavor stories, gift packs and online sales to hold price. Peppers, vinegar, glass and freight are the main cost items, so tariffs on imported mash and bottles push makers to raise list prices or move to squeeze packs.
| Brand or offer | Typical price or fee | Basis |
|---|---|---|
| Private label hot sauce | About $2.18 average a bottle | Maine DECD retail scan report, Northeast, year to April 2025 |
| Tabasco | About $3.44 average a bottle | Maine DECD retail scan report, Northeast, year to April 2025 |
| La Victoria topping sauces, 9 oz squeeze | $3.49 to $3.99 suggested retail | Hormel Foods release, Aug. 26, 2025 |
| Frank's RedHot | About $4.41 average a bottle | Maine DECD retail scan report, Northeast, year to April 2025 |
| Cholula | About $5.26 average a bottle | Maine DECD retail scan report, Northeast, year to April 2025 |
| Yellowbird classic sauces, 19.6 oz squeeze | $9.99 a bottle | San Antonio Current, June 2025 |
| Truff Original Black Truffle, 6 oz | $17.92 a bottle | Walmart.com listing, November 2026 |
Request a Free Sample
Fill in your details and we'll send you a free sample report.
- Sample data tables & charts
- Research methodology
Pantry habits, wing menus and Latino shoppers lift sales
How does repeat pantry buying keep hot sauce growing?
Hot sauce has become a routine pantry purchase rather than a specialty item, which gives brands steady repeat demand even when shoppers trade down elsewhere. Retail scan data compiled by the Maine Department of Economic and Community Development put tracked U.S. hot sauce sales at $877.6 million in the 52 weeks to April 20, 2025, up 5.5% from a year earlier. Hot sauce was the fastest-growing of the four condiment subcategories in that report and made up about 6% of a $15.5 billion condiments, dressings and marinades category. McCormick reported U.S. unit share gains in hot sauce in its Oct. 7, 2025, earnings call, helped by wider distribution and brand marketing. Household consumers hold 78.0% of 2025 value, so this repeat buying sets the base for the whole market.
Why do wing chains and restaurant menus lift volume?
Restaurants buy hot sauce in bulk and use it as a menu feature, which makes foodservice the largest single source of volume outside the home. NACS reported in August 2025 that 95% of U.S. restaurant menus now carry spicy options, up from 91.6% in 2015, and that spicy pizza options are up 121% over ten years. The National Chicken Council projected 1.47 billion chicken wings for Super Bowl LIX, released on Jan. 30, 2025, and each order leaves the kitchen finished with a sauce or a dry rub such as barbecue seasoning. Garner Foods sells Texas Pete to restaurants and military commissaries as well as supermarkets. Foodservice demand grows faster than household buying, which shifts the mix toward gallon jugs and packets.
How do Latino and Asian households widen hot sauce styles?
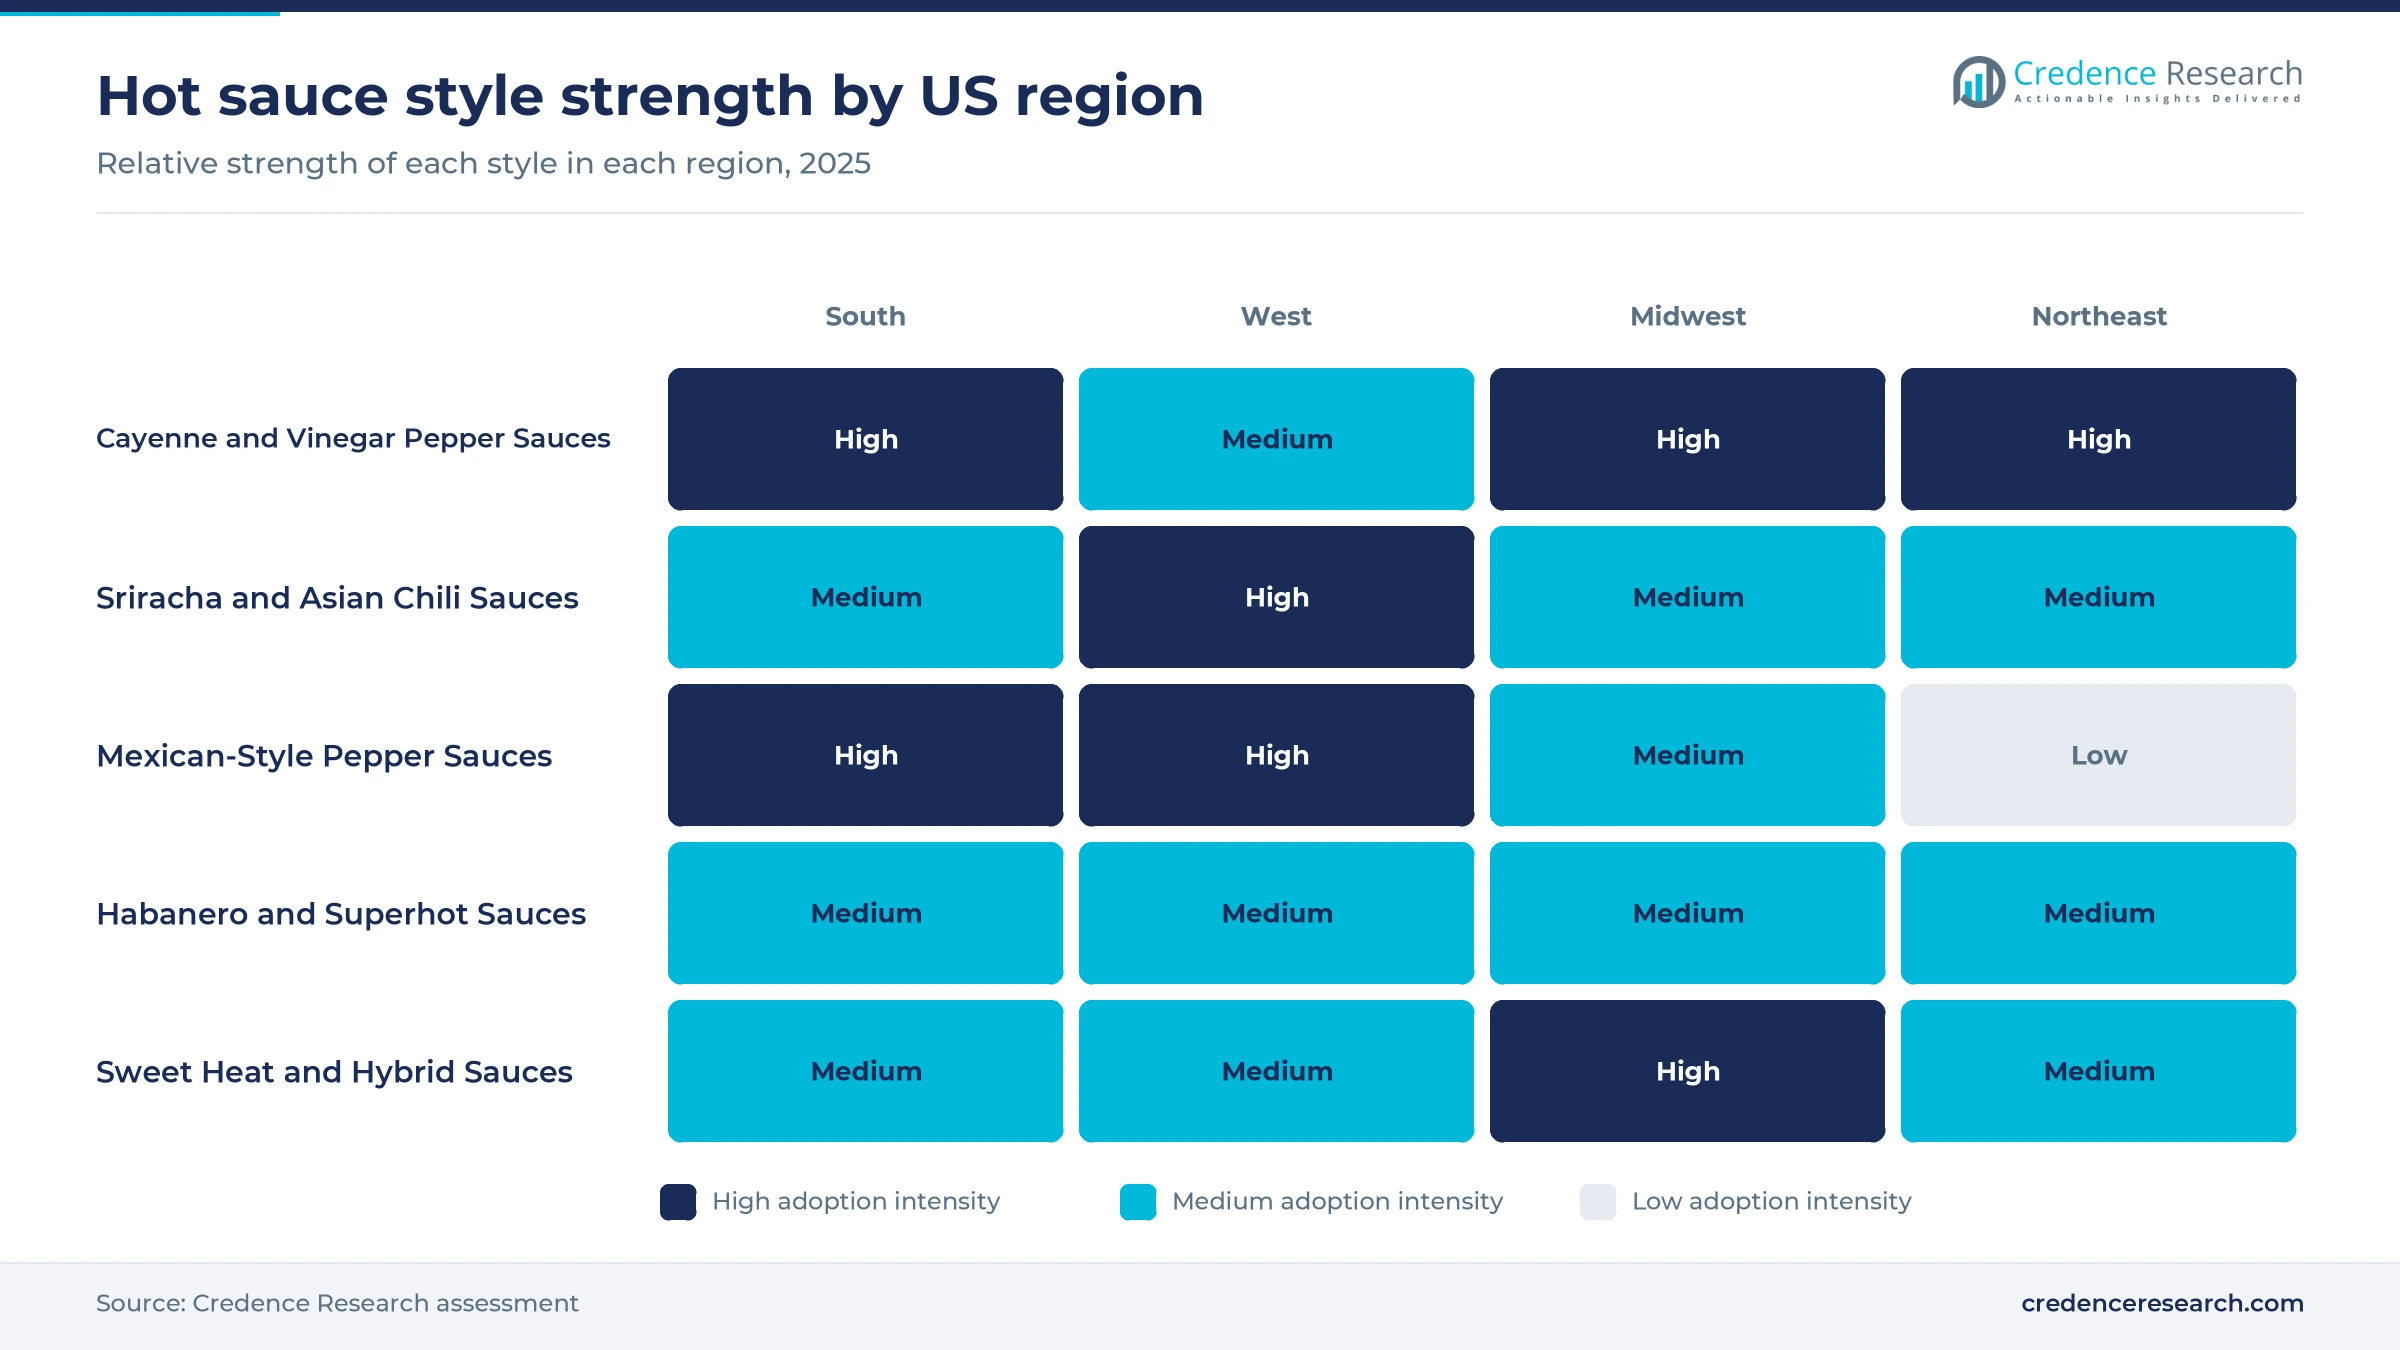
Population change is widening the range of sauces that sell in mainstream stores, because Latino and Asian households use chili sauces daily and introduce them to neighbors and coworkers. The U.S. Census Bureau counted about 68.1 million Hispanic or Latino residents in 2024, up 2.9% in one year, a gain larger than all other groups combined. The Asian population grew fastest of any group, at 4.2%, to about 22.1 million. Tapatío, a Mexican-style sauce from Vernon, California, made since 1971, is now a top-five hot sauce brand in the United States, according to ABC7. Mexican-style sauces and sriracha therefore gain shelf space that used to belong only to Louisiana-style brands.
Why do retail listings for challenger brands expand the aisle?
New national listings for younger brands bring more buyers into the category, because shoppers who try a new flavor often keep a classic bottle as well. Heatonist placed three Hot Ones sauces in more than 8,000 U.S. grocery stores, including Kroger, Publix, Whole Foods and Meijer, in April 2024, according to Tasting Table. Austin-based Yellowbird expanded its five classic sauces into Academy Sports + Outdoors stores nationwide, as reported by the San Antonio Current in June 2025. Melinda's, based in Texas, said on Jan. 16, 2025, that it was ranked the fastest-growing brand of 2024 on gains in household reach and sales, with a line of 41 spicy sauces and condiments. Wider listings make the shelf more crowded, which helps total sales but raises promotion costs for every brand.
Heritage brands add new styles as investors buy in
Shift of heritage Louisiana makers into new sauce styles
Long-established Louisiana brands are moving into styles that used to belong to other makers, which blurs the line between cayenne, Mexican and Asian sauces. Baumer Foods launched a Crystal sriracha in October 2025, as reported by Axios New Orleans, and is studying sales of its pepper pulp to consumers. McIlhenny introduced Tabasco Salsa Picante, its first Mexican-style sauce, in its squeeze line next to its sriracha, Buffalo and sweet and spicy sauces, giving the squeeze range four styles, according to Food Business News. McCormick said on Oct. 7, 2025, that it is expanding Cholula into cremosas and cooking sauces and has put Cholula Extra Hot on shelves. Shoppers now compare styles within one brand, which strengthens the largest makers.
Rise of private investors in regional hot sauce brands
Private capital is buying family-owned brands and funding national rollouts, which speeds up competition outside the home regions of each brand. Highlander Partners acquired Tapatío from the Saavedra family, with The Arnold Companies taking a significant minority stake, according to Food Engineering on Jan. 23, 2026. The new owners plan to enter new geographic markets, broaden distribution and move into complementary products. Luis Saavedra told the Los Angeles Times that demand has risen as many GLP-1 users look for more flavor in smaller meals, as reported by ABC7 in April 2026. New owners bring larger trade budgets, which can move Western brands into Southern and Midwestern stores.
Can premium and craft sauces become a larger opening?
Premium sauces sell at several times the price of mainstream bottles, which gives small brands room to earn margins that the value tier cannot offer. Truff sold at an average of $13.49 a bottle in Northeast multi-outlet stores in the year to April 2025, against $4.41 for Frank's RedHot, according to the Maine DECD report. Truff still reached stores with only 25.7% weighted distribution, which leaves room for more listings. The Northeast natural channel sold hot sauce at an average of $5.52 a bottle, above the conventional aisle. Brands that pair a clear flavor story with gift packs and online sales can grow this tier without heavy price promotion.
Is the restaurant-branded sauce aisle an opening?
Restaurant brands are moving their sauces from tables and drive-thru bags into grocery aisles, which opens a licensing route for chains and sauce makers. Kraft Heinz already makes Taco Bell-branded sauces, taco kits and seasonings for retail sale and added Taco Bell meal kits at Walmart in 2024, according to Food Dive. Taco Bell Home Originals sauces rose 51.5% in Northeast multi-outlet dollars in the year to April 2025, the fastest gain among the top ten brands there. Hot Ones also put frozen chicken strips flavored with its sauces into grocery stores in late 2023. Licensed sauces borrow restaurant loyalty, which lowers the cost of winning shelf space for co-packers.
Pepper crops, tariffs and price promotions test margins
Why do pepper crop failures disrupt sauce supply?
Hot sauce makers depend on a narrow window of pepper harvests, so a poor crop can empty shelves for months. Huy Fong Foods told wholesalers on April 30, 2024, that it would halt sriracha production until after Labor Day because its peppers were too green, according to Manufacturing Dive. The company has struggled to source jalapeños since 2020. New Mexico planted 8,000 acres of chile in 2024, down 9%, according to USDA NASS. Makers that contract with several growers in different states and in Mexico reduce this risk.
How do tariffs on peppers and glass raise costs?
Many sauce makers import pepper mash, peppers or bottles, so tariffs on Mexican and Asian goods land directly in their cost base. Crystal imports its cayenne peppers and its glass bottles from Mexico, and tariffs are a concern for the company, according to Axios New Orleans. McCormick put its annualized gross tariff exposure at about $140 million in October 2025 and began targeted tariff pricing. Smaller brands cannot absorb such costs, so they raise shelf prices or switch to domestic bottles and peppers.
Why does heavy promotion squeeze shelf prices in mature regions?
Shelf prices are under pressure in the most mature regions, because large brands use promotions to defend share. In Northeast multi-outlet stores, hot sauce dollars rose only 2.8% in the year to April 2025 while units rose 4.4%, so the average price per bottle fell, according to the Maine DECD report. Tabasco dollars fell 1.8% in the same region over the same twelve months. Private label and value brands gain in this setting, while mainstream brands must fund deeper discounts to hold their positions on the shelf.
How do labeling errors and recalls threaten brand trust?
Sauce lines that share equipment and labels across many flavors face a real risk of allergen and labeling errors. On April 3, 2025, Garner Foods recalled Texas Pete Habanero Buffalo Sauce over undeclared sulfites and its Sweet CHAbanero sauce over mislabeling, in bottles from two ounces to half a gallon. The products had gone to distribution centers and stores in ten states, including California, Illinois and North Carolina. Stricter changeover checks and label audits are the main mitigation.
The South buys the most while the Midwest grows fastest
The USA hot sauce market is split into the four Census regions, which follow population, cooking traditions and the density of chain restaurants. Regional shares and growth rates are Credence Research estimates built from regional retail scan data, census population counts and foodservice coverage.
| Region | Value, 2025 (USD billion) | Share, 2025 | CAGR, 2026–2035 |
|---|---|---|---|
| South | 0.44 | 37.5% | 7.5% |
| West | 0.29 | 25.0% | 7.6% |
| Midwest | 0.23 | 19.5% | 7.8% |
| Northeast | 0.21 | 18.0% | 6.6% |
Why does the South buy the most hot sauce?
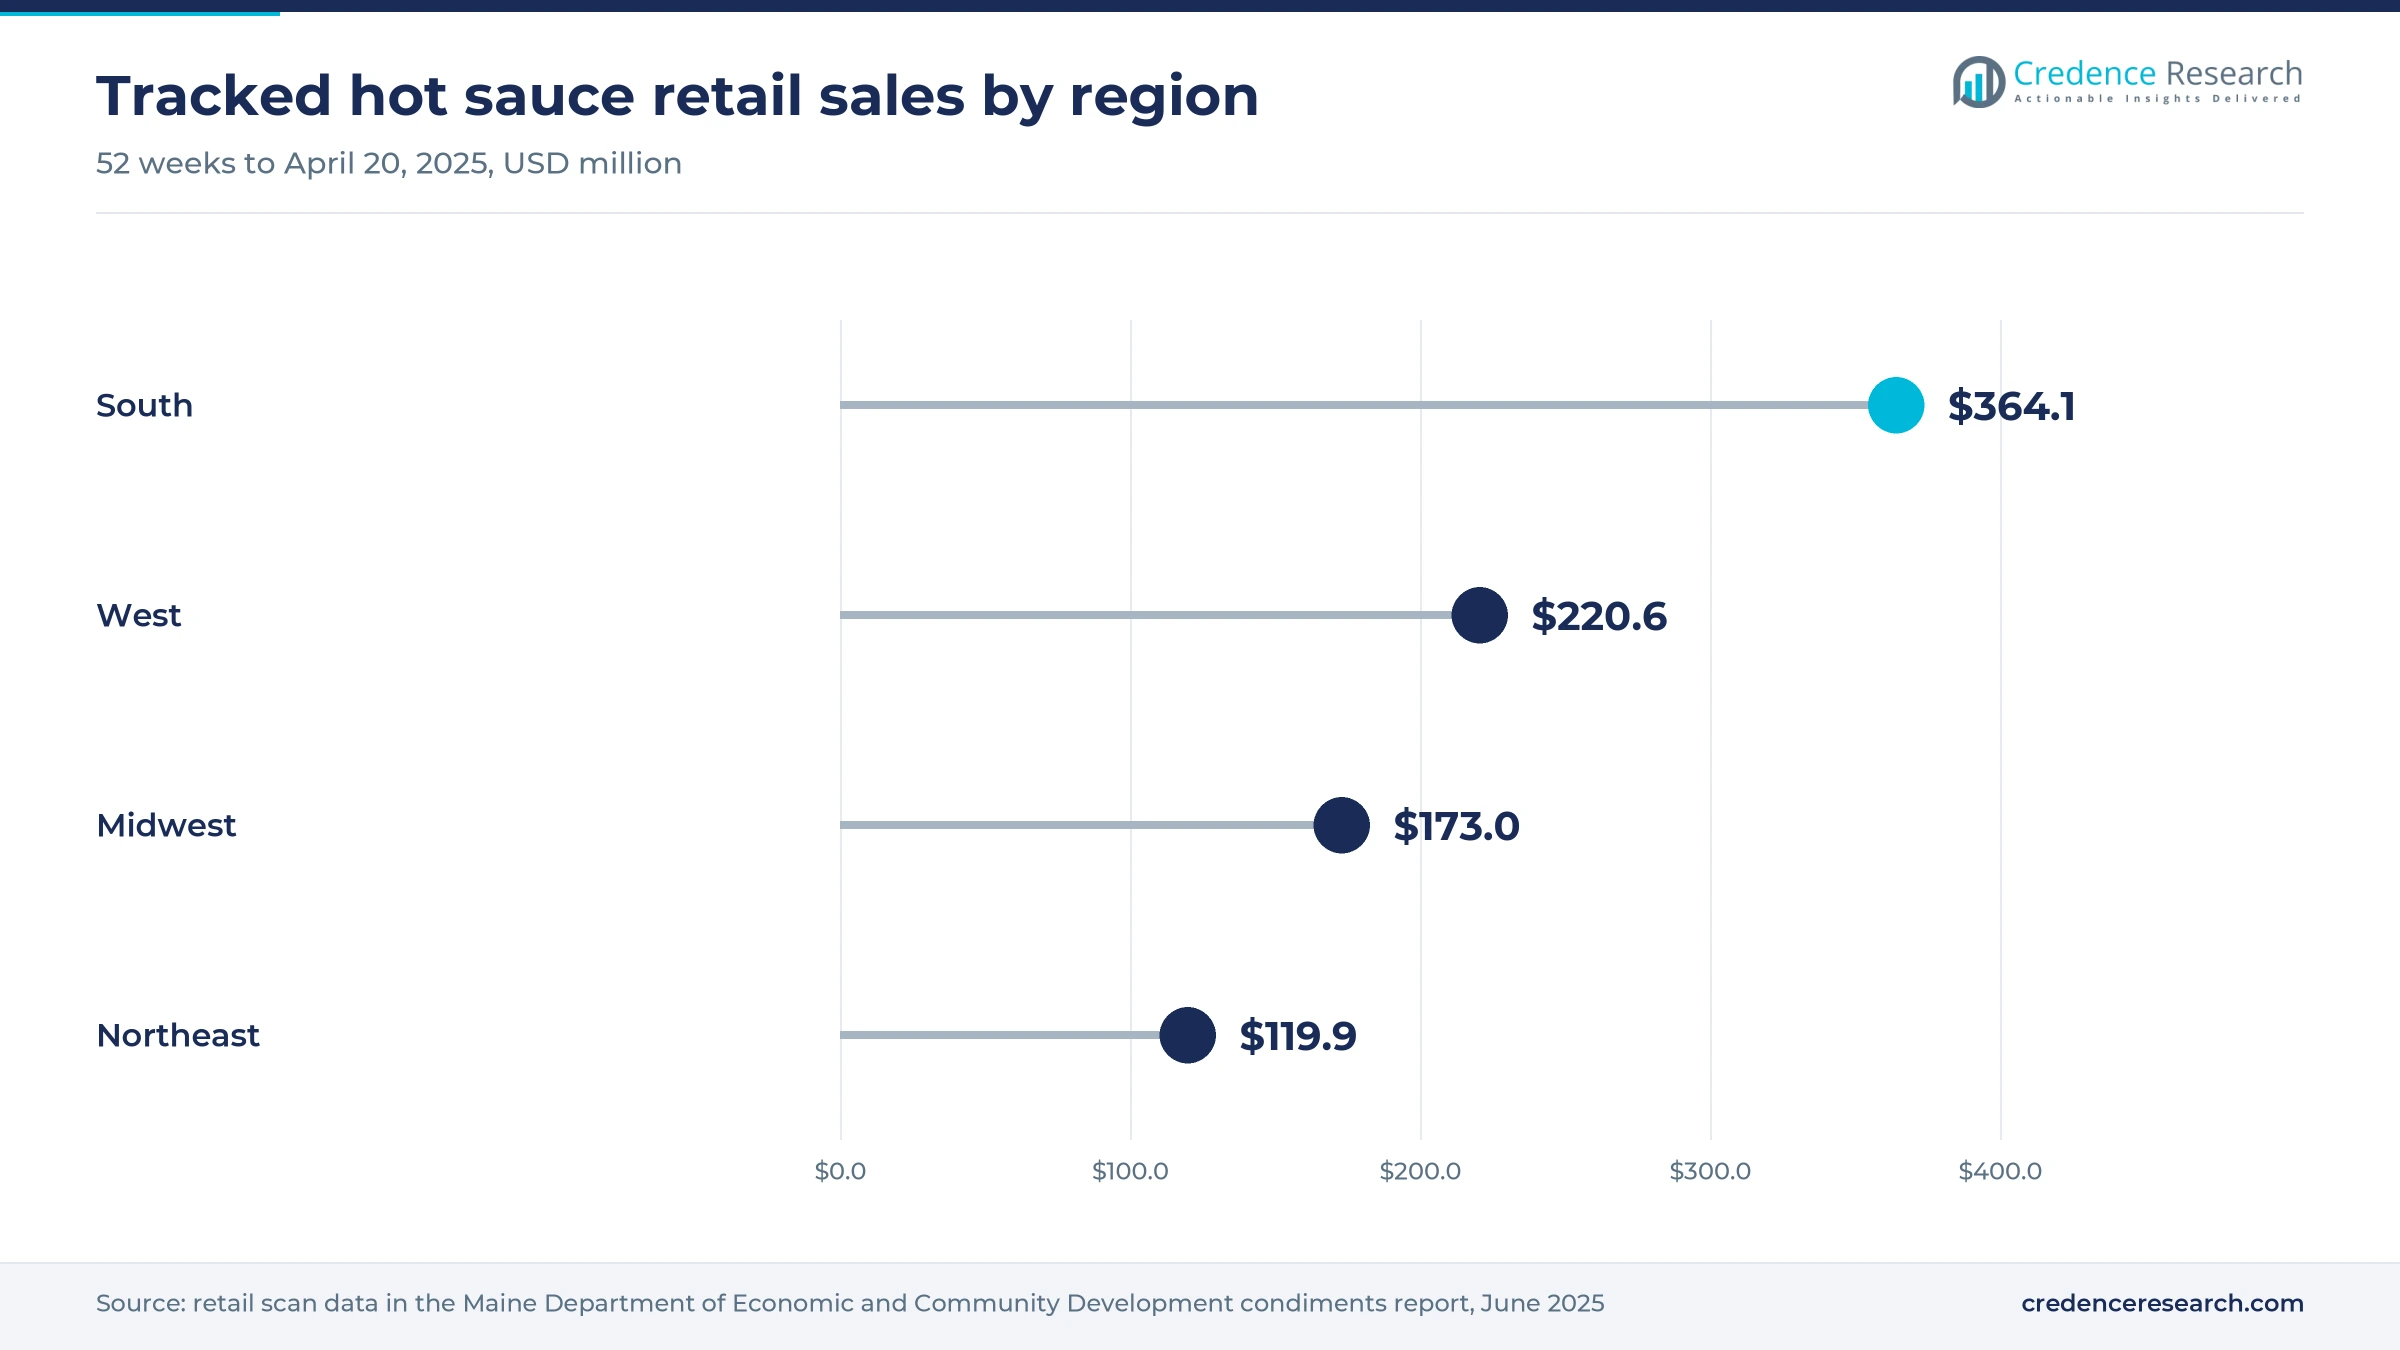
The South held 37.5% of 2025 value and grows at 7.5% a year, because Louisiana, Texas and Carolina brands were born there and are still used at almost every meal. Tracked retail sales in the South reached $364.1 million in the year to April 2025, up 6%, and made up 41% of the national retail total. McIlhenny is based on Avery Island, Crystal operates in Reserve, Louisiana and Texas Pete is based in Winston-Salem. Crystal names the Southeast as its primary market, where its sauce sits near Cajun seasoning in grocery aisles.
How do Mexican-style and Asian sauces shape the West?
The West held 25.0% of 2025 value and grows at 7.6% a year, as Mexican-style and Asian chili sauces carry a larger part of its sales than elsewhere. Tracked retail sales in the West reached $220.6 million in the year to April 2025, up 5.7%. Tapatío has a loyal following in the Western states, and California recorded the largest Asian population gains of any state in 2024, according to the Census Bureau. The West also leads the natural channel, with $15.9 million, or 56% of natural store hot sauce sales.
Why is the Midwest the fastest-growing region?
The Midwest held 19.5% of 2025 value and grows fastest at 7.8% a year, because mass merchants and wing chains are widening their hot sauce ranges. Tracked retail sales in the Midwest reached $173.0 million in the year to April 2025, up 6.3%, the fastest regional gain. Kansas City retail wing sales rose 21.9% in the four weeks to Jan. 19, 2025, during the playoffs, according to the National Chicken Council. Midwest shoppers buy cayenne sauces for wings and Mexican-style sauces for tacos, so both large styles gain there.
How do Northeast foodservice and wing culture offset slower stores?
The Northeast held 18.0% of 2025 value and grows at 6.6% a year, the slowest pace, although dense restaurant markets keep foodservice demand high. Tracked retail sales in the region reached $119.9 million in the year to April 2025, up only 2.6%. New York was the largest Northeast retail market at $31.7 million, ahead of Baltimore and Washington at $20.1 million. Philadelphia retail wing sales rose 19% in the January 2025 playoff weeks, which shows how sports events still lift sauce use.
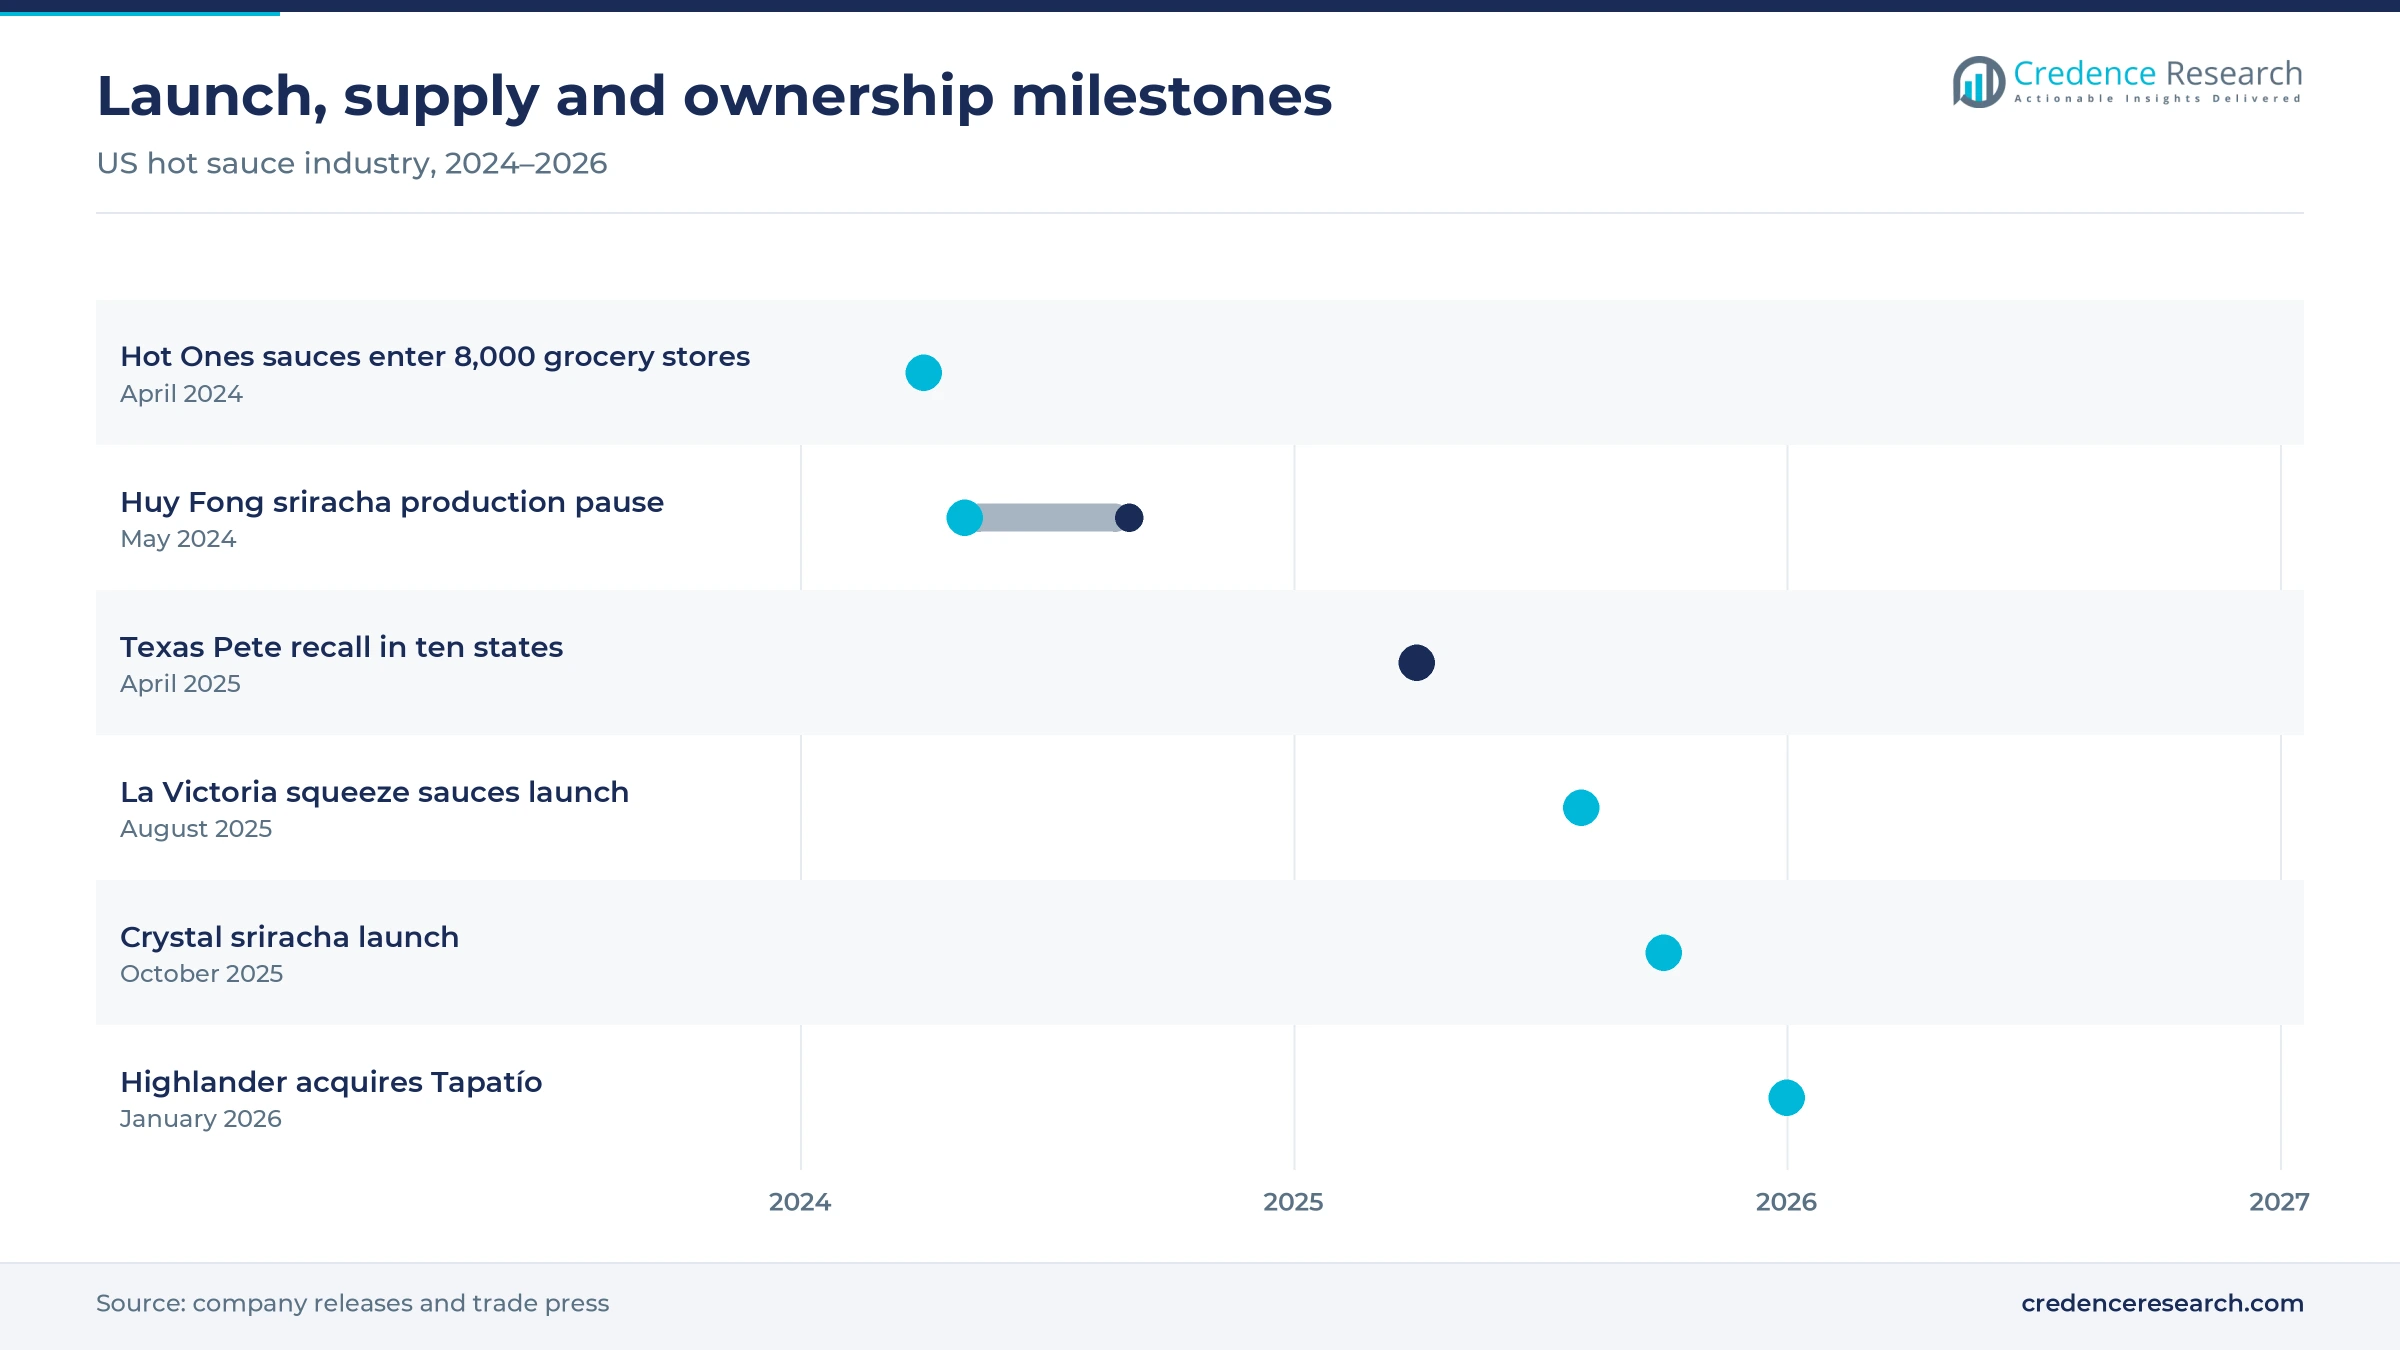
Launches, a brand sale and supply breaks, 2024–2026
| Development | Status and market relevance |
|---|---|
| In April 2024, Heatonist placed three Hot Ones sauces in more than 8,000 U.S. grocery stores, including Kroger and Publix. | National grocery entry for a brand built online |
| In May 2024, Huy Fong Foods paused sriracha production until after Labor Day because its peppers were too green. | Production had also halted in April 2020 and April 2022 |
| In April 2025, T.W. Garner Food Company recalled two Texas Pete sauces over undeclared sulfites and mislabeling. | Products shipped to ten states |
| In August 2025, MegaMex Foods launched three La Victoria topping sauces in 9-ounce squeeze bottles at Kroger and Walmart. | Mexican-style and sweet heat lines in squeeze packs |
| In January 2026, Highlander Partners acquired Tapatío from the Saavedra family, with The Arnold Companies and the Saavedra family holding minority stakes. | Plans to enter new U.S. regions and channels |
Aging, fermenting and bottling choices shape each style
- Barrel and tank aging of pepper mash gives Louisiana-style sauces their depth, which ties makers to long pepper contracts and storage capacity.
- Fermentation of red jalapeño and cayenne mash builds tang without extra vinegar, which suits sriracha and craft sauces that market a cleaner label.
- Hot-fill bottling sterilizes vinegar-based sauces in glass or heat-tolerant plastic, so they keep for months at room temperature.
- Inverted squeeze valves let thicker sauces pour cleanly without dripping, which makes squeeze packs practical for wings and sandwiches.
- Form-fill-seal packet lines produce single-serve portions for drive-thru and delivery orders, so brands stay visible in foodservice.
Need a Custom Version of This Report?
Tailor the scope, geography, or segments to your exact requirements.
- Custom geography or segment scope
- Direct access to our analyst team
Shelf presence and foodservice reach decide the ranking
Competition in the USA hot sauce market turns on shelf presence, foodservice listings, flavor range and price per bottle. McCormick, which also sells spices and seasonings nationwide, leads with Frank's RedHot in cayenne sauces and Cholula in Mexican-style sauces, and it backs both with promotions and new pack formats. McIlhenny's Tabasco and Baumer Foods' Crystal hold strong positions in the South, while Garner Foods' Texas Pete sells through supermarkets, commissaries, convenience stores and restaurants. Huy Fong remains the best-known sriracha brand despite repeated supply breaks. MegaMex Foods, the Hormel Foods and Grupo Herdez joint venture, sells Herdez and La Victoria sauces, and Tapatío now has new owners with national plans. Kraft Heinz makes Taco Bell-branded sauces for retail under license, according to Food Dive. Yellowbird and Melinda's compete with new flavors, squeeze packs and online sales, while Louisiana Hot Sauce, owned by Summit Hill Foods, formerly Southeastern Mills, since 2015, competes in the value tier.
Two food majors face Louisiana heritage firms and craft brands
Supply in the USA hot sauce market is organized in three layers. McCormick, through Frank's RedHot and Cholula, and Kraft Heinz, through licensed Taco Bell sauces, bring national distribution and large trade budgets. Family firms such as McIlhenny, Baumer Foods and Garner Foods own heritage cayenne brands with deep Southern loyalty, while Huy Fong, MegaMex and Tapatío lead sriracha and Mexican-style sauces. Craft brands such as Yellowbird and Melinda's compete on flavor and price. Entry is easy online, but pepper contracts, slotting fees and foodservice listings protect incumbents, and margins sit with brands that own a recognized label.
Companies profiled and their roles in this market
| Company | Type | Role in the market |
|---|---|---|
| McCormick & Company, Inc. | Food major | Frank's RedHot cayenne sauces and Cholula Mexican-style sauces in retail and foodservice |
| McIlhenny Company | Family-owned heritage maker | Tabasco pepper sauce, sriracha and Salsa Picante from Avery Island, Louisiana |
| Huy Fong Foods, Inc. | Sriracha specialist | Sriracha, chili garlic and sambal oelek sauces from California |
| T.W. Garner Food Company | Family-owned heritage maker | Texas Pete hot, wing and seafood sauces from Winston-Salem, N.C. |
| Baumer Foods, Inc. | Family-owned heritage maker | Crystal hot sauce, sriracha and pepper pulp from Reserve, Louisiana |
| The Kraft Heinz Company | Food major | Taco Bell-branded retail sauces made under license |
| MegaMex Foods (Hormel Foods and Grupo Herdez joint venture) | Mexican food joint venture | Herdez hot sauces and La Victoria topping sauces |
| Tapatío Foods, LLC (Highlander Partners) | Investor-owned brand | Mexican-style red pepper sauce from Vernon, California |
| Summit Hill Foods (Louisiana Hot Sauce) | Brand owner | Louisiana Brand hot sauces in the value tier |
| Yellowbird Foods | Craft brand | Jalapeño, serrano, habanero and sriracha sauces in squeeze bottles |
| Melinda's Foods | Craft brand | Line of 41 spicy sauces and condiments, including habanero and ghost pepper sauces |
Mexican-style and sweet heat lines will gain share
Credence Research's view is that the USA hot sauce market will keep growing faster than the wider condiment aisle, because restaurant menus, Latino and Asian households and younger shoppers keep adding new uses for heat. Cayenne sauces keep the largest share, while sweet heat, Mexican-style and squeeze-pack lines gain from smaller bases. The South remains the largest region, and the Midwest gains fastest as chains widen ranges. Winners will secure pepper supply from several growing areas, hold foodservice listings and price clearly by tier, as tariffs and promotions keep pressure on margins.
Retail scan, census and company data anchor the model
The report uses 2025 as the base year on a calendar basis, and market values come from the Credence Research model. That model combines retail scan data published by the Maine Department of Economic and Community Development, U.S. Census Bureau population estimates, USDA crop statistics, company earnings calls and releases, retailer listings and trade press. Segment splits, regional shares and regional growth rates are Credence Research estimates built from retail sales by region, population and restaurant coverage, and no interviews or surveys were used for this report.
Menus, Latino households and new owners carry growth
Hot sauce sales in the United States are expected to reach USD 2.38 billion by 2035, a 7.39% CAGR during 2026–2035, as households keep buying sauce as a pantry staple, restaurants add spicy items across menus, and Latino and Asian cooking styles spread. Sweet heat and Mexican-style sauces should gain share, while cayenne sauces stay the largest style. Online and direct-to-consumer sales grow fastest among channels from a small base. Growth would slow if pepper crops failed again or tariffs raised bottle costs further, while national rollouts by new owners would lift results toward the upside case.
Pepper supply and restaurant traffic set the range of outcomes
In the base case, sales grow from the 2026 value along the central forecast as household buying, restaurant menus and Latino population growth keep their recent pace. The downside case assumes repeated pepper crop failures, higher tariffs on mash and bottles, and weaker restaurant traffic that slows foodservice orders. The upside case adds faster national rollouts for Mexican-style and craft brands and more licensed restaurant sauces in grocery aisles.
| Scenario | CAGR, 2026–2035 | Value, 2035 | What has to hold |
|---|---|---|---|
| Downside | 5.9% | USD 2.10 billion | Pepper crops fail again, tariffs stay high and restaurant traffic weakens |
| Base | 7.39% | USD 2.38 billion | Household buying, menus and Latino population growth keep their recent pace |
| Upside | 8.6% | USD 2.63 billion | Mexican-style and craft brands roll out nationally and licensed sauces spread |
Frequently Asked Questions
How big is the USA hot sauce market?
Which product type leads U.S. hot sauce sales?
Which region holds the largest share?
How fast are tracked retail hot sauce sales growing?
Why do restaurants matter so much for hot sauce?
What are the main supply risks for sauce makers?
Who are the main companies in this market?
Who competes in the value tier of the hot sauce aisle?
Table of Content
Chapter 1 Market Segmentation
- 1.1 Segmentation Framework
- 1.1.1 Product and Service Classification
- 1.1.2 Application and End-Use Classification
- 1.1.3 Technology and Solution Classification
- 1.1.4 Customer and Distribution Channel Classification
- 1.1.5 Geographic Segmentation
- 1.1.6 Market Segment Definitions and Boundaries
- 1.2 By Product Type
- 1.2.1 Cayenne and Vinegar Pepper Sauces
- 1.2.2 Sriracha and Asian Chili Sauces
- 1.2.3 Mexican-Style Pepper Sauces
- 1.2.4 Habanero and Superhot Sauces
- 1.2.5 Sweet Heat and Hybrid Sauces
- 1.3 By Customer Type
- 1.3.1 Household Consumers
- 1.3.2 Foodservice Operators
- 1.3.3 Food Manufacturers
- 1.3.4 Institutional Buyers
- 1.4 By Packaging Format
- 1.4.1 Glass Bottles
- 1.4.2 Plastic Squeeze Bottles
- 1.4.3 Single-Serve Packets
- 1.4.4 Bulk Jugs and Pails
- 1.4.5 Multi-Pack and Gift Sets
Chapter 2 Introduction
- 2.1 Report Objectives and Scope
- 2.2 Product Definition and Industry Terminology
- 2.3 Market Inclusions and Exclusions
- 2.4 Research Process
- 2.4.1 Primary Research and Expert Interviews
- 2.4.2 Secondary Research and Source Review
- 2.4.3 Top-Down and Bottom-Up Estimation
- 2.4.4 Data Triangulation and Verification
- 2.5 Market Size Measurement Basis
- 2.5.1 2025: USD 1.17 billion → 2035: USD 2.38 billion
- 2.6 Historical and Forecast Reference Periods
- 2.6.1 Historical Period: 2018-2025
- 2.6.2 Base Year: 2025
- 2.6.3 Forecast Period: 2025-2035
- 2.7 Research Assumptions and Limitations
Chapter 3 Executive Summary
- 3.1 Market Snapshot and Key Findings
- 3.2 Base-Year Market Size, 2025
- 3.3 Forecast Market Size, 2035
- 3.4 Revenue and Volume Growth Outlook
- 3.5 Key Demand and Supply Indicators
- 3.6 Leading Market Segments
- 3.7 Fastest-Growing Market Opportunities
- 3.8 Regional Performance Highlights
- 3.9 Technology and Industry Transformation
- 3.10 Competitive Landscape Summary
- 3.11 Analyst View and Strategic Implications
Chapter 4 USA Hot Sauce Market Trends and Developments
- 4.1 Historical Industry Development, 2018-2025
- 4.2 Recent Market Trends and Developments
- 4.3 Demand and Customer Behavior Trends
- 4.4 Technology and Product Innovation
- 4.5 Artificial Intelligence, Automation and Digitalization
- 4.6 Local Manufacturing and Supply Chain Realignment
- 4.7 Industry Partnerships, Mergers and Acquisitions
- 4.8 Sustainability and Circular Economy Developments
- 4.9 Government and Private Sector Investment Trends
- 4.10 Emerging Business Models and Commercialization
- 4.11 Industry Developments and Announcements
Chapter 5 USA Hot Sauce Market Production, Supply and Demand Analysis
- 5.1 Demand Trend and Consumption Analysis, 2018-2025
- 5.2 Demand Forecast, 2025-2035
- 5.3 Production and Output Trend, 2018-2025
- 5.4 Production and Output Forecast, 2025-2035
- 5.5 Installed Capacity and Capacity Utilization
- 5.6 Company-Wise Production Plants and Statistics
- 5.6.1 Installed Production Capacity
- 5.6.2 Actual Production
- 5.6.3 Planned Capacity and Expansion Targets
- 5.7 Supply Chain Structure and Procurement Trends
- 5.8 Supply-Demand Gap and Bottlenecks
- 5.9 Import Dependence and Sourcing Structure
- 5.10 Contract Manufacturing and Outsourcing
- 5.11 Regional Supply and Demand Concentration
Chapter 6 USA Hot Sauce Market Pricing Analysis
- 6.1 Pricing Structure and Measurement
- 6.2 Historical Pricing Trends, 2018-2025
- 6.3 Pricing Outlook, 2025-2035
- 6.4 Average Selling Price and Unit Economics
- 6.5 Pricing by Product and Market Segment
- 6.6 Geographic Pricing Differences
- 6.7 Key Input, Energy, Labor and Logistics Costs
- 6.8 Contract Pricing and Purchasing Models
- 6.9 Pricing Sensitivity and Competitive Positioning
- 6.10 Price, Margin and Profitability Implications
Chapter 7 USA Hot Sauce Market Dynamics
- 7.1 Market Growth Drivers
- 7.1.1 Demand-Side Drivers
- 7.1.2 Technology and Innovation Drivers
- 7.1.3 Infrastructure and Investment Drivers
- 7.1.4 Regulatory and Policy Drivers
- 7.2 Market Restraints
- 7.2.1 Cost and Affordability Constraints
- 7.2.2 Technology and Adoption Barriers
- 7.2.3 Supply Chain and Operational Constraints
- 7.3 Market Challenges
- 7.3.1 Competitive Pressure and Margin Erosion
- 7.3.2 Skills, Infrastructure and Implementation Gaps
- 7.4 Emerging Market Opportunities
- 7.5 Market Dynamics Impact and Time-Horizon Assessment
Chapter 8 USA Hot Sauce Value Chain Analysis
- 8.1 Industry Value Chain Overview
- 8.2 Upstream Suppliers and Critical Inputs
- 8.3 Technology and Component Providers
- 8.4 Manufacturing or Service Delivery
- 8.5 Distribution, Channel Partners and Integrators
- 8.6 Downstream Applications and End Users
- 8.7 Value Addition and Profit Pools
- 8.8 Vertical Integration and Outsourcing
- 8.9 Supplier Concentration and Risk
- 8.10 Supply Chain Localization and Resilience
Chapter 9 USA Hot Sauce Market Regulations and Policies
- 9.1 Relevant Laws, Standards and Compliance Frameworks
- 9.2 Product, Service, Safety and Quality Requirements
- 9.3 Government Policies, Incentives and Subsidies
- 9.4 Imports, Exports and Trade Barriers
- 9.5 Public Procurement and Local Content Requirements
- 9.6 Environmental and Sustainability Compliance
- 9.7 Upcoming Policy Changes and Market Implications
Chapter 10 USA Hot Sauce Market Hotspots and Opportunities
- 10.1 Market Opportunity Mapping and Growth Hotspots
- 10.2 High-Growth Applications and Customer Groups
- 10.3 Underserved Markets and White-Space Opportunities
- 10.4 Emerging Technology and Product Opportunities
- 10.5 New Capacity and Investment Hotspots
- 10.6 Market Entry and Expansion Opportunities
- 10.7 Distribution and Partnership Opportunities
- 10.8 Near-Term and Long-Term Commercial Potential
- 10.9 Opportunity Attractiveness and Execution Risks
Chapter 11 USA Hot Sauce Market Outlook, 2025-2035
- 11.1 Market Size and Analysis
- 11.1.1 Revenue (Market Measurement: 2025: USD 1.17 billion → 2035: USD 2.38 billion)
- 11.1.2 Market Volume and Quantity Sold
- 11.1.3 Historical Market Size, 2018-2025
- 11.1.4 Base-Year Market Size, 2025
- 11.2 Market Forecast, 2025-2035
- 11.2.1 Revenue Forecast to 2035
- 11.2.2 Volume Forecast to 2035
- 11.2.3 CAGR and Year-on-Year Growth
- 11.2.4 Incremental Revenue Opportunity
- 11.3 Forecast Assumptions and Scenario Analysis
- 11.3.1 Base-Case Forecast
- 11.3.2 Optimistic and Conservative Scenarios
- 11.3.3 Technology, Pricing and Policy Sensitivities
- 11.4 Market Attractiveness and Growth Outlook
Chapter 12 USA Hot Sauce Market Segmentation and Outlook
- 12.1 Segmentation Summary and Market Shares, 2025
- 12.2 Largest and Fastest-Growing Segments
- 12.3 By Product Type - Market Size and Forecast, 2025-2035
- 12.3.1 Segment Definition and Scope
- 12.3.2 Historical Market Size, 2018-2025
- 12.3.3 Revenue Forecast, 2025-2035
- 12.3.4 Volume Forecast, 2025-2035
- 12.3.5 Base-Year Market Share, 2025
- 12.3.6 Segment CAGR and Growth Drivers
- 12.3.7 Subsegment Market Size and Forecast
- 12.3.7.1 Cayenne and Vinegar Pepper Sauces
- 12.3.7.2 Sriracha and Asian Chili Sauces
- 12.3.7.3 Mexican-Style Pepper Sauces
- 12.3.7.4 Habanero and Superhot Sauces
- 12.3.7.5 Sweet Heat and Hybrid Sauces
- 12.3.8 Subsegment Pricing and Adoption Trends
- 12.3.9 Leading Suppliers and Competition
- 12.3.10 Regional Demand and Opportunities
- 12.4 By Customer Type - Market Size and Forecast, 2025-2035
- 12.4.1 Segment Definition and Scope
- 12.4.2 Historical Market Size, 2018-2025
- 12.4.3 Revenue Forecast, 2025-2035
- 12.4.4 Volume Forecast, 2025-2035
- 12.4.5 Base-Year Market Share, 2025
- 12.4.6 Segment CAGR and Growth Drivers
- 12.4.7 Subsegment Market Size and Forecast
- 12.4.7.1 Household Consumers
- 12.4.7.2 Foodservice Operators
- 12.4.7.3 Food Manufacturers
- 12.4.7.4 Institutional Buyers
- 12.4.8 Subsegment Pricing and Adoption Trends
- 12.4.9 Leading Suppliers and Competition
- 12.4.10 Regional Demand and Opportunities
- 12.5 By Packaging Format - Market Size and Forecast, 2025-2035
- 12.5.1 Segment Definition and Scope
- 12.5.2 Historical Market Size, 2018-2025
- 12.5.3 Revenue Forecast, 2025-2035
- 12.5.4 Volume Forecast, 2025-2035
- 12.5.5 Base-Year Market Share, 2025
- 12.5.6 Segment CAGR and Growth Drivers
- 12.5.7 Subsegment Market Size and Forecast
- 12.5.7.1 Glass Bottles
- 12.5.7.2 Plastic Squeeze Bottles
- 12.5.7.3 Single-Serve Packets
- 12.5.7.4 Bulk Jugs and Pails
- 12.5.7.5 Multi-Pack and Gift Sets
- 12.5.8 Subsegment Pricing and Adoption Trends
- 12.5.9 Leading Suppliers and Competition
- 12.5.10 Regional Demand and Opportunities
- 12.6 Segment Growth Comparison
- 12.7 Segment Attractiveness and Priority Matrix
Chapter 13 USA Hot Sauce End-Use and Application Market Outlook
- 13.1 End-Use Industry and Customer Demand Structure
- 13.2 Leading Applications and Customer Groups
- 13.3 End-Use Market Size, Share and Forecast
- 13.4 Major End-Use Industry Deep Dives
- 13.4.1 Customer Requirements and Use Cases
- 13.4.2 Demand and Replacement Cycles
- 13.4.3 Technical and Regulatory Considerations
- 13.4.4 Purchasing and Procurement Models
- 13.4.5 Leading Vendors and Distribution Channels
- 13.4.6 Forecast and Commercial Opportunities
- 13.5 Emerging Applications and Cross-Segment Demand
- 13.6 End-Use Industry Investment Priorities
Chapter 14 USA Hot Sauce Geographic Market Outlook, 2025-2035
- 14.1 Domestic Market Distribution and Demand Clusters
- 14.2 State- or Province-Wise Market Size and Forecast, 2025-2035
- 14.3 City and Metropolitan Market Outlook
- 14.4 Industrial, Manufacturing and Commercial Clusters
- 14.5 Geographic Concentration of Key End Users
- 14.6 Local Pricing and Purchasing Differences
- 14.7 Domestic Production Facilities and Capacity Map
- 14.8 Local Infrastructure and Project Pipeline
- 14.9 State-Level Policy and Incentive Differences
- 14.10 Subnational Investment Hotspots and Opportunities
- 14.11 Distribution and Logistics Networks
- 14.12 Domestic Competitive Footprint
Chapter 15 USA Hot Sauce Technology, Innovation and Sustainability Outlook
- 15.1 Technology Landscape and Maturity
- 15.2 Product, Process and Service Innovation
- 15.3 AI, Automation and Digital Tools in the Industry
- 15.4 Technology Adoption and Performance Benchmarking
- 15.5 Innovation Pipeline and R&D Investment
- 15.6 Patent and Intellectual Property Trends
- 15.7 Energy Efficiency and Resource Management
- 15.8 Sustainability, Recycling and Circularity
- 15.9 Technology Roadmap, 2025-2035
- 15.10 Risks of Obsolescence and Technology Substitution
Chapter 16 USA Hot Sauce Market Key Strategic Imperatives
- 16.1 Growth and Market Entry Priorities
- 16.2 High-Return Products and Segments
- 16.3 Pricing, Profitability and Cost Optimization
- 16.4 Technology Investment and Product Differentiation
- 16.5 Supply Chain Localization and Resilience
- 16.6 Distribution and Customer Acquisition
- 16.7 Partnership, Acquisition and Capacity Strategy
- 16.8 Regional Expansion Priorities
- 16.9 Short-, Medium- and Long-Term Actions
Chapter 17 Competition Outlook
- 17.1 Industry Competition Characteristics
- 17.2 Market Structure and Concentration
- 17.3 Market Share and Competitive Positioning, 2025
- 17.4 Company-Wise Revenue and Product Benchmarking
- 17.5 Production and Service Capacity Benchmarking
- 17.6 Technology, Pricing and Differentiation
- 17.7 Regional Footprint and Distribution Strength
- 17.8 Mergers, Acquisitions and Strategic Alliances
- 17.9 New Entrants and Competitive Threats
- 17.10 Porter's Five Forces and Industry Attractiveness
- 17.11 Competitive Outlook, 2025-2035
Chapter 18 Company Profiles
- 18.1 Company Coverage and Selection Criteria
- 18.2 McCormick & Company, Inc.
- 18.2.1 Business Description
- 18.2.2 Company Ownership and Geographic Presence
- 18.2.3 Product and Service Portfolio
- 18.2.4 Manufacturing and Operating Footprint
- 18.2.5 Production Capacity and Expansion Plans
- 18.2.6 Financial Performance and Investment
- 18.2.7 Market Share and Competitive Position
- 18.2.8 Technology and Innovation Capabilities
- 18.2.9 Strategic Alliances or Partnerships
- 18.2.10 Recent Developments
- 18.2.11 Growth Strategy and Outlook
- 18.3 McIlhenny Company
- 18.4 Huy Fong Foods, Inc.
- 18.5 T.W. Garner Food Company
- 18.6 Baumer Foods, Inc.
- 18.7 The Kraft Heinz Company
- 18.8 MegaMex Foods (Hormel Foods and Grupo Herdez joint venture)
- 18.9 Tapatío Foods, LLC (Highlander Partners)
- 18.10 Yellowbird Foods
- 18.11 Melinda's Foods
- 18.12 Other Relevant Market Participants
Note: Every listed company is profiled on the structure shown under the first company. The company list is preliminary and may change based on research findings, market developments, data availability and client requirements.
Chapter 19 Disclaimer
- 19.1 Research and Forecast Disclaimer
- 19.2 Data Source and Estimation Limitations
Note: The depth of individual sections depends on data availability for this market. Volume, capacity, trade and other unit-based metrics are included where applicable.

