
Record harvests and free grain anchor Indian rice demand
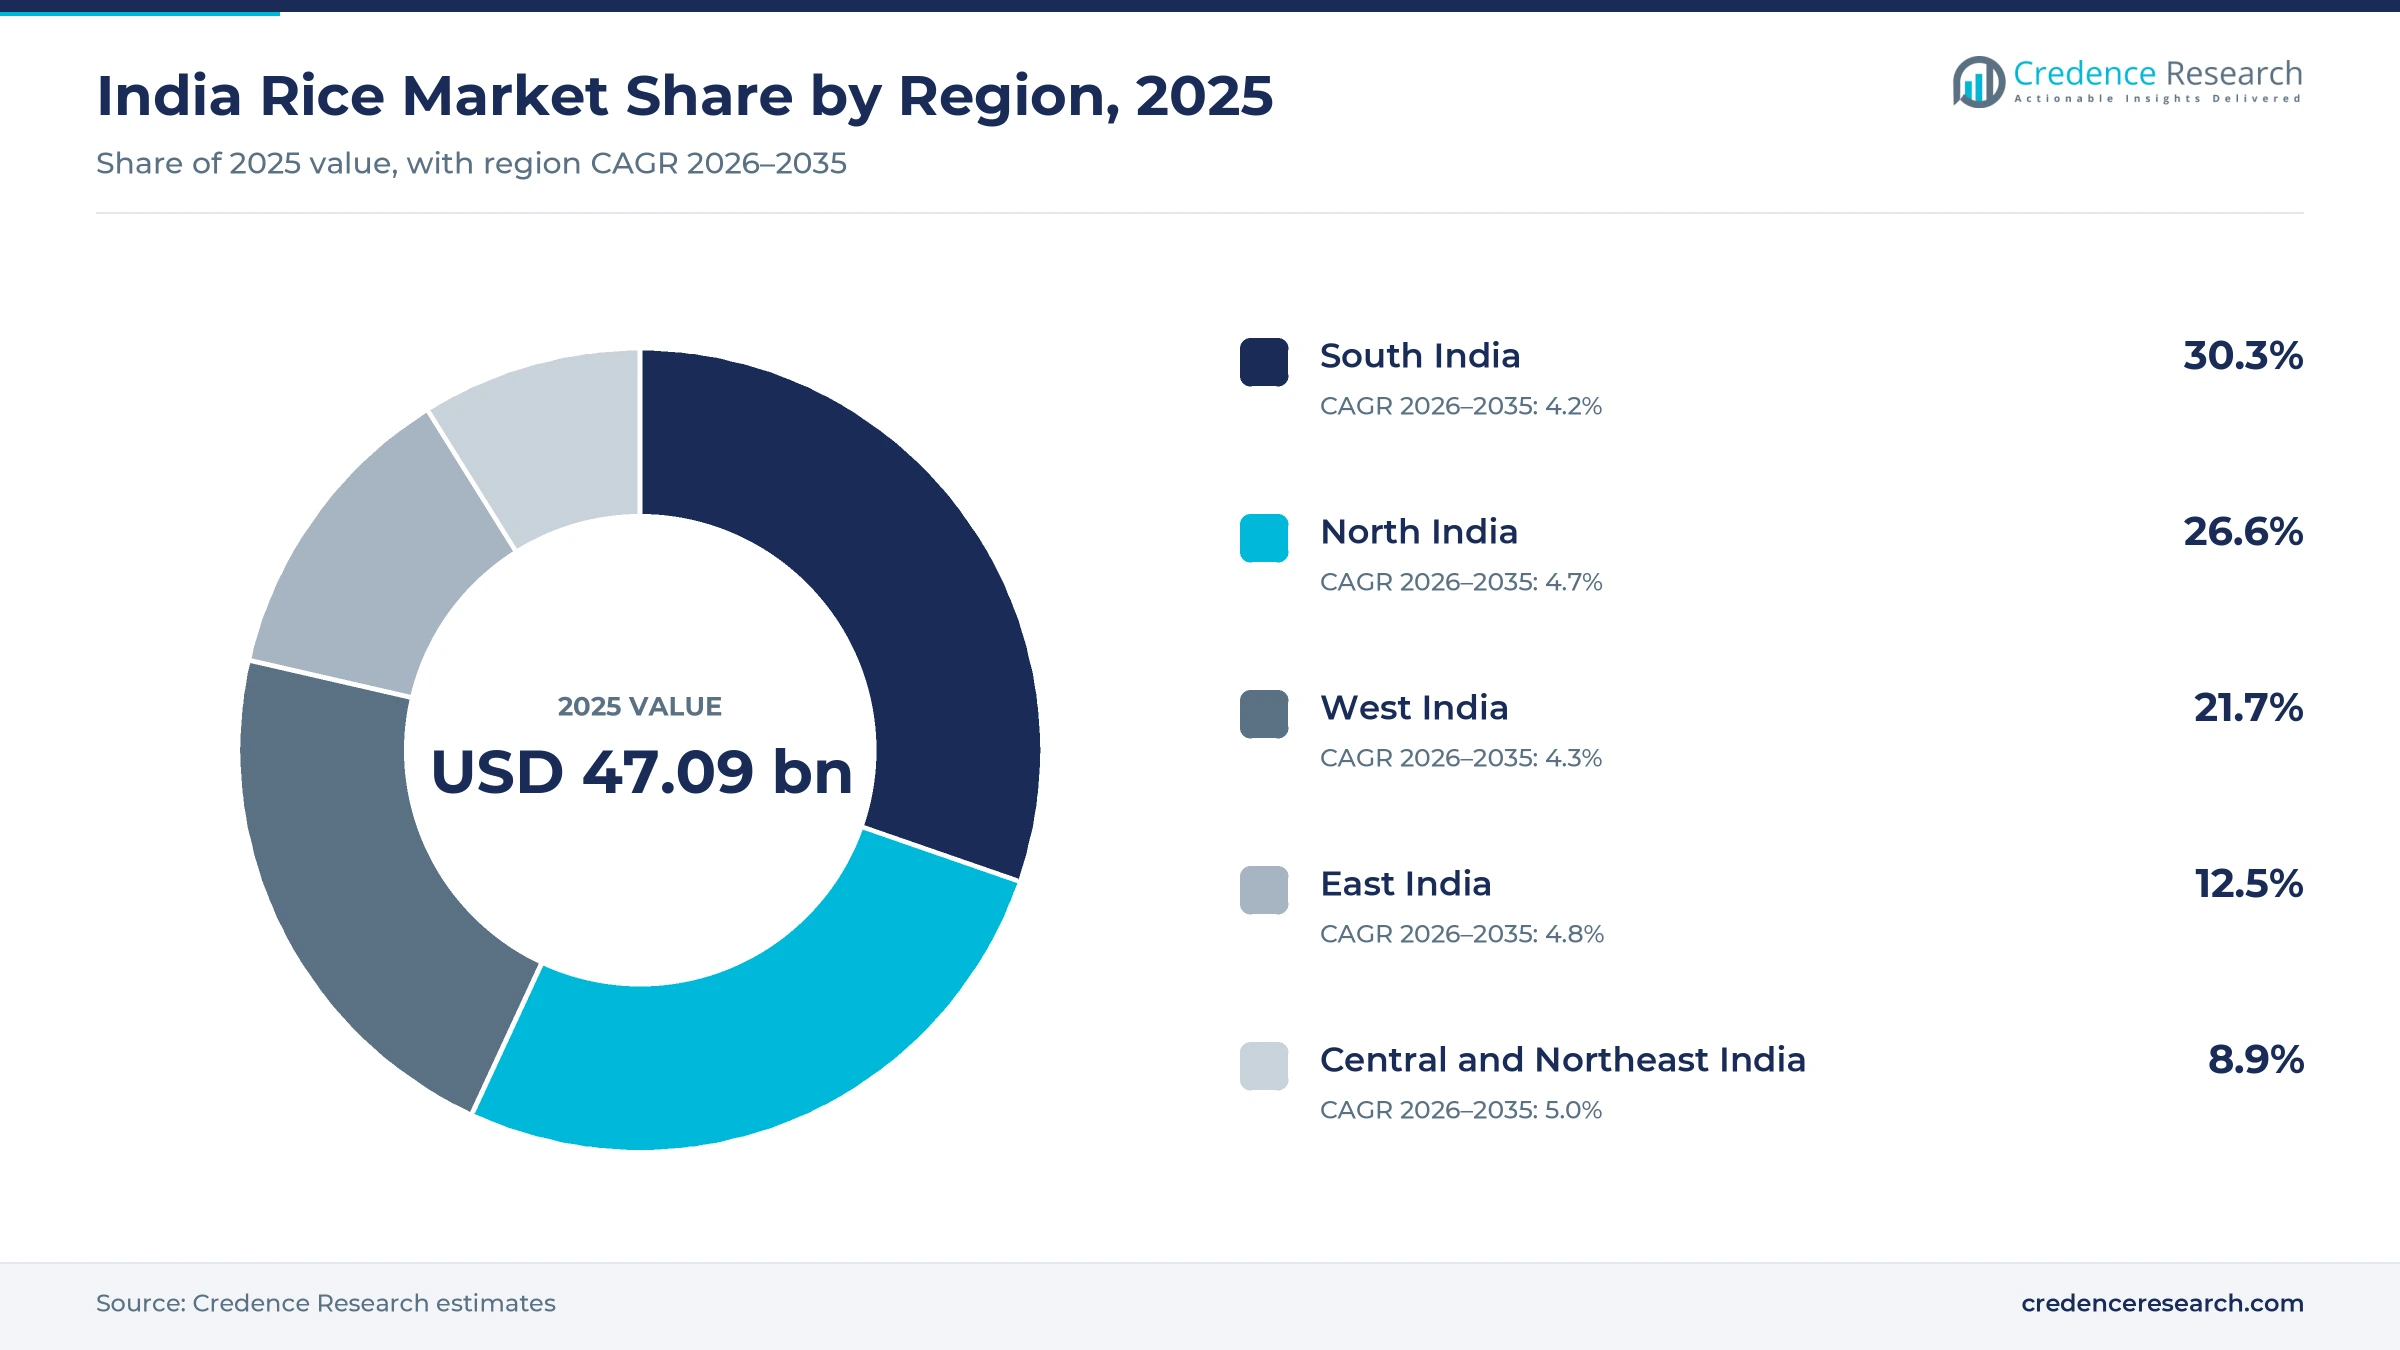
The India rice market was valued at USD 47.09 billion in 2025 and is projected to increase from USD 49.32 billion in 2026 to USD 73.11 billion by 2035, registering a CAGR of 4.47% during 2026–2035. Demand rests on rice as the daily staple for most Indian households, on state food programs that hand out free grain every month, and on mills that ship to buyers in West Asia, Africa and Southeast Asia. South India held the largest regional share, 30.3% in 2025, because rice is eaten at almost every meal in the southern states and Telangana is one of the largest growing states. Central and Northeast India is the fastest-growing region at 5.0% a year, as branded packs and fortified grain reach smaller towns. On the trade side, the government moved broken rice exports from prohibited to free on March 7, 2025, which reopened a low-price outlet for millers.
Which grains, mills and buyers does the estimate cover?
The estimate measures the value of milled basmati, non-basmati white, parboiled, brown and broken rice produced or sold in India, at the first point of sale from mills and packers. It covers loose and branded rice sold to households, hotels, food makers and government programs, together with rice shipped abroad by Indian exporters.
The estimate excludes paddy that farmers keep for their own use, rice bran and husk, and processed foods such as flakes or ready meals. The value chain runs from paddy growers and procurement agencies through millers, sorters and packers to wholesalers, retailers, exporters and the households that cook each kilogram.
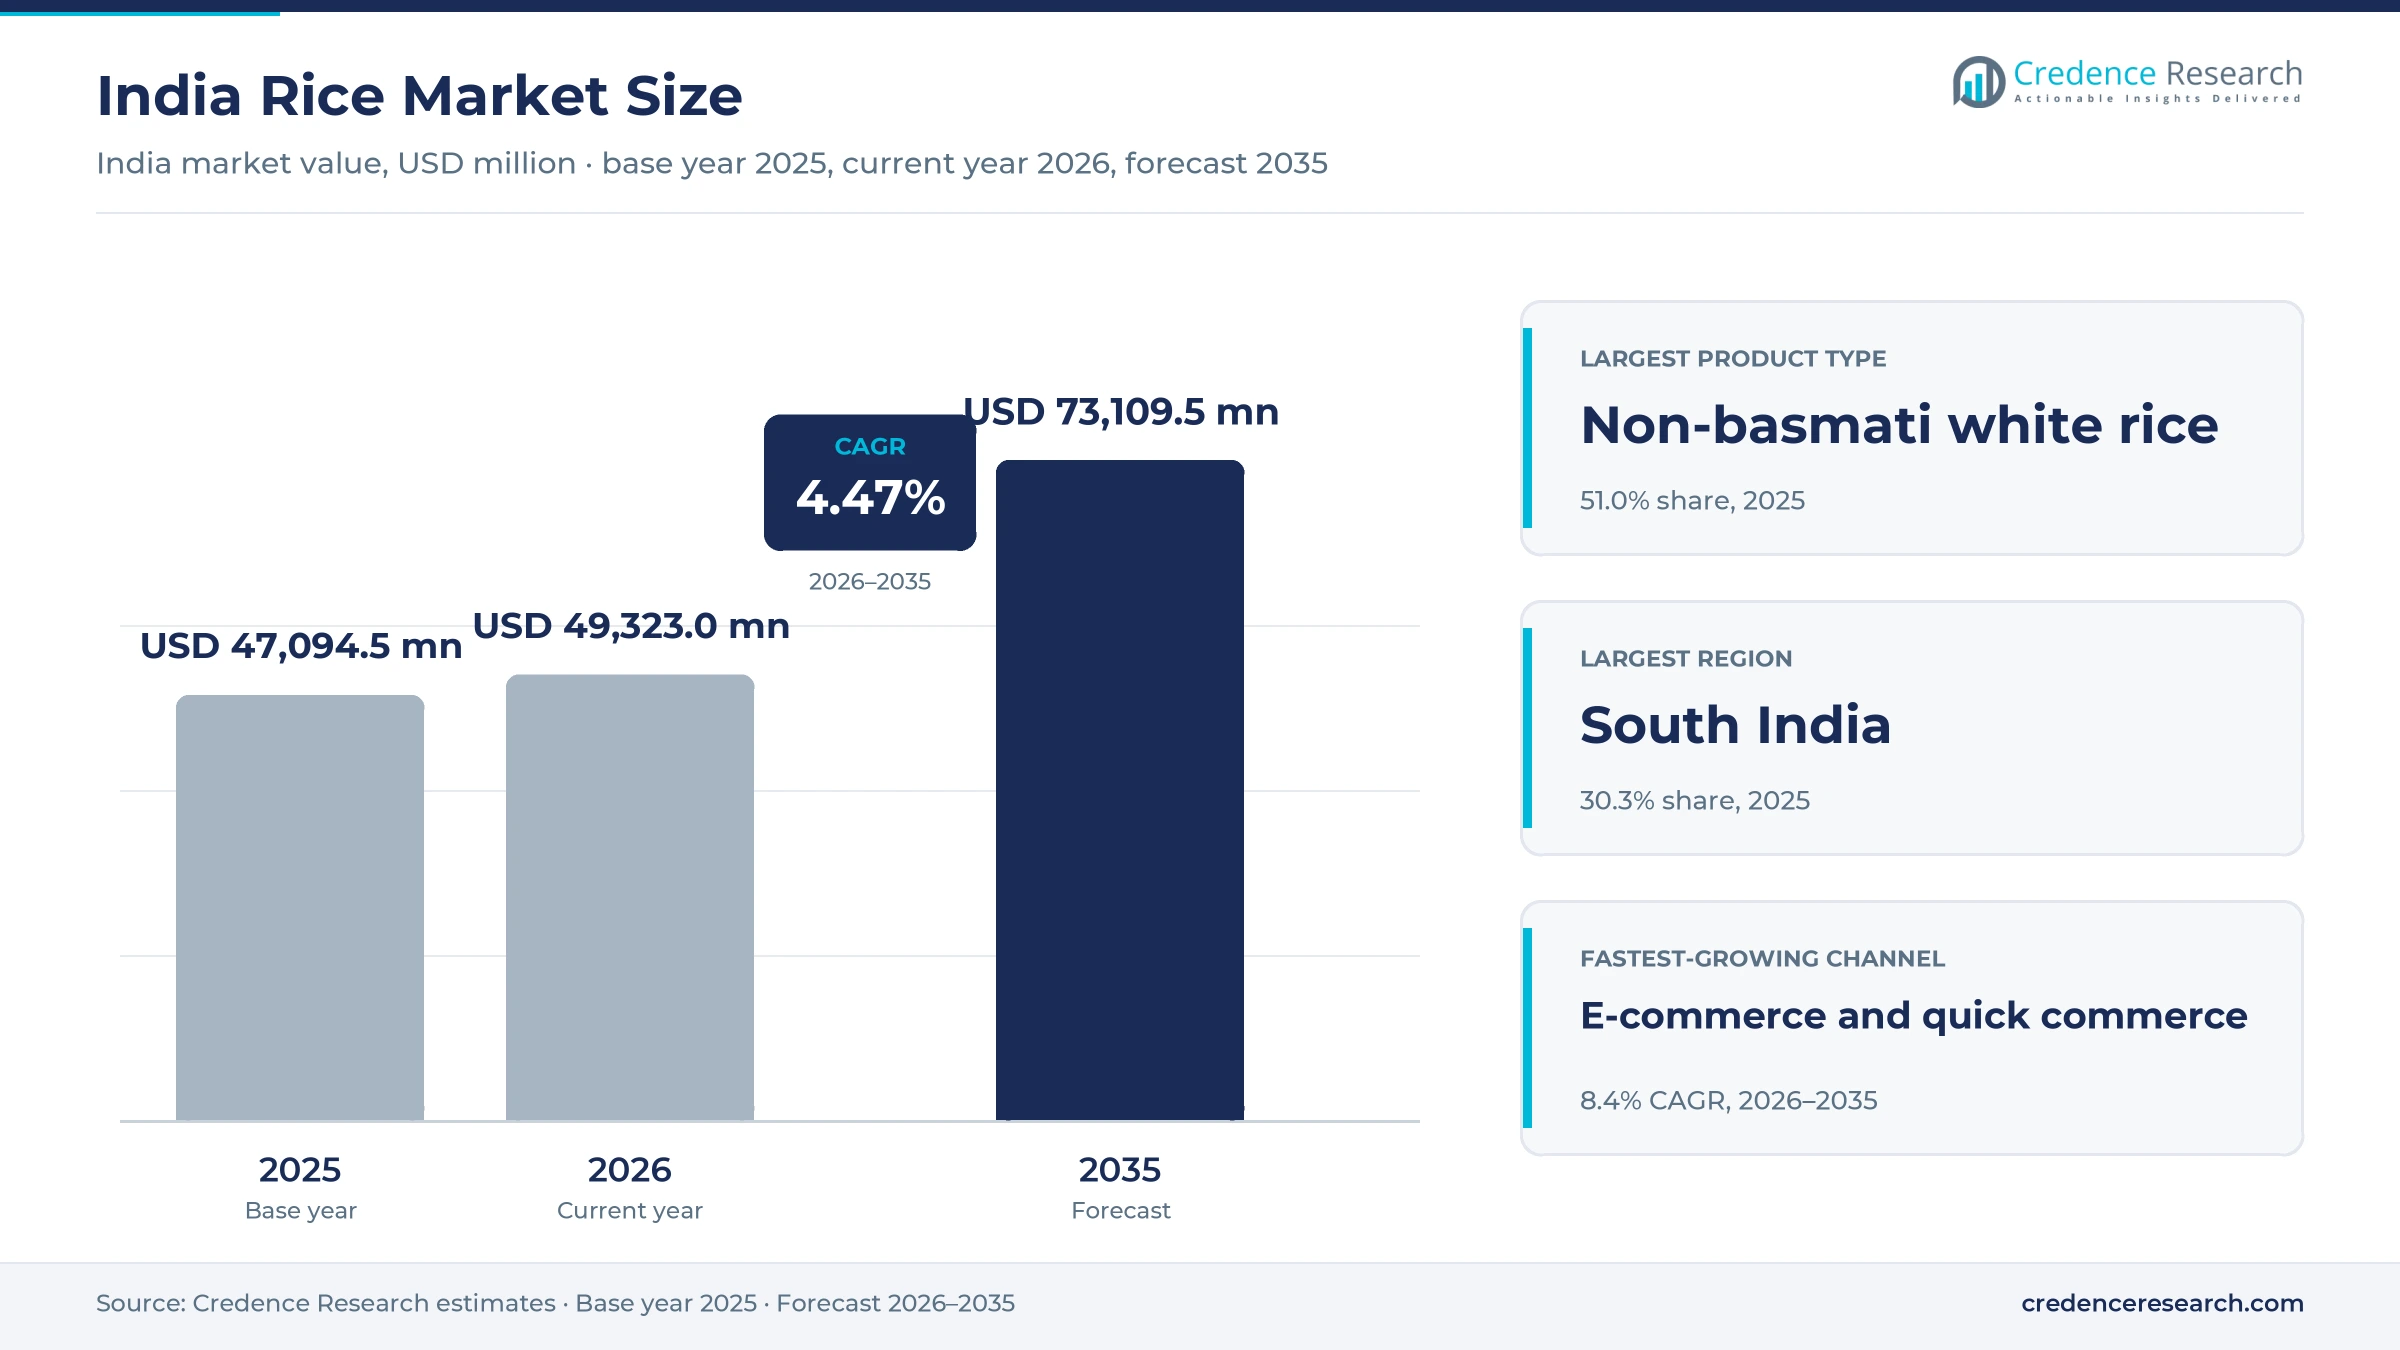
India Rice Market Insights
- The India rice market was valued at USD 47.09 billion in 2025 and is projected to reach USD 73.11 billion by 2035, registering a CAGR of 4.47% during 2026–2035.
- South India held a 30.3% share of 2025 value, because rice is the main cereal at most meals in the southern states.
- Non-basmati white rice led with a 51.0% share of 2025 value, because it fills ration shops, kirana sacks and most export orders.
- India produced a record 150.18 million metric tons of rice in 2024-25, up from 137.82 million metric tons a year earlier, according to final government estimates.
- E-commerce and quick commerce grows fastest at 8.4% a year during 2026–2035, as city shoppers buy branded rice packs online.
Non-basmati grain leads while basmati and blending gain
Why does non-basmati grain carry most of the value?
Based on product type, the market is categorized into basmati rice, non-basmati white rice, parboiled rice, brown and unpolished rice, and broken rice. Non-Basmati White Rice led with a 51.0% share of 2025 value, because it is the grain handed out under state food schemes and sold loose in most neighborhood shops. Non-basmati shipments also reached 14.1 million metric tons in 2024-25, according to APEDA data. Basmati Rice grows fastest at 5.6% a year, as basmati export volume hit a record of about 6 million metric tons that year and Gulf buyers kept paying more for long-grain aromatic rice.
How fast is fortified blending spreading through mills?
Based on technology, the market is categorized into conventional milling, modern automated milling, sortex and optical grading, and fortified rice blending. Conventional Milling led with a 47.0% share of 2025 value, because thousands of small custom mills still process the paddy that procurement agencies buy each season. The food ministry said in October 2024 that 21,000 of about 30,000 operating mills had installed blending equipment. Fortified Rice Blending grows fastest at 6.0% a year, as the Union Cabinet approved fortified rice supply under welfare schemes until December 2028 at a cost of Rs 17,082 crore.
How do subsidized and premium packs split spending?
Based on price tier, the market is categorized into economy rice, mainstream rice, premium rice and super-premium and specialty rice. Economy Rice led with a 40.0% share of 2025 value, because low-income households buy most of their rice at the lowest price available. The government began the second phase of subsidized Bharat rice sales in 5 kg and 10 kg bags on Nov. 5, 2024, which sets a visible price ceiling for the tier. Super-Premium and Specialty Rice grows fastest at 6.2% a year, as India has about 30 GI-tagged rice varieties and APEDA planned to show 10 to 15 of them at Gulfood 2026, its chairman told S&P Global.
How do kirana sacks and online packs compare?
Based on distribution channel, the market is categorized into traditional retail, modern grocery retail, e-commerce and quick commerce, foodservice and institutional supply, and export distribution. Traditional Retail led with a 43.0% share of 2025 value, because most households still buy loose rice or 25 kg sacks from neighborhood shops and wholesale markets. E-Commerce and Quick Commerce grows fastest at 8.4% a year, as AWL Agri Business said in January 2026 that e-commerce was among its fastest-growing channels for rice and flour.
| Segment Group | Leading Sub-segment | Share, 2025 | Fastest-growing Sub-segment | CAGR, 2026–2035 |
|---|---|---|---|---|
| By Product Type | Non-Basmati White Rice | 51.0% | Basmati Rice | 5.6% |
| By Technology | Conventional Milling | 47.0% | Fortified Rice Blending | 6.0% |
| By Price Tier | Economy Rice | 40.0% | Super-Premium and Specialty Rice | 6.2% |
| By Distribution Channel | Traditional Retail | 43.0% | E-Commerce and Quick Commerce | 8.4% |
State reserve prices and export premiums frame rice pricing
Rice prices in India sit on a floor set by the state. The minimum support price for common paddy rose by Rs 69 to Rs 2,369 per quintal for 2025-26, so millers pay more for raw grain each season. At the low end, Bharat rice and the FCI reserve price cap what economy brands can charge, while open-market prices drift up with food inflation. Basmati is priced off export demand instead, and Indian basmati fetched about twice the unit value of non-basmati grain in 2024-25. Millers with a basmati and branded mix can protect margins, while those selling common grain mostly compete on milling cost and recovery rates.
| Offer or segment | Typical price or fee | Basis |
|---|---|---|
| FCI reserve price for states and ethanol makers | Rs 2,250 per quintal (Rs 22.5 per kg) | Ministry of Consumer Affairs, Food and Public Distribution, January 2025 |
| Bharat rice retail pack | Rs 34 per kg in 5 kg and 10 kg bags | Ministry of Consumer Affairs, Food and Public Distribution, November 2024 |
| Average retail price of rice | Rs 47.21 per kg, up from about Rs 43.14 a year earlier | Department of Consumer Affairs, October 2026 |
| Non-basmati exports, average unit value | About USD 460 per metric ton | Credence Research estimate from APEDA 2024-25 value and volume |
| Basmati exports, average unit value | About USD 990 per metric ton | Credence Research estimate from APEDA 2024-25 value and volume |
Request a Free Sample
Fill in your details and we'll send you a free sample report.
- Sample data tables & charts
- Research methodology
Staple demand, record crops and exports carry growth
How does staple demand and free grain keep volumes high?
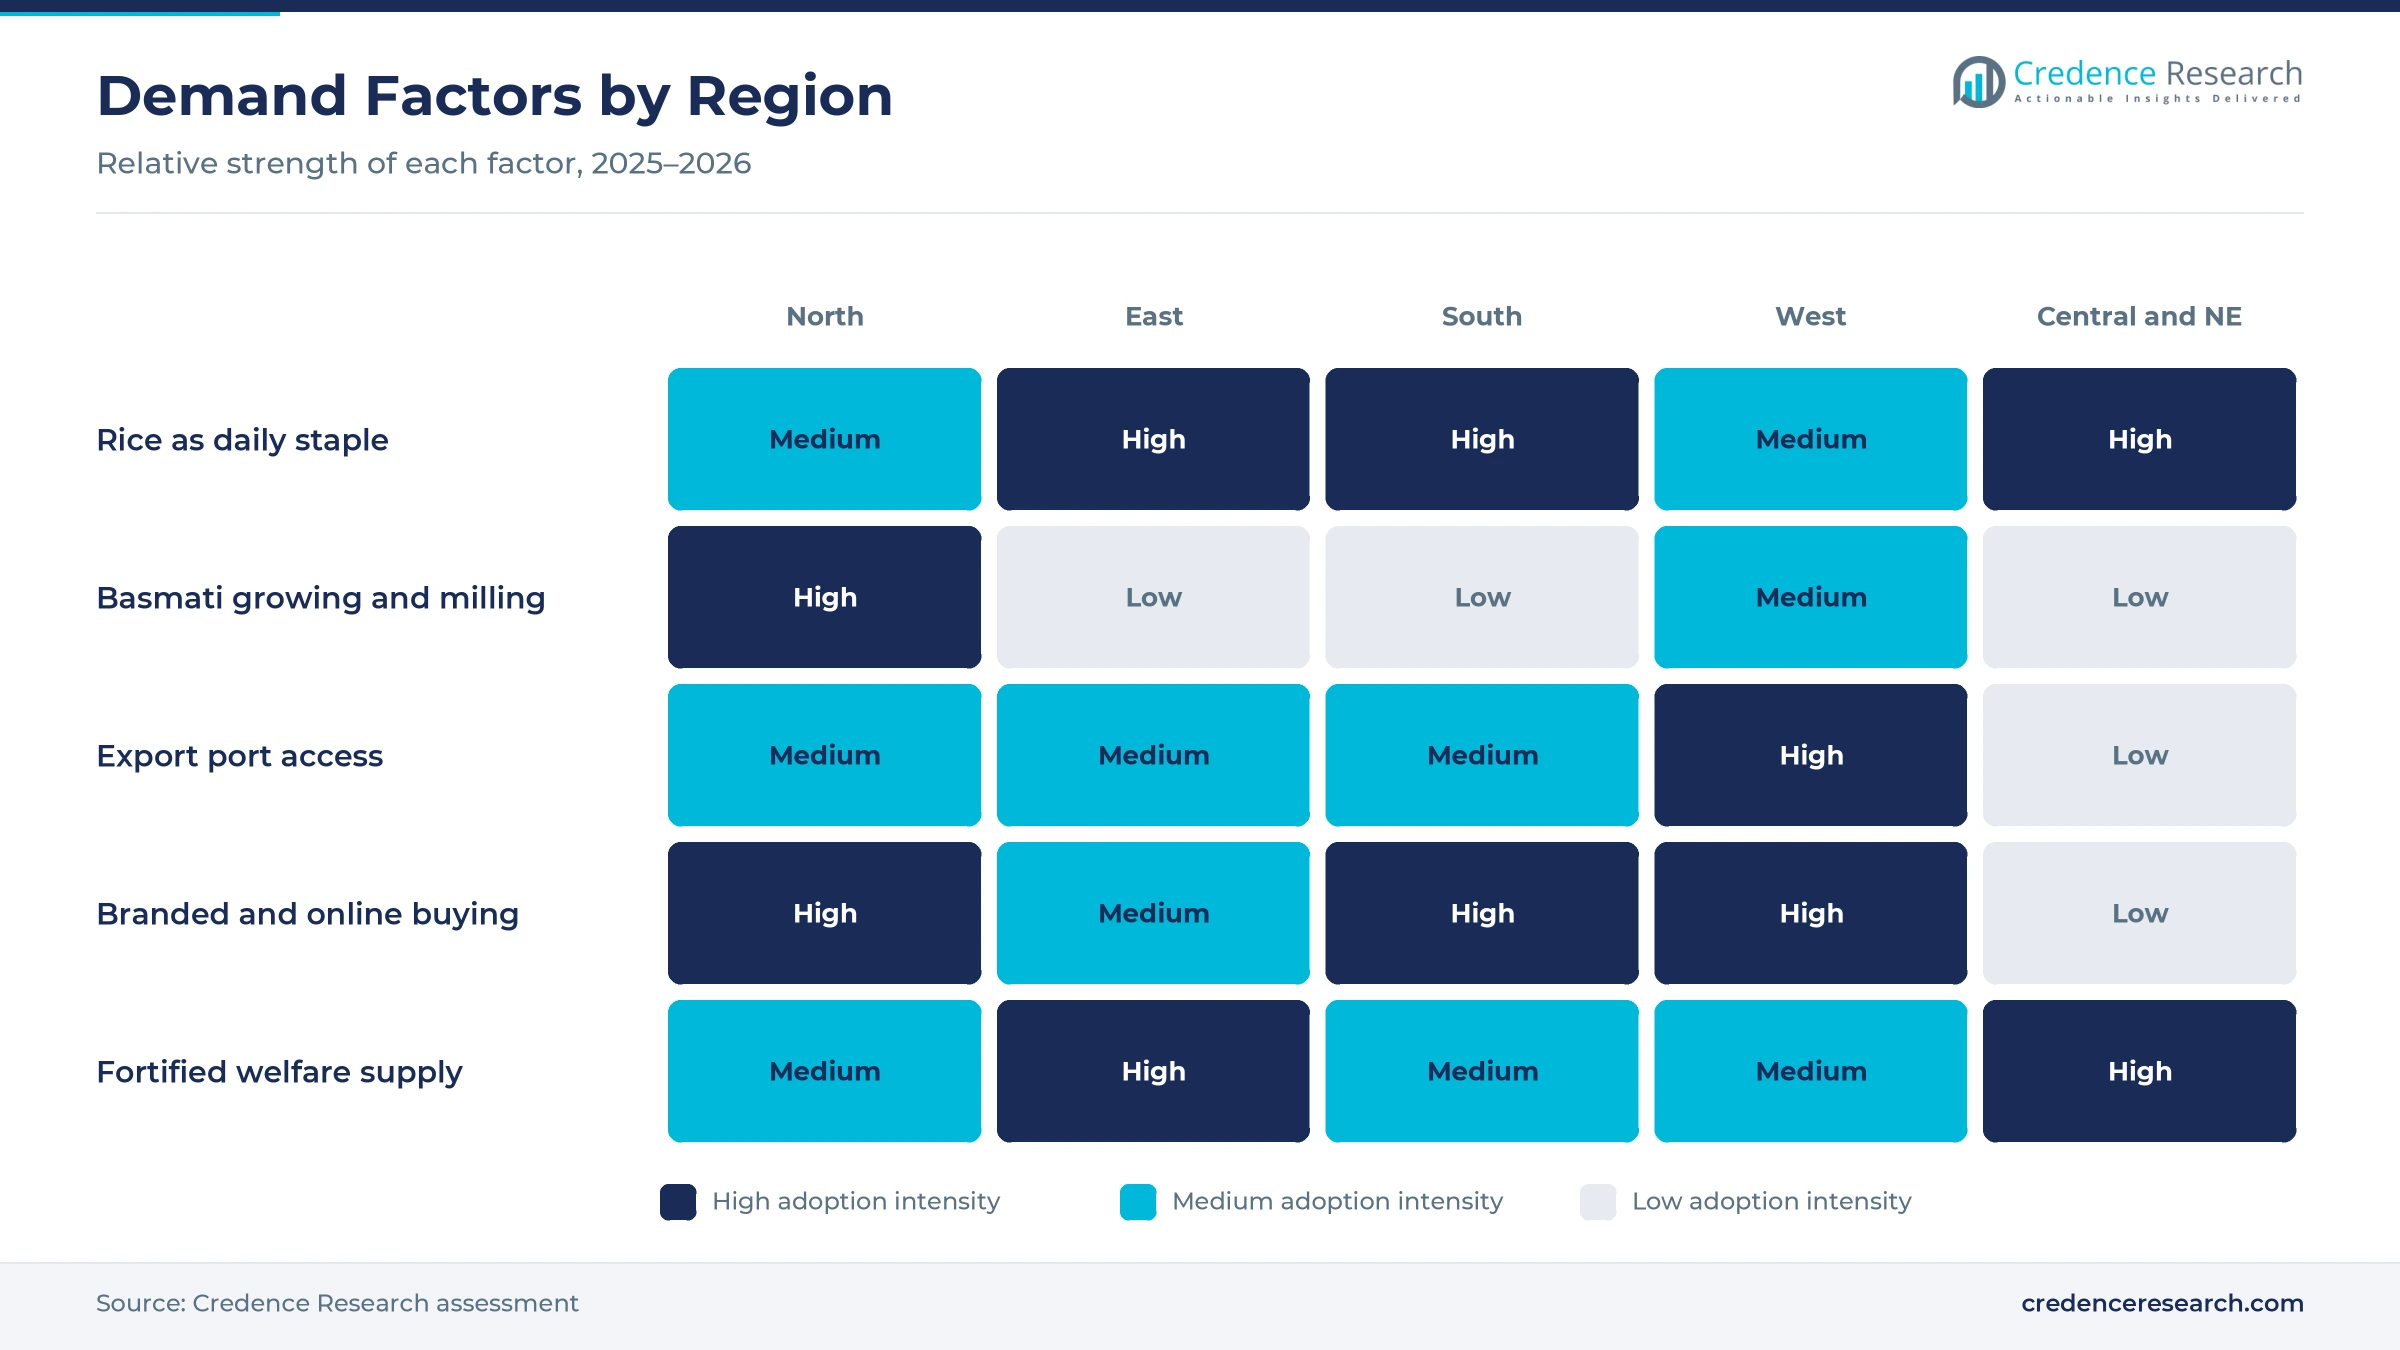
Rice is eaten every day by most Indian households, so large and recurring staple-food demand changes little with income or price. India consumes about 105 million to 110 million metric tons of rice a year, KRBL said in November 2024, of which only about 4 million metric tons is basmati. The government also decided to give free foodgrains to about 81.35 crore people for five years from Jan. 1, 2024, at a cost of about Rs 11.80 lakh crore, according to the Press Information Bureau. Average retail prices still rose to Rs 47.21 a kilogram by October 2026, which shows paying demand outside the ration system. Economy rice keeps 40.0% of 2025 value, because these buyers trade up slowly.
Why do record harvests and full warehouses support milling?
Ample paddy is the base of the market, since record production and milling throughput keep plants running and hold raw grain costs in check. India produced a record 150.18 million metric tons of rice in 2024-25, according to final estimates reported by Outlook Business. Central pool stocks stood at 33.59 million metric tons in November 2025, more than three times the official buffer norm. The government cut the FCI rice price for states and distilleries to Rs 2,250 per quintal in January 2025 to move this surplus. Mills that invest in milling and sorting machinery gain the most from steady paddy arrivals.
How do exports and basmati premiums add value?
Basmati buyers abroad pay far more per metric ton than buyers of common grain, which makes export scale and premium basmati monetization a key source of value. India shipped 20.19 million metric tons of rice worth USD 12.47 billion in 2024-25, with basmati worth USD 5.94 billion, according to APEDA figures cited by S&P Global. The minimum export price on basmati, set at USD 1,200 a metric ton in August 2023, was removed in mid-September 2024. Basmati rice grows at 5.6% a year, the fastest product type, because aged long grain earns more per metric ton than common rice.
Why does mandatory fortification create a new value layer?
Every kilogram of welfare rice must now be blended with iron, folic acid and vitamin B12 kernels, so mandatory fortification adds a new layer of value for mills. The Union Cabinet approved the supply of rice blended with fortified kernels under all welfare schemes from July 2024 to December 2028, fully funded by the central government. The food ministry reported in October 2024 a blending capacity of 22.3 million metric tons a month. It also counted 1,023 kernel makers with 11 million metric tons of yearly capacity, against 5.2 million metric tons needed. Fortified rice blending grows at 6.0% a year, the fastest technology during 2026–2035.
Branded packs, health claims and new buyers reshape supply
How is the shift to branded and online rice changing buying?
City shoppers increasingly want sealed packs and consistent grain instead of loose sacks, a shift toward branded and online rice that changes how households buy. AWL Agri Business said in January 2026 that its branded domestic rice grew at a strong double-digit rate even as its total rice volume fell slightly in the December 2025 quarter. Chaman Lal Setia is expanding its Maharani and Begum brands through Amazon and BigBasket, according to a CRISIL rating note of August 2025. Lal Qilla basmati from Amar Singh Chawal Wala is listed on quick commerce apps such as Zepto. Branded packs bought through online grocery apps carry higher prices per kilogram, which lifts value faster than volume.
Why is the rise of health-led specialty grain significant?
Diabetic and weight-conscious buyers will pay more for rice with clear health claims, and brands are building specialty lines to serve them. GRM Overseas launched 10X basmati for diabetics with a low glycemic index in April 2026, made at three units with a combined 440,800 metric tons of yearly capacity. Brown and unpolished rice also gains from the same interest in fiber and whole grain. Specialty packs usually sell in smaller sizes at higher prices per kilogram, which suits urban shoppers who order online. Brands that can back health claims with test data should hold their premium longer than rivals. Super-premium and specialty rice grows at 6.2% a year, the fastest price tier during 2026–2035.
Can surplus grain open new export markets for millers?
India has more rice than it needs, and importers want low-cost supply, so surplus stocks can win new buyers abroad for Indian mills. India already supplies about 38% of global rice exports and ships to more than 172 countries, ThePrint reported in November 2025. Shipments rose 23.4% in 2024-25 once the earlier curbs on some non-basmati grades were lifted. APEDA plans trade delegations to the Philippines and China and is working with Enterprise Singapore, its chairman told S&P Global in January 2026. New destinations also reduce dependence on a few large Gulf and African buyers. Millers with export licenses and port warehouses gain the most from these new buyers.
Is southern sourcing an opening for national brands?
South India eats the most rice yet prefers regional grains such as Sona Masoori and Kolam, which gives national brands an opening to source closer to buyers. LT Foods announced in January 2026 a plant at Raichur, Karnataka, with initial capacity of 30,000 metric tons a year and an investment of Rs 6 crore. Southern shoppers tend to stay loyal to a grain type more than to a brand, so national firms must match local taste and price. Regional mills also sell husk and bran to makers of bran oil, which adds income per metric ton. Brands that mill near southern growers cut freight and win loyal buyers.
Price swings, cheap state rice and thin margins weigh
How do basmati price swings strain buyers and exporters?
Gulf demand can change within weeks, and those swings strain basmati buyers and exporters alike. Prices paid to basmati growers in Punjab and Haryana jumped about 53% to roughly Rs 42 a kilogram in October 2026, according to ThePrint, as Gulf importers built reserves. About 4 lakh metric tons of basmati was stuck in transit or at ports in March 2026 after shipping disruptions near the Strait of Hormuz. Exporters with long-term contracts lose margin, and domestic premium brands must raise shelf prices or shrink packs.
Why do low world prices and big stocks squeeze margins?
Indian mills compete with Thai and Vietnamese grain in a falling market, so low world prices and big stocks erode export margins. The FAO All Rice Price Index averaged 98.4 points in October 2025, its lowest level since December 2021, according to the Food and Agriculture Organization. The index averaged 23% less in January to October 2025 than a year earlier. Common-grain exporters feel this most, so many push into parboiled, broken and branded lines that hold value better.
How does subsidized state rice cap economy-brand pricing?
Shoppers can compare branded packs with grain sold by the government, which limits what economy brands can charge. Bharat rice sells through NAFED, NCCF and Kendriya Bhandar outlets at the subsidized price noted above. In January 2025 the food ministry also let state bodies buy up to 12 lakh metric tons of FCI rice at the reserve price without joining e-auctions. Private economy brands cannot price far above these levels without losing volume. Millers respond with better sorting and packaging, which lets them justify a small premium.
Why do rising paddy costs pressure common-grain millers?
The support price climbs each season while selling prices face state competition, leaving common-grain millers squeezed between paddy costs and shelf prices. The Union Cabinet raised the paddy support price for 2025-26 on May 28, 2025, adding Rs 69 per quintal for both common and Grade A paddy. Grain recovery, power and labor costs add to the squeeze for small mills with old equipment. Larger millers with optical sorters and by-product sales cope better than small rural units.
Southern and northern zones hold over half of value
The India rice market is split into five zones, and their 2025 shares follow the Credence Research regional model. Regional growth rates are Credence Research estimates based on state rice output, mill and port locations, and the reach of branded packs.
| Region | Value, 2025 (USD billion) | Share, 2025 | CAGR, 2026–2035 |
|---|---|---|---|
| South India | 14.27 | 30.3% | 4.2% |
| North India | 12.53 | 26.6% | 4.7% |
| West India | 10.22 | 21.7% | 4.3% |
| East India | 5.89 | 12.5% | 4.8% |
| Central and Northeast India | 4.19 | 8.9% | 5.0% |
Why does South India buy the most rice?
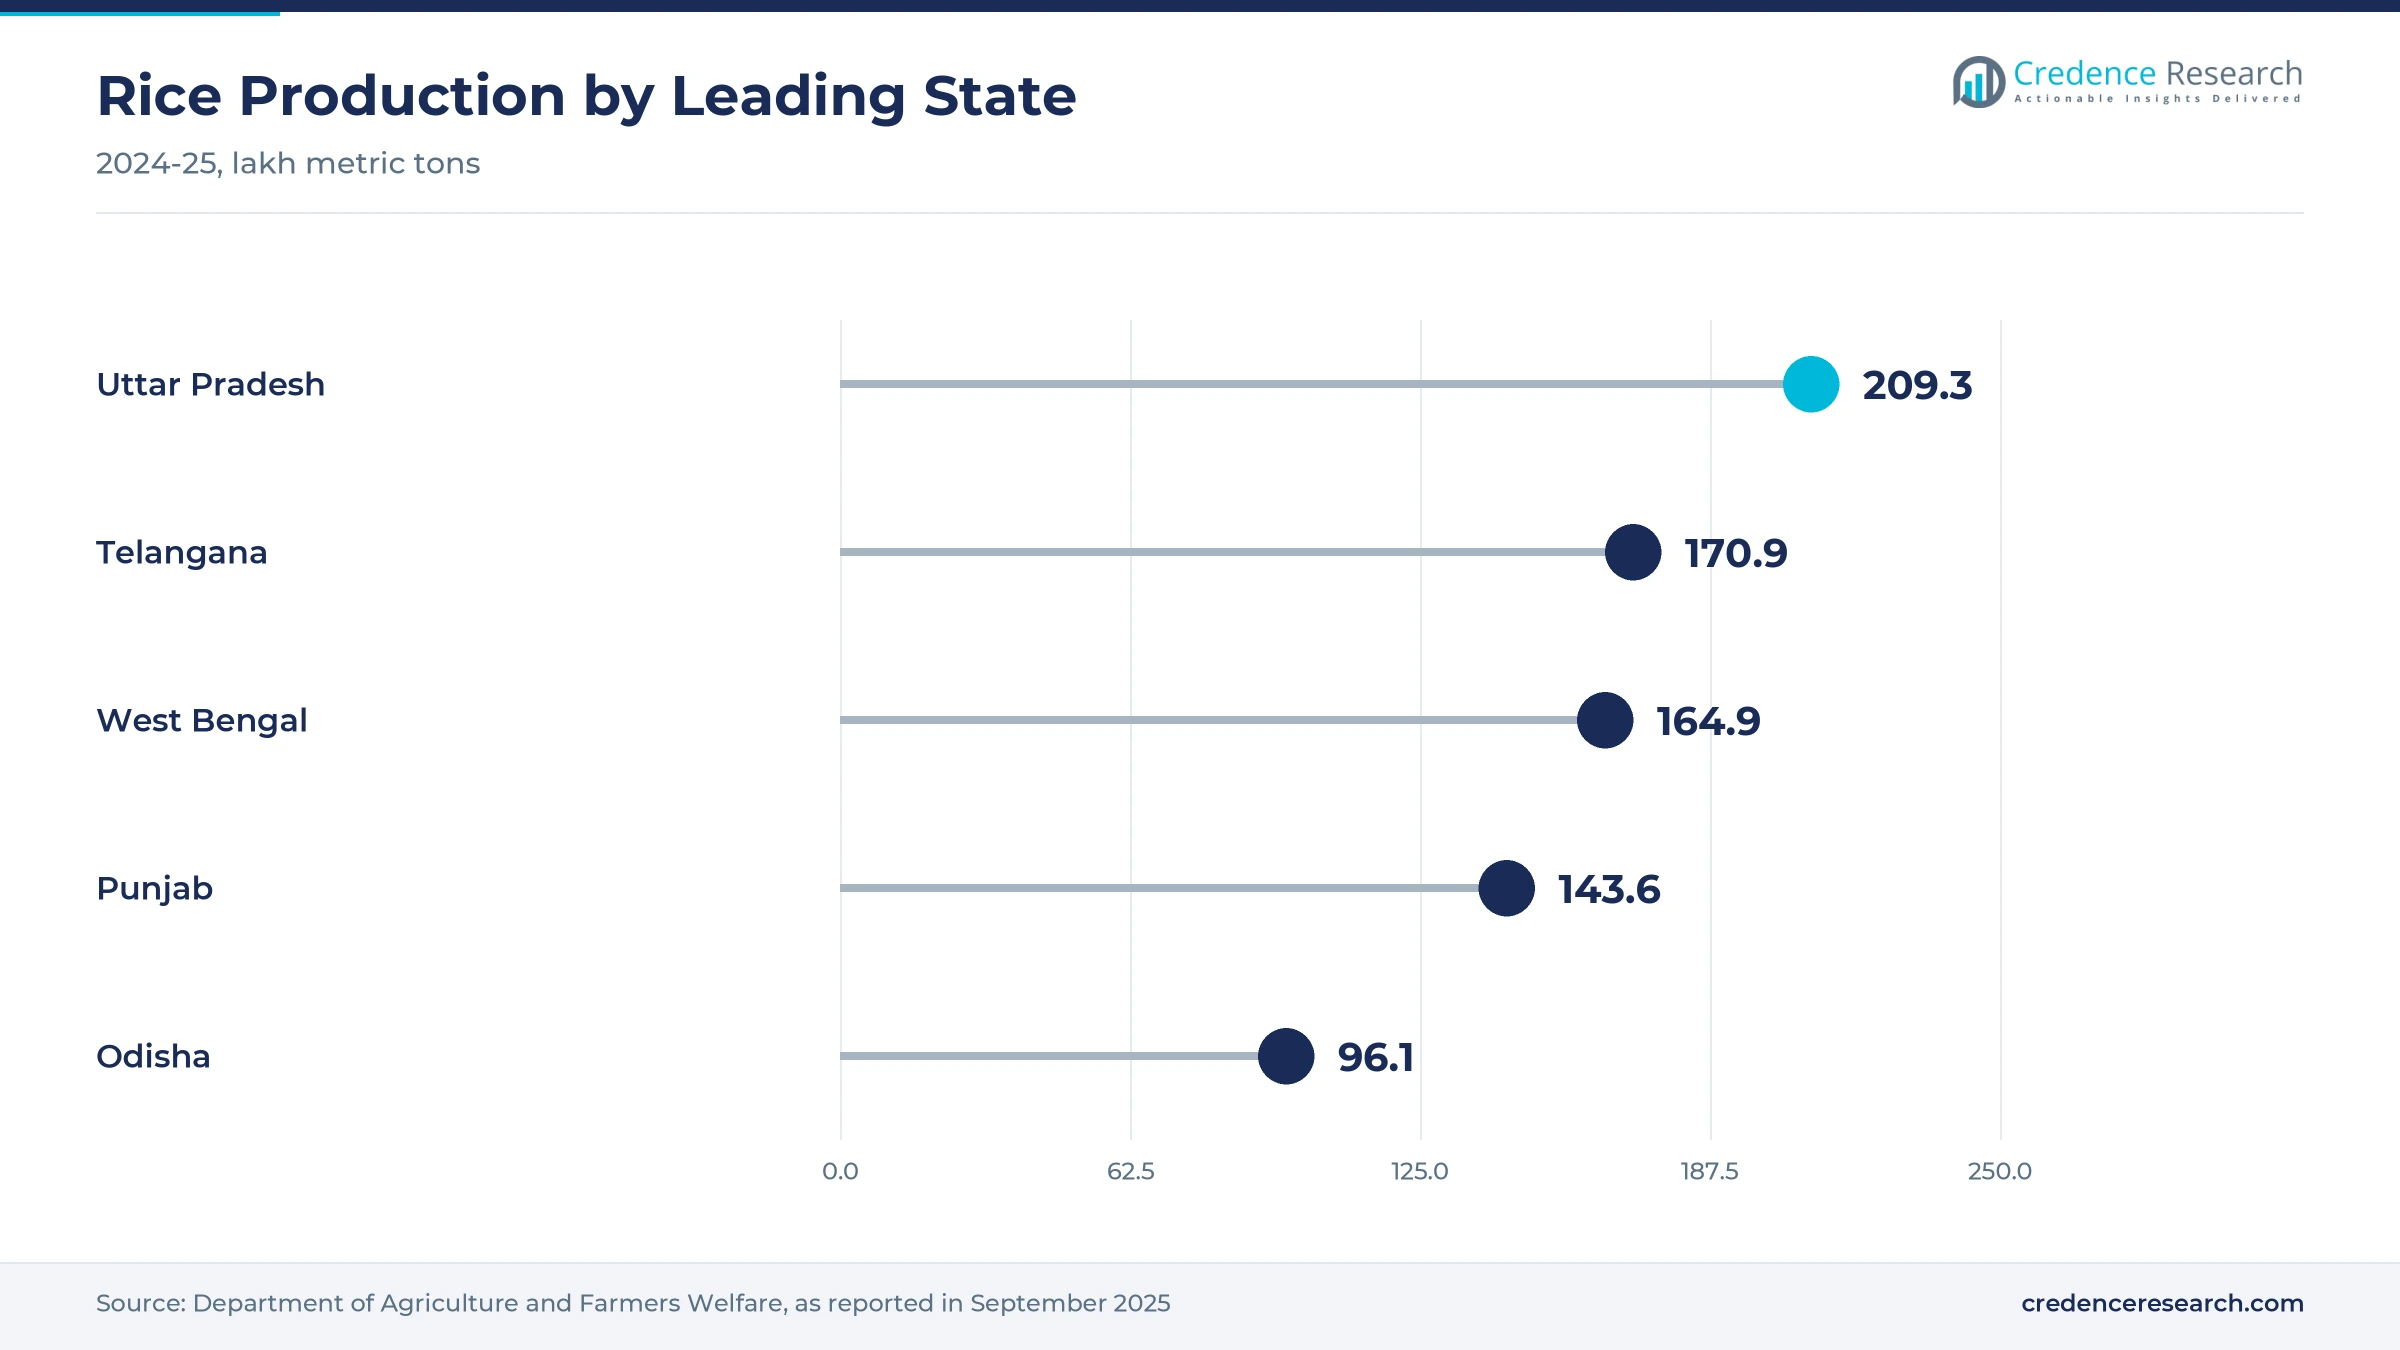
South India held a 30.3% share of 2025 value and grows at 4.2% a year, because rice is eaten at most meals across Tamil Nadu, Andhra Pradesh, Telangana, Karnataka and Kerala. Telangana produced 170.94 lakh metric tons of rice in 2024-25, second only to Uttar Pradesh, according to Agriculture Ministry data. That harvest keeps local mills busy with Sona Masoori and other regional grains. The zone grows a little slower than the national rate because per capita use is already high.
How do northern basmati belts lift regional value?
North India held a 26.6% share of 2025 value and grows at 4.7% a year, because Punjab, Haryana and Uttar Pradesh grow basmati and supply much of the export trade. Uttar Pradesh produced 209.31 lakh metric tons and Punjab 143.61 lakh metric tons of rice in 2024-25. KRBL runs a large integrated plant at Dhuri in Punjab, and Ebro India has capacity to mill about 125,000 metric tons of basmati a year at Karnal in Haryana. Sarveshwar Foods won approval for a Rs 197.29 crore basmati cluster project in Jammu and Kashmir in December 2025.
How do West India ports support exporters?
West India held a 21.7% share of 2025 value and grows at 4.3% a year, because Gujarat ports serve exporters and Mumbai and Ahmedabad are big consumer markets. GRM Overseas runs a processing unit at Gandhidham in Gujarat with a 1.75 lakh square foot warehouse that ships through Kandla and Mundra. Branded packs also sell well in western cities, where modern grocery stores are common.
Why does East India remain a major growing zone?
East India held a 12.5% share of 2025 value and grows at 4.8% a year, because West Bengal and Odisha are among the largest rice-growing states and rice is the main staple. West Bengal produced 164.91 lakh metric tons and Odisha 96.14 lakh metric tons in 2024-25. Parboiled rice is common in the zone, and many local mills supply it to both homes and state programs.
Why are central and northeastern states growing fastest?
Central and Northeast India held 8.9% of 2025 value and grows fastest at 5.0% a year, because branded packs and fortified grain are reaching towns that once relied on loose local rice. Welfare schemes deliver fortified rice in every state, which lifts blending and packing work in this zone. The base is small, so modest gains in branded sales raise its share.
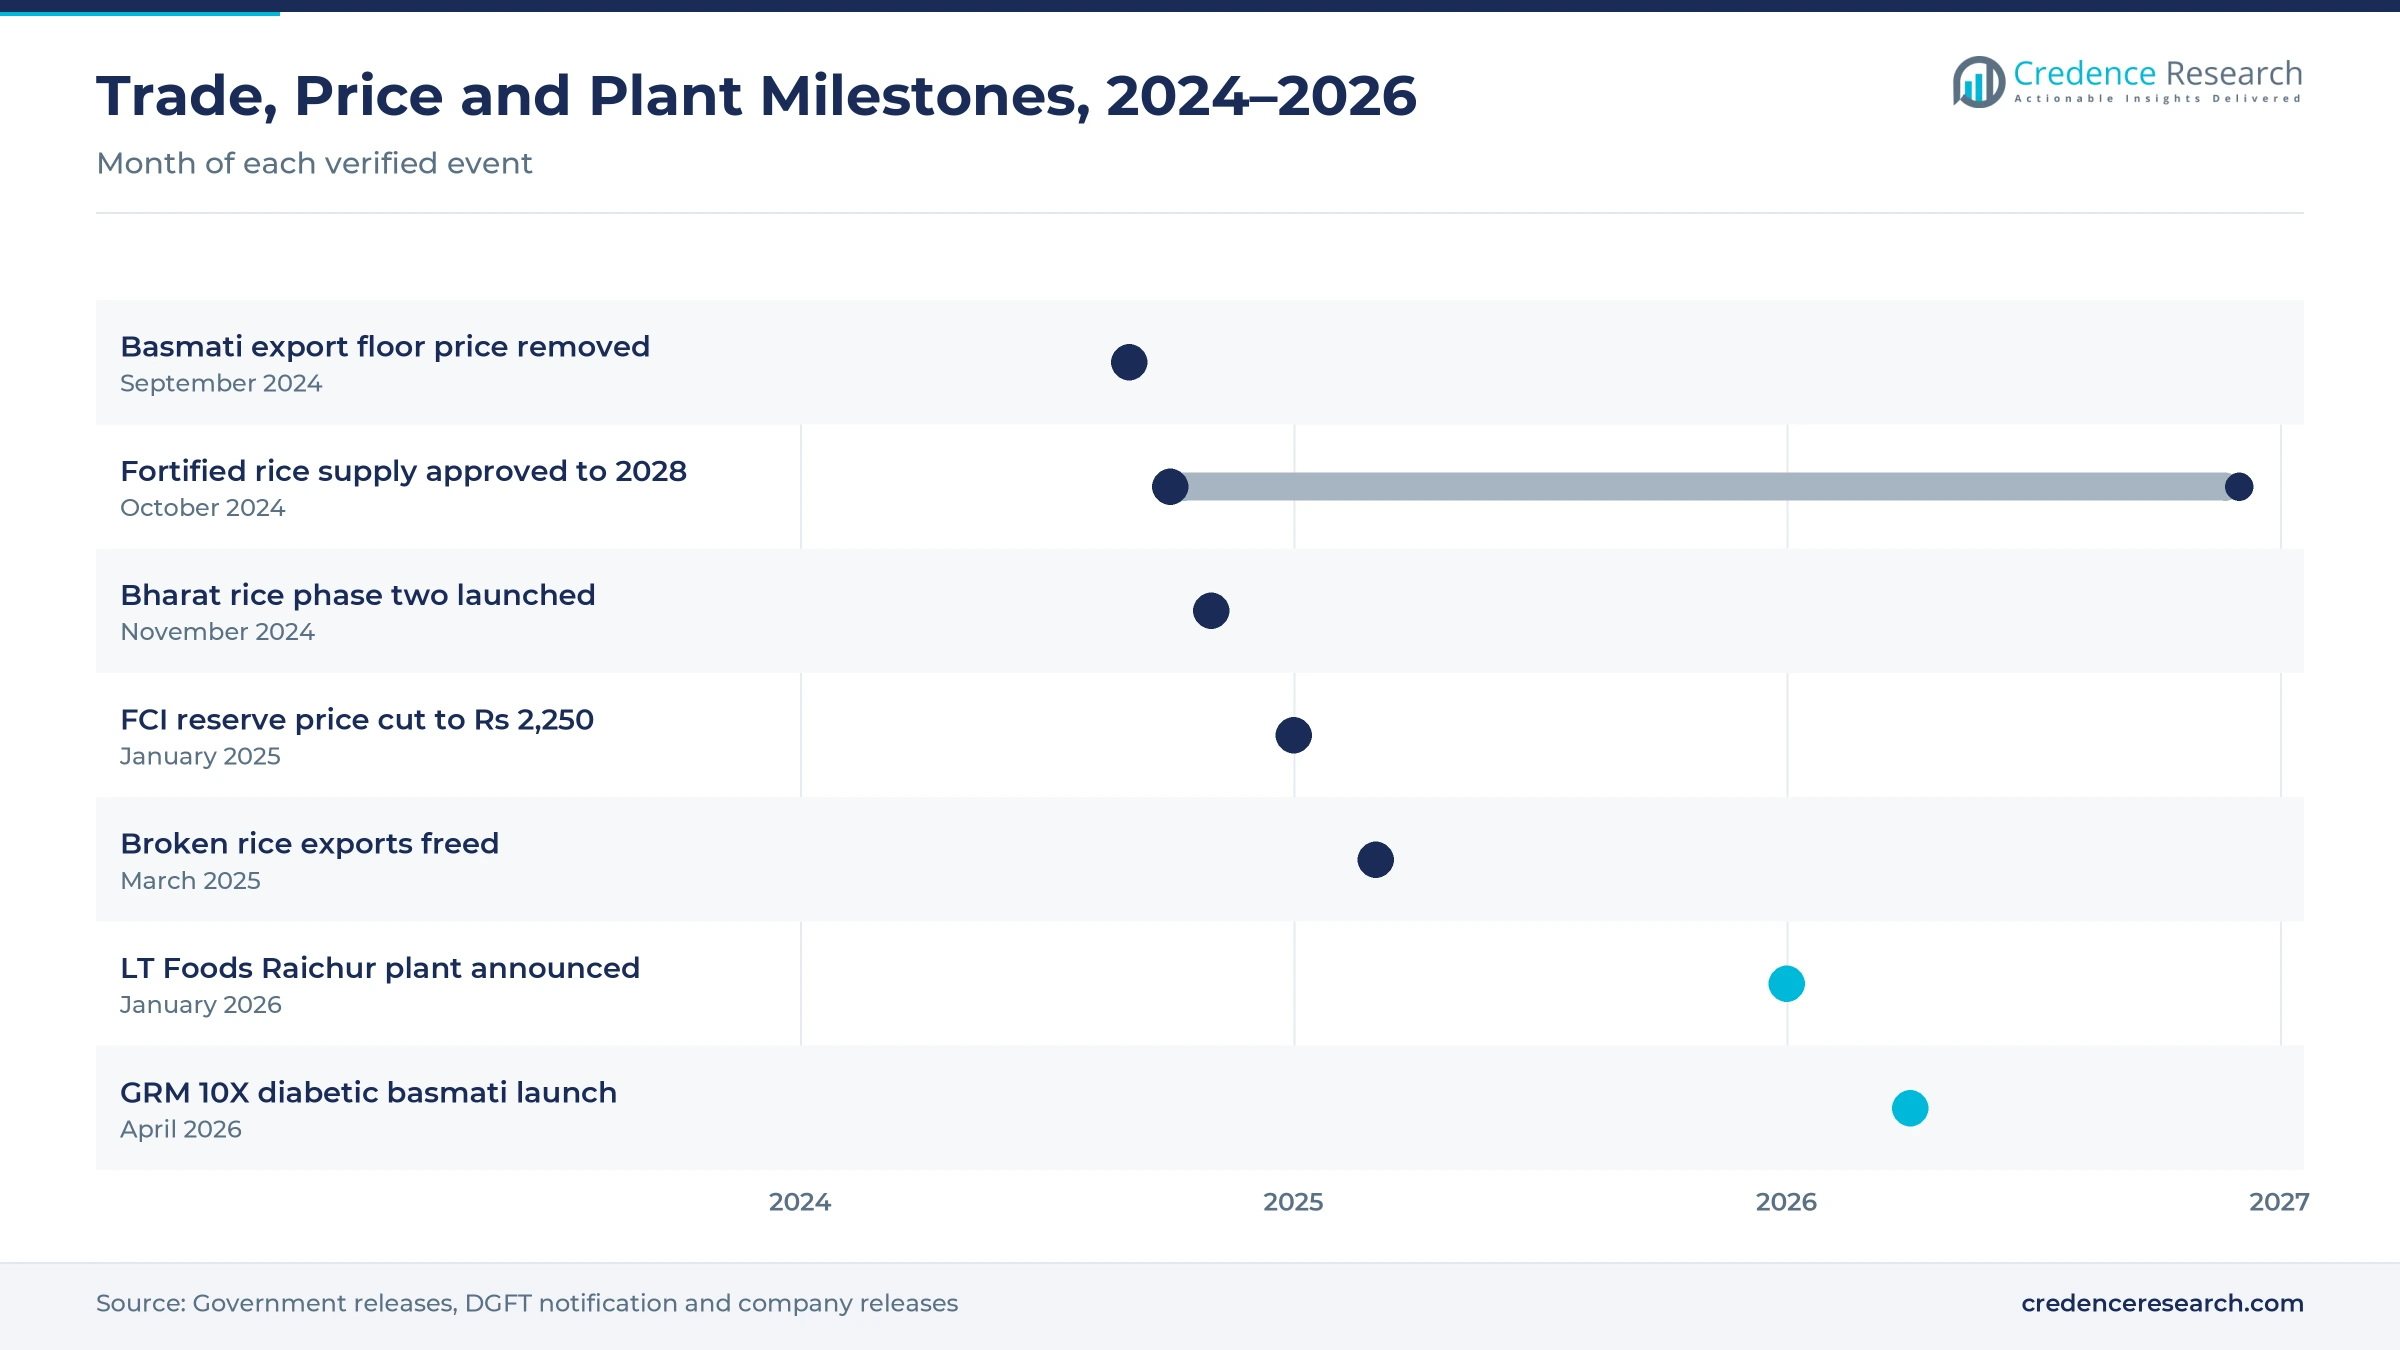
Trade, price and plant milestones from 2024 to 2026
| Development | Status and market relevance |
|---|---|
| In November 2024, the government launched the second phase of Bharat rice retail sales at Rs 34 a kilogram. | Sets a reference price for economy rice |
| In March 2025, the DGFT changed the export policy for broken rice from prohibited to free. | Reopens an export outlet for broken grain |
| In November 2025, final government estimates put 2024-25 rice output at a record 150.18 million metric tons. | Confirms ample supply for mills and exporters |
| In January 2026, LT Foods announced a 30,000-metric-ton rice plant at Raichur in Karnataka. | Builds southern sourcing for Sona Masoori and Kolam |
| In April 2026, GRM Overseas launched 10X basmati for diabetics in domestic and export markets. | Widens the specialty rice tier |
Optical sorting and blending lines lift grain quality
- Optical color sorters remove discolored and broken grains at high speed, so millers can sell cleaner grain to branded packers and export buyers at higher prices per kilogram.
- Ribbon and batch blenders mix fortified kernels with milled rice at a ratio of 1 to 100, a step that every mill delivering rice to welfare schemes must now complete before dispatch.
- Parboiling and drying lines soak, steam and dry paddy in controlled batches, an approach that improves head-rice recovery, cuts breakage and extends shelf life for eastern and southern buyers.
- Automated packing and tracking systems fill, seal and code branded packs, so brands can meet online orders quickly and trace each lot back to the mill and paddy batch.
Need a Custom Version of This Report?
Tailor the scope, geography, or segments to your exact requirements.
- Custom geography or segment scope
- Direct access to our analyst team
Basmati millers and staples groups contest shelf space
Competition is shaped by integrated basmati millers, diversified food groups and export houses that sell both at home and abroad. KRBL sells the India Gate brand and runs about 1.2 million metric tons of installed capacity across six plants. LT Foods sells the Daawat brand across Indian retail channels. AWL Agri Business sells Fortune rice through the same network that carries its edible oils and flour. Ebro India, part of Spain's Ebro Foods, mills basmati at Karnal for the Tilda brand. Chaman Lal Setia, GRM Overseas, Sarveshwar Foods, Amar Singh Chawal Wala, Shri Lal Mahal and Supple Tek compete mostly in basmati exports and premium packs. Rivals compete on paddy buying at harvest, aging capacity, grain quality, brand reach and export contracts, so firms with storage and wide distribution hold the strongest positions.
How fragmented is the Indian milling base?
The supply side is highly fragmented at the milling stage and more concentrated in branded basmati. Tens of thousands of custom mills process paddy for state agencies under fixed milling charges, which leaves thin margins and little brand power. Above them, a few listed basmati firms such as KRBL, LT Foods and GRM Overseas run large integrated plants with storage for aging grain. Entry barriers rise with working capital, because basmati must be bought at harvest and held for months. Margins are highest in aged and branded basmati and lowest in custom milling for the state.
Which millers and brands lead Indian rice sales?
| Company | Type | Role in the market |
|---|---|---|
| KRBL Limited | Integrated basmati miller | Sells India Gate basmati from six plants including Dhuri in Punjab |
| LT Foods Limited | Branded rice company | Sells Daawat basmati and is adding a Raichur plant for southern grains |
| AWL Agri Business Limited | Diversified staples group | Sells Fortune rice alongside edible oils and wheat flour |
| Ebro India Private Limited (Ebro Foods) | Multinational miller | Mills basmati at Karnal with about 125,000 metric tons of yearly capacity |
| Chaman Lal Setia Exports Limited | Basmati miller and exporter | Sells Maharani, Begum and Mithas basmati from Karnal |
| GRM Overseas Limited | Basmati miller and exporter | Sells 10X and Himalaya River rice from units in Haryana and Gujarat |
| Sarveshwar Foods Limited | Basmati processor | Mills basmati in Jammu and Kashmir and supplies export orders |
| Amar Singh Chawal Wala | Basmati brand owner | Sells Lal Qilla basmati in Indian retail and export markets |
| Shri Lal Mahal Limited | Rice exporter | Exports basmati and non-basmati rice under the Shrilalmahal brand to more than 44 countries |
| Supple Tek Industries Private Limited | Basmati miller and exporter | Mills and exports Zeeba basmati to more than 90 countries |
Credence Research view on Indian rice to 2035
Credence Research's view is that Indian rice value will grow steadily because the grain is a daily staple with little room for substitution, while exports and branded packs add value per metric ton. Non-basmati grain will stay the largest pool, but basmati, specialty rice and online channels will set the growth pace. Government stocks, free grain and fortified supply give volume certainty, though state pricing limits economy brands. Millers that combine storage, optical sorting and brands should outperform common-grain processors.
Consumption, trade and price data behind the estimate
The report uses 2025 as the base year on a calendar basis, and market values come from the Credence Research model. That model combines consumption estimates, crop output and stock data, export values and volumes, support and reserve prices, retail price series and company releases on plants and products. Regional shares, regional growth rates, segment splits and segment growth rates are Credence Research estimates. Sources used are government statistics and releases, international agency data and company filings reported in the press, and no interviews or surveys were used.
Premium grain and exports set the pace to 2035
The India rice market is expected to reach USD 73.11 billion by 2035, a 4.47% CAGR during 2026–2035, as staple demand stays firm and value per metric ton rises. Growth should be strongest in basmati, specialty grain, fortified blending and online channels, because these areas gain from export demand, health interest and welfare rules. Central and Northeast India should gain share from a small base. Low world prices, swings in Gulf demand and state-priced grain could slow common-grain millers.
What decides whether rice value grows faster or slower?
The range of outcomes depends mostly on export prices and on how fast households move to branded rice. A downside case follows a run of weak world prices, renewed export curbs or poor monsoons that cut basmati margins. The base case assumes steady free grain, record-level harvests and gradual premiumization. An upside case needs strong Gulf and African demand, faster online buying and wider adoption of specialty grains.
| Scenario | CAGR, 2026–2035 | Value, 2035 | What has to hold |
|---|---|---|---|
| Downside | 3.2% | USD 65.32 billion | World prices stay low, export curbs return or a weak monsoon cuts harvests |
| Base | 4.47% | USD 73.11 billion | Free grain continues, harvests stay near records and branded packs gain slowly |
| Upside | 5.7% | USD 81.02 billion | Gulf and African demand stays strong and online branded rice sales scale quickly |
Frequently Asked Questions
How big is the India rice market?
Which product type leads Indian rice sales?
Which region leads the Indian market?
How large are Indian rice exports?
How does fortification affect the market?
Which sales channel is growing fastest?
Who are the leading companies in the Indian market?
What are the main challenges for rice millers in India?
Table of Content
Chapter 1 Market Segmentation
- 1.1 Segmentation Framework
- 1.1.1 Product and Service Classification
- 1.1.2 Application and End-Use Classification
- 1.1.3 Technology and Solution Classification
- 1.1.4 Customer and Distribution Channel Classification
- 1.1.5 Geographic Segmentation
- 1.1.6 Market Segment Definitions and Boundaries
- 1.2 By Product Type
- 1.2.1 Basmati Rice
- 1.2.2 Non-Basmati White Rice
- 1.2.3 Parboiled Rice
- 1.2.4 Brown and Unpolished Rice
- 1.2.5 Broken Rice
- 1.3 By Technology
- 1.3.1 Conventional Milling
- 1.3.2 Modern Automated Milling
- 1.3.3 Sortex and Optical Grading
- 1.3.4 Fortified Rice Blending
- 1.4 By Price Tier
- 1.4.1 Economy Rice
- 1.4.2 Mainstream Rice
- 1.4.3 Premium Rice
- 1.4.4 Super-Premium and Specialty Rice
Chapter 2 Introduction
- 2.1 Report Objectives and Scope
- 2.2 Product Definition and Industry Terminology
- 2.3 Market Inclusions and Exclusions
- 2.4 Research Process
- 2.4.1 Primary Research and Expert Interviews
- 2.4.2 Secondary Research and Source Review
- 2.4.3 Top-Down and Bottom-Up Estimation
- 2.4.4 Data Triangulation and Verification
- 2.5 Market Size Measurement Basis
- 2.5.1 2025: USD 47.09 billion → 2035: USD 73.11 billion
- 2.6 Historical and Forecast Reference Periods
- 2.6.1 Historical Period: 2018-2025
- 2.6.2 Base Year: 2025
- 2.6.3 Forecast Period: 2025-2035
- 2.7 Research Assumptions and Limitations
Chapter 3 Executive Summary
- 3.1 Market Snapshot and Key Findings
- 3.2 Base-Year Market Size, 2025
- 3.3 Forecast Market Size, 2035
- 3.4 Revenue and Volume Growth Outlook
- 3.5 Key Demand and Supply Indicators
- 3.6 Leading Market Segments
- 3.7 Fastest-Growing Market Opportunities
- 3.8 Regional Performance Highlights
- 3.9 Technology and Industry Transformation
- 3.10 Competitive Landscape Summary
- 3.11 Analyst View and Strategic Implications
Chapter 4 India Rice Market Trends and Developments
- 4.1 Historical Industry Development, 2018-2025
- 4.2 Recent Market Trends and Developments
- 4.3 Demand and Customer Behavior Trends
- 4.4 Technology and Product Innovation
- 4.5 Artificial Intelligence, Automation and Digitalization
- 4.6 Local Manufacturing and Supply Chain Realignment
- 4.7 Industry Partnerships, Mergers and Acquisitions
- 4.8 Sustainability and Circular Economy Developments
- 4.9 Government and Private Sector Investment Trends
- 4.10 Emerging Business Models and Commercialization
- 4.11 Industry Developments and Announcements
Chapter 5 India Rice Market Production, Supply and Demand Analysis
- 5.1 Demand Trend and Consumption Analysis, 2018-2025
- 5.2 Demand Forecast, 2025-2035
- 5.3 Production and Output Trend, 2018-2025
- 5.4 Production and Output Forecast, 2025-2035
- 5.5 Installed Capacity and Capacity Utilization
- 5.6 Company-Wise Production Plants and Statistics
- 5.6.1 Installed Production Capacity
- 5.6.2 Actual Production
- 5.6.3 Planned Capacity and Expansion Targets
- 5.7 Supply Chain Structure and Procurement Trends
- 5.8 Supply-Demand Gap and Bottlenecks
- 5.9 Import Dependence and Sourcing Structure
- 5.10 Contract Manufacturing and Outsourcing
- 5.11 Regional Supply and Demand Concentration
Chapter 6 India Rice Market Pricing Analysis
- 6.1 Pricing Structure and Measurement
- 6.2 Historical Pricing Trends, 2018-2025
- 6.3 Pricing Outlook, 2025-2035
- 6.4 Average Selling Price and Unit Economics
- 6.5 Pricing by Product and Market Segment
- 6.6 Geographic Pricing Differences
- 6.7 Key Input, Energy, Labor and Logistics Costs
- 6.8 Contract Pricing and Purchasing Models
- 6.9 Pricing Sensitivity and Competitive Positioning
- 6.10 Price, Margin and Profitability Implications
Chapter 7 India Rice Market Dynamics
- 7.1 Market Growth Drivers
- 7.1.1 Demand-Side Drivers
- 7.1.2 Technology and Innovation Drivers
- 7.1.3 Infrastructure and Investment Drivers
- 7.1.4 Regulatory and Policy Drivers
- 7.2 Market Restraints
- 7.2.1 Cost and Affordability Constraints
- 7.2.2 Technology and Adoption Barriers
- 7.2.3 Supply Chain and Operational Constraints
- 7.3 Market Challenges
- 7.3.1 Competitive Pressure and Margin Erosion
- 7.3.2 Skills, Infrastructure and Implementation Gaps
- 7.4 Emerging Market Opportunities
- 7.5 Market Dynamics Impact and Time-Horizon Assessment
Chapter 8 India Rice Value Chain Analysis
- 8.1 Industry Value Chain Overview
- 8.2 Upstream Suppliers and Critical Inputs
- 8.3 Technology and Component Providers
- 8.4 Manufacturing or Service Delivery
- 8.5 Distribution, Channel Partners and Integrators
- 8.6 Downstream Applications and End Users
- 8.7 Value Addition and Profit Pools
- 8.8 Vertical Integration and Outsourcing
- 8.9 Supplier Concentration and Risk
- 8.10 Supply Chain Localization and Resilience
Chapter 9 India Rice Market Regulations and Policies
- 9.1 Relevant Laws, Standards and Compliance Frameworks
- 9.2 Product, Service, Safety and Quality Requirements
- 9.3 Government Policies, Incentives and Subsidies
- 9.4 Imports, Exports and Trade Barriers
- 9.5 Public Procurement and Local Content Requirements
- 9.6 Environmental and Sustainability Compliance
- 9.7 Upcoming Policy Changes and Market Implications
Chapter 10 India Rice Market Hotspots and Opportunities
- 10.1 Market Opportunity Mapping and Growth Hotspots
- 10.2 High-Growth Applications and Customer Groups
- 10.3 Underserved Markets and White-Space Opportunities
- 10.4 Emerging Technology and Product Opportunities
- 10.5 New Capacity and Investment Hotspots
- 10.6 Market Entry and Expansion Opportunities
- 10.7 Distribution and Partnership Opportunities
- 10.8 Near-Term and Long-Term Commercial Potential
- 10.9 Opportunity Attractiveness and Execution Risks
Chapter 11 India Rice Market Outlook, 2025-2035
- 11.1 Market Size and Analysis
- 11.1.1 Revenue (Market Measurement: 2025: USD 47.09 billion → 2035: USD 73.11 billion)
- 11.1.2 Market Volume and Quantity Sold
- 11.1.3 Historical Market Size, 2018-2025
- 11.1.4 Base-Year Market Size, 2025
- 11.2 Market Forecast, 2025-2035
- 11.2.1 Revenue Forecast to 2035
- 11.2.2 Volume Forecast to 2035
- 11.2.3 CAGR and Year-on-Year Growth
- 11.2.4 Incremental Revenue Opportunity
- 11.3 Forecast Assumptions and Scenario Analysis
- 11.3.1 Base-Case Forecast
- 11.3.2 Optimistic and Conservative Scenarios
- 11.3.3 Technology, Pricing and Policy Sensitivities
- 11.4 Market Attractiveness and Growth Outlook
Chapter 12 India Rice Market Segmentation and Outlook
- 12.1 Segmentation Summary and Market Shares, 2025
- 12.2 Largest and Fastest-Growing Segments
- 12.3 By Product Type - Market Size and Forecast, 2025-2035
- 12.3.1 Segment Definition and Scope
- 12.3.2 Historical Market Size, 2018-2025
- 12.3.3 Revenue Forecast, 2025-2035
- 12.3.4 Volume Forecast, 2025-2035
- 12.3.5 Base-Year Market Share, 2025
- 12.3.6 Segment CAGR and Growth Drivers
- 12.3.7 Subsegment Market Size and Forecast
- 12.3.7.1 Basmati Rice
- 12.3.7.2 Non-Basmati White Rice
- 12.3.7.3 Parboiled Rice
- 12.3.7.4 Brown and Unpolished Rice
- 12.3.7.5 Broken Rice
- 12.3.8 Subsegment Pricing and Adoption Trends
- 12.3.9 Leading Suppliers and Competition
- 12.3.10 Regional Demand and Opportunities
- 12.4 By Technology - Market Size and Forecast, 2025-2035
- 12.4.1 Segment Definition and Scope
- 12.4.2 Historical Market Size, 2018-2025
- 12.4.3 Revenue Forecast, 2025-2035
- 12.4.4 Volume Forecast, 2025-2035
- 12.4.5 Base-Year Market Share, 2025
- 12.4.6 Segment CAGR and Growth Drivers
- 12.4.7 Subsegment Market Size and Forecast
- 12.4.7.1 Conventional Milling
- 12.4.7.2 Modern Automated Milling
- 12.4.7.3 Sortex and Optical Grading
- 12.4.7.4 Fortified Rice Blending
- 12.4.8 Subsegment Pricing and Adoption Trends
- 12.4.9 Leading Suppliers and Competition
- 12.4.10 Regional Demand and Opportunities
- 12.5 By Price Tier - Market Size and Forecast, 2025-2035
- 12.5.1 Segment Definition and Scope
- 12.5.2 Historical Market Size, 2018-2025
- 12.5.3 Revenue Forecast, 2025-2035
- 12.5.4 Volume Forecast, 2025-2035
- 12.5.5 Base-Year Market Share, 2025
- 12.5.6 Segment CAGR and Growth Drivers
- 12.5.7 Subsegment Market Size and Forecast
- 12.5.7.1 Economy Rice
- 12.5.7.2 Mainstream Rice
- 12.5.7.3 Premium Rice
- 12.5.7.4 Super-Premium and Specialty Rice
- 12.5.8 Subsegment Pricing and Adoption Trends
- 12.5.9 Leading Suppliers and Competition
- 12.5.10 Regional Demand and Opportunities
- 12.6 Segment Growth Comparison
- 12.7 Segment Attractiveness and Priority Matrix
Chapter 13 India Rice Geographic Market Outlook, 2025-2035
- 13.1 Domestic Market Distribution and Demand Clusters
- 13.2 State- or Province-Wise Market Size and Forecast, 2025-2035
- 13.3 City and Metropolitan Market Outlook
- 13.4 Industrial, Manufacturing and Commercial Clusters
- 13.5 Geographic Concentration of Key End Users
- 13.6 Local Pricing and Purchasing Differences
- 13.7 Domestic Production Facilities and Capacity Map
- 13.8 Local Infrastructure and Project Pipeline
- 13.9 State-Level Policy and Incentive Differences
- 13.10 Subnational Investment Hotspots and Opportunities
- 13.11 Distribution and Logistics Networks
- 13.12 Domestic Competitive Footprint
Chapter 14 India Rice Technology, Innovation and Sustainability Outlook
- 14.1 Technology Landscape and Maturity
- 14.2 Product, Process and Service Innovation
- 14.3 AI, Automation and Digital Tools in the Industry
- 14.4 Technology Adoption and Performance Benchmarking
- 14.5 Innovation Pipeline and R&D Investment
- 14.6 Patent and Intellectual Property Trends
- 14.7 Energy Efficiency and Resource Management
- 14.8 Sustainability, Recycling and Circularity
- 14.9 Technology Roadmap, 2025-2035
- 14.10 Risks of Obsolescence and Technology Substitution
Chapter 15 India Rice Market Key Strategic Imperatives
- 15.1 Growth and Market Entry Priorities
- 15.2 High-Return Products and Segments
- 15.3 Pricing, Profitability and Cost Optimization
- 15.4 Technology Investment and Product Differentiation
- 15.5 Supply Chain Localization and Resilience
- 15.6 Distribution and Customer Acquisition
- 15.7 Partnership, Acquisition and Capacity Strategy
- 15.8 Regional Expansion Priorities
- 15.9 Short-, Medium- and Long-Term Actions
Chapter 16 Competition Outlook
- 16.1 Industry Competition Characteristics
- 16.2 Market Structure and Concentration
- 16.3 Market Share and Competitive Positioning, 2025
- 16.4 Company-Wise Revenue and Product Benchmarking
- 16.5 Production and Service Capacity Benchmarking
- 16.6 Technology, Pricing and Differentiation
- 16.7 Regional Footprint and Distribution Strength
- 16.8 Mergers, Acquisitions and Strategic Alliances
- 16.9 New Entrants and Competitive Threats
- 16.10 Porter's Five Forces and Industry Attractiveness
- 16.11 Competitive Outlook, 2025-2035
Chapter 17 Company Profiles
- 17.1 Company Coverage and Selection Criteria
- 17.2 KRBL Limited
- 17.2.1 Business Description
- 17.2.2 Company Ownership and Geographic Presence
- 17.2.3 Product and Service Portfolio
- 17.2.4 Manufacturing and Operating Footprint
- 17.2.5 Production Capacity and Expansion Plans
- 17.2.6 Financial Performance and Investment
- 17.2.7 Market Share and Competitive Position
- 17.2.8 Technology and Innovation Capabilities
- 17.2.9 Strategic Alliances or Partnerships
- 17.2.10 Recent Developments
- 17.2.11 Growth Strategy and Outlook
- 17.3 LT Foods Limited
- 17.4 AWL Agri Business Limited
- 17.5 Ebro India Private Limited (Ebro Foods)
- 17.6 Chaman Lal Setia Exports Limited
- 17.7 GRM Overseas Limited
- 17.8 Sarveshwar Foods Limited
- 17.9 Amar Singh Chawal Wala
- 17.10 Shri Lal Mahal Limited
- 17.11 Supple Tek Industries Private Limited
- 17.12 Other Relevant Market Participants
Note: Every listed company is profiled on the structure shown under the first company. The company list is preliminary and may change based on research findings, market developments, data availability and client requirements.
Chapter 18 Disclaimer
- 18.1 Research and Forecast Disclaimer
- 18.2 Data Source and Estimation Limitations
Note: The depth of individual sections depends on data availability for this market. Volume, capacity, trade and other unit-based metrics are included where applicable.

