
Sodas lead value while water gains ahead of the sugar tax
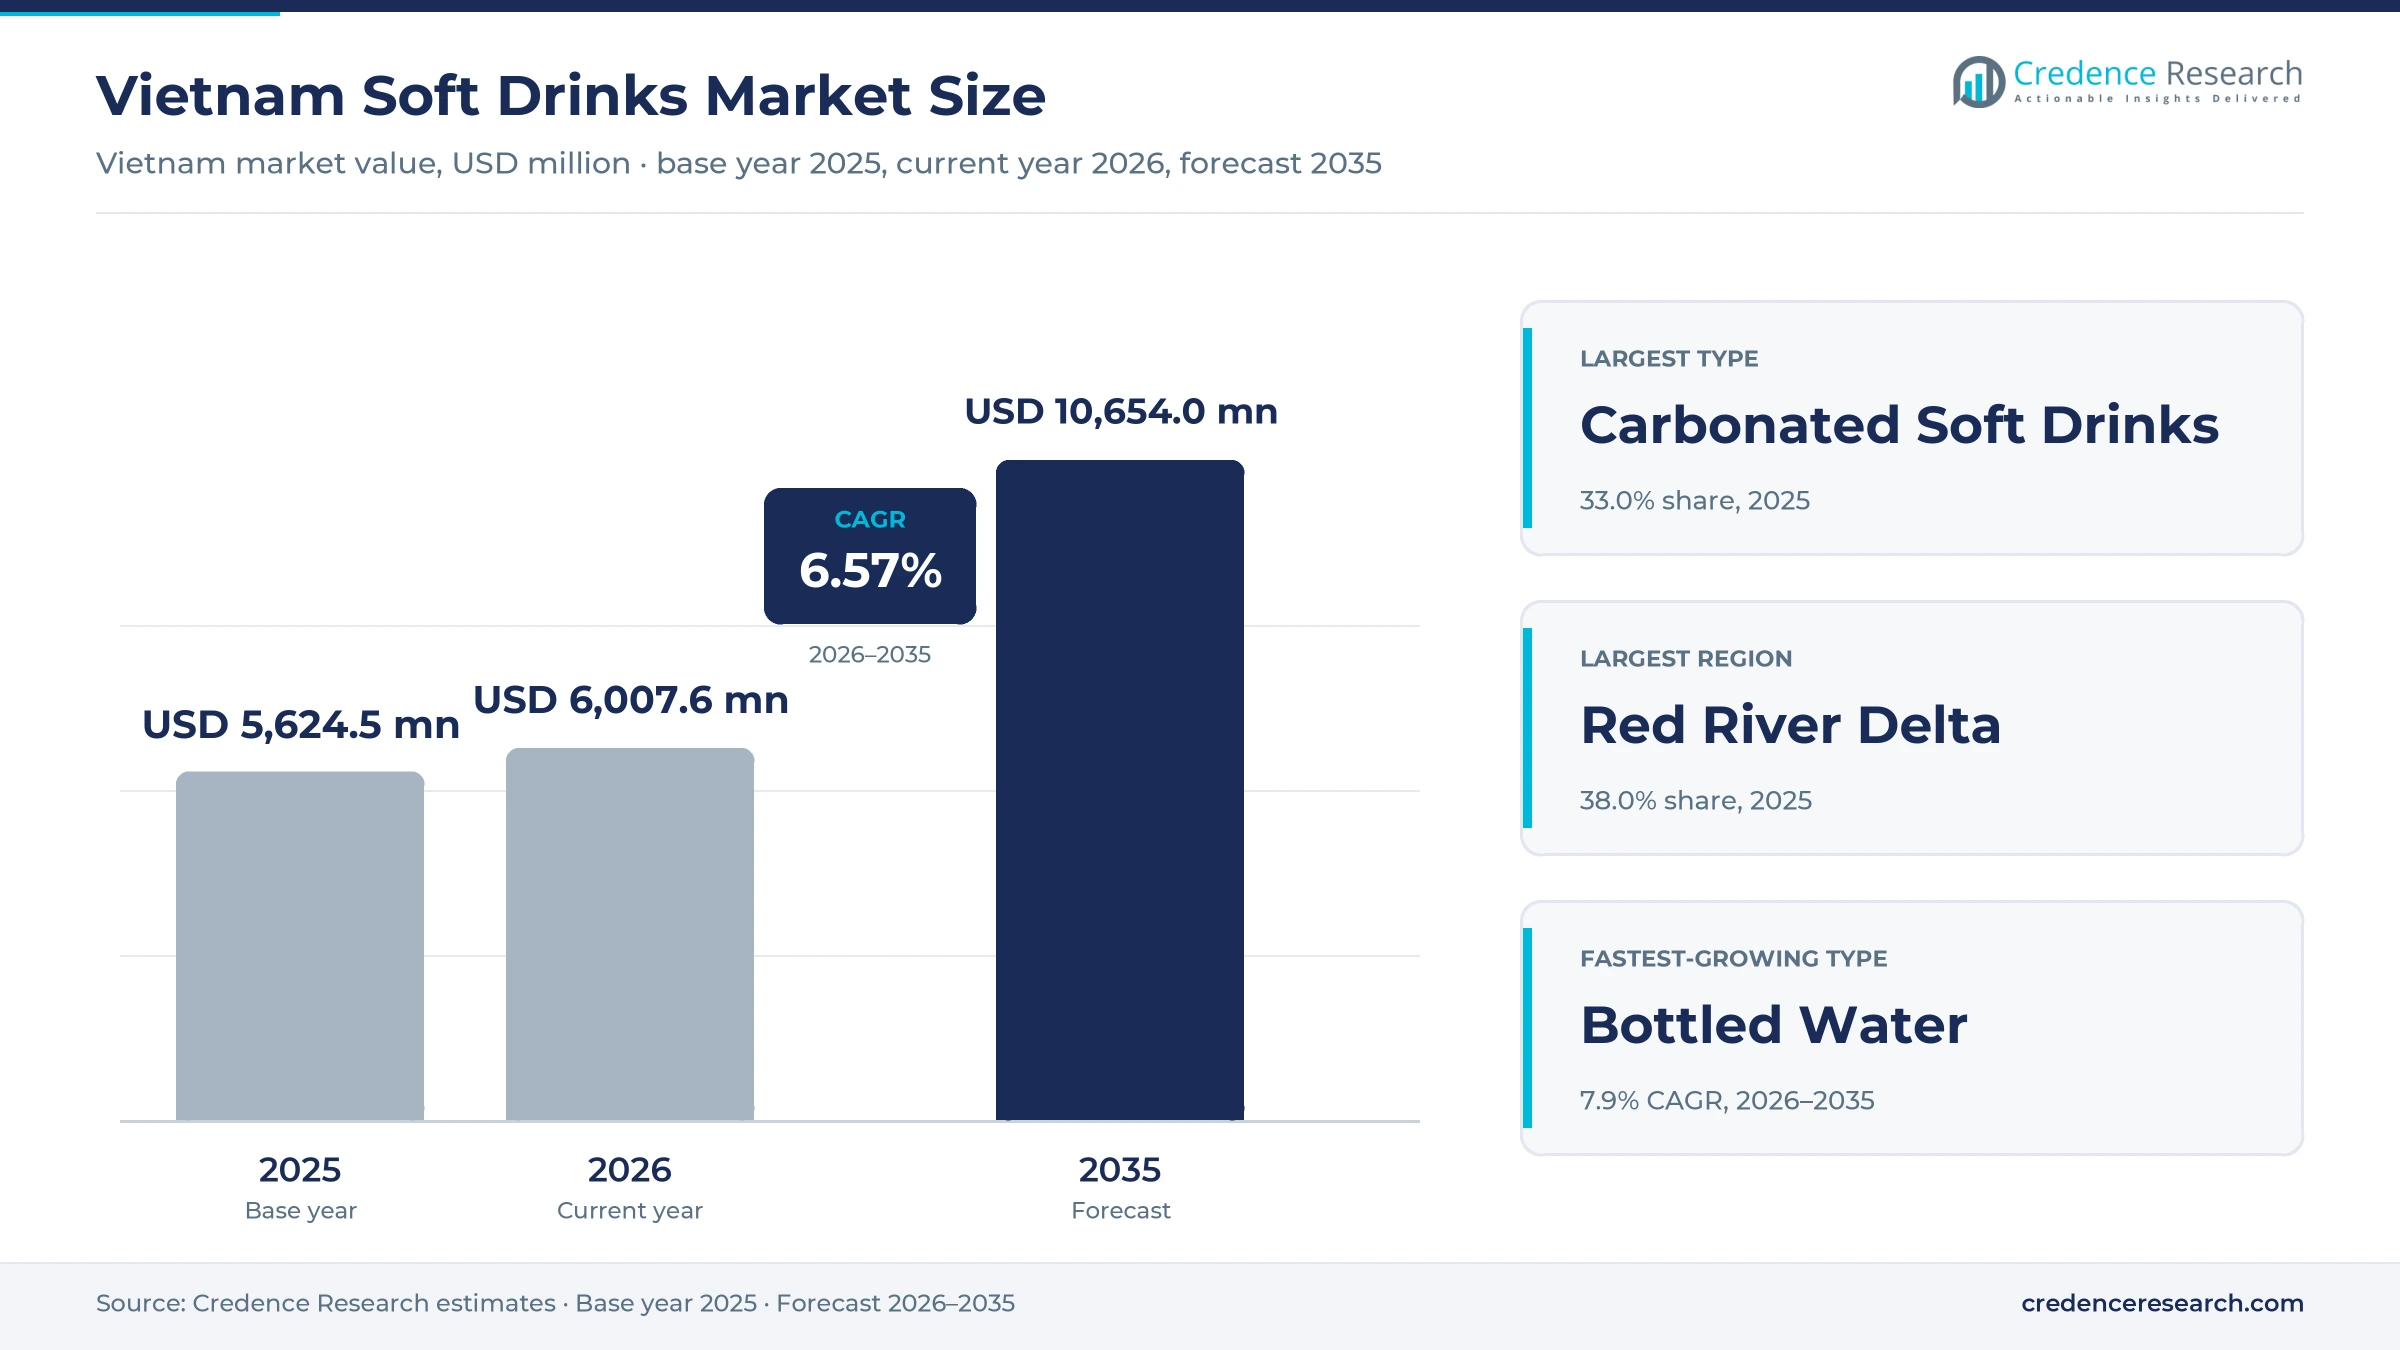
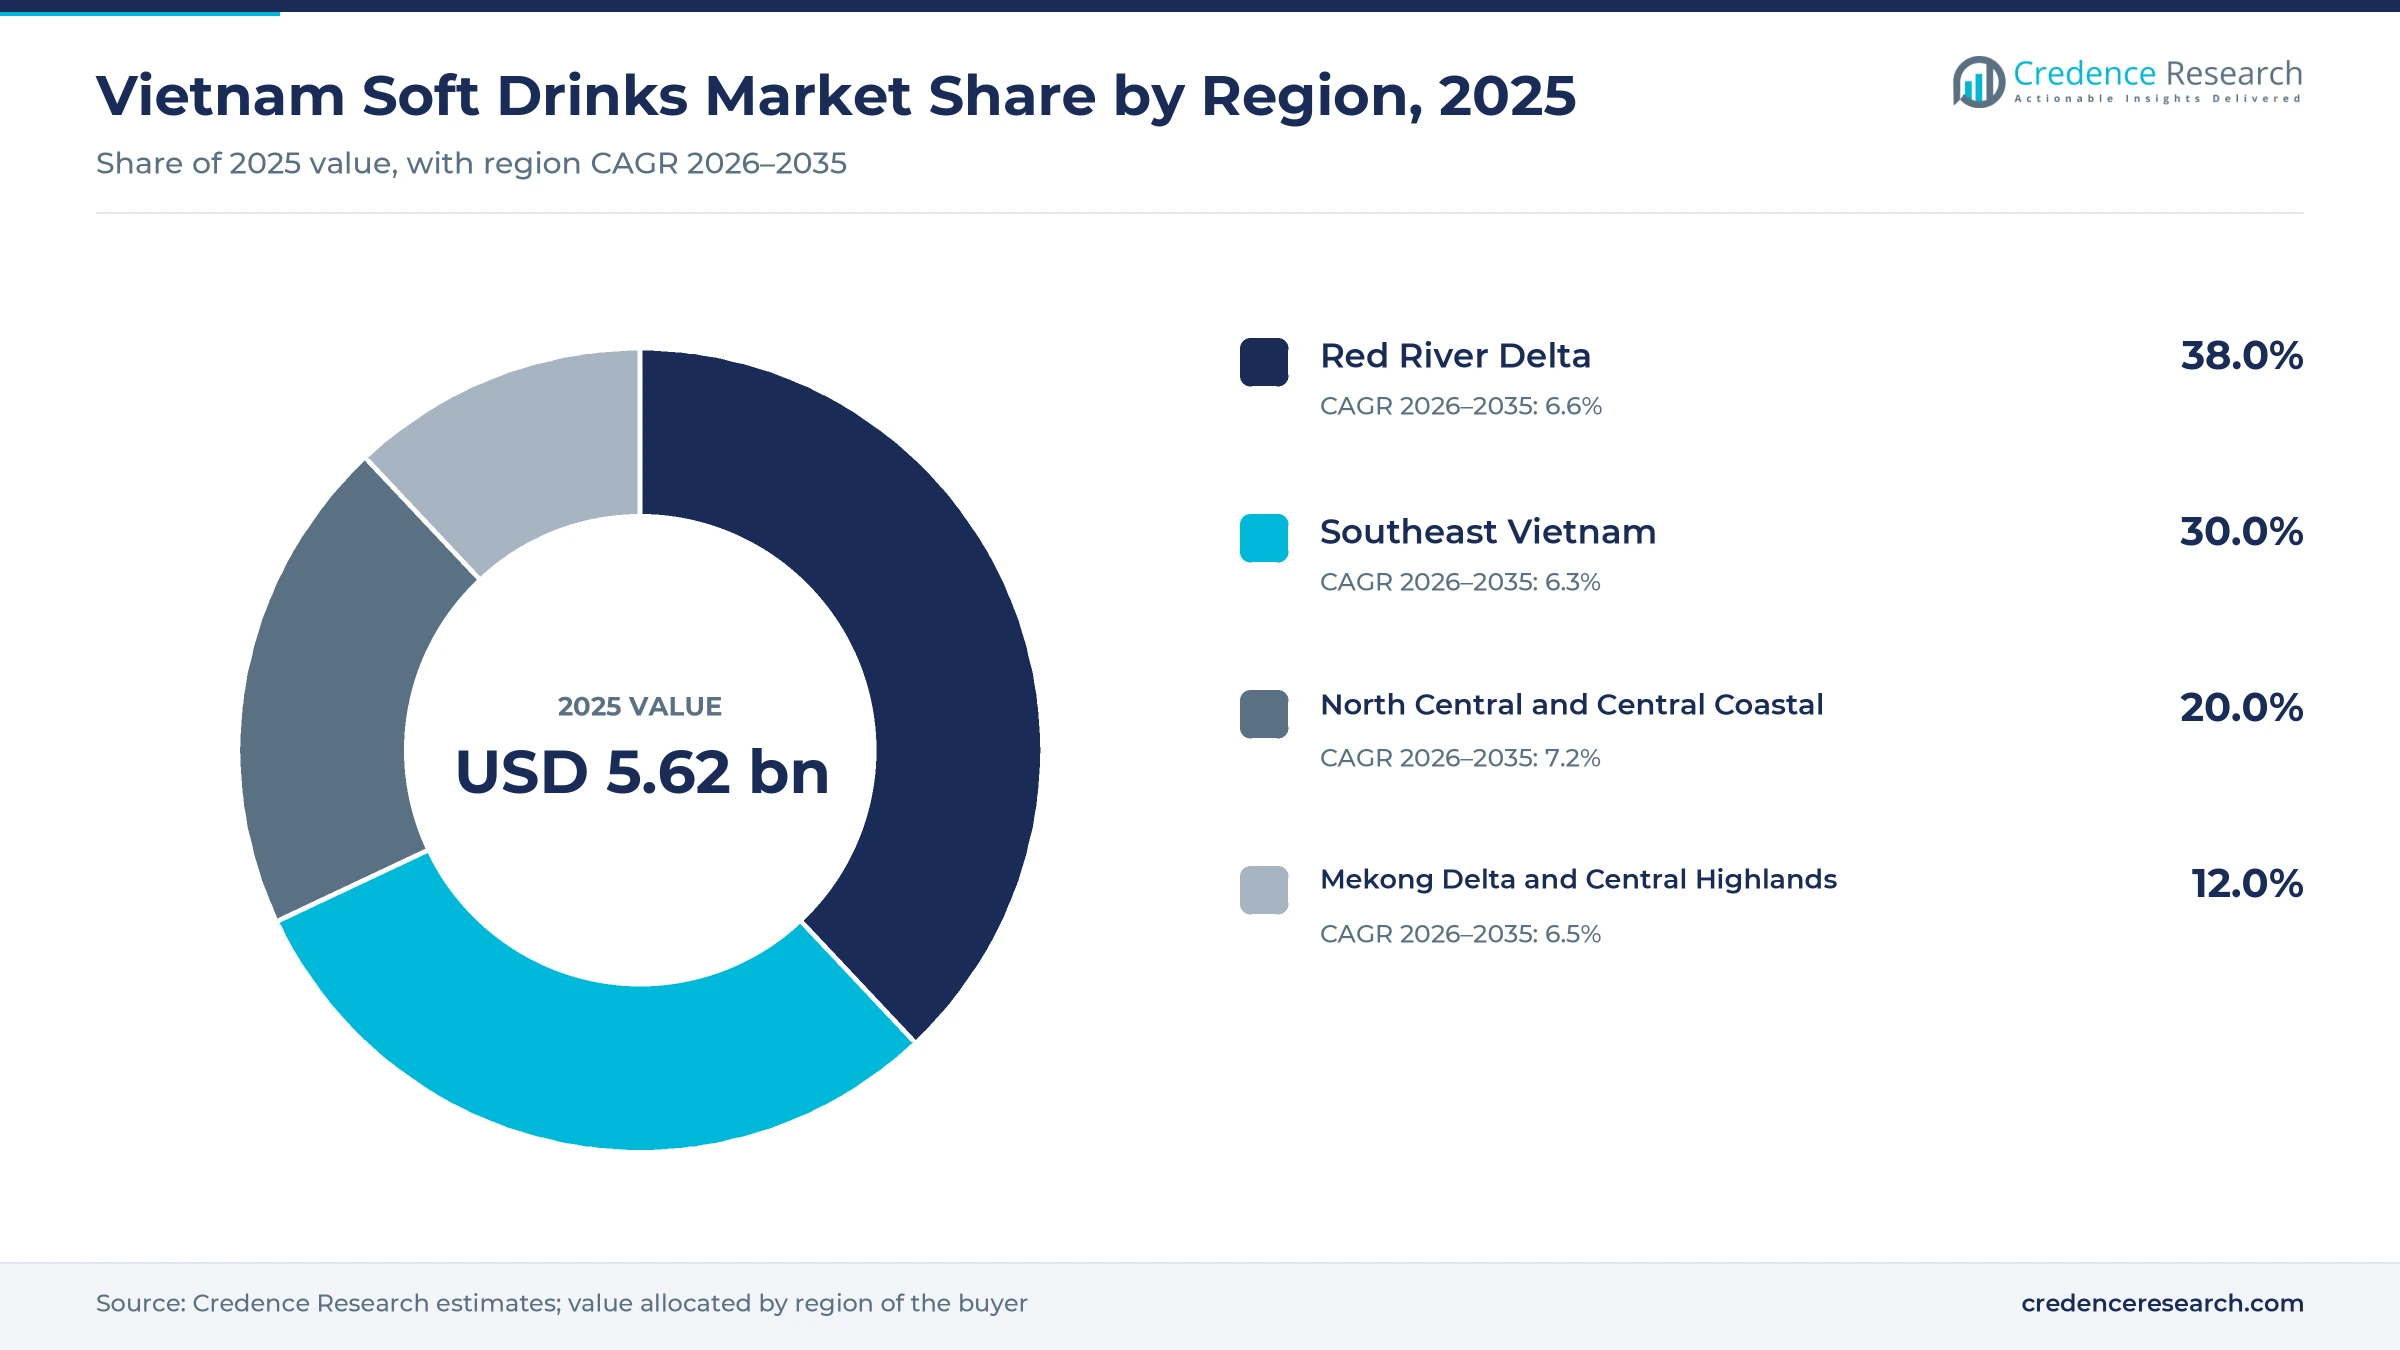
The Vietnam soft drinks market was valued at USD 5.62 billion in 2025 and is projected to increase from USD 6.01 billion in 2026 to USD 10.65 billion by 2035, registering a CAGR of 6.57% during 2026–2035. Demand rests on a hot climate, a young and urbanizing population and drinking habits that already include sweet tea, soda and energy drinks at most meals and work breaks. Red River Delta held the largest regional share, 38.0% in 2025, because Hanoi and the surrounding industrial provinces combine high incomes with dense convenience retail. North Central and Central Coastal is the fastest-growing region at 7.2% a year, helped by coastal tourism and new store openings. The largest commercial change is a new excise tax on high-sugar drinks from 2027, which is pushing bottlers toward lower-sugar recipes and giving tax-exempt bottled water a price advantage on the shelf.
Which drinks and buyers make up soft drink spending in Vietnam?
The market counts consumer spending on ready-to-drink tea, carbonated soft drinks, packaged drinking and mineral water, and other functional and juice beverages such as energy drinks, sports drinks and packaged juice. Buyers range from households stocking large bottles of water and soda to factory workers buying single cans of energy drinks and restaurants serving iced tea. Most volume passes through family-run grocery shops, followed by minimarts, restaurants and online platforms.
The estimate excludes beer and other alcoholic drinks, dairy milk, freshly brewed coffee and tea served in cafes, and large water jugs delivered to offices. Value is counted at the price the final buyer pays, so the bottler margin, distributor margin and retail or restaurant mark-up all sit inside the figure. Export sales by Vietnamese makers are not part of domestic value.
Vietnam Soft Drinks Market Insights
- Soft drink value rises from USD 5.62 billion in 2025 to USD 10.65 billion by 2035, a 6.57% pace driven by pack mix, out-of-home sales and tax-exempt water.
- Red River Delta led with 38.0% of 2025 value, while North Central and Central Coastal expands fastest at 7.2% a year on tourism and new stores.
- Carbonated Soft Drinks held 33.0% of 2025 value, while Bottled Water grows fastest at 7.9% because it is excluded from the excise tax.
- Drinks above 5 grams of sugar per 100 milliliters pay an 8% excise tax from 2027 and 10% from 2028, rewarding suppliers that reformulate early.
- Coca-Cola and Suntory PepsiCo opened Tay Ninh plants of about 1 billion and 1.244 billion liters a year in July 2025 and July 2026.
Sodas, daily hydration and corner shops carry most value
Why do sodas carry the most value, and why is water growing fastest?
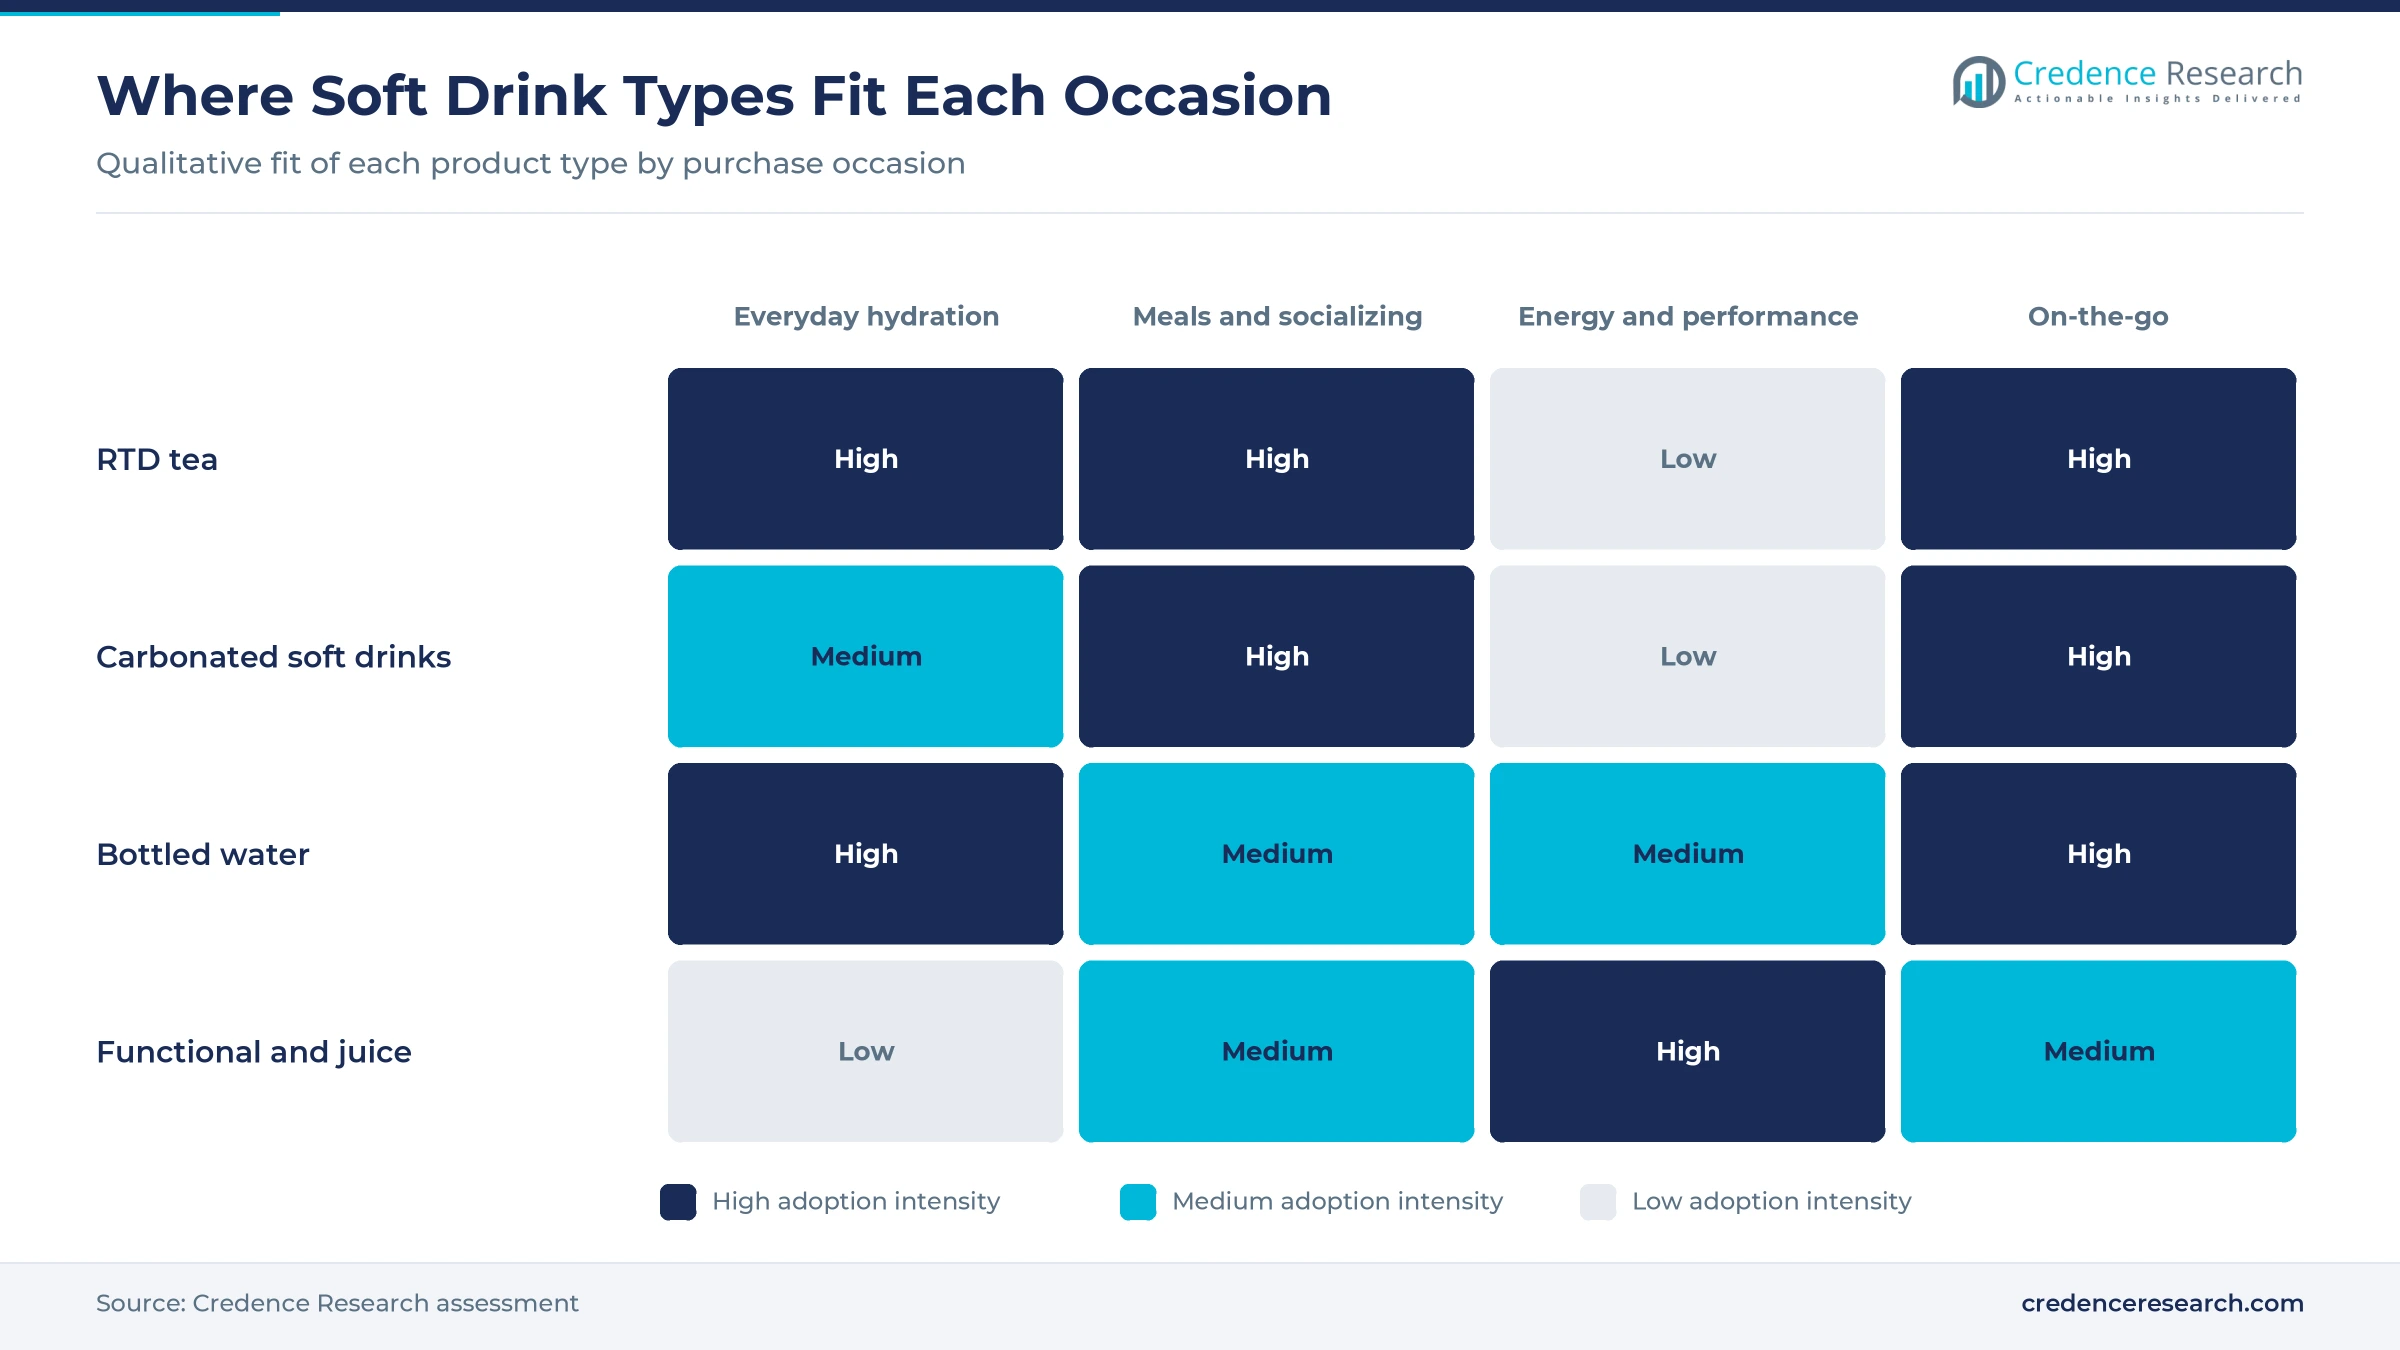
Based on product type, the market is categorized into RTD tea, carbonated soft drinks, bottled water and other functional and juice beverages. Carbonated Soft Drinks led with 33.0% of 2025 value because colas and lemon-lime sodas sell at a higher price per liter than tea or water, and the Coca-Cola system alone sold about 811 million liters in Vietnam in 2025, The Investor reported from Swire Pacific filings. Bottled Water grows fastest at 7.9% a year as natural mineral water and bottled drinking water are excluded from the excise tax that hits sweet drinks from 2027, Vietstock reported. Sweet teas and energy drinks face the same tax, which favors their low-sugar versions.
Which purchase occasions hold the most value, and which grow fastest?
Based on purchase occasion, the market is categorized into everyday hydration, meals and socializing, energy and performance, and on-the-go refreshment. Everyday Hydration led with 34.0% of 2025 value because packaged water and tea remain the main drinking sources at home and work, and Ho Chi Minh City’s water utility had installed only 27 pilot public drinking fountains by the end of 2025, Tuoi Tre News reported. On-the-go Refreshment grows fastest at 7.6% a year as convenience chains add chilled shelves near offices and campuses, and GS25 alone runs more than 400 outlets in the south. Single-serve cans and small bottles sold cold carry the highest prices per liter.
Why do corner shops still lead, and how fast is online growing?
Based on distribution channel, the market is categorized into traditional grocery, modern retail, foodservice and e-commerce. Traditional Grocery led with 55.0% of 2025 value because modern trade handles only about 35% to 40% of urban retail sales and 15% to 20% in rural areas, Viet Nam News reported, citing 2025 consumer panel data. E-commerce grows fastest at 10.5% a year as sales on Shopee, TikTok Shop, Lazada and Tiki reached VND429 trillion in 2025, up nearly 34.8%, VietNamNet reported. Multipacks of bottled water and tea ordered online let brands reach urban buyers without wholesaler discounts.
How far do PET bottles dominate, and where do cans gain?
Based on packaging format, the market is categorized into PET bottles, aluminum cans, cartons and glass and other formats. PET Bottles led with 68.0% of 2025 value because water, tea and family-size sodas are filled almost entirely in plastic, and the new Suntory PepsiCo plant in Tay Ninh can turn out 84,000 PET bottles an hour, Viet Nam News reported in July 2026. Aluminum Cans grow fastest at 7.6% a year as the same plant’s can lines run at 120,000 cans an hour for chilled single-serve sales. Steady regional can supply supports this shift, while glass keeps losing share outside restaurants.
| Segment Group | Leading Sub-segment | Share, 2025 | Fastest-growing Sub-segment | CAGR, 2026–2035 |
|---|---|---|---|---|
| By Product Type | Carbonated Soft Drinks | 33.0% | Bottled Water | 7.9% |
| By Purchase Occasion | Everyday Hydration | 34.0% | On-the-go Refreshment | 7.6% |
| By Distribution Channel | Traditional Grocery | 55.0% | E-commerce | 10.5% |
| By Packaging Format | PET Bottles | 68.0% | Aluminum Cans | 7.6% |
Round price points shape margins before the sugar tax
Soft drink pricing works on price per pack rather than price per liter, so suppliers defend round shelf prices and move value through pack size and format. Water and large PET bottles carry the lowest cost per liter, while cans, energy drinks and premium teas sell at far higher unit prices in minimarts and cafes. The excise tax adds a cost tied to sugar content, so the recipe now determines part of the shelf price. Brands that cut sugar below the threshold can hold price points, while full-sugar lines must absorb the tax, raise prices or shrink packs, and each choice shifts margin between bottlers and retailers.
| Pack or price element | Typical price or fee | Basis |
|---|---|---|
| Lemon-lime soda, 320 ml can (7 Up) | VND9,300 per can | Lotte Mart Vietnam listing, November 2026 |
| Mainstream energy drink, can or bottle | About VND10,000 to VND18,000 | Credence Research estimate from retail listings |
| Economy bottled water, 500 ml | About VND4,000 to VND6,000 | Credence Research estimate from retail listings |
| Sugar level that triggers the excise tax | Above 5 g per 100 ml | Law No. 66/2025/QH15 |
| Excise tax on high-sugar drinks | 8% from 2027, 10% from 2028 | Law No. 66/2025/QH15 on Special Consumption Tax |
Request a Free Sample
Fill in your details and we'll send you a free sample report.
- Sample data tables & charts
- Research methodology
Young buyers, tourists and new plants lift drink volumes
A large and young consumption base keeps drinks in daily routines
Scale is the starting point, because Vietnam combines a large population with drinking habits that already include packaged drinks every day. The National Statistics Office estimated the 2025 population at 102.3 million and average per capita income at about VND5.9 million a month, up 9.3% from 2024, according to its fourth-quarter 2025 socio-economic report. Sweet drinks are already routine, since the average person drank nearly 70 liters of sugary drinks in 2023, four times the 2009 level, the World Health Organization reports. Each income gain moves rural households from occasional to regular purchases, which is why Everyday Hydration holds 34.0% of value. Suppliers that keep core packs within a daily budget capture most of this demand.
Tourism and out-of-home recovery lift higher-margin sales
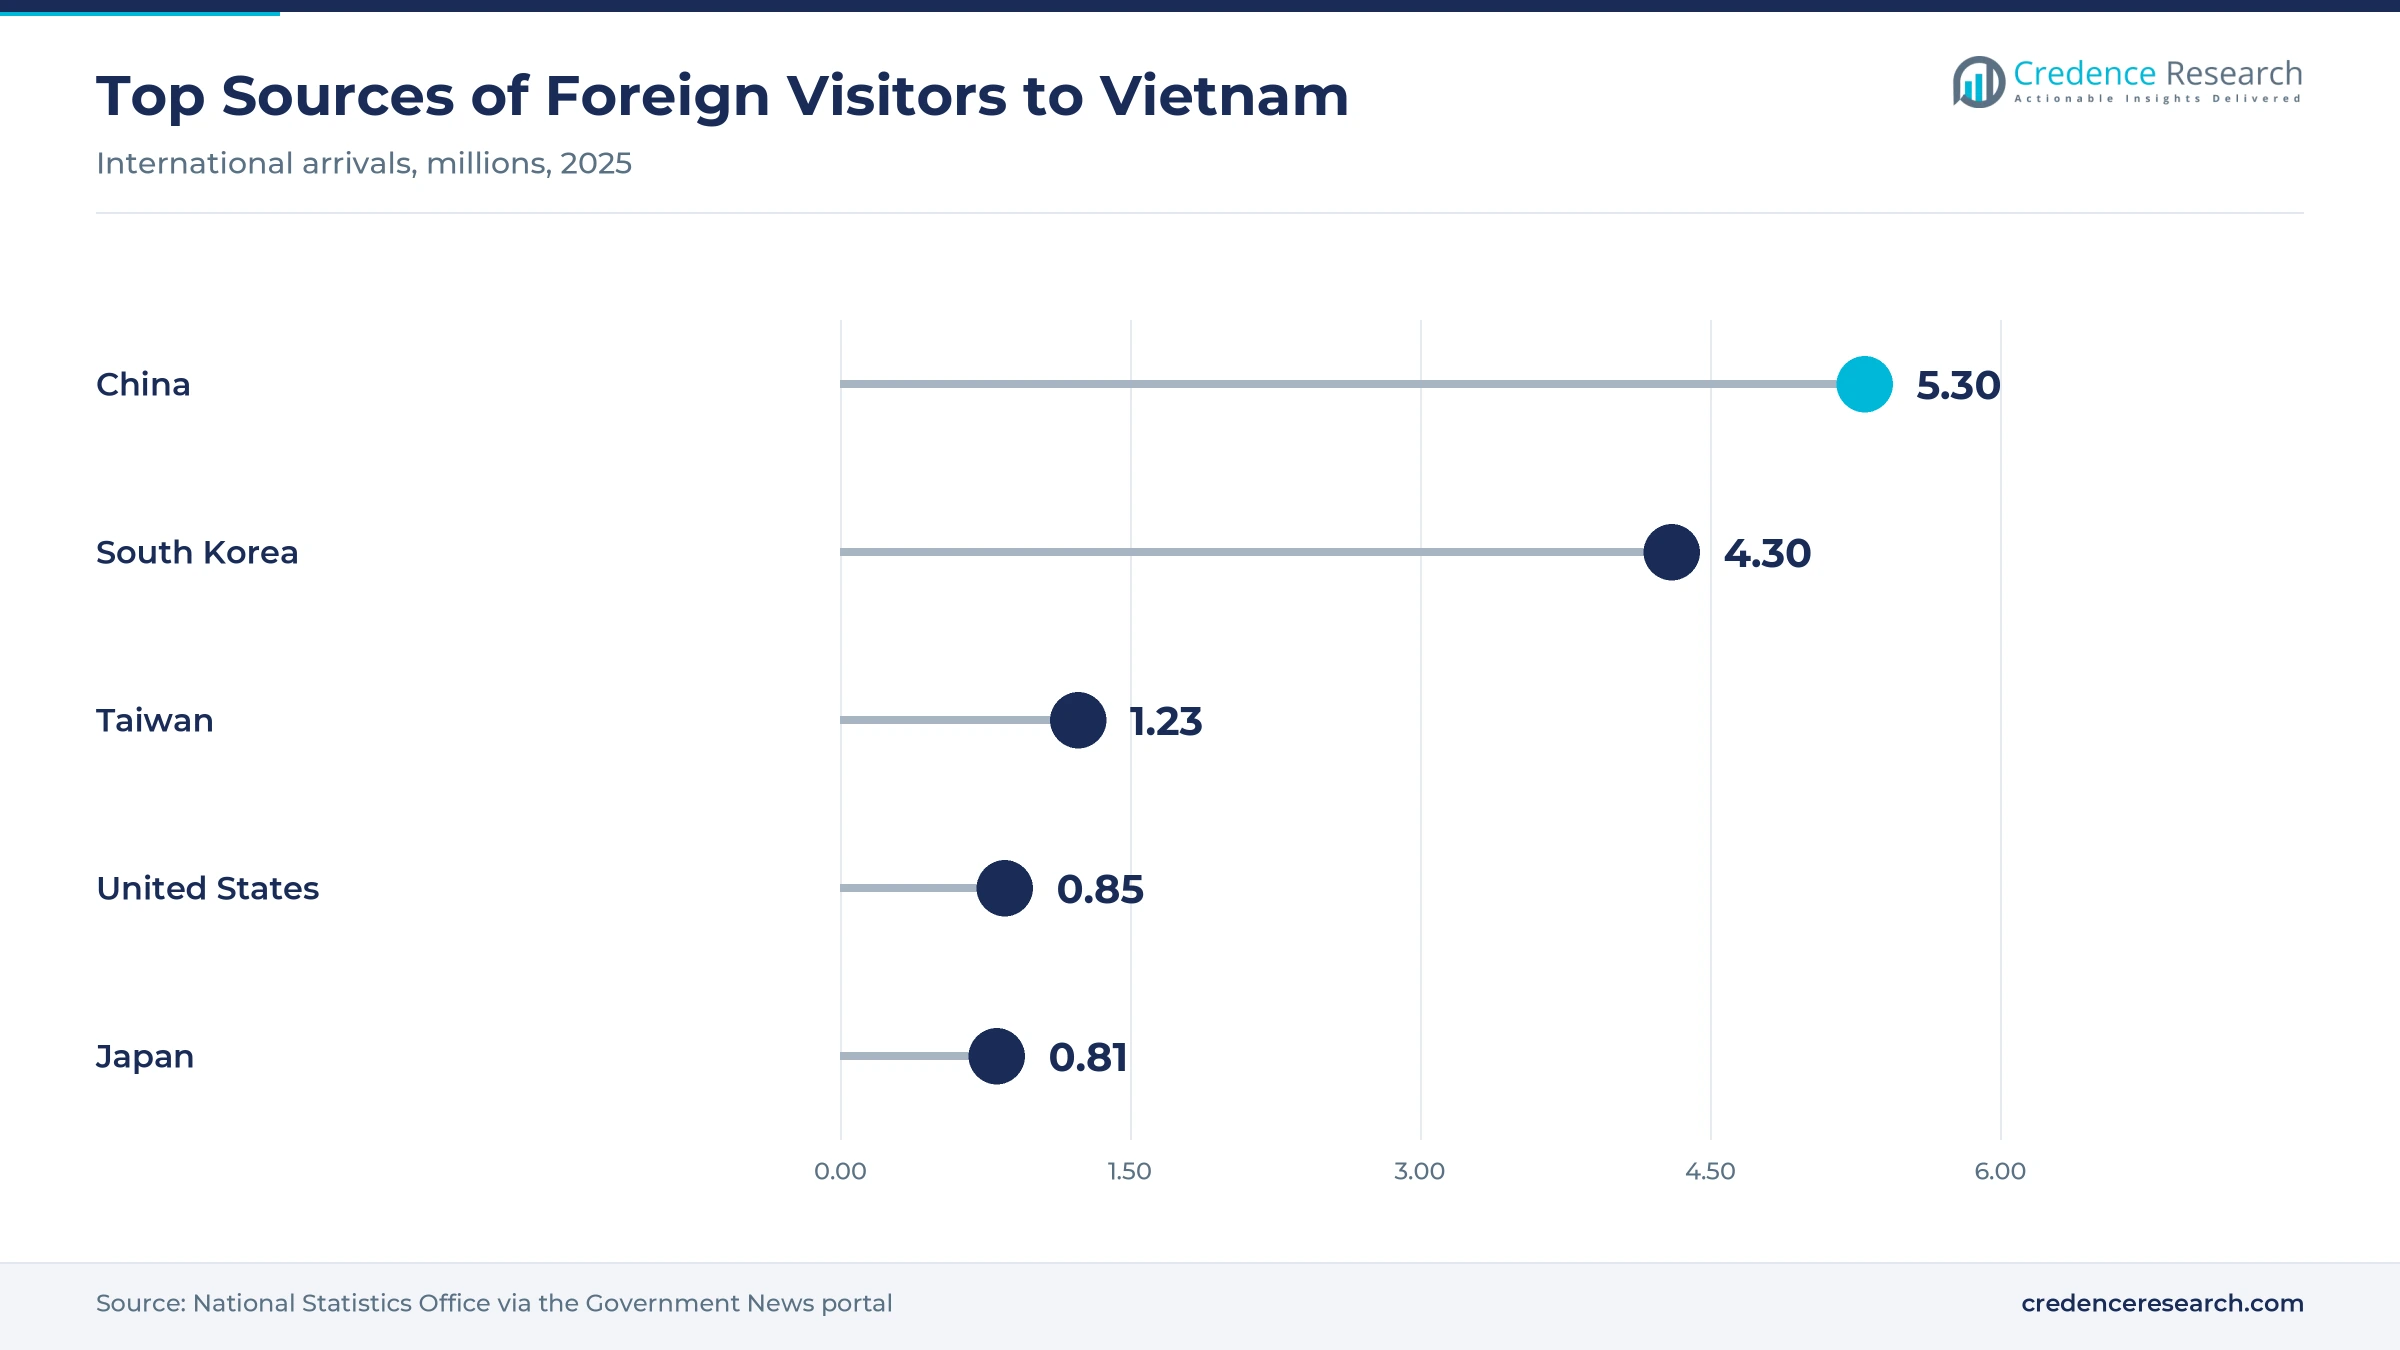
Out-of-home occasions carry the highest margins per serving, and they are growing faster than household shopping. Vietnam received nearly 21.2 million international visitors in 2025, up 20.4% from 2024 and 17.8% above the 2019 level, the government news portal reported. Domestic spending followed, as accommodation and food services revenue rose 14.6% in 2025 to more than VND843.1 trillion, VnEconomy reported, citing the National Statistics Office. Ho Chi Minh City alone targets 61 million visitors in 2026, including 11 million international guests, Tuoi Tre News reported in January 2026. Growth among catering and food service operators lifts orders for chilled cans, single-serve bottles and fountain drinks, so foodservice gains value faster than its volume share suggests.
Manufacturing and distribution investment adds capacity near buyers
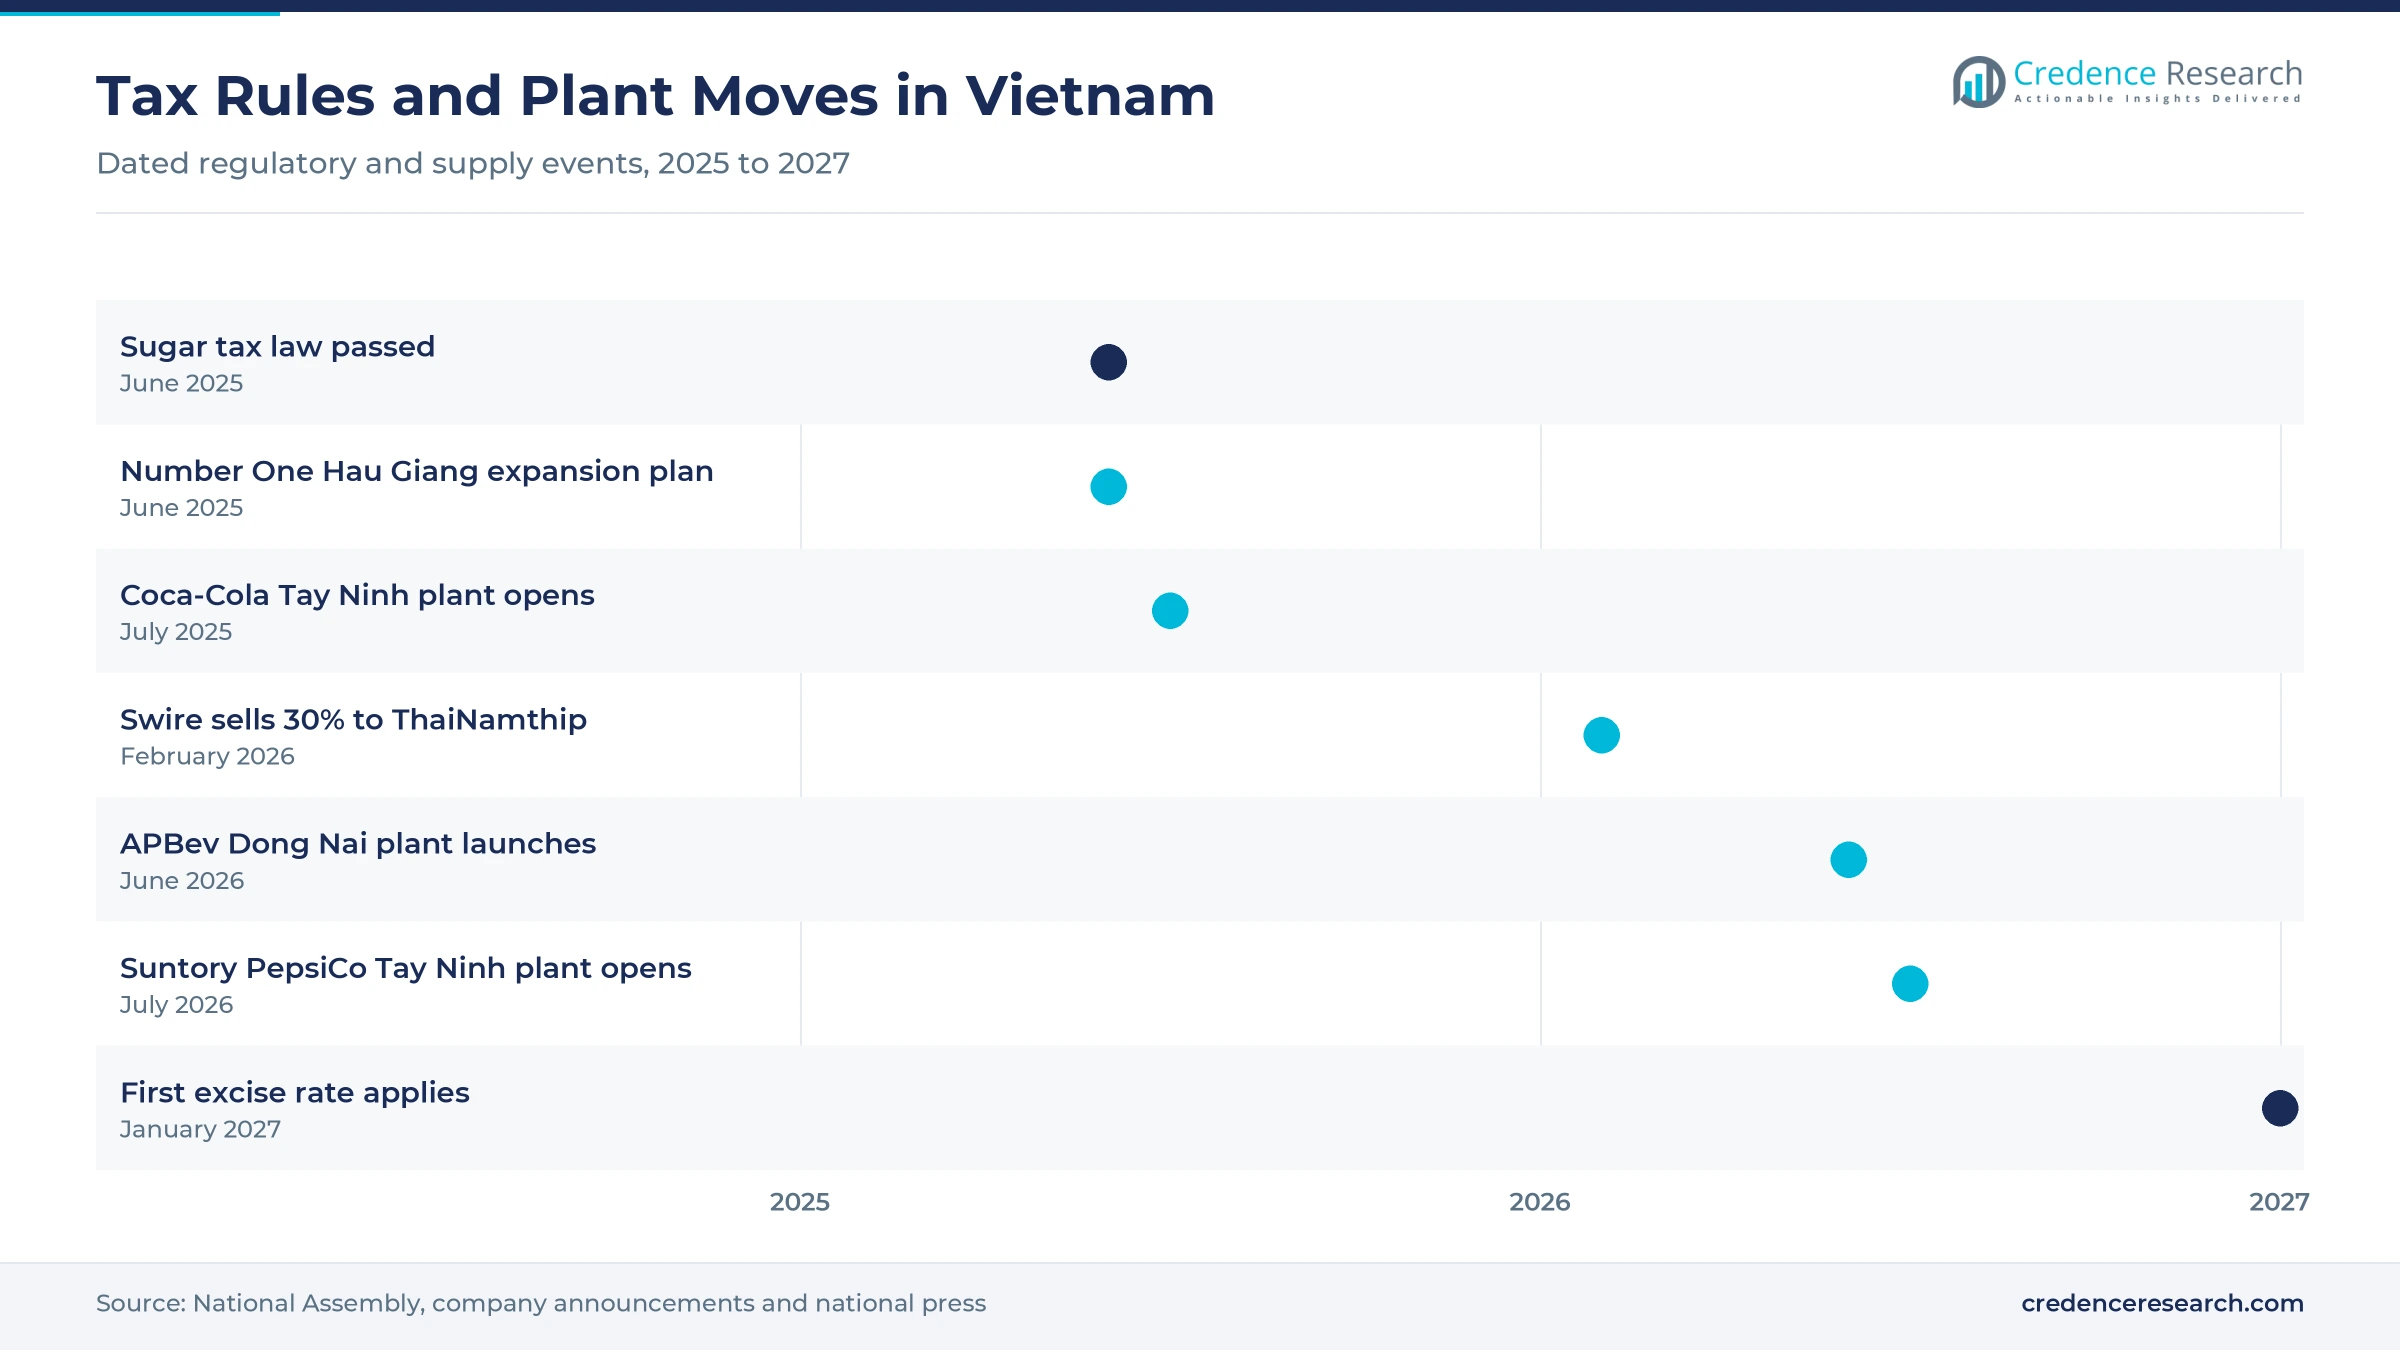
Bottlers are building large plants close to the main consumption centers, which lowers delivery cost and widens pack ranges. Coca-Cola opened its USD136 million Tay Ninh plant on July 11, 2025, with capacity of up to 1 billion liters a year, The Investor reported. A year later, on July 10, 2026, Suntory PepsiCo inaugurated a Tay Ninh plant with designed capacity of about 1.244 billion liters a year, its sixth factory in Vietnam. Local capital is moving as well, since Tan Hiep Phat’s Number One Hau Giang plans to expand its Mekong Delta plant from 300 million liters to 1 billion liters a year in phases. Capacity on this scale keeps shelf competition intense through 2030 and gives modern retail buyers more room to negotiate promotions.
Minimart chains extend chilled shelf space to the provinces
Modern minimart chains give suppliers refrigerated shelf space and reliable payment, which suits single-serve drinks and new flavors. WinCommerce opened 764 WinMart+ outlets in 2025 and plans 1,000 more in 2026, focused on the north and central regions, Viet Nam News reported in February 2026. Retail spending supports the rollout, because gross retail sales of goods and services rose 9.2% in 2025 at current prices, the National Statistics Office estimates. TCP Vietnam says its Red Bull and Warrior brands already reach more than 100,000 retail points through traditional and modern trade, VIR reported in July 2026. Modern retail therefore gains share each year, which favors brands that fund coolers and shelf planning.
Lower sugar, recycled bottles and clean labels gain ground
Shift toward lower-sugar recipes ahead of the 2027 excise tax
Recipe change has become a tax decision, because the excise tax applies only above a fixed sugar level. The National Assembly passed Law No. 66/2025/QH15 on June 14, 2025, with almost 94% of deputies in favor, and the rates and threshold are shown in the pricing table. The World Health Organization notes that one 330-milliliter can of sweet soda can hold 40 grams of sugar, far above that threshold. Milk drinks, natural mineral and bottled water, and 100% fruit or vegetable juice are excluded, Vietstock reported. Bottlers are reformulating core colas, teas and energy drinks and widening zero-sugar lines before 2027, which also shifts promotion budgets toward exempt water and pure juice.
Rise of recycled PET and in-house packaging
Producer responsibility rules make fillers pay for collection and recycling, so packaging is now a cost item. Suntory PepsiCo’s new Tay Ninh plant is equipped to run 100% recycled PET packaging, Viet Nam News reported in July 2026. Number One Hau Giang plans annual output of 30,000 tons of recycled plastic packaging as part of its expansion, The Investor reported in June 2025. Can recycling is at an earlier stage, since factories circulated only up to 850 tons of used aluminum cans in 2024 trials, Viet Nam News reported. An amended Law on Environmental Protection was expected to finalize packaging provisions by mid-2026. Suppliers with in-house recycled resin will pay lower compliance costs and win retailers that set packaging targets.
Opening in natural, preservative-free premium drinks
Premium natural drinks are an opening for suppliers that can fill without preservatives, a claim mass brands find harder to make. APBev launched its MátTa! brand in Ho Chi Minh City on June 2, 2026, backed by an USD80 million plant in Dong Nai using German aseptic bottling, with initial capacity of 70 million liters a year, Viet Nam News reported. The company targets 500,000 retail outlets and annual sales of 150 million liters. Tan Hiep Phat has filled Zero Degree green tea on aseptic cold-filling lines for about two decades and exports it to more than 20 countries and territories, the company says. Clean-label tea and herbal drinks can therefore carry premium price tiers and lift value per liter.
Opening in direct channels beyond wholesalers
Direct channels are an opening for brand owners that have relied on wholesalers to reach shops. Masan Consumer reported 2025 growth of 66.3% in e-commerce, close to 53% in hotels, restaurants and cafes, and over 14% in modern trade, even as its total sales were roughly flat, according to a Masan Group release. Bach Hoa Xanh plans about 1,000 new stores in 2026, mainly in the north, and Hanoi plans to close more than 200 temporary and informal markets in 2026 and 2027, Viet Nam News reported. Suppliers that sell directly to chains and platforms gain pricing data and shelf control, and the same skills carry over into packaged consumer goods categories.
Tax price points, shop reach and recycling gaps test sellers
How much will the excise tax disturb shelf price points?
Small shops sell drinks at round price points, so any tax pass-through is visible to buyers. Lotte Mart lists a 320-milliliter can of 7 Up at VND9,300 in November 2026, and adding even a few hundred dong breaks the VND10,000 price point that many shops use. Full-sugar colas, sweet teas and energy drinks carry the heaviest burden from 2027, while exempt water and pure juice do not. Suppliers will likely respond with smaller packs, reformulation and selective price rises, which squeezes margins in 2027 and 2028.
Can new brands reach enough shops to compete?
Distribution scale is the main barrier for challengers, because traditional shops are numerous and each needs credit and frequent delivery. Masan Consumer expanded its coverage to about 420,000 points of sale in 2025, up roughly 70%, after rebuilding its distribution model, according to the company. A newcomer such as APBev therefore needs years to approach its own 500,000-outlet target. Brands without that reach depend on wholesalers, which take margin and weaken control of the shelf price that buyers finally pay.
Will recycling gaps raise packaging costs?
Vietnam lacks the plants that would make recycled packaging cheap for fillers. Bottle-to-bottle PET recycling is still done largely in Thailand and Singapore, a regulator told Viet Nam News in September 2025, and no domestic plant produces rolled aluminum from used cans, according to the Vietnam Beverage Association. Recycling industrial parks were only expected to open in 2026. Until local capacity arrives, recycled resin and can sheet stay imported, which adds freight and currency risk for every filler.
Will household business tax reform thin the shop network?
Traditional shops carry most soft drink volume but face new compliance costs that may reduce their number. The lump-sum tax regime for household businesses was abolished on Jan. 1, 2026, Viet Nam News reported, so many family shops must now keep records and issue invoices. Modern trade still handles only about 15% to 20% of rural retail sales, so suppliers depend on these shops outside the cities. Shop closures or slower restocking would hit economy packs first, while minimart chains absorb part of the volume.
The Red River Delta leads as the central coast gains
| Region | Value, 2025 (USD billion) | Share, 2025 | CAGR, 2026–2035 |
|---|---|---|---|
| Red River Delta | 2.14 | 38.0% | 6.5% |
| Southeast Vietnam | 1.69 | 30.0% | 6.2% |
| North Central and Central Coastal | 1.12 | 20.0% | 7.2% |
| Mekong Delta and Central Highlands | 0.67 | 12.0% | 6.5% |
The Red River Delta leads on Hanoi incomes and dense retail
The Red River Delta held 38.0% of 2025 soft drinks value and grows at 6.5% a year. Hanoi recorded the highest monthly per capita income of any province in 2025, DTiNews reported from National Statistics Office survey data, and convenience chains are concentrating there, with Circle K above 190 Hanoi stores and GS25 opening its 50th Hanoi outlet in November 2025. Suntory PepsiCo runs a plant in Bac Ninh and Coca-Cola a plant in Hanoi, which keeps northern delivery costs low. This retail mix favors chilled single-serve drinks over large take-home bottles.
Southeast Vietnam combines high incomes with the newest plants
Southeast Vietnam held 30.0% of 2025 soft drinks value and grows at 6.2% a year. Average per capita income in the Southeast reached nearly VND7.5 million a month in 2025, the highest of the six statistical regions, according to the National Statistics Office survey reported by DTiNews. The region hosts both Tay Ninh plants described above, as well as Suntory PepsiCo factories in Dong Nai and Ho Chi Minh City, so delivery costs are the lowest in the country. APBev also chose Ho Chi Minh City for its launch, which shows the region’s role as the test market for new brands.
North central and central coastal gains from tourism and new stores
North Central and Central Coastal held 20.0% of 2025 soft drinks value and grows fastest at 7.2% a year. Tan Hiep Phat’s Number One Chu Lai plant in Quang Nam has capacity of 500 million liters a year, The Investor reported, while Coca-Cola runs a plant in Da Nang and Suntory PepsiCo one in Quang Nam. The WinMart+ store program noted above targets the north and central regions in 2026. Coastal resort demand adds restaurant and hotel sales, which favors cans and chilled bottles.
The Mekong Delta and Central Highlands rely on traditional shops
The Mekong Delta and Central Highlands held 12.0% of 2025 soft drinks value and grow at 6.5% a year. Both areas are mainly rural, so most drinks move through family shops and markets, where the modern trade share noted earlier is lowest. Suntory PepsiCo operates a plant in Can Tho, and the Number One Hau Giang expansion described above will add local capacity for tea and energy drinks. Large PET bottles of water and soda dominate baskets, and growth follows farm incomes more than new formats.
Tay Ninh plants and a bottler stake sale mark 2025 to 2026
| Development | Status and market relevance |
|---|---|
| In June 2025, the National Assembly passed Law No. 66/2025/QH15, adding an excise tax on high-sugar soft drinks from 2027. | In force; first rate applies from Jan. 1, 2027 |
| In July 2025, Coca-Cola opened its USD136 million Tay Ninh plant with five lines and LEED Gold certification. | Operating; the largest plant in the Coca-Cola system in Vietnam |
| In February 2026, Swire Pacific sold a 30% interest in Coca-Cola Indochina, the holding company of its Vietnam bottler, to ThaiNamthip for about USD221.1 million. | Completed Feb. 27, 2026 |
| In June 2026, APBev entered the market with its MátTa! brand and an USD80 million aseptic plant in Dong Nai. | Operating; initial capacity of 70 million liters a year |
| In July 2026, Suntory PepsiCo inaugurated a USD300 million plant in Tay Ninh, its sixth in Vietnam. | Operating; built for cans and PET bottles |
Aseptic filling and lighter bottles cut cost per liter
- Aseptic cold filling lets tea and juice be sold without preservatives, and Tan Hiep Phat now runs a seventh-generation GEA system for Zero Degree green tea.
- Lightweight PET cuts resin cost and emissions, as Tan Hiep Phat halved its tea bottle from 27 grams to 13.5 grams and cut carbon dioxide by 20% per bottle.
- Green plant design lowers energy and water use, and Coca-Cola’s Tay Ninh plant is the first food and beverage factory in Vietnam with LEED Gold certification.
- Automated warehousing speeds dispatch to distributors, and Suntory PepsiCo’s Tay Ninh site has a fully automated 15,000-square-meter warehouse holding 43,000 pallets.
Need a Custom Version of This Report?
Tailor the scope, geography, or segments to your exact requirements.
- Custom geography or segment scope
- Direct access to our analyst team
Four groups lead ahead of a long local tail
Competition is led by two global bottling systems and two regional groups, followed by specialists and a long local tail. Suntory PepsiCo Vietnam sells Pepsi, 7 Up, Sting and Tea+ from six plants. Coca-Cola Beverages Vietnam is controlled by Swire Pacific, and Thailand’s ThaiNamthip has held an indirect 30% interest since Feb. 27, 2026. Tan Hiep Phat sells Zero Degree green tea, Dr Thanh herbal tea and Number 1 energy drinks, while URC Vietnam sells C2 bottled tea and Red Dragon energy drinks from five factories. TCP Vietnam markets Red Bull and Warrior, and Masan Consumer competes in energy drinks with Wake-up 247. La Vie, part of Nestlé, focuses on bottled mineral water. Suppliers compete less on recipe than on cooler placement, pack price points, low-sugar versions and access to small shops.
How is supply organized, and where do margins sit?
Supply is concentrated at the top, where Suntory PepsiCo, Coca-Cola, URC Vietnam and Tan Hiep Phat each run several national plants and their own distributor networks. Below them sit energy drink specialists such as TCP Vietnam, diversified consumer groups such as Masan Consumer, water bottlers such as La Vie, and many local fillers that compete on price or contract work. Entry barriers lie in distribution rather than production, because reaching hundreds of thousands of shops requires trucks, coolers and credit. Margins are thinnest for bottlers of water and economy soda and highest in cafes and restaurants, where one can sells at a large mark-up.
Which companies shape soft drink supply in Vietnam?
| Company | Type | Role in the market |
|---|---|---|
| Suntory PepsiCo Vietnam Beverage | Global bottler | Pepsi, 7 Up, Sting and Tea+ from six plants including Tay Ninh |
| Coca-Cola Beverages Vietnam (Swire Pacific) | Global bottler | Coca-Cola, Sprite and Fanta from plants in Tay Ninh, Hanoi and Da Nang |
| Tan Hiep Phat Group | Local beverage group | Zero Degree green tea, Dr Thanh herbal tea and Number 1 energy drinks |
| URC Vietnam (Universal Robina) | Regional beverage maker | C2 bottled tea and Red Dragon energy drinks from five factories |
| TCP Vietnam (TCP Group) | Energy drink specialist | Red Bull and Warrior energy drinks through more than 100,000 retail points |
| Masan Consumer | Diversified consumer group | Wake-up 247 energy drinks and other beverages through its own distribution network |
| La Vie (Nestlé) | Water bottler | La Vie natural mineral water from plants in Tay Ninh (former Long An) and Hung Yen |
Reformulation and shop reach will decide the next leaders
Credence Research’s view is that reformulation and shop reach, not new flavors, will decide which suppliers gain share after the excise tax starts in 2027. Sodas still lead value, but the tax turns sugar into a cost item, and the far higher rate recommended by the World Health Organization shows the direction of policy risk. Bottled water and pure juice gain a structural price advantage. Suppliers with modern lines in Tay Ninh and the Mekong Delta can reformulate and repack quickly, while smaller makers may need contract filling. The most useful investments are lower-sugar core recipes, coolers in new minimarts and direct supply to online platforms.
Bottler volumes and shelf prices anchor the estimate
The report uses 2025 as the base year and forecasts values to 2035. Market values come from the Credence Research model, and segment and regional splits are Credence Research estimates. The size was cross-checked against published bottler volumes, estimated pack prices and the capacity of new plants. Evidence comes from World Health Organization material, National Statistics Office data, laws, company filings and releases, retail listings and national press. No interviews or surveys were conducted for this report, and alcoholic drinks and dairy milk are excluded.
Water, cans and modern retail carry growth to 2035
Vietnam soft drinks value should rise from USD 6.01 billion in 2026 to USD 10.65 billion by 2035, with growth coming from water, cans, out-of-home sales and premium tea rather than from more full-sugar soda per person. Bottled Water should expand at 7.9% a year as the tax widens its price advantage. E-commerce should grow at 10.5% a year from a small base, and modern retail should keep taking share from corner shops. The central coast should gain share as tourism and store openings spread. The main risk is a further tax increase, although early reformulation could turn it into an advantage for prepared bottlers.
What separates the downside, base and upside paths to 2035?
The range of outcomes depends mainly on tax policy and on how quickly bottlers reformulate. A downside path follows if the excise rate rises again after 2028 and full-sugar volume falls faster than prices rise. The base case assumes the 8% and 10% rates stay in place, most core brands cut sugar below the threshold and water keeps gaining share. An upside path needs continued tourism growth, fast minimart expansion outside the two largest cities and a strong shift toward premium tea and cans.
| Scenario | CAGR, 2026–2035 | Value, 2035 | What has to hold |
|---|---|---|---|
| Downside | 4.9% | USD 9.24 billion | Excise rate rises again after 2028 and full-sugar volume falls faster than prices rise |
| Base | 6.57% | USD 10.65 billion | Tax stays at 8% then 10% and most core brands reformulate below the threshold |
| Upside | 7.9% | USD 11.91 billion | Tourism keeps growing and minimarts, premium tea and cans expand quickly in the provinces |
Frequently Asked Questions
How big is the Vietnam soft drinks market?
Which region leads soft drink sales in Vietnam?
Which region grows fastest?
Which product type grows fastest?
How will the sugar tax affect soft drink prices?
Why does tourism matter for soft drink demand?
How concentrated is supply?
Which companies are active in the market?
Table of Content
Chapter 1 Market Segmentation
- 1.1 Segmentation Framework
- 1.1.1 Product and Service Classification
- 1.1.2 Application and End-Use Classification
- 1.1.3 Technology and Solution Classification
- 1.1.4 Customer and Distribution Channel Classification
- 1.1.5 Geographic Segmentation
- 1.1.6 Market Segment Definitions and Boundaries
- 1.2 By Product Type
- 1.2.1 Carbonated Soft Drinks
- 1.2.2 RTD Tea
- 1.2.3 Other Functional and Juice Beverages
- 1.2.4 Bottled Water
- 1.3 By Purchase Occasion
- 1.3.1 Everyday Hydration
- 1.3.2 Meals and Socializing
- 1.3.3 On-the-go Refreshment
- 1.3.4 Energy and Performance
- 1.4 By Packaging Format
- 1.4.1 PET Bottles
- 1.4.2 Aluminum Cans
- 1.4.3 Cartons
- 1.4.4 Glass and Other Formats
Chapter 2 Introduction
- 2.1 Report Objectives and Scope
- 2.2 Product Definition and Industry Terminology
- 2.3 Market Inclusions and Exclusions
- 2.4 Research Process
- 2.4.1 Primary Research and Expert Interviews
- 2.4.2 Secondary Research and Source Review
- 2.4.3 Top-Down and Bottom-Up Estimation
- 2.4.4 Data Triangulation and Verification
- 2.5 Market Size Measurement Basis
- 2.5.1 2025: USD 5.62 billion → 2035: USD 10.65 billion
- 2.6 Historical and Forecast Reference Periods
- 2.6.1 Historical Period: 2018-2025
- 2.6.2 Base Year: 2025
- 2.6.3 Forecast Period: 2025-2035
- 2.7 Research Assumptions and Limitations
Chapter 3 Executive Summary
- 3.1 Market Snapshot and Key Findings
- 3.2 Base-Year Market Size, 2025
- 3.3 Forecast Market Size, 2035
- 3.4 Revenue and Volume Growth Outlook
- 3.5 Key Demand and Supply Indicators
- 3.6 Leading Market Segments
- 3.7 Fastest-Growing Market Opportunities
- 3.8 Regional Performance Highlights
- 3.9 Technology and Industry Transformation
- 3.10 Competitive Landscape Summary
- 3.11 Analyst View and Strategic Implications
Chapter 4 Vietnam Soft Drinks Market Trends and Developments
- 4.1 Historical Industry Development, 2018-2025
- 4.2 Recent Market Trends and Developments
- 4.3 Demand and Customer Behavior Trends
- 4.4 Technology and Product Innovation
- 4.5 Artificial Intelligence, Automation and Digitalization
- 4.6 Local Manufacturing and Supply Chain Realignment
- 4.7 Industry Partnerships, Mergers and Acquisitions
- 4.8 Sustainability and Circular Economy Developments
- 4.9 Government and Private Sector Investment Trends
- 4.10 Emerging Business Models and Commercialization
- 4.11 Industry Developments and Announcements
Chapter 5 Vietnam Soft Drinks Market Production, Supply and Demand Analysis
- 5.1 Demand Trend and Consumption Analysis, 2018-2025
- 5.2 Demand Forecast, 2025-2035
- 5.3 Production and Output Trend, 2018-2025
- 5.4 Production and Output Forecast, 2025-2035
- 5.5 Installed Capacity and Capacity Utilization
- 5.6 Company-Wise Production Plants and Statistics
- 5.6.1 Installed Production Capacity
- 5.6.2 Actual Production
- 5.6.3 Planned Capacity and Expansion Targets
- 5.7 Supply Chain Structure and Procurement Trends
- 5.8 Supply-Demand Gap and Bottlenecks
- 5.9 Import Dependence and Sourcing Structure
- 5.10 Contract Manufacturing and Outsourcing
- 5.11 Regional Supply and Demand Concentration
Chapter 6 Vietnam Soft Drinks Market Pricing Analysis
- 6.1 Pricing Structure and Measurement
- 6.2 Historical Pricing Trends, 2018-2025
- 6.3 Pricing Outlook, 2025-2035
- 6.4 Average Selling Price and Unit Economics
- 6.5 Pricing by Product and Market Segment
- 6.6 Geographic Pricing Differences
- 6.7 Key Input, Energy, Labor and Logistics Costs
- 6.8 Contract Pricing and Purchasing Models
- 6.9 Pricing Sensitivity and Competitive Positioning
- 6.10 Price, Margin and Profitability Implications
Chapter 7 Vietnam Soft Drinks Market Dynamics
- 7.1 Market Growth Drivers
- 7.1.1 Demand-Side Drivers
- 7.1.2 Technology and Innovation Drivers
- 7.1.3 Infrastructure and Investment Drivers
- 7.1.4 Regulatory and Policy Drivers
- 7.2 Market Restraints
- 7.2.1 Cost and Affordability Constraints
- 7.2.2 Technology and Adoption Barriers
- 7.2.3 Supply Chain and Operational Constraints
- 7.3 Market Challenges
- 7.3.1 Competitive Pressure and Margin Erosion
- 7.3.2 Skills, Infrastructure and Implementation Gaps
- 7.4 Emerging Market Opportunities
- 7.5 Market Dynamics Impact and Time-Horizon Assessment
Chapter 8 Vietnam Soft Drinks Value Chain Analysis
- 8.1 Industry Value Chain Overview
- 8.2 Upstream Suppliers and Critical Inputs
- 8.3 Technology and Component Providers
- 8.4 Manufacturing or Service Delivery
- 8.5 Distribution, Channel Partners and Integrators
- 8.6 Downstream Applications and End Users
- 8.7 Value Addition and Profit Pools
- 8.8 Vertical Integration and Outsourcing
- 8.9 Supplier Concentration and Risk
- 8.10 Supply Chain Localization and Resilience
Chapter 9 Vietnam Soft Drinks Market Regulations and Policies
- 9.1 Relevant Laws, Standards and Compliance Frameworks
- 9.2 Product, Service, Safety and Quality Requirements
- 9.3 Government Policies, Incentives and Subsidies
- 9.4 Imports, Exports and Trade Barriers
- 9.5 Public Procurement and Local Content Requirements
- 9.6 Environmental and Sustainability Compliance
- 9.7 Upcoming Policy Changes and Market Implications
Chapter 10 Vietnam Soft Drinks Market Hotspots and Opportunities
- 10.1 Market Opportunity Mapping and Growth Hotspots
- 10.2 High-Growth Applications and Customer Groups
- 10.3 Underserved Markets and White-Space Opportunities
- 10.4 Emerging Technology and Product Opportunities
- 10.5 New Capacity and Investment Hotspots
- 10.6 Market Entry and Expansion Opportunities
- 10.7 Distribution and Partnership Opportunities
- 10.8 Near-Term and Long-Term Commercial Potential
- 10.9 Opportunity Attractiveness and Execution Risks
Chapter 11 Vietnam Soft Drinks Market Outlook, 2025-2035
- 11.1 Market Size and Analysis
- 11.1.1 Revenue (Market Measurement: 2025: USD 5.62 billion → 2035: USD 10.65 billion)
- 11.1.2 Market Volume and Quantity Sold
- 11.1.3 Historical Market Size, 2018-2025
- 11.1.4 Base-Year Market Size, 2025
- 11.2 Market Forecast, 2025-2035
- 11.2.1 Revenue Forecast to 2035
- 11.2.2 Volume Forecast to 2035
- 11.2.3 CAGR and Year-on-Year Growth
- 11.2.4 Incremental Revenue Opportunity
- 11.3 Forecast Assumptions and Scenario Analysis
- 11.3.1 Base-Case Forecast
- 11.3.2 Optimistic and Conservative Scenarios
- 11.3.3 Technology, Pricing and Policy Sensitivities
- 11.4 Market Attractiveness and Growth Outlook
Chapter 12 Vietnam Soft Drinks Market Segmentation and Outlook
- 12.1 Segmentation Summary and Market Shares, 2025
- 12.2 Largest and Fastest-Growing Segments
- 12.3 By Product Type - Market Size and Forecast, 2025-2035
- 12.3.1 Segment Definition and Scope
- 12.3.2 Historical Market Size, 2018-2025
- 12.3.3 Revenue Forecast, 2025-2035
- 12.3.4 Volume Forecast, 2025-2035
- 12.3.5 Base-Year Market Share, 2025
- 12.3.6 Segment CAGR and Growth Drivers
- 12.3.7 Subsegment Market Size and Forecast
- 12.3.7.1 Carbonated Soft Drinks
- 12.3.7.2 RTD Tea
- 12.3.7.3 Other Functional and Juice Beverages
- 12.3.7.4 Bottled Water
- 12.3.8 Subsegment Pricing and Adoption Trends
- 12.3.9 Leading Suppliers and Competition
- 12.3.10 Regional Demand and Opportunities
- 12.4 By Purchase Occasion - Market Size and Forecast, 2025-2035
- 12.4.1 Segment Definition and Scope
- 12.4.2 Historical Market Size, 2018-2025
- 12.4.3 Revenue Forecast, 2025-2035
- 12.4.4 Volume Forecast, 2025-2035
- 12.4.5 Base-Year Market Share, 2025
- 12.4.6 Segment CAGR and Growth Drivers
- 12.4.7 Subsegment Market Size and Forecast
- 12.4.7.1 Everyday Hydration
- 12.4.7.2 Meals and Socializing
- 12.4.7.3 On-the-go Refreshment
- 12.4.7.4 Energy and Performance
- 12.4.8 Subsegment Pricing and Adoption Trends
- 12.4.9 Leading Suppliers and Competition
- 12.4.10 Regional Demand and Opportunities
- 12.5 By Packaging Format - Market Size and Forecast, 2025-2035
- 12.5.1 Segment Definition and Scope
- 12.5.2 Historical Market Size, 2018-2025
- 12.5.3 Revenue Forecast, 2025-2035
- 12.5.4 Volume Forecast, 2025-2035
- 12.5.5 Base-Year Market Share, 2025
- 12.5.6 Segment CAGR and Growth Drivers
- 12.5.7 Subsegment Market Size and Forecast
- 12.5.7.1 PET Bottles
- 12.5.7.2 Aluminum Cans
- 12.5.7.3 Cartons
- 12.5.7.4 Glass and Other Formats
- 12.5.8 Subsegment Pricing and Adoption Trends
- 12.5.9 Leading Suppliers and Competition
- 12.5.10 Regional Demand and Opportunities
- 12.6 Segment Growth Comparison
- 12.7 Segment Attractiveness and Priority Matrix
Chapter 13 Vietnam Soft Drinks Geographic Market Outlook, 2025-2035
- 13.1 Domestic Market Distribution and Demand Clusters
- 13.2 State- or Province-Wise Market Size and Forecast, 2025-2035
- 13.3 City and Metropolitan Market Outlook
- 13.4 Industrial, Manufacturing and Commercial Clusters
- 13.5 Geographic Concentration of Key End Users
- 13.6 Local Pricing and Purchasing Differences
- 13.7 Domestic Production Facilities and Capacity Map
- 13.8 Local Infrastructure and Project Pipeline
- 13.9 State-Level Policy and Incentive Differences
- 13.10 Subnational Investment Hotspots and Opportunities
- 13.11 Distribution and Logistics Networks
- 13.12 Domestic Competitive Footprint
Chapter 14 Vietnam Soft Drinks Technology, Innovation and Sustainability Outlook
- 14.1 Technology Landscape and Maturity
- 14.2 Product, Process and Service Innovation
- 14.3 AI, Automation and Digital Tools in the Industry
- 14.4 Technology Adoption and Performance Benchmarking
- 14.5 Innovation Pipeline and R&D Investment
- 14.6 Patent and Intellectual Property Trends
- 14.7 Energy Efficiency and Resource Management
- 14.8 Sustainability, Recycling and Circularity
- 14.9 Technology Roadmap, 2025-2035
- 14.10 Risks of Obsolescence and Technology Substitution
Chapter 15 Vietnam Soft Drinks Market Key Strategic Imperatives
- 15.1 Growth and Market Entry Priorities
- 15.2 High-Return Products and Segments
- 15.3 Pricing, Profitability and Cost Optimization
- 15.4 Technology Investment and Product Differentiation
- 15.5 Supply Chain Localization and Resilience
- 15.6 Distribution and Customer Acquisition
- 15.7 Partnership, Acquisition and Capacity Strategy
- 15.8 Regional Expansion Priorities
- 15.9 Short-, Medium- and Long-Term Actions
Chapter 16 Competition Outlook
- 16.1 Industry Competition Characteristics
- 16.2 Market Structure and Concentration
- 16.3 Market Share and Competitive Positioning, 2025
- 16.4 Company-Wise Revenue and Product Benchmarking
- 16.5 Production and Service Capacity Benchmarking
- 16.6 Technology, Pricing and Differentiation
- 16.7 Regional Footprint and Distribution Strength
- 16.8 Mergers, Acquisitions and Strategic Alliances
- 16.9 New Entrants and Competitive Threats
- 16.10 Porter's Five Forces and Industry Attractiveness
- 16.11 Competitive Outlook, 2025-2035
Chapter 17 Company Profiles
- 17.1 Company Coverage and Selection Criteria
- 17.2 Suntory PepsiCo Vietnam Beverage
- 17.2.1 Business Description
- 17.2.2 Company Ownership and Geographic Presence
- 17.2.3 Product and Service Portfolio
- 17.2.4 Manufacturing and Operating Footprint
- 17.2.5 Production Capacity and Expansion Plans
- 17.2.6 Financial Performance and Investment
- 17.2.7 Market Share and Competitive Position
- 17.2.8 Technology and Innovation Capabilities
- 17.2.9 Strategic Alliances or Partnerships
- 17.2.10 Recent Developments
- 17.2.11 Growth Strategy and Outlook
- 17.3 Coca-Cola Beverages Vietnam (Swire Pacific)
- 17.4 Tan Hiep Phat Group
- 17.5 URC Vietnam (Universal Robina)
- 17.6 TCP Vietnam (TCP Group)
- 17.7 Masan Consumer
- 17.8 La Vie (Nestlé)
- 17.9 Other Relevant Market Participants
Note: Every listed company is profiled on the structure shown under the first company. The company list is preliminary and may change based on research findings, market developments, data availability and client requirements.
Chapter 18 Disclaimer
- 18.1 Research and Forecast Disclaimer
- 18.2 Data Source and Estimation Limitations
Note: The depth of individual sections depends on data availability for this market. Volume, capacity, trade and other unit-based metrics are included where applicable.

