
The largest consuming region trades up as prices rise
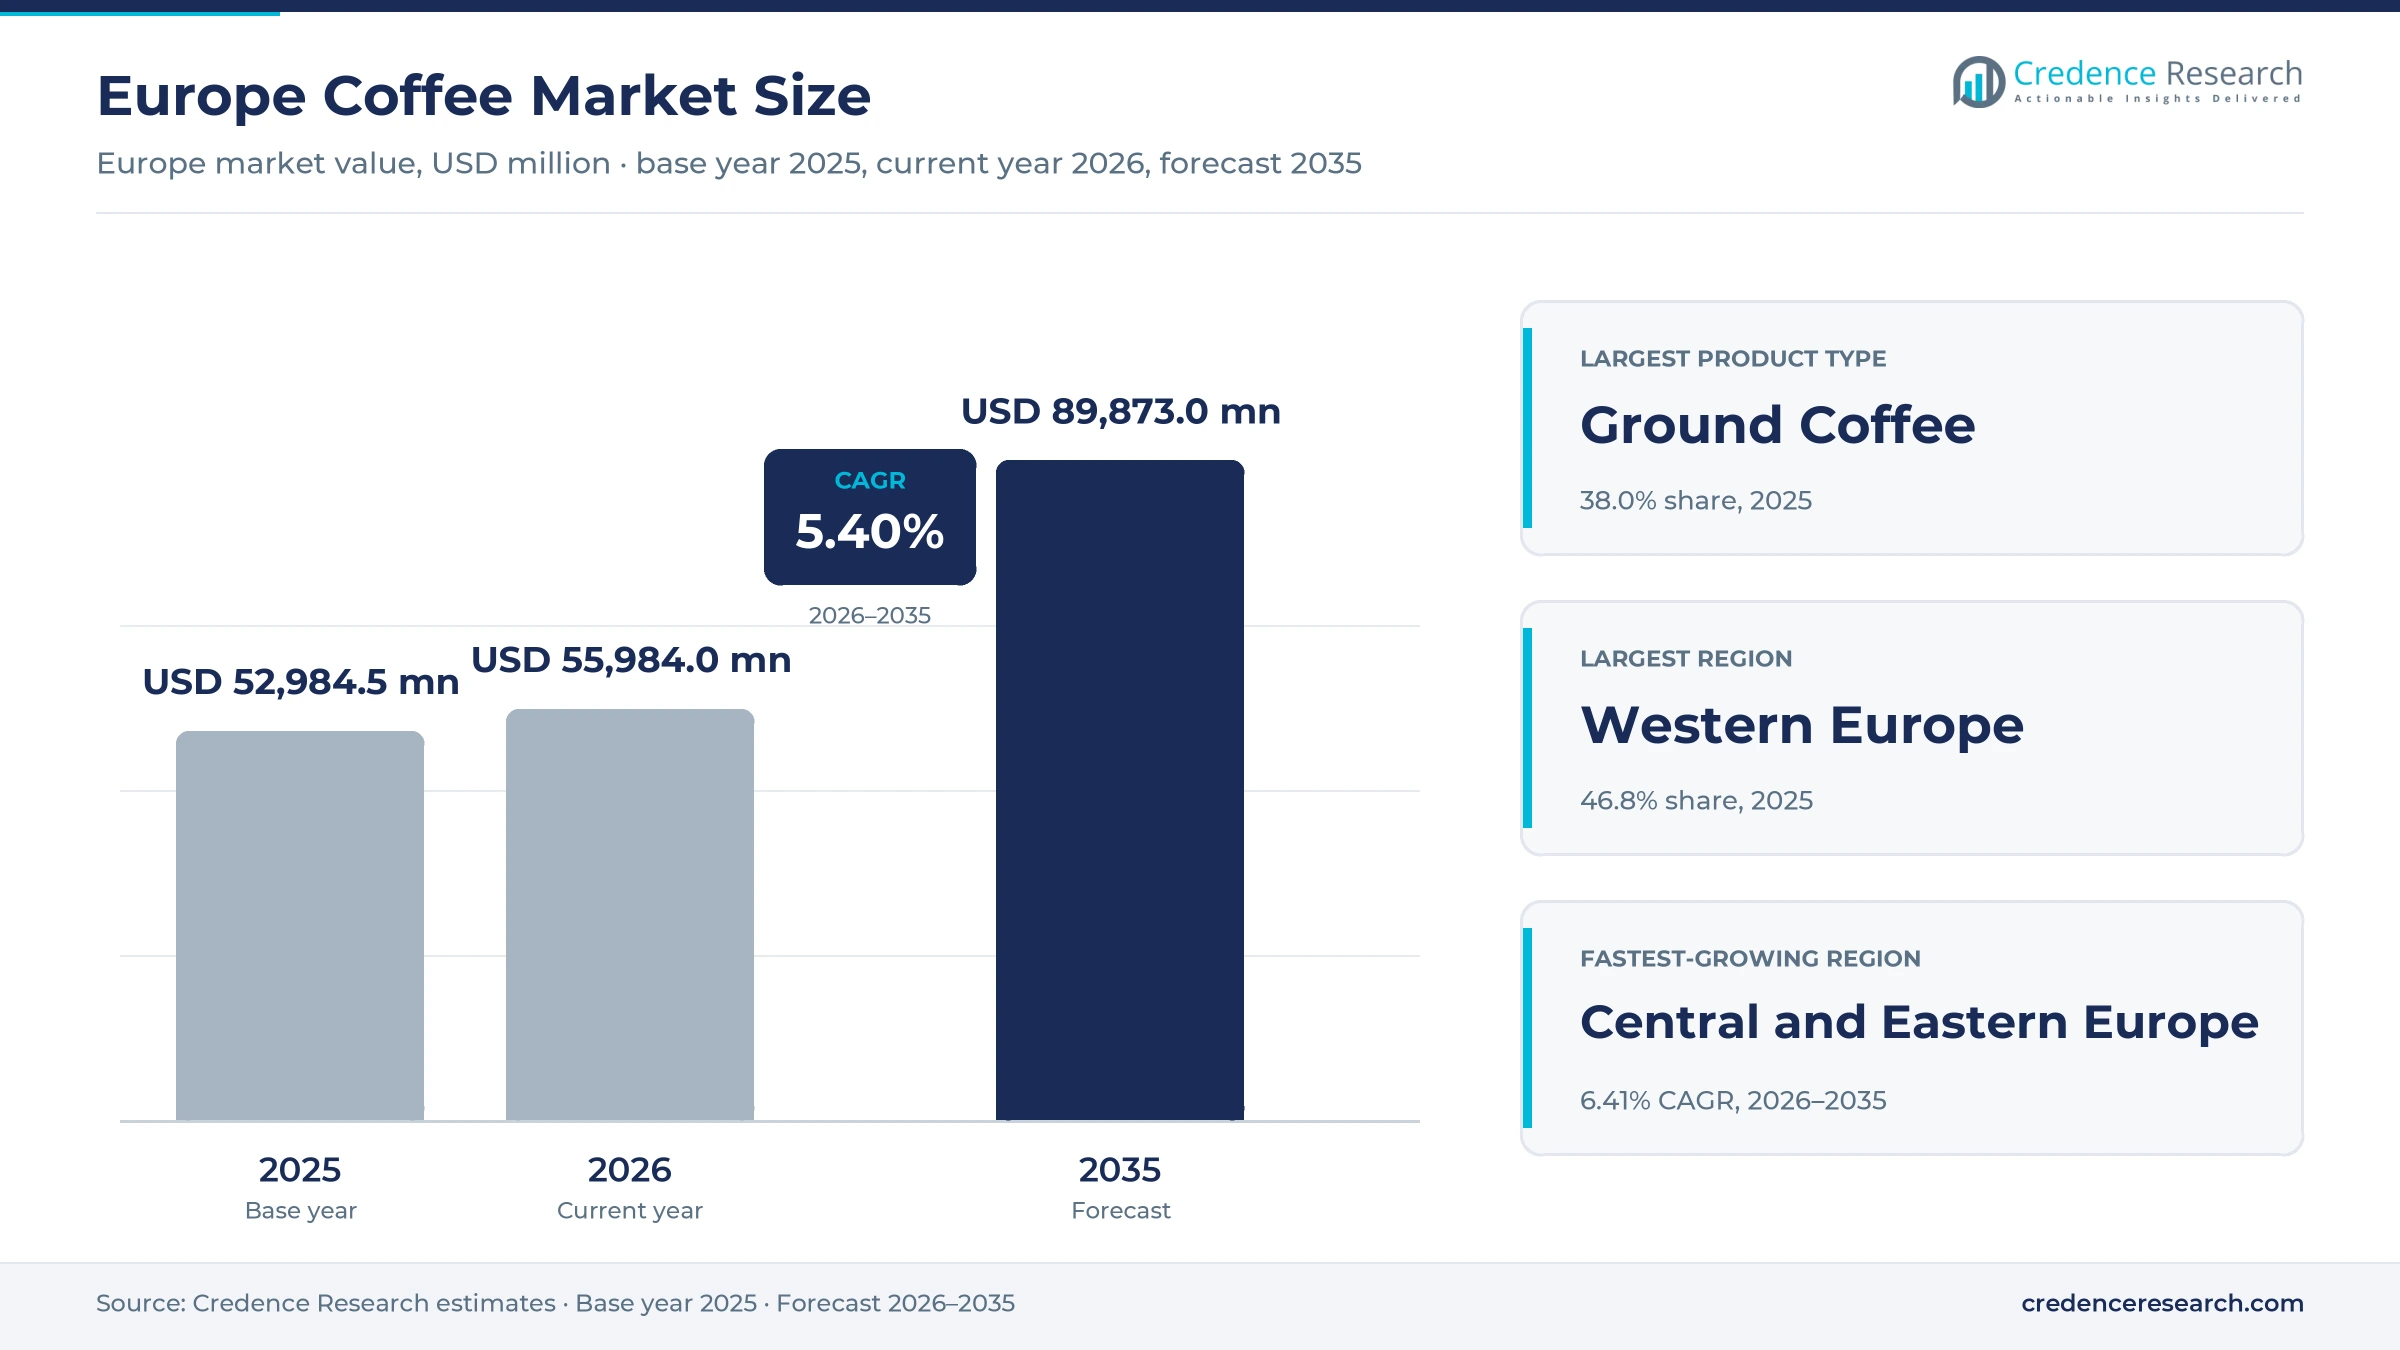
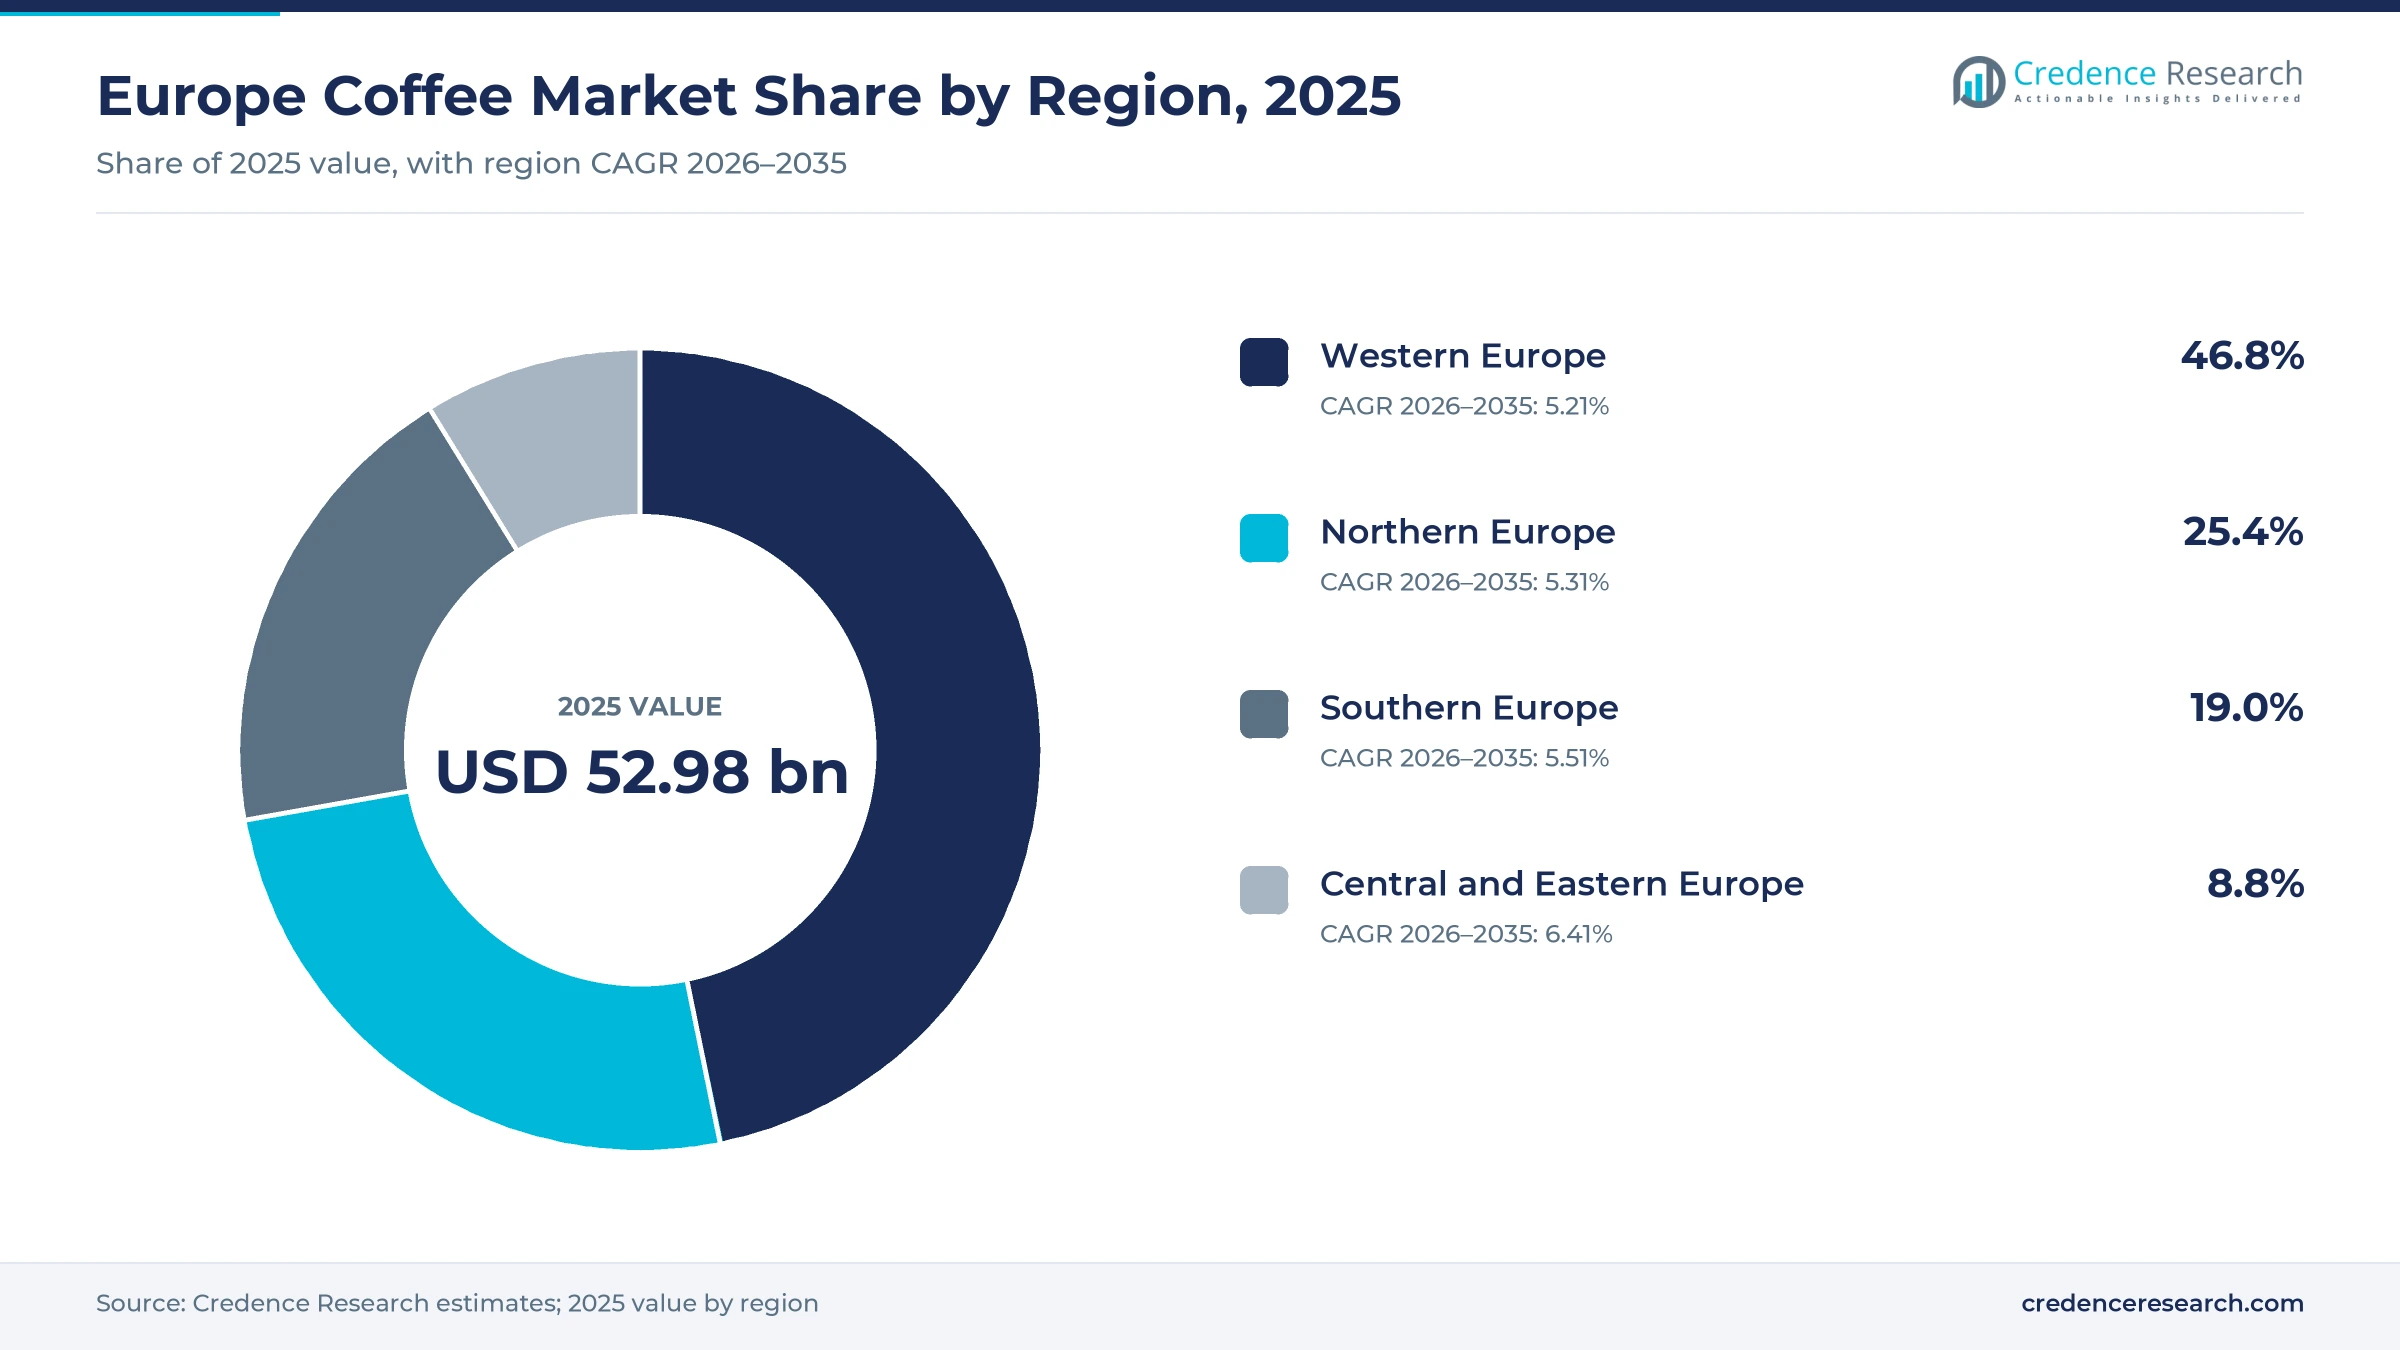
The Europe coffee market was valued at USD 52.98 billion in 2025 and is projected to increase from USD 55.98 billion in 2026 to USD 89.87 billion by 2035, registering a CAGR of 5.40% during 2026–2035. Demand comes from households, cafes, hotels, offices and institutions that buy roasted, instant and single-serve products every day. Western Europe held the largest regional share, 46.8% in 2025, because Germany, France and the Benelux countries combine large populations with dense roasting and retail networks. Central and Eastern Europe is the fastest-growing region at 6.41% a year, as incomes rise and branded cafe chains expand. Costs also changed sharply, because the composite green bean price indicator reached a monthly record in February 2025. As a result, roasters raised shelf prices and pushed premium, specialty and capsule ranges that protect their margins.
Which roasted, instant and capsule sales are counted?
The estimate measures the value of ground, whole bean, instant and pod or capsule products sold in Western, Northern, Southern and Central and Eastern Europe. It counts sales to households, offices, hospitality operators and institutions through retail, online and foodservice channels. Values are stated in USD million at current prices and are assigned to the region where the product is sold.
The estimate excludes green beans traded between importers and roasters, ready-to-drink beverages, brewing machines and the value of drinks served in cafes. The value chain runs from green bean importers and roasters through packers, wholesalers, retailers and foodservice distributors to households and hospitality operators.
Europe Coffee Market Insights
- The market was valued at USD 52.98 billion in 2025 and is projected to reach USD 89.87 billion by 2035, registering a CAGR of 5.40% during 2026–2035.
- Western Europe held 46.8% of regional value in 2025, because Germany, France and the Benelux countries host large roasters and dense retail networks.
- Ground coffee led with 38.0% of 2025 value, supported by filter brewing habits in Germany and moka and espresso use in Southern Europe.
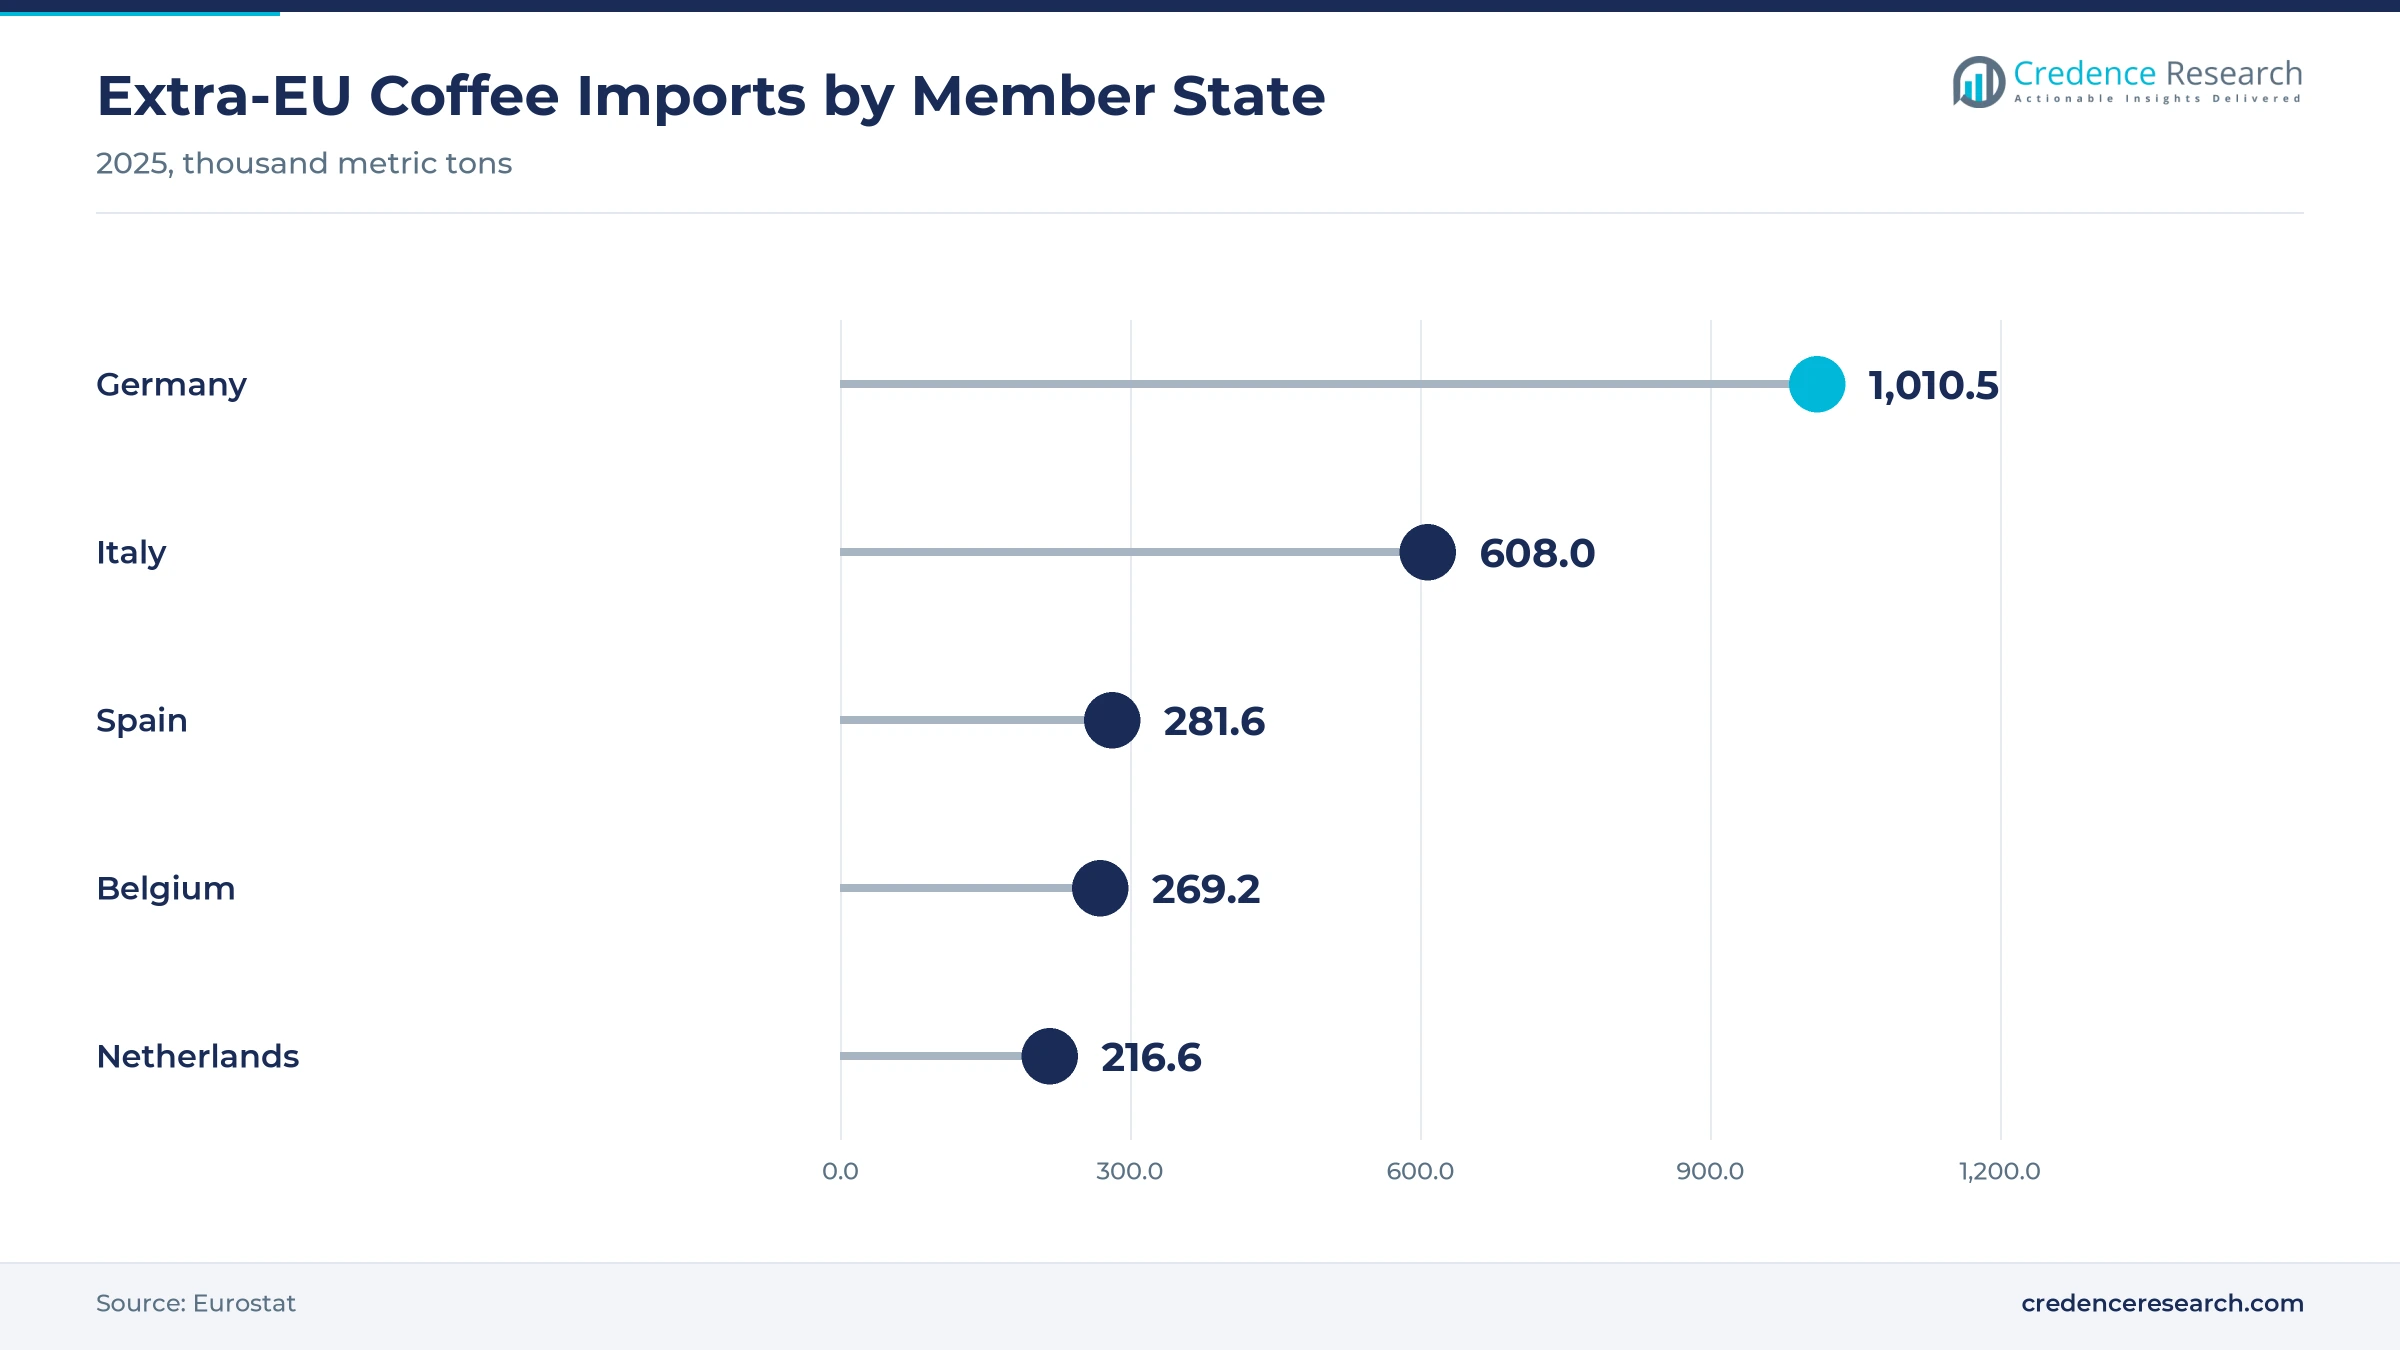
- The EU imported 2.9 million metric tons of green and other coffee from outside the bloc in 2025, worth €18.7 billion, according to Eurostat data.
- Keurig Dr Pepper completed its acquisition of 96.22% of JDE Peet's on April 1, 2026, creating a larger owner for brands across European retail.
Ground blends, mainstream tiers and homes lead value
Why does ground coffee still lead product value?
Based on product type, the market is categorized into ground coffee, whole bean coffee, instant coffee and coffee pods and capsules. Ground Coffee led with 38.0% of 2025 value, because filter brewing remains common in Germany and the Nordic countries. Whole Bean Coffee grows fastest at 6.30% a year, as households and offices install bean-to-cup machines that grind fresh beans for each cup.
How fast are premium and specialty tiers gaining?
Based on price tier, the market is categorized into economy, mainstream, premium and specialty products. Mainstream led with 41.0% of 2025 value, because large retail brands still sell most blends at middle price points. Specialty grows fastest at 6.80% a year, as single-origin beans, micro roasters and specialty cafes teach buyers to pay more for traceable quality.
Which customer types buy the most coffee?
Based on customer type, the market is categorized into household consumers, office and workplace buyers, hospitality buyers and institutional buyers. Household Consumers led with 56.0% of 2025 value, because most cups are brewed at home. Hospitality Buyers grow fastest at 5.97% a year, as branded cafes, hotels and restaurants add outlets and serve more espresso-based drinks.
How do products reach European buyers?
Based on distribution channel, the market is categorized into supermarkets and hypermarkets, specialty and convenience retail, e-commerce and HoReCa and foodservice. Supermarkets and Hypermarkets led with 44.0% of 2025 value, because weekly grocery trips still carry most household purchases. E-Commerce grows fastest at 6.82% a year, as roasters sell subscriptions, specialty beans and direct-to-consumer bundles online to buyers who want fresher roasts.
| Segment Group | Leading Sub-segment | Share, 2025 | Fastest-growing Sub-segment | CAGR, 2026–2035 |
|---|---|---|---|---|
| By Product Type | Ground Coffee | 38.0% | Whole Bean Coffee | 6.30% |
| By Price Tier | Mainstream | 41.0% | Specialty | 6.80% |
| By Customer Type | Household Consumers | 56.0% | Hospitality Buyers | 5.97% |
| By Distribution Channel | Supermarkets and Hypermarkets | 44.0% | E-Commerce | 6.82% |
Request a Free Sample
Fill in your details and we'll send you a free sample report.
- Sample data tables & charts
- Research methodology
Premium mix, cafe visits and scale lift value growth
How does premiumization lift the value of each cup?
Premiumization is the strongest value driver, because European buyers are trading up to better beans even as volumes stay flat. Europe accounted for about 46% of global specialty coffee demand, according to CBI market information updated in February 2026. The same source counts about 2,500 roasters in Germany, many of them micro roasters focused on specialty beans. Lavazza said in March 2026 that it raised prices in response to record green coffee costs, which shows that large brands can still pass costs on to retailers and cafes. As a result, specialty products grow fastest among price tiers at 6.80% a year through 2035, well ahead of mainstream blends.
Why does the cafe and foodservice recovery matter?
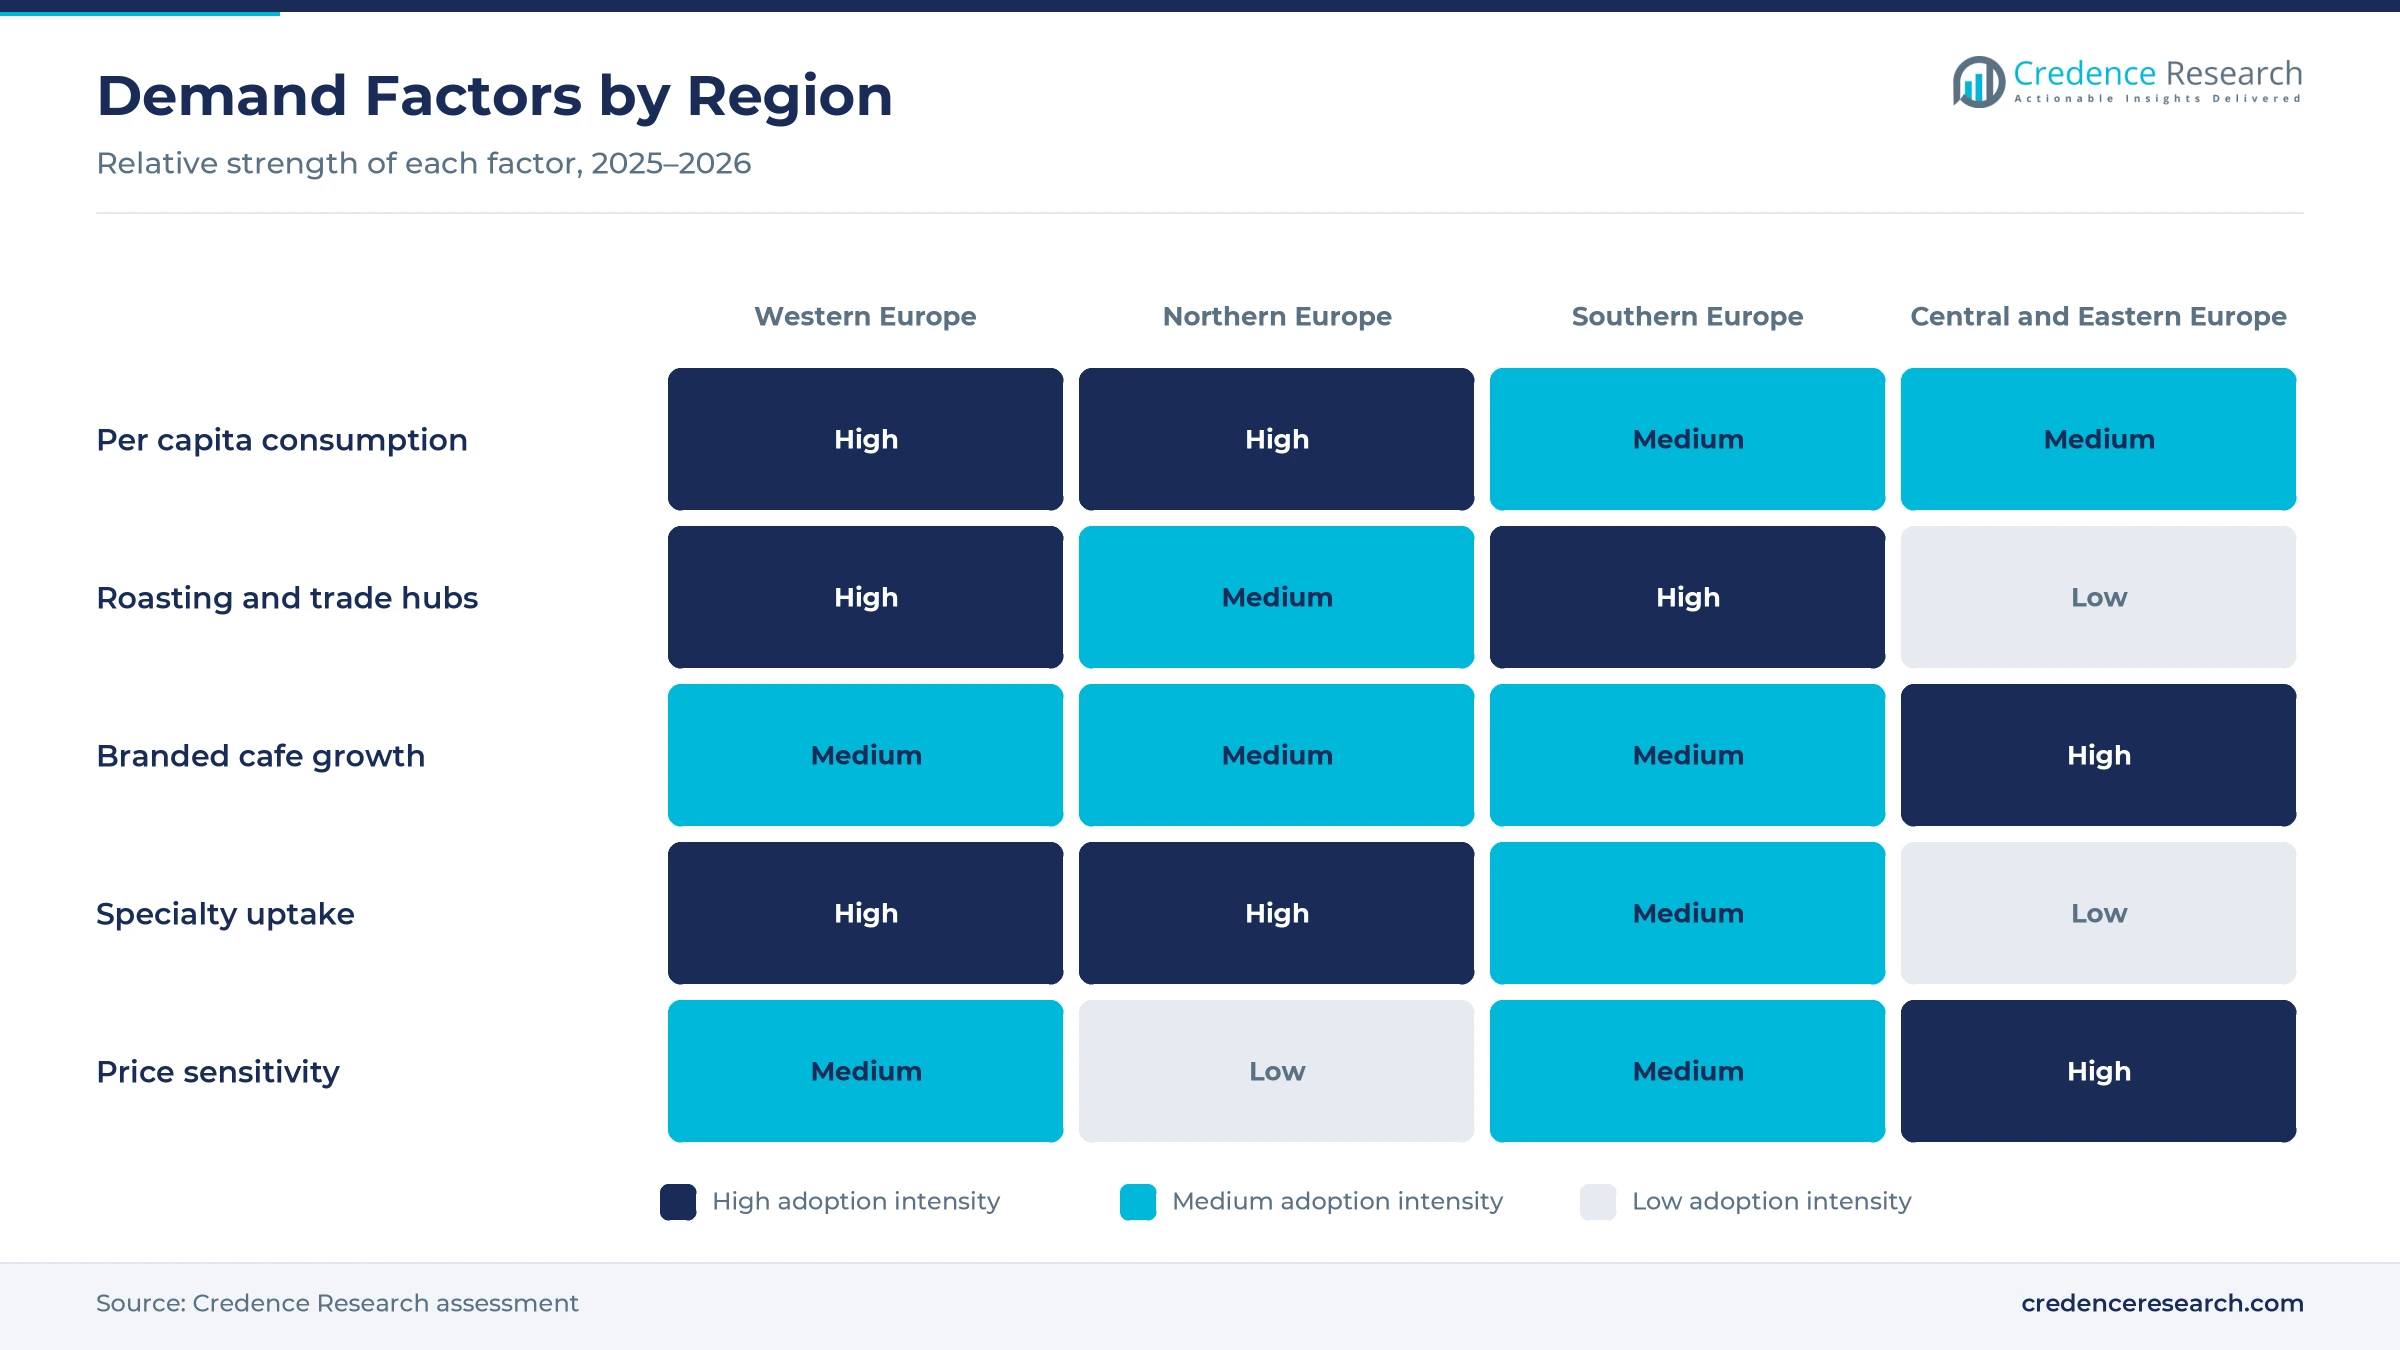
The foodservice and out-of-home recovery matters, because cafes, hotels and offices buy higher-margin espresso blends and whole beans. Europe's branded coffee shop market grew 4.7% to 51,042 outlets in the 12 months to April 2025, according to World Coffee Portal. The United Kingdom had 11,456 branded outlets and Germany 7,428, while Turkey grew 12.6% to more than 3,800. The same research expects more than 60,900 outlets by March 2030, which signals steady growth in professional demand for espresso blends and whole beans. In turn, hospitality buyers grow fastest among customer types at 5.97% a year, as chains add outlets in city centers, airports and stations.
How does the scale of European demand support value?
The scale of European consumer demand supports steady value, because Europe is the largest coffee consuming region in the world. Europe consumed about 3.26 million metric tons in 2023/2024, or 30.7% of global consumption, according to CBI, citing International Coffee Organization data. Europeans drank about 5.7 kilograms per person in 2023, compared with 4.8 kilograms in the United States. The EU imported 2.7 million metric tons from outside the bloc in 2023, worth €10.6 billion, according to Eurostat. Therefore, Western Europe, home to the largest roasters and trade hubs, remains the anchor of regional demand, while Southern and Northern Europe add steady volume from strong daily habits.
Why do higher bean costs raise shelf prices?
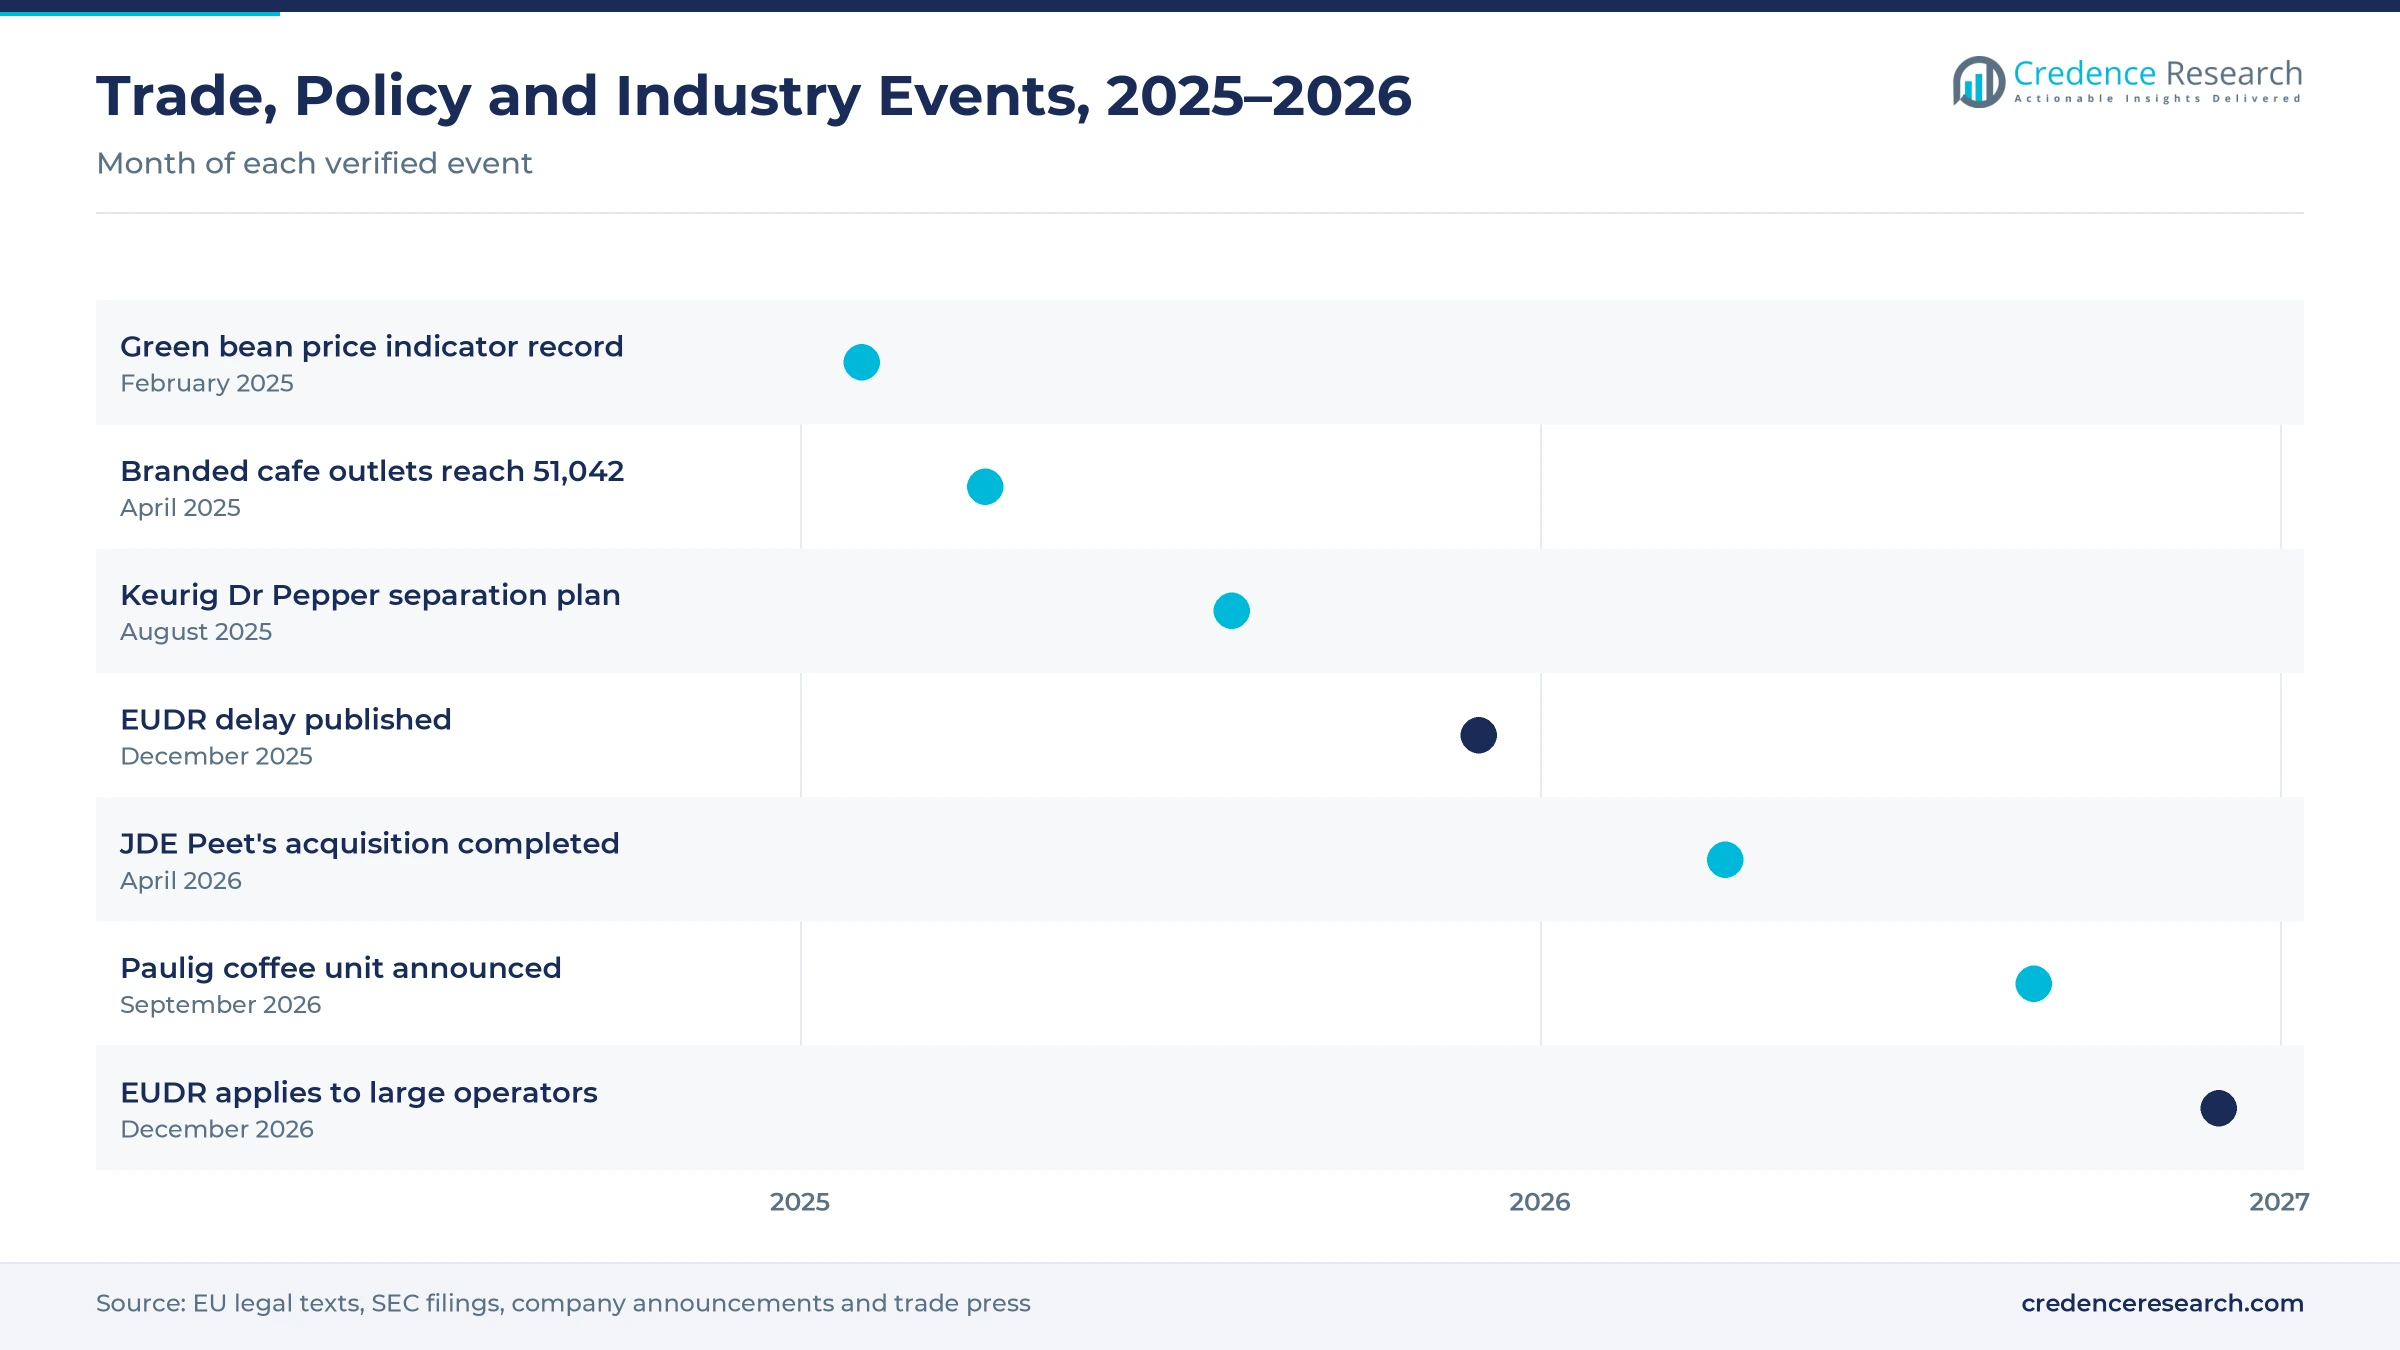
Higher green bean costs raise the value of each kilogram sold, because roasters pass most of the increase to retailers and cafes. The EU paid €18.7 billion for 2.9 million metric tons of extra-EU coffee in 2025, more than double the €8.6 billion paid in 2015, according to Eunews, citing Eurostat. The composite green bean price indicator reached a record 354.32 U.S. cents per pound in February 2025, up 14.3% from January. Melitta said in March 2026 that 2025 was still marked by volatile commodity prices, even after the record. As a result, market value rises faster than volume, which keeps mainstream products at 41.0% of 2025 value.
Record bean costs and deforestation rules reshape supply
How is the shift to deforestation-free sourcing playing out?
Roasters are shifting toward deforestation-free sourcing, because the EU Deforestation Regulation will require proof that beans were not grown on recently cleared land. The amendment that delayed the rules was published in the Official Journal on Dec. 23, 2025, after the European Parliament passed the final text on Dec. 17, 2025. Large operators must now comply from Dec. 31, 2026, while small operators follow in mid-2027. Brazil supplied 34% and Vietnam 20% of extra-EU coffee imports in 2025, so traceability work concentrates on farms in those two countries. In turn, importers are mapping plots and building data systems before the first checks.
Why is the rise of consolidation among roasters notable?
Consolidation among roasters is rising, because scale helps buyers absorb record bean costs and fund compliance. Keurig Dr Pepper acquired a 96.22% stake in JDE Peet's on April 1, 2026 and raised its stake to 97.75% by April 15, 2026, according to its quarterly SEC filing. The company announced on Aug. 25, 2025 that it plans to separate into a beverage company and a global coffee company. Paulig also said in September 2026 that it will form a dedicated coffee unit from Jan. 1, 2027. As a result, large owners gain more weight in retail negotiations across Western and Northern Europe.
Can whole-bean and home espresso open new value?
Whole-bean and home espresso offer an opening, because more households are buying machines that grind fresh beans at home. Germany consumed about 4.79 kilograms of roasted coffee per person and the Netherlands about 6.49 kilograms, according to CBI, which shows deep habits that premium beans can build on. Melitta also said its brand remained the leader in Germany's filter segment in 2025, which shows that filter and bean formats coexist. Whole bean coffee grows fastest among product types at 6.30% a year, so roasters that offer espresso and filter roasts for home grinders can win share from ground blends sold in supermarkets.
Is there room to grow in Central and Eastern Europe?
Central and Eastern Europe is a second opening, because incomes are rising and cafe culture is spreading from capital cities to regional towns. The region holds 8.8% of 2025 value, but it grows faster than any other region in the Credence Research model. Turkey's branded cafe market grew 12.6% to more than 3,800 outlets and Ukraine's grew 8% to more than 350 in the year to April 2025. Tchibo also said in August 2025 that its coffee sales outside Germany developed positively. Therefore, brands that adapt price points to local incomes can grow faster than in mature western markets, where household volumes are largely flat.
Volatile bean prices and EUDR checks squeeze roasters
How do volatile bean prices squeeze roasters?
Volatile bean prices squeeze roasters, because contracts with retailers often fix shelf prices for months while green bean costs move every week. Lavazza said its 2025 price rises, made in response to record green coffee costs, weighed on volumes. As a result, some households switched to cheaper blends or private labels. Roasters can mitigate this risk through hedging, longer supply contracts and blends that mix arabica and robusta beans, although each option carries its own cost and flavor trade-offs.
Why do EUDR checks add cost and uncertainty?
EUDR checks add cost and uncertainty, because importers must collect farm location data from thousands of smallholders before shipping. The rules have been delayed twice, and the amendment included a review in April 2026 that could change them again. This means that roasters must invest in systems without knowing the final rules. Shared traceability platforms and supplier training programs are the main ways to spread these costs, and large roasters are already funding them for their suppliers.
How does weak consumer sentiment limit volume?
Weak consumer sentiment limits volume, because households facing higher food prices cut back on out-of-home visits and premium purchases. Melitta said its household and professional segments in Europe were broadly stable in 2025 despite weak consumer sentiment and high price pressure. In turn, growth comes mainly from price rather than from more cups. Roasters can respond with smaller packs, value lines and loyalty programs that keep regular buyers inside their brands during periods of high prices.
Why are capsule markets slowing in some countries?
Capsule markets are slowing in some countries, because households that already own machines buy refills rather than new systems. CBI said the market for coffee capsules and pads in Italy has stagnated, while ready-to-drink and specialty products grow instead. As a result, makers of single-serve capsules must compete harder on price, compostable materials and new flavors. Brands that add refill packs and cheaper compatible pods can protect their installed base of machines.
Western Europe leads while the east grows fastest
| Region | Value, 2025 (USD billion) | Share, 2025 | CAGR, 2026–2035 |
|---|---|---|---|
| Western Europe | 24.80 | 46.8% | 5.21% |
| Northern Europe | 13.46 | 25.4% | 5.31% |
| Southern Europe | 10.07 | 19.0% | 5.51% |
| Central and Eastern Europe | 4.66 | 8.8% | 6.41% |
Why does Western Europe hold the largest share?
Western Europe held 46.8% of 2025 value and grows at 5.21% a year in the regional demand model. Germany imported 1,010,500 metric tons from outside the EU in 2025, or 34% of extra-EU imports, and roasted about 561,200 metric tons. Belgium and the Netherlands also act as trade hubs that roast and re-export coffee to France and other neighbors, which keeps the region at the center of European supply.
What sustains demand in Northern Europe?
Northern Europe held 25.4% of 2025 value and grows at 5.31% a year in the regional demand model. The region covers the Nordic and Baltic countries together with the United Kingdom and Ireland, where per capita consumption is high. Paulig roasts about 60,000 metric tons a year in Helsinki and Porvoo for Finland, Sweden and the Baltic states, while the United Kingdom had 11,456 branded coffee shops in 2025.
How does Southern Europe's espresso culture shape demand?
Southern Europe held 19.0% of 2025 value and grows at 5.51% a year in the regional demand model. Italy imported 608,000 metric tons from outside the EU in 2025, or 21% of the total, and Spain imported 281,600 metric tons. Italian roasters such as Lavazza, illycaffè and Massimo Zanetti supply espresso blends for bars, homes and commercial machines across the region.
Why is Central and Eastern Europe growing fastest?
Central and Eastern Europe held 8.8% of 2025 value and grows fastest at 6.41% a year in the regional demand model. Rising incomes in Poland, Czechia and Romania support a shift from instant products toward roasted beans, and branded cafes are spreading beyond capital cities into regional towns.
A roaster megadeal and EUDR delays marked 2025 and 2026
| Development | Status and market relevance |
|---|---|
| In August 2025, Keurig Dr Pepper announced its plan to separate into a beverage company and a global coffee company. | Linked to its acquisition of JDE Peet's, owner of major European retail brands |
| In December 2025, the EU published the amendment that delays EU Deforestation Regulation obligations to the end of 2026. | Large operators must comply from Dec. 31, 2026 and small operators from mid-2027 |
| In April 2026, Keurig Dr Pepper completed its USD 18 billion acquisition of 96.22% of JDE Peet's. | Raised its stake to 97.75% by April 15, 2026, with buy-out proceedings under way |
| In September 2026, Paulig announced a dedicated coffee business unit taking effect on Jan. 1, 2027. | Covers Paulig, Presidentti and Juhla Mokka brands in Finland, Sweden and the Baltic states |
Whole-bean machines, capsules and traceability gain
- Bean-to-cup brewing grinds whole beans for each cup, which supports faster growth of whole bean coffee in homes and offices.
- Single-serve capsules deliver portion control and consistent espresso, although refill demand in mature markets such as Italy has stagnated.
- Plot-level traceability links each shipment to farm coordinates, as the EU Deforestation Regulation requires from the end of 2026.
- Direct-to-consumer platforms let roasters such as Melitta, which owns roastmarket.de, sell subscriptions and specialty beans online.
Need a Custom Version of This Report?
Tailor the scope, geography, or segments to your exact requirements.
- Custom geography or segment scope
- Direct access to our analyst team
Large roasters compete on brands, scale and sourcing
Competition is led by large multinational roasters that combine strong retail brands with global sourcing desks. JDE Peet's, now owned by Keurig Dr Pepper, competes across Western and Northern Europe with retail and foodservice brands. Lavazza, illycaffè and Massimo Zanetti compete from Italy on espresso blends for homes, bars and vending, and Massimo Zanetti agreed in 2023 to supply Segafredo blends to Selecta vending sites. Tchibo and Melitta compete strongly in Germany, where Melitta remained the filter coffee leader in 2025. Paulig sells mainly in Finland, Sweden and the Baltic states, roasting about 60,000 metric tons a year. Nestlé, UCC Coffee Europe and Strauss Coffee are also profiled as major suppliers in retail and foodservice. Rivals compete on brand loyalty, hedging skill, traceability and the ability to raise prices without losing shelf space.
Companies profiled and their roles in this market
| Company | Type | Role in the market |
|---|---|---|
| JDE Peet's | Multinational roaster | Acquired by Keurig Dr Pepper, which held 97.75% of its shares by April 15, 2026 |
| Luigi Lavazza S.p.A. | Italian roaster | Raised prices in 2025 in response to record green coffee costs |
| Tchibo GmbH | German roaster and retailer | Has focused on coffee as its core business since summer 2023 |
| Melitta Group | German roaster and machine maker | Remained the filter coffee leader in Germany in 2025 |
| Paulig Group | Nordic roaster | Roasts about 60,000 metric tons a year in Helsinki and Porvoo |
| Massimo Zanetti Beverage Group S.p.A. | Italian roaster | Agreed in 2023 to supply Segafredo blends to Selecta vending sites across Europe |
Credence Research view on value-led growth
Credence Research's view is that Europe coffee value will grow on price and mix rather than on more cups. Volumes are mature in Western and Northern Europe, so specialty, whole-bean and foodservice sales carry most of the gain. Central and Eastern Europe adds the most new volume as incomes rise. Consolidation gives the largest roasters more purchasing power, while the EU Deforestation Regulation raises the cost of doing business for smaller importers that lack traceability systems.
How the regional estimate was built
The report uses 2025 as the base year, with values in USD million at current prices. Market values come from the Credence Research model, and regional, product type, price tier, customer type and distribution channel splits are Credence Research estimates. Inputs include Eurostat trade data, International Coffee Organization data as cited by trade agencies, EU legal texts, SEC filings, company announcements and trade press. Regional shares follow the client's regional split, and growth tilts reflect income, cafe expansion and trade data. No interviews or surveys were used in preparing these estimates.
Specialty tiers and the east drive growth to 2035
The Europe coffee market is expected to reach USD 89.87 billion by 2035, a 5.40% CAGR during 2026–2035, as premium tiers and cafe visits keep value rising. Central and Eastern Europe should gain the most share, while Western Europe stays the largest region. Specialty products, whole beans and online sales are expected to grow faster than mainstream ground blends. Lower green bean prices would ease pressure on roasters, while stricter deforestation checks or a sharp drop in consumer spending would lower this outlook.
Frequently Asked Questions
How big is the Europe coffee market?
Which region leads European coffee demand?
Which region grows fastest?
Which product type holds the largest share?
How much coffee does the EU import?
How does the EU Deforestation Regulation affect coffee?
Who are the main companies in the market?
Which price tier grows fastest?
Table of Content
Chapter 1 Market Segmentation
- 1.1 Segmentation Framework
- 1.1.1 Product and Service Classification
- 1.1.2 Application and End-Use Classification
- 1.1.3 Technology and Solution Classification
- 1.1.4 Customer and Distribution Channel Classification
- 1.1.5 Geographic Segmentation
- 1.1.6 Market Segment Definitions and Boundaries
- 1.2 By Product Type
- 1.2.1 Ground Coffee
- 1.2.2 Whole Bean Coffee
- 1.2.3 Instant Coffee
- 1.2.4 Coffee Pods and Capsules
- 1.3 By Price Tier
- 1.3.1 Economy
- 1.3.2 Mainstream
- 1.3.3 Premium
- 1.3.4 Specialty
- 1.4 By Customer Type
- 1.4.1 Household Consumers
- 1.4.2 Office and Workplace Buyers
- 1.4.3 Hospitality Buyers
- 1.4.4 Institutional Buyers
Chapter 2 Introduction
- 2.1 Report Objectives and Scope
- 2.2 Product Definition and Industry Terminology
- 2.3 Market Inclusions and Exclusions
- 2.4 Research Process
- 2.4.1 Primary Research and Expert Interviews
- 2.4.2 Secondary Research and Source Review
- 2.4.3 Top-Down and Bottom-Up Estimation
- 2.4.4 Data Triangulation and Verification
- 2.5 Market Size Measurement Basis
- 2.5.1 2025: USD 52.98 billion → 2035: USD 89.87 billion
- 2.6 Historical and Forecast Reference Periods
- 2.6.1 Historical Period: 2018-2025
- 2.6.2 Base Year: 2025
- 2.6.3 Forecast Period: 2025-2035
- 2.7 Research Assumptions and Limitations
Chapter 3 Executive Summary
- 3.1 Market Snapshot and Key Findings
- 3.2 Base-Year Market Size, 2025
- 3.3 Forecast Market Size, 2035
- 3.4 Revenue and Volume Growth Outlook
- 3.5 Key Demand and Supply Indicators
- 3.6 Leading Market Segments
- 3.7 Fastest-Growing Market Opportunities
- 3.8 Regional Performance Highlights
- 3.9 Technology and Industry Transformation
- 3.10 Competitive Landscape Summary
- 3.11 Analyst View and Strategic Implications
Chapter 4 Global Europe Coffee Market Trends and Developments
- 4.1 Historical Industry Development, 2018-2025
- 4.2 Recent Market Trends and Developments
- 4.3 Demand and Customer Behavior Trends
- 4.4 Technology and Product Innovation
- 4.5 Artificial Intelligence, Automation and Digitalization
- 4.6 Local Manufacturing and Supply Chain Realignment
- 4.7 Industry Partnerships, Mergers and Acquisitions
- 4.8 Sustainability and Circular Economy Developments
- 4.9 Government and Private Sector Investment Trends
- 4.10 Emerging Business Models and Commercialization
- 4.11 Industry Developments and Announcements
Chapter 5 Global Europe Coffee Market Production, Supply and Demand Analysis
- 5.1 Demand Trend and Consumption Analysis, 2018-2025
- 5.2 Demand Forecast, 2025-2035
- 5.3 Production and Output Trend, 2018-2025
- 5.4 Production and Output Forecast, 2025-2035
- 5.5 Installed Capacity and Capacity Utilization
- 5.6 Company-Wise Production Plants and Statistics
- 5.6.1 Installed Production Capacity
- 5.6.2 Actual Production
- 5.6.3 Planned Capacity and Expansion Targets
- 5.7 Supply Chain Structure and Procurement Trends
- 5.8 Supply-Demand Gap and Bottlenecks
- 5.9 Import Dependence and Sourcing Structure
- 5.10 Contract Manufacturing and Outsourcing
- 5.11 Regional Supply and Demand Concentration
Chapter 6 Global Europe Coffee Market Pricing Analysis
- 6.1 Pricing Structure and Measurement
- 6.2 Historical Pricing Trends, 2018-2025
- 6.3 Pricing Outlook, 2025-2035
- 6.4 Average Selling Price and Unit Economics
- 6.5 Pricing by Product and Market Segment
- 6.6 Geographic Pricing Differences
- 6.7 Key Input, Energy, Labor and Logistics Costs
- 6.8 Contract Pricing and Purchasing Models
- 6.9 Pricing Sensitivity and Competitive Positioning
- 6.10 Price, Margin and Profitability Implications
Chapter 7 Global Europe Coffee Market Dynamics
- 7.1 Market Growth Drivers
- 7.1.1 Demand-Side Drivers
- 7.1.2 Technology and Innovation Drivers
- 7.1.3 Infrastructure and Investment Drivers
- 7.1.4 Regulatory and Policy Drivers
- 7.2 Market Restraints
- 7.2.1 Cost and Affordability Constraints
- 7.2.2 Technology and Adoption Barriers
- 7.2.3 Supply Chain and Operational Constraints
- 7.3 Market Challenges
- 7.3.1 Competitive Pressure and Margin Erosion
- 7.3.2 Skills, Infrastructure and Implementation Gaps
- 7.4 Emerging Market Opportunities
- 7.5 Market Dynamics Impact and Time-Horizon Assessment
Chapter 8 Global Europe Coffee Value Chain Analysis
- 8.1 Industry Value Chain Overview
- 8.2 Upstream Suppliers and Critical Inputs
- 8.3 Technology and Component Providers
- 8.4 Manufacturing or Service Delivery
- 8.5 Distribution, Channel Partners and Integrators
- 8.6 Downstream Applications and End Users
- 8.7 Value Addition and Profit Pools
- 8.8 Vertical Integration and Outsourcing
- 8.9 Supplier Concentration and Risk
- 8.10 Supply Chain Localization and Resilience
Chapter 9 Global Europe Coffee Market Regulations and Policies
- 9.1 Relevant Laws, Standards and Compliance Frameworks
- 9.2 Product, Service, Safety and Quality Requirements
- 9.3 Government Policies, Incentives and Subsidies
- 9.4 Imports, Exports and Trade Barriers
- 9.5 Public Procurement and Local Content Requirements
- 9.6 Environmental and Sustainability Compliance
- 9.7 Upcoming Policy Changes and Market Implications
Chapter 10 Global Europe Coffee Market Hotspots and Opportunities
- 10.1 Market Opportunity Mapping and Growth Hotspots
- 10.2 High-Growth Applications and Customer Groups
- 10.3 Underserved Markets and White-Space Opportunities
- 10.4 Emerging Technology and Product Opportunities
- 10.5 New Capacity and Investment Hotspots
- 10.6 Market Entry and Expansion Opportunities
- 10.7 Distribution and Partnership Opportunities
- 10.8 Near-Term and Long-Term Commercial Potential
- 10.9 Opportunity Attractiveness and Execution Risks
Chapter 11 Global Europe Coffee Market Outlook, 2025-2035
- 11.1 Market Size and Analysis
- 11.1.1 Revenue (Market Measurement: 2025: USD 52.98 billion → 2035: USD 89.87 billion)
- 11.1.2 Market Volume and Quantity Sold
- 11.1.3 Historical Market Size, 2018-2025
- 11.1.4 Base-Year Market Size, 2025
- 11.2 Market Forecast, 2025-2035
- 11.2.1 Revenue Forecast to 2035
- 11.2.2 Volume Forecast to 2035
- 11.2.3 CAGR and Year-on-Year Growth
- 11.2.4 Incremental Revenue Opportunity
- 11.3 Forecast Assumptions and Scenario Analysis
- 11.3.1 Base-Case Forecast
- 11.3.2 Optimistic and Conservative Scenarios
- 11.3.3 Technology, Pricing and Policy Sensitivities
- 11.4 Market Attractiveness and Growth Outlook
Chapter 12 Global Europe Coffee Market Segmentation and Outlook
- 12.1 Segmentation Summary and Market Shares, 2025
- 12.2 Largest and Fastest-Growing Segments
- 12.3 By Product Type - Market Size and Forecast, 2025-2035
- 12.3.1 Segment Definition and Scope
- 12.3.2 Historical Market Size, 2018-2025
- 12.3.3 Revenue Forecast, 2025-2035
- 12.3.4 Volume Forecast, 2025-2035
- 12.3.5 Base-Year Market Share, 2025
- 12.3.6 Segment CAGR and Growth Drivers
- 12.3.7 Subsegment Market Size and Forecast
- 12.3.7.1 Ground Coffee
- 12.3.7.2 Whole Bean Coffee
- 12.3.7.3 Instant Coffee
- 12.3.7.4 Coffee Pods and Capsules
- 12.3.8 Subsegment Pricing and Adoption Trends
- 12.3.9 Leading Suppliers and Competition
- 12.3.10 Regional Demand and Opportunities
- 12.4 By Price Tier - Market Size and Forecast, 2025-2035
- 12.4.1 Segment Definition and Scope
- 12.4.2 Historical Market Size, 2018-2025
- 12.4.3 Revenue Forecast, 2025-2035
- 12.4.4 Volume Forecast, 2025-2035
- 12.4.5 Base-Year Market Share, 2025
- 12.4.6 Segment CAGR and Growth Drivers
- 12.4.7 Subsegment Market Size and Forecast
- 12.4.7.1 Economy
- 12.4.7.2 Mainstream
- 12.4.7.3 Premium
- 12.4.7.4 Specialty
- 12.4.8 Subsegment Pricing and Adoption Trends
- 12.4.9 Leading Suppliers and Competition
- 12.4.10 Regional Demand and Opportunities
- 12.5 By Customer Type - Market Size and Forecast, 2025-2035
- 12.5.1 Segment Definition and Scope
- 12.5.2 Historical Market Size, 2018-2025
- 12.5.3 Revenue Forecast, 2025-2035
- 12.5.4 Volume Forecast, 2025-2035
- 12.5.5 Base-Year Market Share, 2025
- 12.5.6 Segment CAGR and Growth Drivers
- 12.5.7 Subsegment Market Size and Forecast
- 12.5.7.1 Household Consumers
- 12.5.7.2 Office and Workplace Buyers
- 12.5.7.3 Hospitality Buyers
- 12.5.7.4 Institutional Buyers
- 12.5.8 Subsegment Pricing and Adoption Trends
- 12.5.9 Leading Suppliers and Competition
- 12.5.10 Regional Demand and Opportunities
- 12.6 Segment Growth Comparison
- 12.7 Segment Attractiveness and Priority Matrix
Chapter 13 Global Europe Coffee End-Use and Application Market Outlook
- 13.1 End-Use Industry and Customer Demand Structure
- 13.2 Leading Applications and Customer Groups
- 13.3 End-Use Market Size, Share and Forecast
- 13.4 Major End-Use Industry Deep Dives
- 13.4.1 Customer Requirements and Use Cases
- 13.4.2 Demand and Replacement Cycles
- 13.4.3 Technical and Regulatory Considerations
- 13.4.4 Purchasing and Procurement Models
- 13.4.5 Leading Vendors and Distribution Channels
- 13.4.6 Forecast and Commercial Opportunities
- 13.5 Emerging Applications and Cross-Segment Demand
- 13.6 End-Use Industry Investment Priorities
Chapter 14 Global Europe Coffee Geographic Market Outlook, 2025-2035
- 14.1 Regional Market Size and Share, 2025
- 14.2 Regional Market Forecast, 2025-2035
- 14.3 Regional Pricing, Production and Demand Differences
- 14.4 North America
- 14.4.1 United States
- 14.4.2 Canada
- 14.4.3 Mexico
- 14.5 Europe
- 14.5.1 Germany
- 14.5.2 France
- 14.5.3 Italy
- 14.5.4 United Kingdom
- 14.5.5 Spain
- 14.5.6 Poland
- 14.5.7 Russia
- 14.5.8 Netherlands
- 14.5.9 Belgium
- 14.5.10 Sweden
- 14.5.11 Denmark
- 14.5.12 Norway
- 14.5.13 Rest of Europe
- 14.6 Asia Pacific
- 14.6.1 China
- 14.6.2 India
- 14.6.3 Japan
- 14.6.4 South Korea
- 14.6.5 Thailand
- 14.6.6 Indonesia
- 14.6.7 Vietnam
- 14.6.8 Malaysia
- 14.6.9 Australia
- 14.6.10 Rest of Asia Pacific
- 14.7 Latin America
- 14.7.1 Brazil
- 14.7.2 Argentina
- 14.7.3 Colombia
- 14.7.4 Chile
- 14.7.5 Rest of Latin America
- 14.8 Middle East
- 14.8.1 Saudi Arabia
- 14.8.2 United Arab Emirates
- 14.8.3 Turkey
- 14.8.4 Israel
- 14.8.5 Iran
- 14.8.6 Rest of the Middle East
- 14.9 Africa
- 14.9.1 South Africa
- 14.9.2 Egypt
- 14.9.3 Nigeria
- 14.9.4 Morocco
- 14.9.5 Rest of Africa
- 14.10 Regional Investment, Policy and Supply Chain Differences
- 14.11 Regional Competitive Landscape
- 14.12 Geographic Growth Hotspots
Chapter 15 Global Europe Coffee Technology, Innovation and Sustainability Outlook
- 15.1 Technology Landscape and Maturity
- 15.2 Product, Process and Service Innovation
- 15.3 AI, Automation and Digital Tools in the Industry
- 15.4 Technology Adoption and Performance Benchmarking
- 15.5 Innovation Pipeline and R&D Investment
- 15.6 Patent and Intellectual Property Trends
- 15.7 Energy Efficiency and Resource Management
- 15.8 Sustainability, Recycling and Circularity
- 15.9 Technology Roadmap, 2025-2035
- 15.10 Risks of Obsolescence and Technology Substitution
Chapter 16 Global Europe Coffee Market Key Strategic Imperatives
- 16.1 Growth and Market Entry Priorities
- 16.2 High-Return Products and Segments
- 16.3 Pricing, Profitability and Cost Optimization
- 16.4 Technology Investment and Product Differentiation
- 16.5 Supply Chain Localization and Resilience
- 16.6 Distribution and Customer Acquisition
- 16.7 Partnership, Acquisition and Capacity Strategy
- 16.8 Regional Expansion Priorities
- 16.9 Short-, Medium- and Long-Term Actions
Chapter 17 Competition Outlook
- 17.1 Industry Competition Characteristics
- 17.2 Market Structure and Concentration
- 17.3 Market Share and Competitive Positioning, 2025
- 17.4 Company-Wise Revenue and Product Benchmarking
- 17.5 Production and Service Capacity Benchmarking
- 17.6 Technology, Pricing and Differentiation
- 17.7 Regional Footprint and Distribution Strength
- 17.8 Mergers, Acquisitions and Strategic Alliances
- 17.9 New Entrants and Competitive Threats
- 17.10 Porter's Five Forces and Industry Attractiveness
- 17.11 Competitive Outlook, 2025-2035
Chapter 18 Company Profiles
- 18.1 Company Coverage and Selection Criteria
- 18.2 Nestlé S.A.
- 18.2.1 Business Description
- 18.2.2 Company Ownership and Geographic Presence
- 18.2.3 Product and Service Portfolio
- 18.2.4 Manufacturing and Operating Footprint
- 18.2.5 Production Capacity and Expansion Plans
- 18.2.6 Financial Performance and Investment
- 18.2.7 Market Share and Competitive Position
- 18.2.8 Technology and Innovation Capabilities
- 18.2.9 Strategic Alliances or Partnerships
- 18.2.10 Recent Developments
- 18.2.11 Growth Strategy and Outlook
- 18.3 JDE Peet's
- 18.4 Luigi Lavazza S.p.A.
- 18.5 Tchibo GmbH
- 18.6 Melitta Group
- 18.7 Paulig Group
- 18.8 illycaffè S.p.A.
- 18.9 Massimo Zanetti Beverage Group S.p.A.
- 18.10 UCC Coffee Europe
- 18.11 Strauss Coffee
- 18.12 Other Relevant Market Participants
Note: Every listed company is profiled on the structure shown under the first company. The company list is preliminary and may change based on research findings, market developments, data availability and client requirements.
Chapter 19 Disclaimer
- 19.1 Research and Forecast Disclaimer
- 19.2 Data Source and Estimation Limitations
Note: The depth of individual sections depends on data availability for this market. Volume, capacity, trade and other unit-based metrics are included where applicable.

