
Fewer births but richer diets lift spending per child
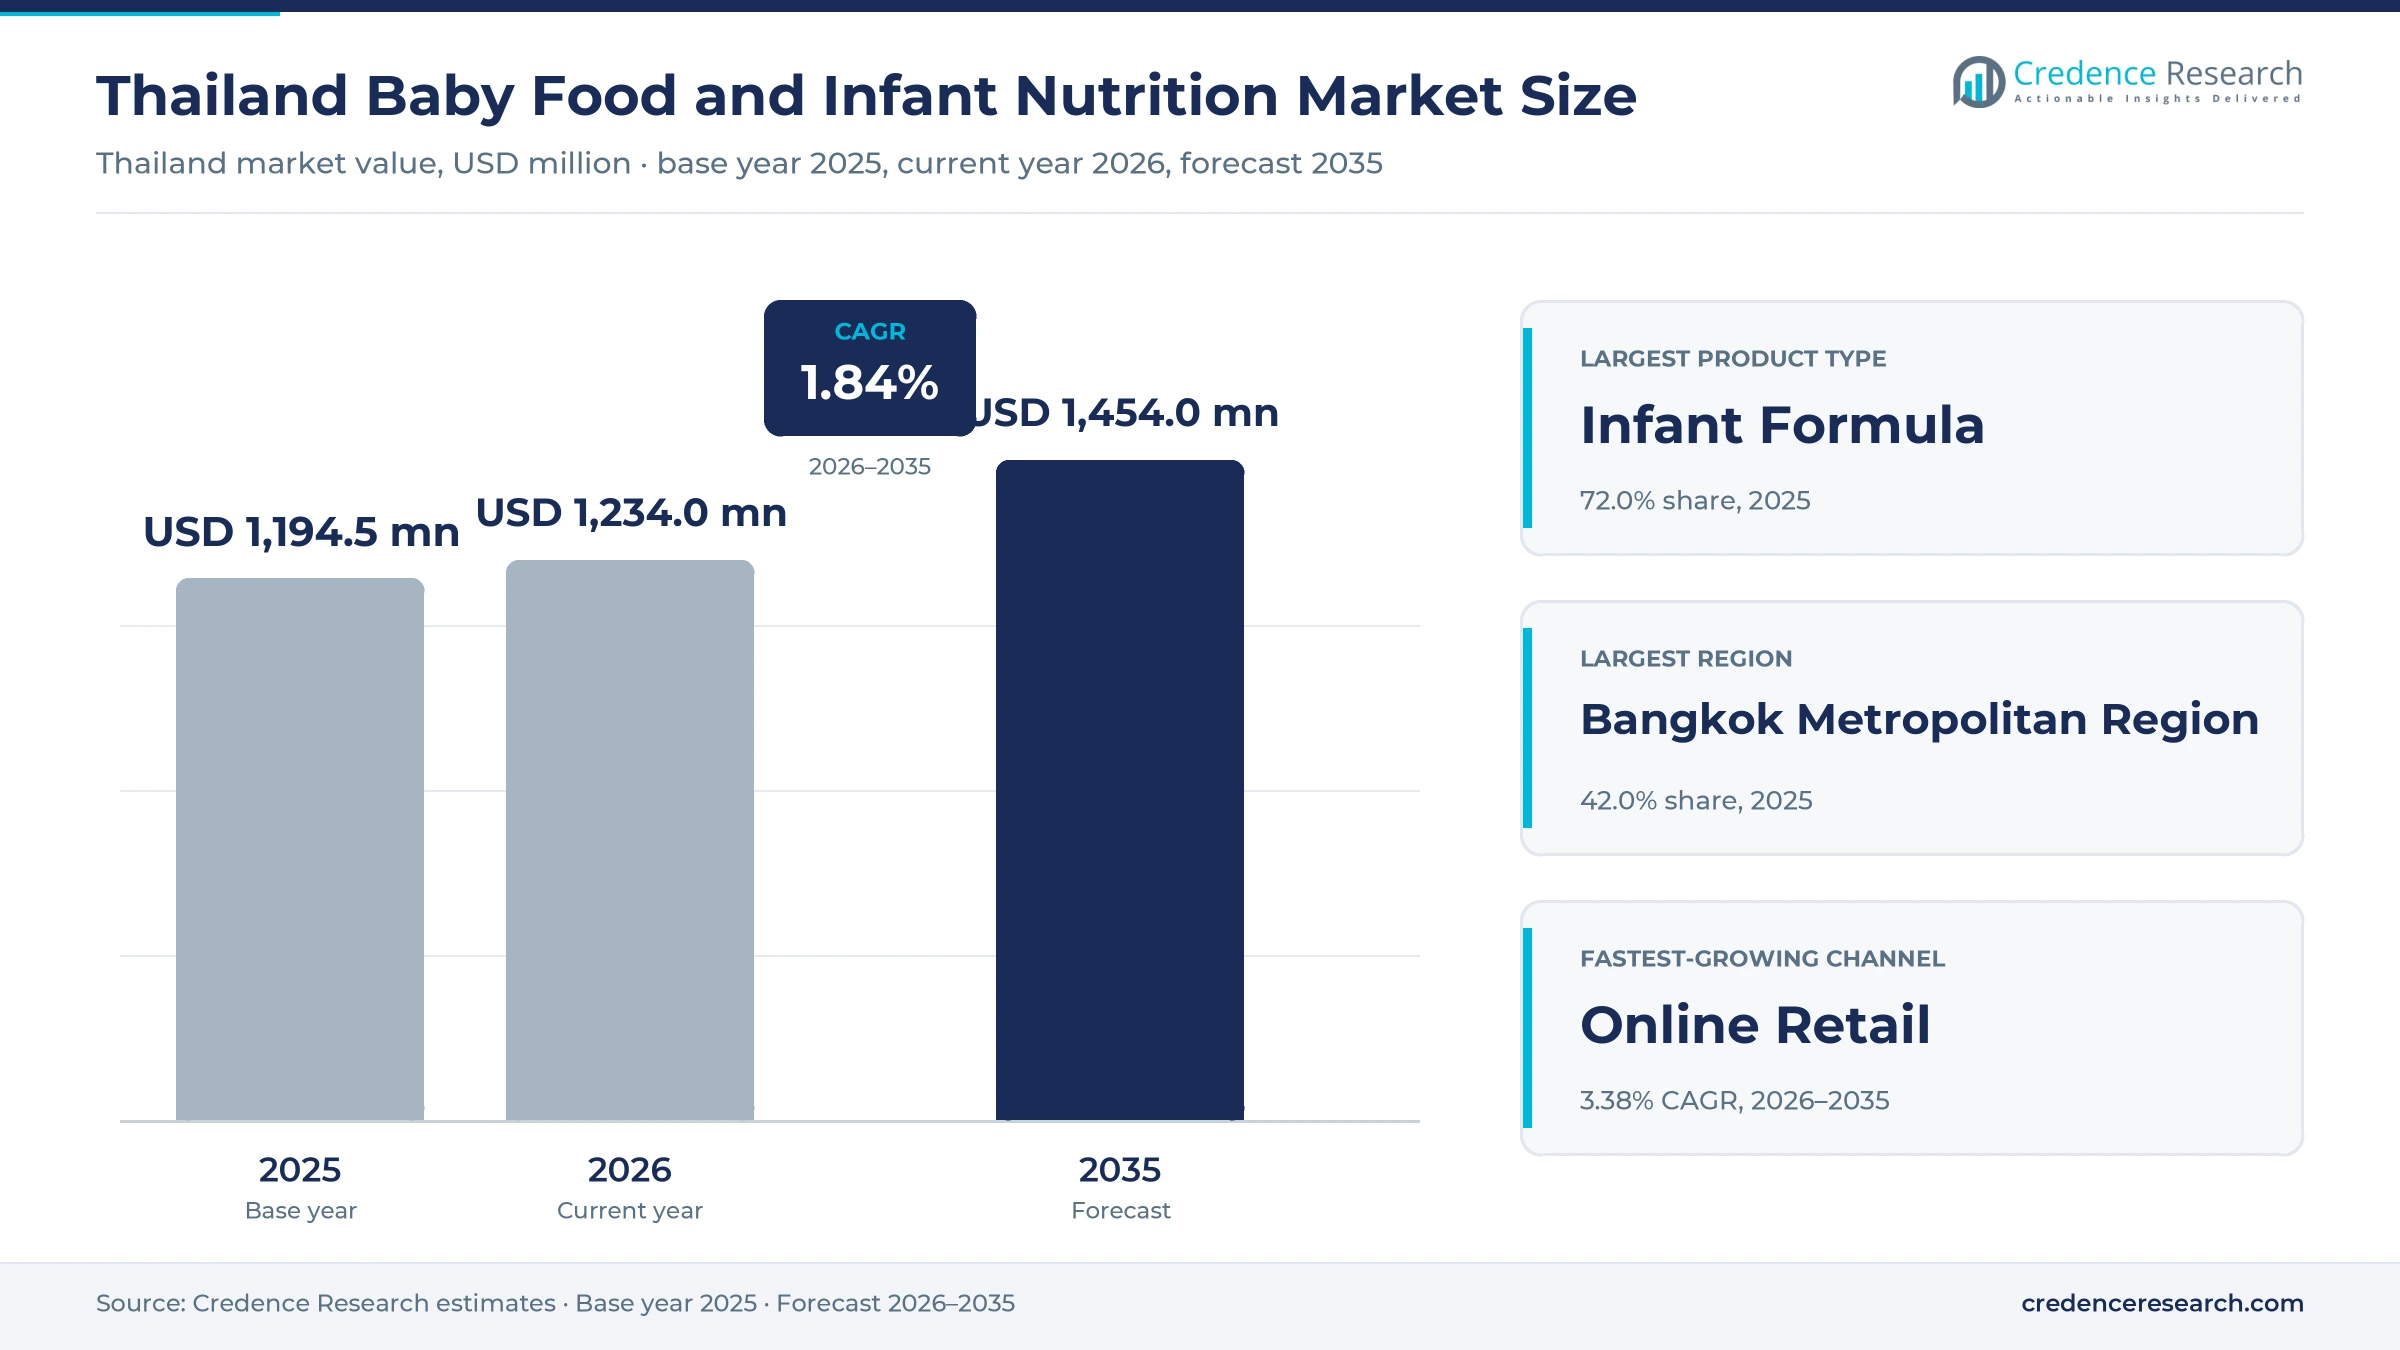
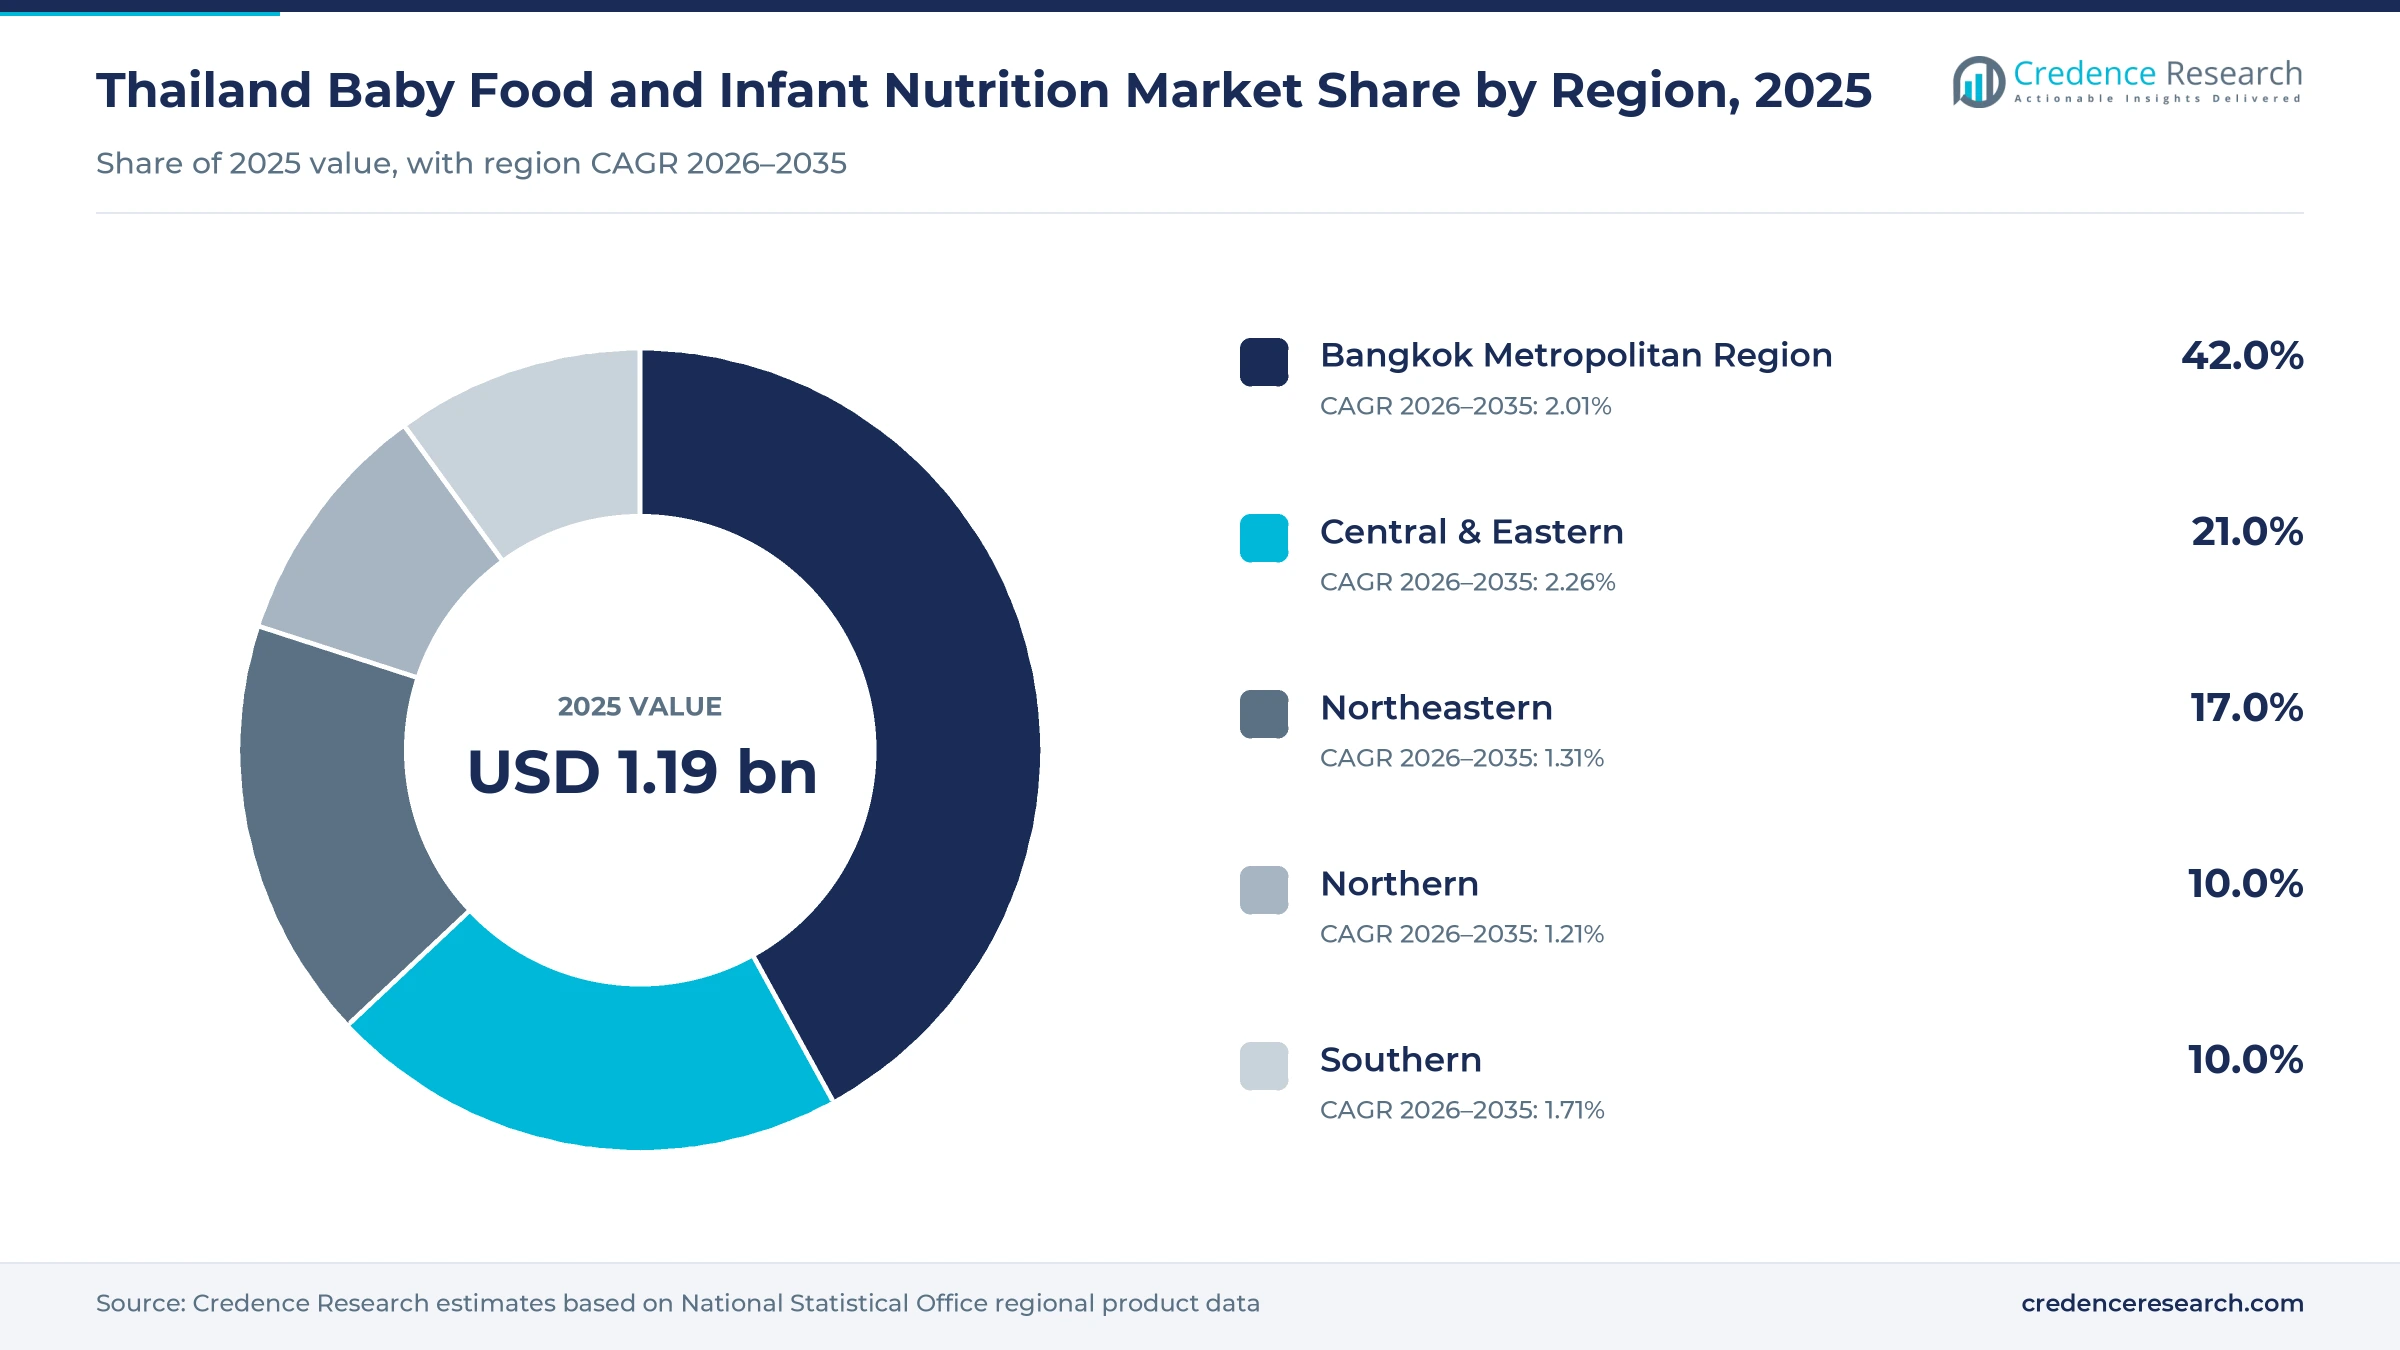
The Thailand baby food and infant nutrition market was valued at USD 1.19 billion in 2025 and is projected to increase from USD 1.23 billion in 2026 to USD 1.45 billion by 2035, registering a CAGR of 1.84% during 2026–2035. Demand comes from parents who buy formula, cereals and ready meals for children up to three years old, and who now spend more on each child as families get smaller. The Bangkok Metropolitan Region held the largest regional share, 42.0% in 2025, because incomes, modern stores and working parents are concentrated there. The Central & Eastern zone grows fastest at 2.26% a year, helped by high incomes in the eastern industrial provinces. The key regulatory change is the Thai FDA approval of the human milk oligosaccharide 2'-FL for infant formula, which has pushed brands toward more advanced premium recipes.
Which formulas, cereals and ready meals does the estimate count?
The estimate measures retail sales value of infant formula, follow-up and growing-up milk, baby cereals, prepared baby meals and baby snacks bought by households in Thailand. It covers sales through supermarkets, hypermarkets, pharmacies, baby specialty stores and online retail. Values are stated in USD million at current prices, converted from baht at average annual exchange rates.
The estimate excludes medical nutrition supplied only through hospitals, adult nutrition drinks and general dairy products not made for young children. It also excludes exports made by baby nutrition plants located in Thailand. The value chain runs from dairy, cereal and ingredient suppliers through local and imported manufacturing to distributors, retailers, online stores and families.
Thailand Baby Food and Infant Nutrition Market Insights
- The Thailand baby food and infant nutrition market was valued at USD 1.19 billion in 2025 and is projected to reach USD 1.45 billion by 2035, registering a CAGR of 1.84% during 2026–2035.
- The Bangkok Metropolitan Region held 42.0% of 2025 value, because the capital zone produces nearly half of national output and has the most modern stores.
- Infant formula led with 72.0% of 2025 value, as follow-up and growing-up milks remain the main paid feeding product after the first months.
- Thailand recorded 462,240 births in 2024, the lowest in about 75 years, which pushes brands to grow value per child rather than volume.
- Online retail grows fastest among channels at 3.38% a year during 2026–2035, as parents reorder formula tins and pouches through platforms.
Formula, older infants and supermarkets carry most value
Why does infant formula lead spending?
Based on product type, the market is categorized into infant formula, baby cereals, prepared baby foods and baby snacks. Infant Formula led with 72.0% of 2025 value, because formula, follow-up milk and growing-up milk are bought every week by many families. Baby Snacks grow fastest at 3.57% a year, as parents buy puffs, rice crackers and teething biscuits for toddlers on the go.
How do age groups shape feeding spend?
Based on age group, the market is categorized into 0-6 months, 6-12 months, 12-24 months and 24+ months. The 6-12 Months group led with 30.0% of 2025 value, because weaning adds cereals and meals to milk feeding. 6-12 Months also grows fastest at 2.22% a year, as parents trade up to fortified cereals and ready meals during the first year of solid food.
Which channels sell the most baby nutrition?
Based on distribution channel, the market is categorized into supermarkets and hypermarkets, pharmacies and drugstores, baby specialty stores and online retail. Supermarkets & Hypermarkets led with 40.0% of 2025 value, because families buy formula tins during weekly grocery trips. Online Retail grows fastest at 3.38% a year, as parents in Bangkok and provincial cities reorder large packs online.
How do price tiers shape formula and food demand?
Based on price tier, the market is categorized into value, mainstream, premium and super-premium products. Mainstream products led with 40.0% of 2025 value, because most families choose trusted mid-priced formula brands. Super-Premium products grow fastest at 3.30% a year, as parents with one child pay more for recipes with HMOs, special proteins and organic ingredients.
| Segment Group | Leading Sub-segment | Share, 2025 | Fastest-growing Sub-segment | CAGR, 2026–2035 |
|---|---|---|---|---|
| By Product Type | Infant Formula | 72.0% | Baby Snacks | 3.57% |
| By Age Group | 6-12 Months | 30.0% | 6-12 Months | 2.22% |
| By Distribution Channel | Supermarkets & Hypermarkets | 40.0% | Online Retail | 3.38% |
| By Price Tier | Mainstream | 40.0% | Super-Premium | 3.30% |
Request a Free Sample
Fill in your details and we'll send you a free sample report.
- Sample data tables & charts
- Research methodology
Weaning, premium formulas and local plants lift demand
How does broad complementary feeding sustain demand?
Broad complementary feeding sustains demand, because most Thai infants receive formula, cereals or other foods well before their first birthday. Only 29% of infants were exclusively breastfed in their first six months in 2022, up from 14% in 2019, according to a UNICEF-supported national survey. The same survey found that 13% of children under five were stunted, which keeps attention on nutrition during weaning. Thailand's infant feeding law covers complementary foods for babies up to 12 months and young children up to three years. As a result, the 6-12 months group grows fastest at 2.22% a year, as families add fortified cereals and ready meals to milk feeding.
Why do premium recipes and higher incomes lift value?
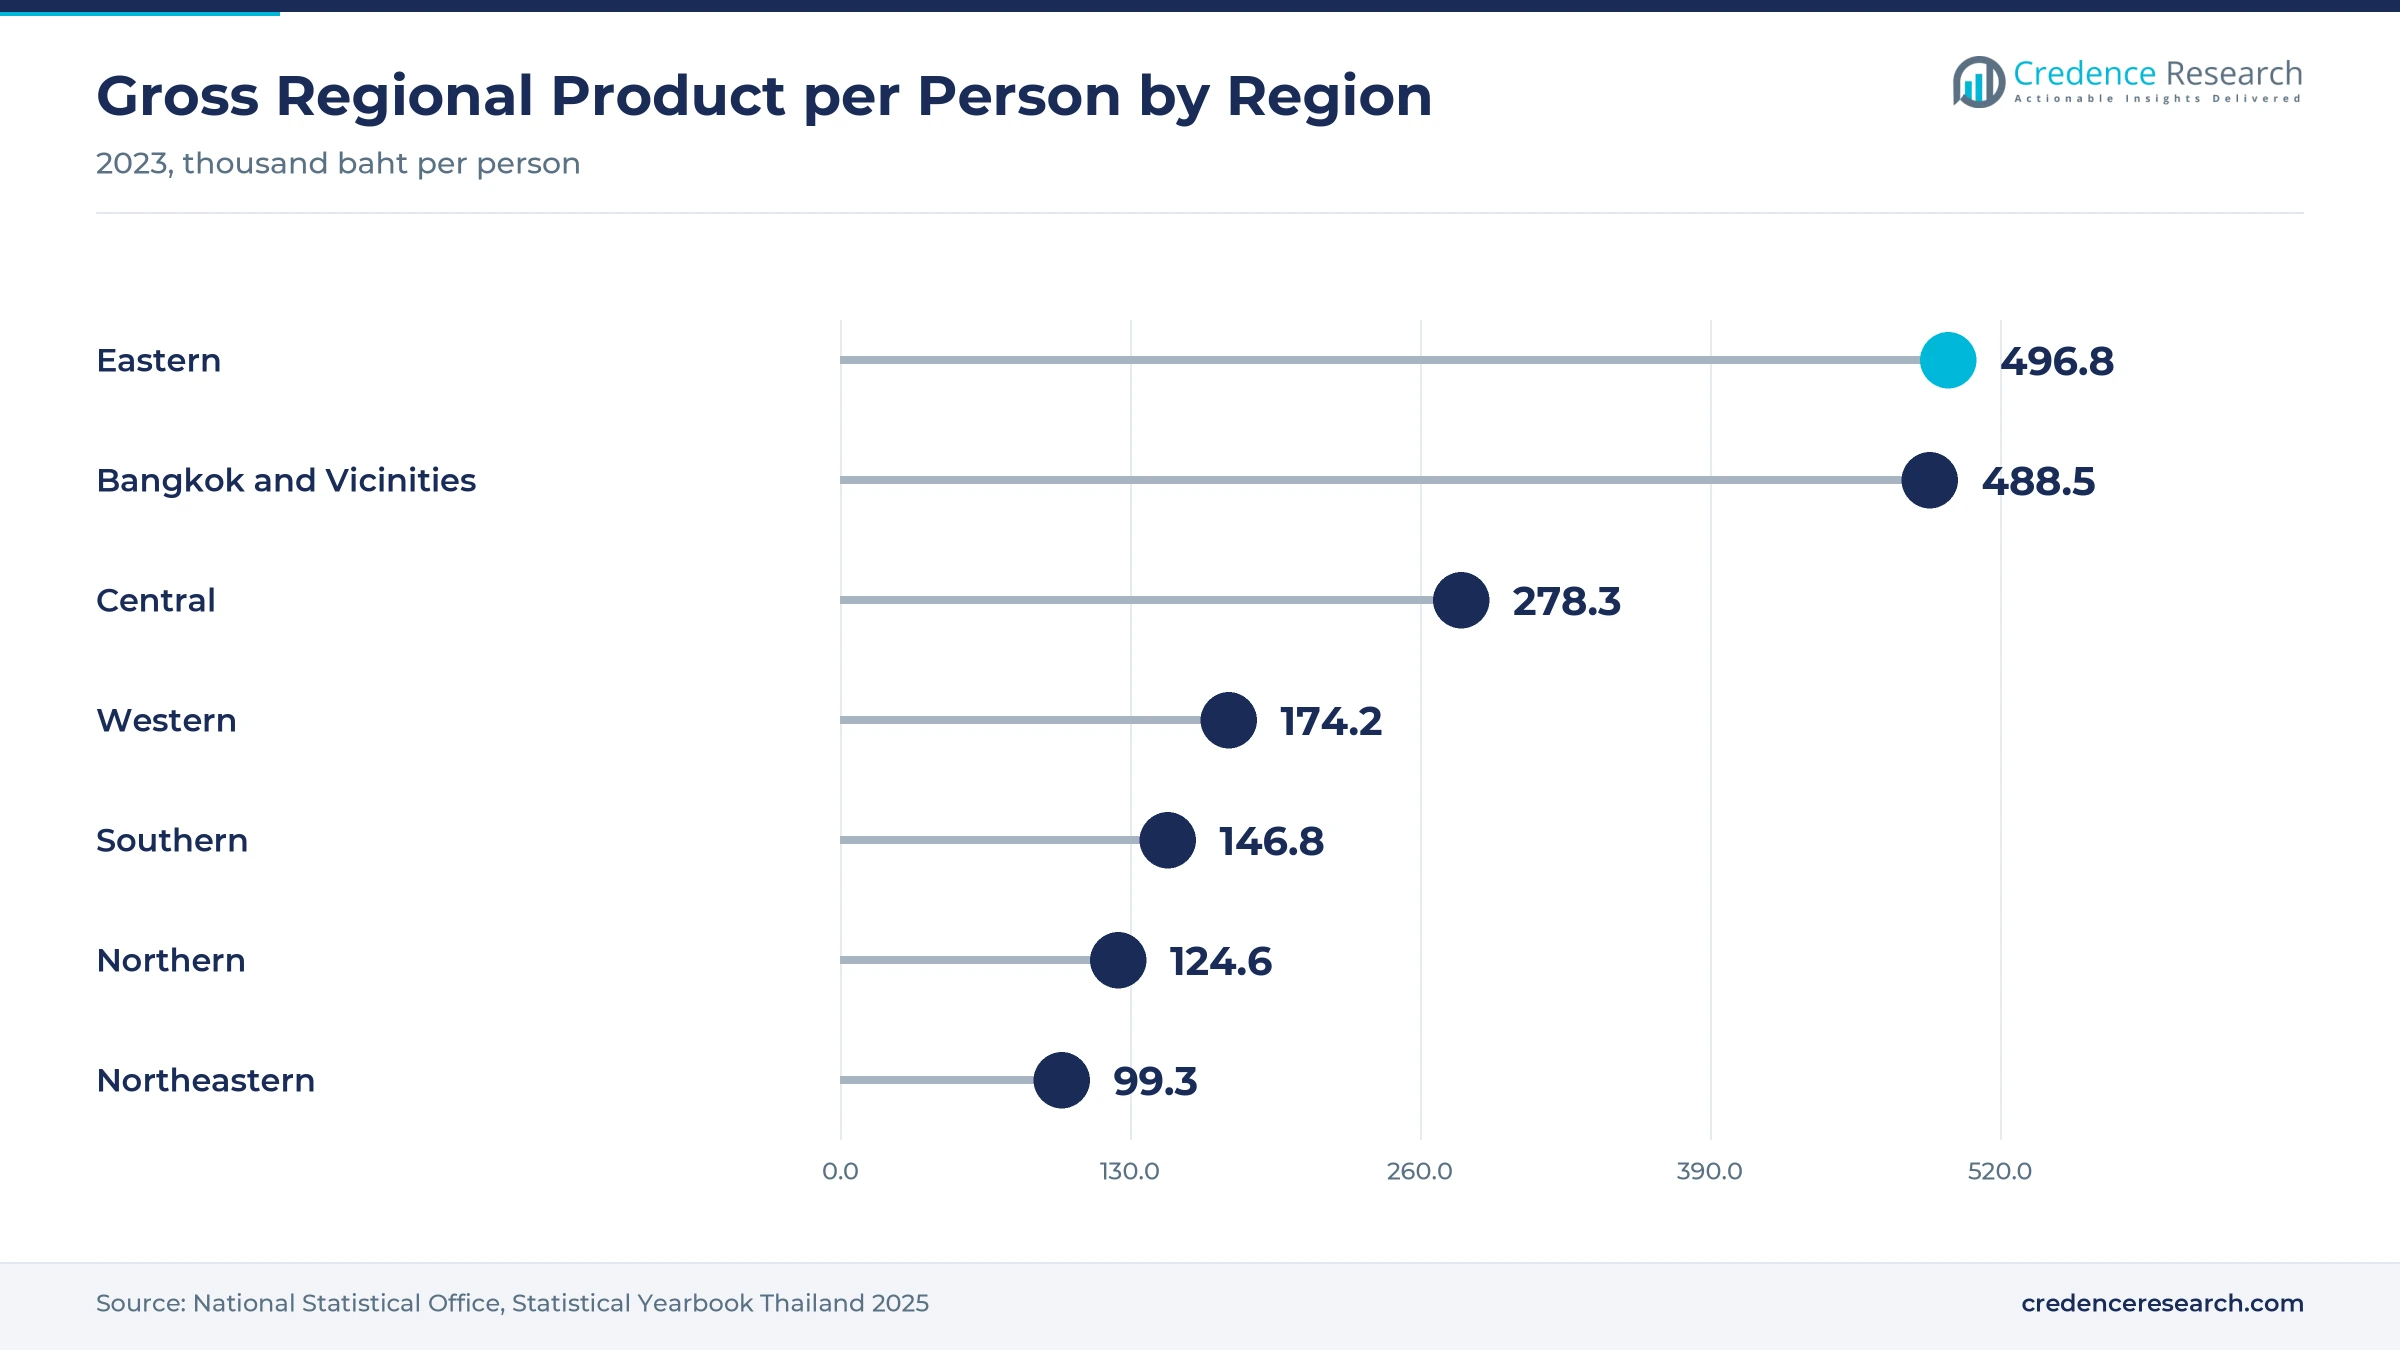
Premium recipes and higher incomes lift value, because parents with fewer children spend more on each tin and meal. The Bangkok and vicinities zone produced 8.57 trillion baht of gross regional product in 2023, nearly half of national output, according to the National Statistical Office. Output per person there reached 488,534 baht, almost twice the national figure of 256,345 baht. The Thai FDA also approved the human milk oligosaccharide 2'-FL for infant and follow-up formula, and nearly 15% of new formula launches in 2023 already contained it, according to Dairy News Today. Consequently, super-premium products grow at 3.30% a year, the fastest of any price tier.
How do local plants and ASEAN supply scale support supply?
Local plants and regional supply scale support steady supply, because large makers can produce milk powder close to Thai buyers and export the surplus. Danone runs its Bangplee factory in Samut Prakan with about 500 people, making milk powder and UHT products for Thailand and nearby markets. Thailand is the largest dairy exporter in ASEAN and enjoys tariff-free access to every member country, according to the Government Public Relations Department. Nestlé invested more than 27.8 billion baht in Thailand from 2018 to 2025 and announced a further 23 billion baht plant in July 2026. In turn, local supply of whole milk powder and packaging keeps lead times short for formula brands.
Why does online shopping widen access for parents?
Online shopping widens access for parents, because busy families can compare formula prices, check stock and order heavy tins for home delivery. Thailand's e-commerce market reached about 1.1 trillion baht in 2024, up from 980 billion baht in 2023, according to Thailand Business News. Bangkok alone had 5,455,020 registered residents at the end of 2024, which gives online sellers a dense delivery zone. Provincial parents also use platforms to find specialty and imported brands that local stores do not carry. As a result, online retail holds a growing share of repeat formula purchases and grows faster than any store channel through 2035.
HMO formulas, value per child and exports reshape demand
How is the shift to HMO and science-led formulas playing out?
Formula brands are shifting toward HMO and science-led recipes, because parents now compare ingredients that aim to bring formula closer to breast milk. The Thai FDA approved 2'-FL for infant and follow-up formula in early 2024, after allowing it only in flavored milk drinks for children aged three and above. Nearly 15% of new infant formula launches in 2023 already contained 2'-FL, which shows how quickly brands moved. FrieslandCampina Ingredients is now the only supplier of both HMOs and GOS in Thailand. As a result, premium and super-premium tiers gain share, while value products grow at less than 1% a year.
Why is spending shifting from volume to value per child?
Spending is shifting from volume to value per child, because Thailand has fewer babies each year while parents spend more on each one. Thailand recorded 462,240 births and 571,646 deaths in 2024, according to Khaosod English, citing the Department of Provincial Administration. The crude birth rate fell to 8.1 per 1,000 people in 2024 from 9.4 in 2018, according to World Bank data. The total fertility rate reached about 1.0 in 2024, below the rate in Japan. Consequently, the 0-6 months group grows slowest, while toddler snacks, growing-up milks and premium formulas gain value as parents concentrate spending on one child.
Can regional exports open new outlets for local plants?
Regional exports offer a clear opportunity, because plants built for the Thai market can use spare capacity to serve neighboring countries with growing birth cohorts. Thai dairy exports to ASEAN reached US$582.62 million in 2024, up 11.5% from the year before, with key markets in Malaysia, Vietnam, Indonesia, Singapore, the Philippines and Myanmar. Thai dairy goods enter all ASEAN countries tariff-free, and free trade agreements also cover China, Australia, New Zealand, Chile and Hong Kong. Danone's Bangplee plant, with about 500 workers, already supplies Cambodia, Vietnam, Malaysia and Singapore from Samut Prakan. Brands that make formula and breakfast cereals locally can therefore spread fixed costs and keep domestic prices stable.
Is there an opening in policies that support parenthood?
Policies that support parenthood offer a second opening, because more help for couples could slow the fall in births. Deputy Public Health Minister Santi Promphat said in September 2024 that raising the birth rate should become a national agenda. He also proposed easier access to assisted reproduction and changes to rules that limit women's access to such services. The Public Health Ministry launched the Give Birth, Great World campaign in 2023 to promote parenthood among young couples. The fertility rate fell from 1.491 in 2021 to 1.476 in 2022 and 1.461 in 2023, which shows the scale of the task. Brands that support these programs could win early trust with first-time parents.
Falling births and strict marketing rules limit volume
How do falling births cap volume growth?
Falling births cap volume growth, because each year fewer babies enter the formula and weaning stages. Births fell below 500,000 in 2024 for the first time since 1949, and deaths exceeded births for the fourth year in a row. As a result, total tins and meals sold decline slowly, and brands must rely on higher prices and new products. Makers that widen ranges for toddlers and older children can offset part of this pressure.
Why do marketing rules limit brand promotion?
Marketing rules limit brand promotion, because Thailand's infant feeding law, in force since Sept. 9, 2017, restricts advertising, samples, discount coupons and gifts for products aimed at children up to three years old. Violations of the advertising rules can bring up to one year in prison. Consequently, brands depend more on product quality, pharmacist advice and word of mouth to win new parents, which slows the launch of new products.
Does rising breastfeeding reduce formula demand?
Rising breastfeeding can reduce formula demand in the first months, because more mothers now feed only breast milk at the start. Exclusive breastfeeding in the first six months doubled from 14% in 2019 to 29% in 2022. In turn, the 0-6 months group grows slowest across the forecast period. Brands therefore shift focus toward follow-up milks, cereals and snacks for older infants, where paid feeding remains common.
How do input and currency costs squeeze margins?
Input and currency costs squeeze margins, because formula makers rely on imported dairy proteins, lactose and special ingredients priced in foreign currencies. A weaker baht raises the cost of each tin before it reaches the shelf. However, retailers resist frequent price increases on such an essential product. Consequently, makers must balance local sourcing, pack sizes and recipe changes to protect margins without losing buyers.
Bangkok leads while the eastern provinces grow fastest
| Region | Value, 2025 (USD billion) | Share, 2025 | CAGR, 2026–2035 |
|---|---|---|---|
| Bangkok Metropolitan Region | 0.50 | 42.0% | 2.01% |
| Central & Eastern | 0.25 | 21.0% | 2.26% |
| Northeastern | 0.20 | 17.0% | 1.31% |
| Northern | 0.12 | 10.0% | 1.21% |
| Southern | 0.12 | 10.0% | 1.71% |
Why does the Bangkok Metropolitan Region lead spending?
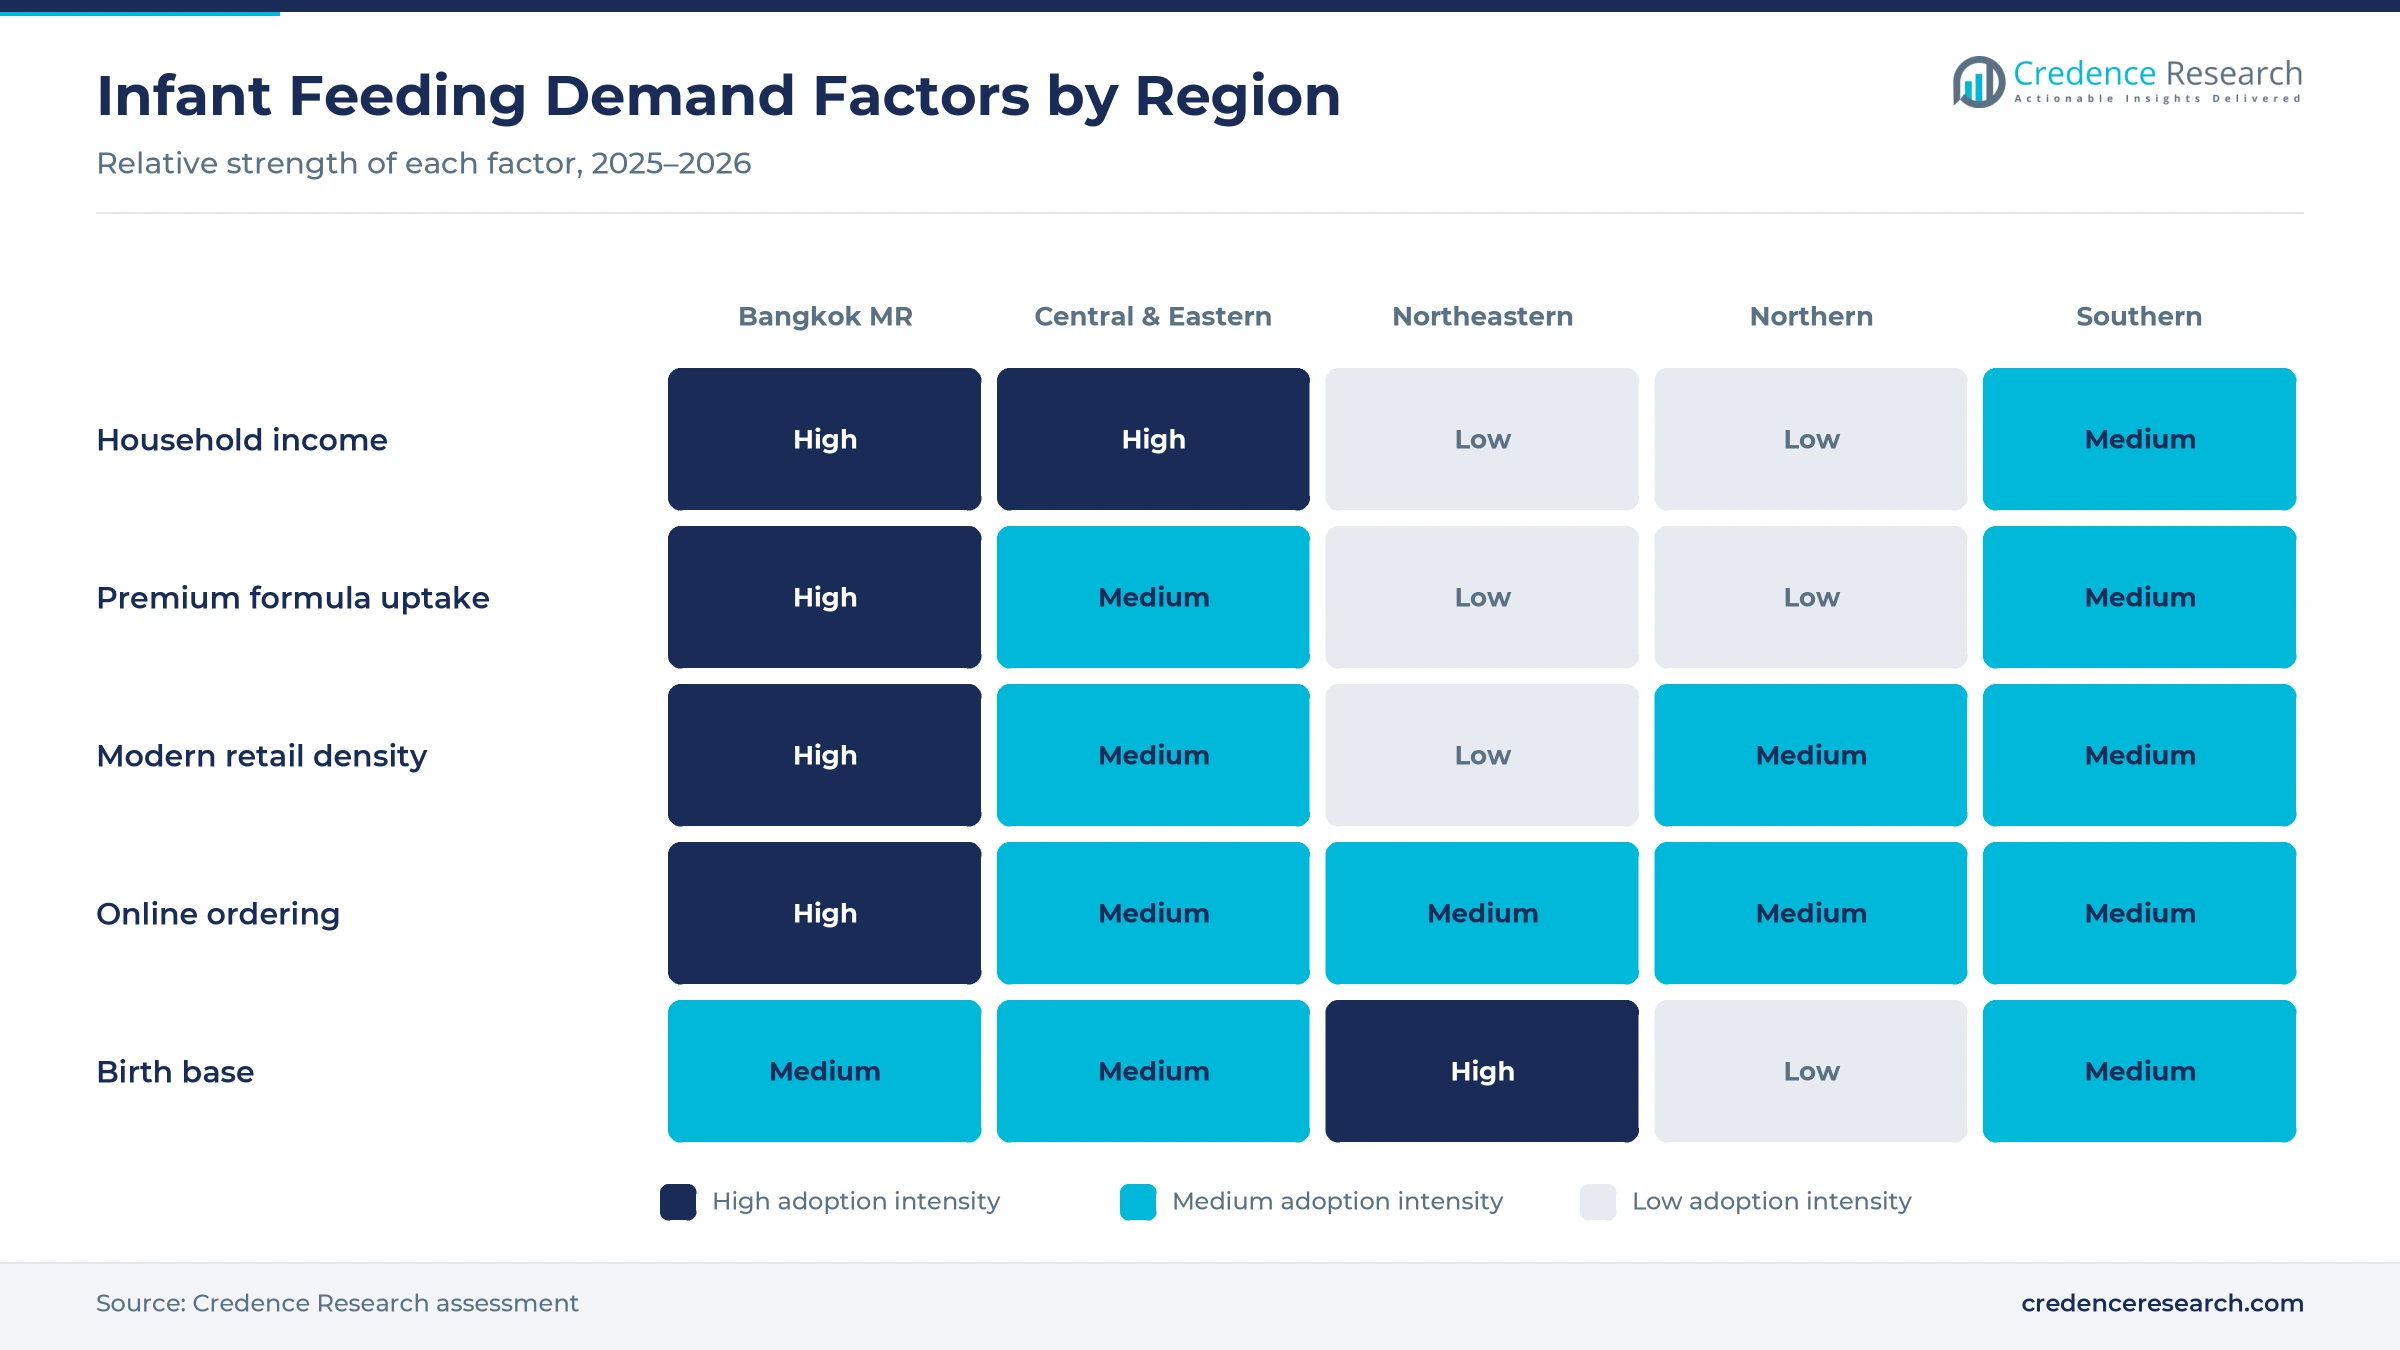
The Bangkok Metropolitan Region held 42.0% of 2025 value and grows at 2.01% a year, because the capital zone has the highest incomes, the most working parents and the densest modern retail. Bangkok and its vicinities produced 8.57 trillion baht of output in 2023, with 488,534 baht per person. Bangkok alone had 5,455,020 registered residents at the end of 2024. Premium formulas, organic meals and online orders are more common here than in any other zone of the country.
Why is the Central & eastern zone growing fastest?
The Central & Eastern zone held 21.0% of 2025 value and grows fastest at 2.26% a year, because the eastern industrial provinces have the highest output per person in Thailand. The Eastern region recorded 496,847 baht per person in 2023, above the capital zone. Factory jobs draw young families to Chonburi and Rayong, which lifts demand for formula and weaning foods in modern stores. Online orders also reach the many new housing estates around these industrial estates.
What shapes Northeastern demand?
The Northeastern region held 17.0% of 2025 value and grows at 1.31% a year, because a large population offsets the lowest incomes in the country. Output per person reached only 99,271 baht in 2023, so families favor value and mainstream formulas. Many young parents also work in Bangkok while grandparents care for children at home, which shapes how and where formula is bought. Supermarkets in Khon Kaen, Nakhon Ratchasima and Udon Thani carry most premium brands in the region.
How does the Southern region add demand?
The Southern region held 10.0% of 2025 value and grows at 1.71% a year, supported by tourism, rubber and fishing incomes. Output per person in the region reached 146,832 baht in 2023, well below the capital zone. Supermarkets in Hat Yai, Phuket and Surat Thani carry most formula and cereal sales, while online orders reach smaller towns.
Why does the Northern region grow slowest?
The Northern region held 10.0% of 2025 value and grows at 1.21% a year, because births are low and the population is aging faster than in most zones. Output per person in the region reached 124,552 baht in 2023, the second lowest of any region. Chiang Mai remains the main retail hub for premium formula and baby specialty stores in the region.
Approvals, birth data and plant investments
| Development | Status and market relevance |
|---|---|
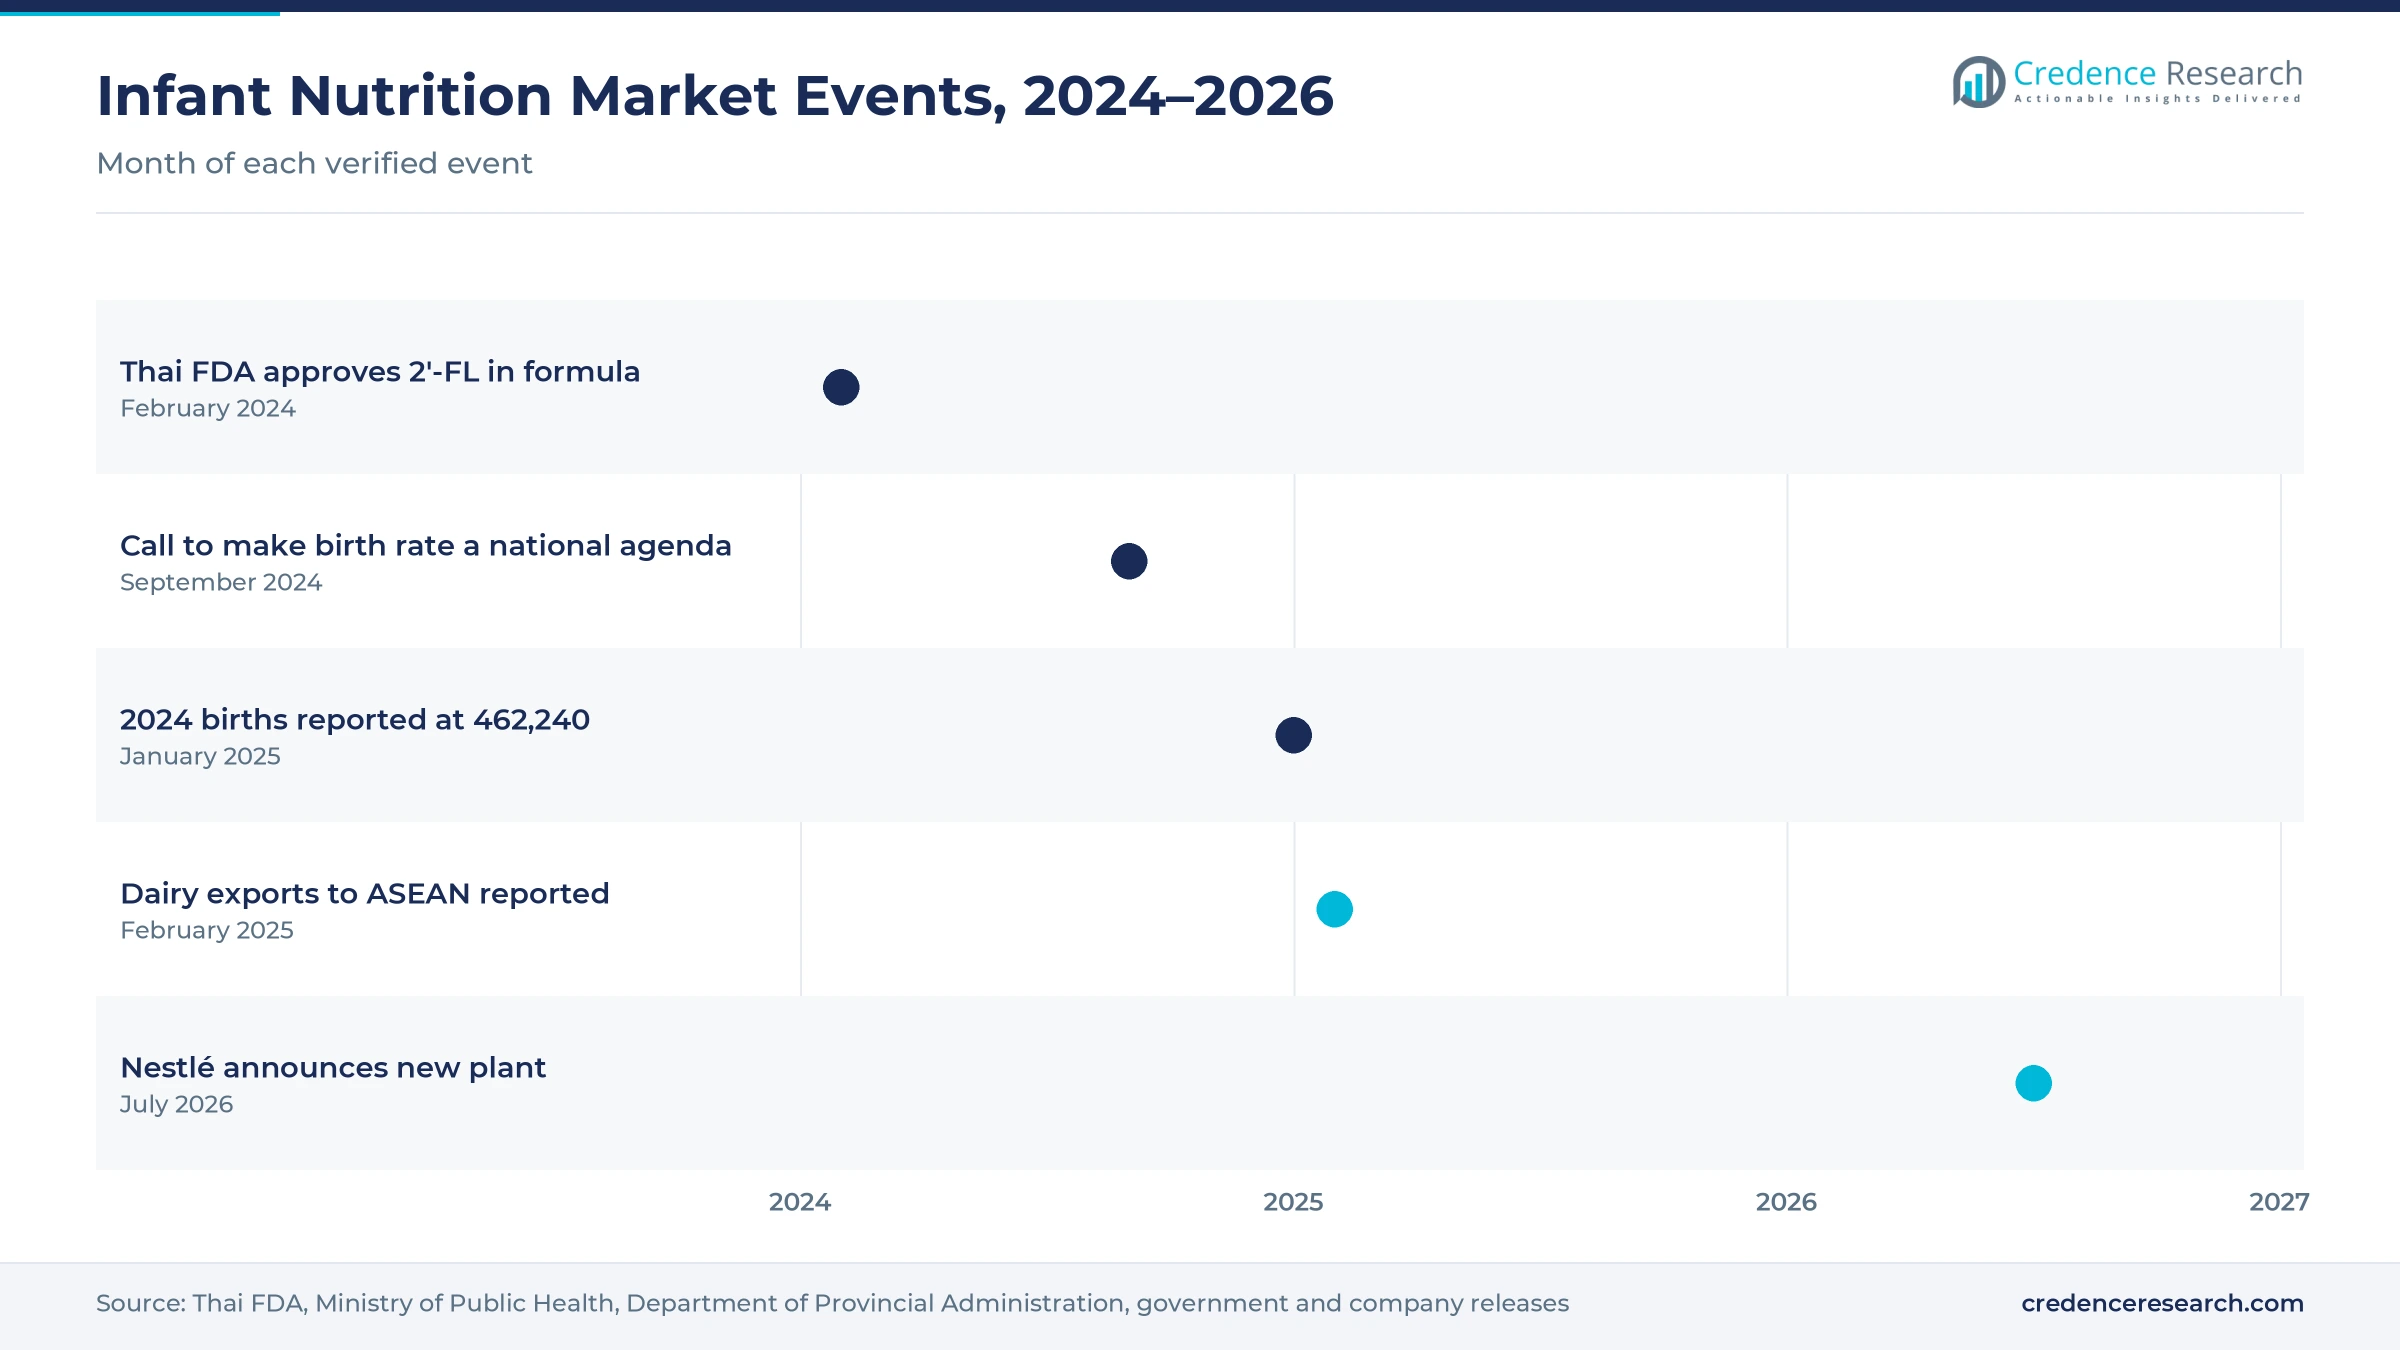
| In February 2024, FrieslandCampina Ingredients announced Thai FDA approval of its 2'-FL for use in infant and follow-up formula. | Opens the way for more HMO-based premium recipes |
| In September 2024, Deputy Public Health Minister Santi Promphat called for raising the birth rate to become a national agenda. | Signals policy support for parenthood |
| In January 2025, the Department of Provincial Administration reported 462,240 births for 2024, the lowest in about 75 years. | Confirms a shrinking base of infants |
| In February 2025, the government reported US$582.62 million of dairy exports to ASEAN in 2024, up 11.5%. | Shows the regional reach of Thai dairy plants |
| In July 2026, Nestlé announced a 23 billion baht manufacturing plant in Samut Prakan province. | Extends the company's investment base in Thailand |
HMOs, fortified cereals and pouches change formats
- Human milk oligosaccharides such as 2'-FL are added to premium formulas to support gut and immune health, which lets brands justify higher prices.
- Prebiotic blends that combine HMOs and GOS give makers more ways to differentiate formulas, since one supplier now offers both in Thailand.
- Fortified cereals with added iron and vitamins help parents meet nutrition needs during weaning, when stunting risks are highest.
- Resealable pouches and tins improve hygiene and portion control, and suppliers of powder packaging are testing lighter tins and refill bags for formula.
Need a Custom Version of This Report?
Tailor the scope, geography, or segments to your exact requirements.
- Custom geography or segment scope
- Direct access to our analyst team
Multinationals and local brands compete on science and price
Competition is led by multinational formula makers, with growing pressure from local brands in cereals, meals and snacks. Danone Specialized Nutrition manages Dumex and Hi-Q from its Bangkok office and runs a milk powder plant in Samut Prakan. Nestlé competes across many food categories and keeps investing in Thai plants. FrieslandCampina supplies ingredients such as 2'-FL and GOS that shape premium formula recipes. Brands compete on recipe science, pharmacist trust, price per tin, pack size and online visibility, because strict marketing rules limit direct advertising to parents. Local makers of cereals, purees and snacks compete on Thai flavors, rice-based recipes and lower prices. Companies that also sell formula milk across ASEAN can spread research costs over larger volumes.
Companies profiled and their roles in this market
| Company | Type | Role in the market |
|---|---|---|
| Danone Specialized Nutrition (Thailand) Co., Ltd. | Multinational | Manages Dumex and Hi-Q; runs the Bangplee milk powder plant |
| Nestlé (Thai) Ltd. | Multinational | Invested more than 27.8 billion baht in Thailand from 2018 to 2025 |
| FrieslandCampina (Thailand) PCL | Multinational | Group ingredient unit won Thai approval for 2'-FL in formula in 2024 |
Credence Research view on value-led infant feeding
Credence Research's view is that Thai baby food and infant nutrition spending will grow slowly but steadily through 2035, because higher spending per child offsets fewer births. Infant formula already holds 72.0% of 2025 value, and HMO recipes keep lifting average prices. Local plants and ASEAN trade links also keep supply stable when global dairy prices move. However, falling births and strict marketing rules will cap volumes. Premium formulas, toddler snacks and online sales should lead growth, while the Bangkok Metropolitan Region keeps the largest share.
How the infant feeding spending estimate was built
The report uses 2025 as the base year, with values in USD million at current prices. Market values come from the Credence Research model, which combines births, child population, feeding practices, product use and average prices. Regional zones and shares are Credence Research estimates built from National Statistical Office regional product data, and segment splits are also Credence Research estimates. Sources used are government statistics, World Bank data, UNICEF survey results, company releases and news reports, and no interviews or surveys were used.
Premium formulas and online sales set the path to 2035
The market is expected to reach USD 1.45 billion by 2035, a 1.84% CAGR during 2026–2035, as premium recipes, weaning foods and online sales lift value per child. Growth should be strongest in the Central & Eastern zone and in online retail, while the Bangkok Metropolitan Region keeps the largest share. Snacks, prepared meals and super-premium formulas will gain share as parents trade up. Brands that combine HMO science with fair prices should win trust. In contrast, a sharper fall in births or tighter marketing rules would slow growth.
Frequently Asked Questions
How big is the Thailand baby food and infant nutrition market?
Which region leads spending in Thailand?
Which region grows fastest?
Which product type holds the largest share?
How do falling births affect the market?
Which sales channel grows fastest?
Who are the leading companies in Thailand?
How do marketing rules affect brands?
Table of Content
Chapter 1 Market Segmentation
- 1.1 Segmentation Framework
- 1.1.1 Product and Service Classification
- 1.1.2 Application and End-Use Classification
- 1.1.3 Technology and Solution Classification
- 1.1.4 Customer and Distribution Channel Classification
- 1.1.5 Geographic Segmentation
- 1.1.6 Market Segment Definitions and Boundaries
- 1.2 By Product Type
- 1.2.1 Infant Formula
- 1.2.2 Baby Cereals
- 1.2.3 Prepared Baby Foods
- 1.2.4 Baby Snacks
- 1.3 By Age Group
- 1.3.1 0-6 Months
- 1.3.2 6-12 Months
- 1.3.3 12-24 Months
- 1.3.4 24+ Months
- 1.4 By Price Tier
- 1.4.1 Value
- 1.4.2 Mainstream
- 1.4.3 Premium
- 1.4.4 Super-Premium
Chapter 2 Introduction
- 2.1 Report Objectives and Scope
- 2.2 Product Definition and Industry Terminology
- 2.3 Market Inclusions and Exclusions
- 2.4 Research Process
- 2.4.1 Primary Research and Expert Interviews
- 2.4.2 Secondary Research and Source Review
- 2.4.3 Top-Down and Bottom-Up Estimation
- 2.4.4 Data Triangulation and Verification
- 2.5 Market Size Measurement Basis
- 2.5.1 2025: USD 1.19 billion → 2035: USD 1.45 billion
- 2.6 Historical and Forecast Reference Periods
- 2.6.1 Historical Period: 2018-2025
- 2.6.2 Base Year: 2025
- 2.6.3 Forecast Period: 2025-2035
- 2.7 Research Assumptions and Limitations
Chapter 3 Executive Summary
- 3.1 Market Snapshot and Key Findings
- 3.2 Base-Year Market Size, 2025
- 3.3 Forecast Market Size, 2035
- 3.4 Revenue and Volume Growth Outlook
- 3.5 Key Demand and Supply Indicators
- 3.6 Leading Market Segments
- 3.7 Fastest-Growing Market Opportunities
- 3.8 Regional Performance Highlights
- 3.9 Technology and Industry Transformation
- 3.10 Competitive Landscape Summary
- 3.11 Analyst View and Strategic Implications
Chapter 4 Thailand Baby Food and Infant Nutrition Market Trends and Developments
- 4.1 Historical Industry Development, 2018-2025
- 4.2 Recent Market Trends and Developments
- 4.3 Demand and Customer Behavior Trends
- 4.4 Technology and Product Innovation
- 4.5 Artificial Intelligence, Automation and Digitalization
- 4.6 Local Manufacturing and Supply Chain Realignment
- 4.7 Industry Partnerships, Mergers and Acquisitions
- 4.8 Sustainability and Circular Economy Developments
- 4.9 Government and Private Sector Investment Trends
- 4.10 Emerging Business Models and Commercialization
- 4.11 Industry Developments and Announcements
Chapter 5 Thailand Baby Food and Infant Nutrition Market Production, Supply and Demand Analysis
- 5.1 Demand Trend and Consumption Analysis, 2018-2025
- 5.2 Demand Forecast, 2025-2035
- 5.3 Production and Output Trend, 2018-2025
- 5.4 Production and Output Forecast, 2025-2035
- 5.5 Installed Capacity and Capacity Utilization
- 5.6 Company-Wise Production Plants and Statistics
- 5.6.1 Installed Production Capacity
- 5.6.2 Actual Production
- 5.6.3 Planned Capacity and Expansion Targets
- 5.7 Supply Chain Structure and Procurement Trends
- 5.8 Supply-Demand Gap and Bottlenecks
- 5.9 Import Dependence and Sourcing Structure
- 5.10 Contract Manufacturing and Outsourcing
- 5.11 Regional Supply and Demand Concentration
Chapter 6 Thailand Baby Food and Infant Nutrition Market Pricing Analysis
- 6.1 Pricing Structure and Measurement
- 6.2 Historical Pricing Trends, 2018-2025
- 6.3 Pricing Outlook, 2025-2035
- 6.4 Average Selling Price and Unit Economics
- 6.5 Pricing by Product and Market Segment
- 6.6 Geographic Pricing Differences
- 6.7 Key Input, Energy, Labor and Logistics Costs
- 6.8 Contract Pricing and Purchasing Models
- 6.9 Pricing Sensitivity and Competitive Positioning
- 6.10 Price, Margin and Profitability Implications
Chapter 7 Thailand Baby Food and Infant Nutrition Market Dynamics
- 7.1 Market Growth Drivers
- 7.1.1 Demand-Side Drivers
- 7.1.2 Technology and Innovation Drivers
- 7.1.3 Infrastructure and Investment Drivers
- 7.1.4 Regulatory and Policy Drivers
- 7.2 Market Restraints
- 7.2.1 Cost and Affordability Constraints
- 7.2.2 Technology and Adoption Barriers
- 7.2.3 Supply Chain and Operational Constraints
- 7.3 Market Challenges
- 7.3.1 Competitive Pressure and Margin Erosion
- 7.3.2 Skills, Infrastructure and Implementation Gaps
- 7.4 Emerging Market Opportunities
- 7.5 Market Dynamics Impact and Time-Horizon Assessment
Chapter 8 Thailand Baby Food and Infant Nutrition Value Chain Analysis
- 8.1 Industry Value Chain Overview
- 8.2 Upstream Suppliers and Critical Inputs
- 8.3 Technology and Component Providers
- 8.4 Manufacturing or Service Delivery
- 8.5 Distribution, Channel Partners and Integrators
- 8.6 Downstream Applications and End Users
- 8.7 Value Addition and Profit Pools
- 8.8 Vertical Integration and Outsourcing
- 8.9 Supplier Concentration and Risk
- 8.10 Supply Chain Localization and Resilience
Chapter 9 Thailand Baby Food and Infant Nutrition Market Regulations and Policies
- 9.1 Relevant Laws, Standards and Compliance Frameworks
- 9.2 Product, Service, Safety and Quality Requirements
- 9.3 Government Policies, Incentives and Subsidies
- 9.4 Imports, Exports and Trade Barriers
- 9.5 Public Procurement and Local Content Requirements
- 9.6 Environmental and Sustainability Compliance
- 9.7 Upcoming Policy Changes and Market Implications
Chapter 10 Thailand Baby Food and Infant Nutrition Market Hotspots and Opportunities
- 10.1 Market Opportunity Mapping and Growth Hotspots
- 10.2 High-Growth Applications and Customer Groups
- 10.3 Underserved Markets and White-Space Opportunities
- 10.4 Emerging Technology and Product Opportunities
- 10.5 New Capacity and Investment Hotspots
- 10.6 Market Entry and Expansion Opportunities
- 10.7 Distribution and Partnership Opportunities
- 10.8 Near-Term and Long-Term Commercial Potential
- 10.9 Opportunity Attractiveness and Execution Risks
Chapter 11 Thailand Baby Food and Infant Nutrition Market Outlook, 2025-2035
- 11.1 Market Size and Analysis
- 11.1.1 Revenue (Market Measurement: 2025: USD 1.19 billion → 2035: USD 1.45 billion)
- 11.1.2 Market Volume and Quantity Sold
- 11.1.3 Historical Market Size, 2018-2025
- 11.1.4 Base-Year Market Size, 2025
- 11.2 Market Forecast, 2025-2035
- 11.2.1 Revenue Forecast to 2035
- 11.2.2 Volume Forecast to 2035
- 11.2.3 CAGR and Year-on-Year Growth
- 11.2.4 Incremental Revenue Opportunity
- 11.3 Forecast Assumptions and Scenario Analysis
- 11.3.1 Base-Case Forecast
- 11.3.2 Optimistic and Conservative Scenarios
- 11.3.3 Technology, Pricing and Policy Sensitivities
- 11.4 Market Attractiveness and Growth Outlook
Chapter 12 Thailand Baby Food and Infant Nutrition Market Segmentation and Outlook
- 12.1 Segmentation Summary and Market Shares, 2025
- 12.2 Largest and Fastest-Growing Segments
- 12.3 By Product Type - Market Size and Forecast, 2025-2035
- 12.3.1 Segment Definition and Scope
- 12.3.2 Historical Market Size, 2018-2025
- 12.3.3 Revenue Forecast, 2025-2035
- 12.3.4 Volume Forecast, 2025-2035
- 12.3.5 Base-Year Market Share, 2025
- 12.3.6 Segment CAGR and Growth Drivers
- 12.3.7 Subsegment Market Size and Forecast
- 12.3.7.1 Infant Formula
- 12.3.7.2 Baby Cereals
- 12.3.7.3 Prepared Baby Foods
- 12.3.7.4 Baby Snacks
- 12.3.8 Subsegment Pricing and Adoption Trends
- 12.3.9 Leading Suppliers and Competition
- 12.3.10 Regional Demand and Opportunities
- 12.4 By Age Group - Market Size and Forecast, 2025-2035
- 12.4.1 Segment Definition and Scope
- 12.4.2 Historical Market Size, 2018-2025
- 12.4.3 Revenue Forecast, 2025-2035
- 12.4.4 Volume Forecast, 2025-2035
- 12.4.5 Base-Year Market Share, 2025
- 12.4.6 Segment CAGR and Growth Drivers
- 12.4.7 Subsegment Market Size and Forecast
- 12.4.7.1 0-6 Months
- 12.4.7.2 6-12 Months
- 12.4.7.3 12-24 Months
- 12.4.7.4 24+ Months
- 12.4.8 Subsegment Pricing and Adoption Trends
- 12.4.9 Leading Suppliers and Competition
- 12.4.10 Regional Demand and Opportunities
- 12.5 By Price Tier - Market Size and Forecast, 2025-2035
- 12.5.1 Segment Definition and Scope
- 12.5.2 Historical Market Size, 2018-2025
- 12.5.3 Revenue Forecast, 2025-2035
- 12.5.4 Volume Forecast, 2025-2035
- 12.5.5 Base-Year Market Share, 2025
- 12.5.6 Segment CAGR and Growth Drivers
- 12.5.7 Subsegment Market Size and Forecast
- 12.5.7.1 Value
- 12.5.7.2 Mainstream
- 12.5.7.3 Premium
- 12.5.7.4 Super-Premium
- 12.5.8 Subsegment Pricing and Adoption Trends
- 12.5.9 Leading Suppliers and Competition
- 12.5.10 Regional Demand and Opportunities
- 12.6 Segment Growth Comparison
- 12.7 Segment Attractiveness and Priority Matrix
Chapter 13 Thailand Baby Food and Infant Nutrition Geographic Market Outlook, 2025-2035
- 13.1 Regional Market Size and Country-Level Shares, 2025
- 13.2 Country Market Size Comparison, 2025
- 13.3 Country Market Forecasts, 2025-2035
- 13.4 Subregional Industrial and Demand Clusters
- 13.5 Intra-Regional Pricing and Cost Differences
- 13.6 Cross-Border Trade and Supply Networks
- 13.7 Regional Supply and Demand Balances
- 13.8 Country Opportunity Comparison and Prioritization
Note: Every listed country is covered on the structure shown under the first country.
Chapter 14 Thailand Baby Food and Infant Nutrition Technology, Innovation and Sustainability Outlook
- 14.1 Technology Landscape and Maturity
- 14.2 Product, Process and Service Innovation
- 14.3 AI, Automation and Digital Tools in the Industry
- 14.4 Technology Adoption and Performance Benchmarking
- 14.5 Innovation Pipeline and R&D Investment
- 14.6 Patent and Intellectual Property Trends
- 14.7 Energy Efficiency and Resource Management
- 14.8 Sustainability, Recycling and Circularity
- 14.9 Technology Roadmap, 2025-2035
- 14.10 Risks of Obsolescence and Technology Substitution
Chapter 15 Thailand Baby Food and Infant Nutrition Market Key Strategic Imperatives
- 15.1 Growth and Market Entry Priorities
- 15.2 High-Return Products and Segments
- 15.3 Pricing, Profitability and Cost Optimization
- 15.4 Technology Investment and Product Differentiation
- 15.5 Supply Chain Localization and Resilience
- 15.6 Distribution and Customer Acquisition
- 15.7 Partnership, Acquisition and Capacity Strategy
- 15.8 Regional Expansion Priorities
- 15.9 Short-, Medium- and Long-Term Actions
Chapter 16 Competition Outlook
- 16.1 Industry Competition Characteristics
- 16.2 Market Structure and Concentration
- 16.3 Market Share and Competitive Positioning, 2025
- 16.4 Company-Wise Revenue and Product Benchmarking
- 16.5 Production and Service Capacity Benchmarking
- 16.6 Technology, Pricing and Differentiation
- 16.7 Regional Footprint and Distribution Strength
- 16.8 Mergers, Acquisitions and Strategic Alliances
- 16.9 New Entrants and Competitive Threats
- 16.10 Porter's Five Forces and Industry Attractiveness
- 16.11 Competitive Outlook, 2025-2035
Chapter 17 Company Profiles
- 17.1 Company Coverage and Selection Criteria
- 17.2 Nestlé (Thai) Ltd.
- 17.2.1 Business Description
- 17.2.2 Company Ownership and Geographic Presence
- 17.2.3 Product and Service Portfolio
- 17.2.4 Manufacturing and Operating Footprint
- 17.2.5 Production Capacity and Expansion Plans
- 17.2.6 Financial Performance and Investment
- 17.2.7 Market Share and Competitive Position
- 17.2.8 Technology and Innovation Capabilities
- 17.2.9 Strategic Alliances or Partnerships
- 17.2.10 Recent Developments
- 17.2.11 Growth Strategy and Outlook
- 17.3 Danone Specialized Nutrition (Thailand) Co., Ltd.
- 17.4 Mead Johnson Nutrition (Thailand) Ltd.
- 17.5 Abbott Laboratories (Thailand) Ltd.
- 17.6 FrieslandCampina (Thailand) PCL
- 17.7 Peachy Village Co., Ltd.
- 17.8 Healthy Foods Co., Ltd.
- 17.9 Natural Health Foods Company Ltd.
- 17.10 Fonterra Brands (Thailand) Ltd.
- 17.11 MEGMILK SNOW BRAND Co., Ltd.
- 17.12 Other Relevant Market Participants
Note: Every listed company is profiled on the structure shown under the first company. The company list is preliminary and may change based on research findings, market developments, data availability and client requirements.
Chapter 18 Disclaimer
- 18.1 Research and Forecast Disclaimer
- 18.2 Data Source and Estimation Limitations
Note: The depth of individual sections depends on data availability for this market. Volume, capacity, trade and other unit-based metrics are included where applicable.

