
Video-first audiences push brands toward creator software
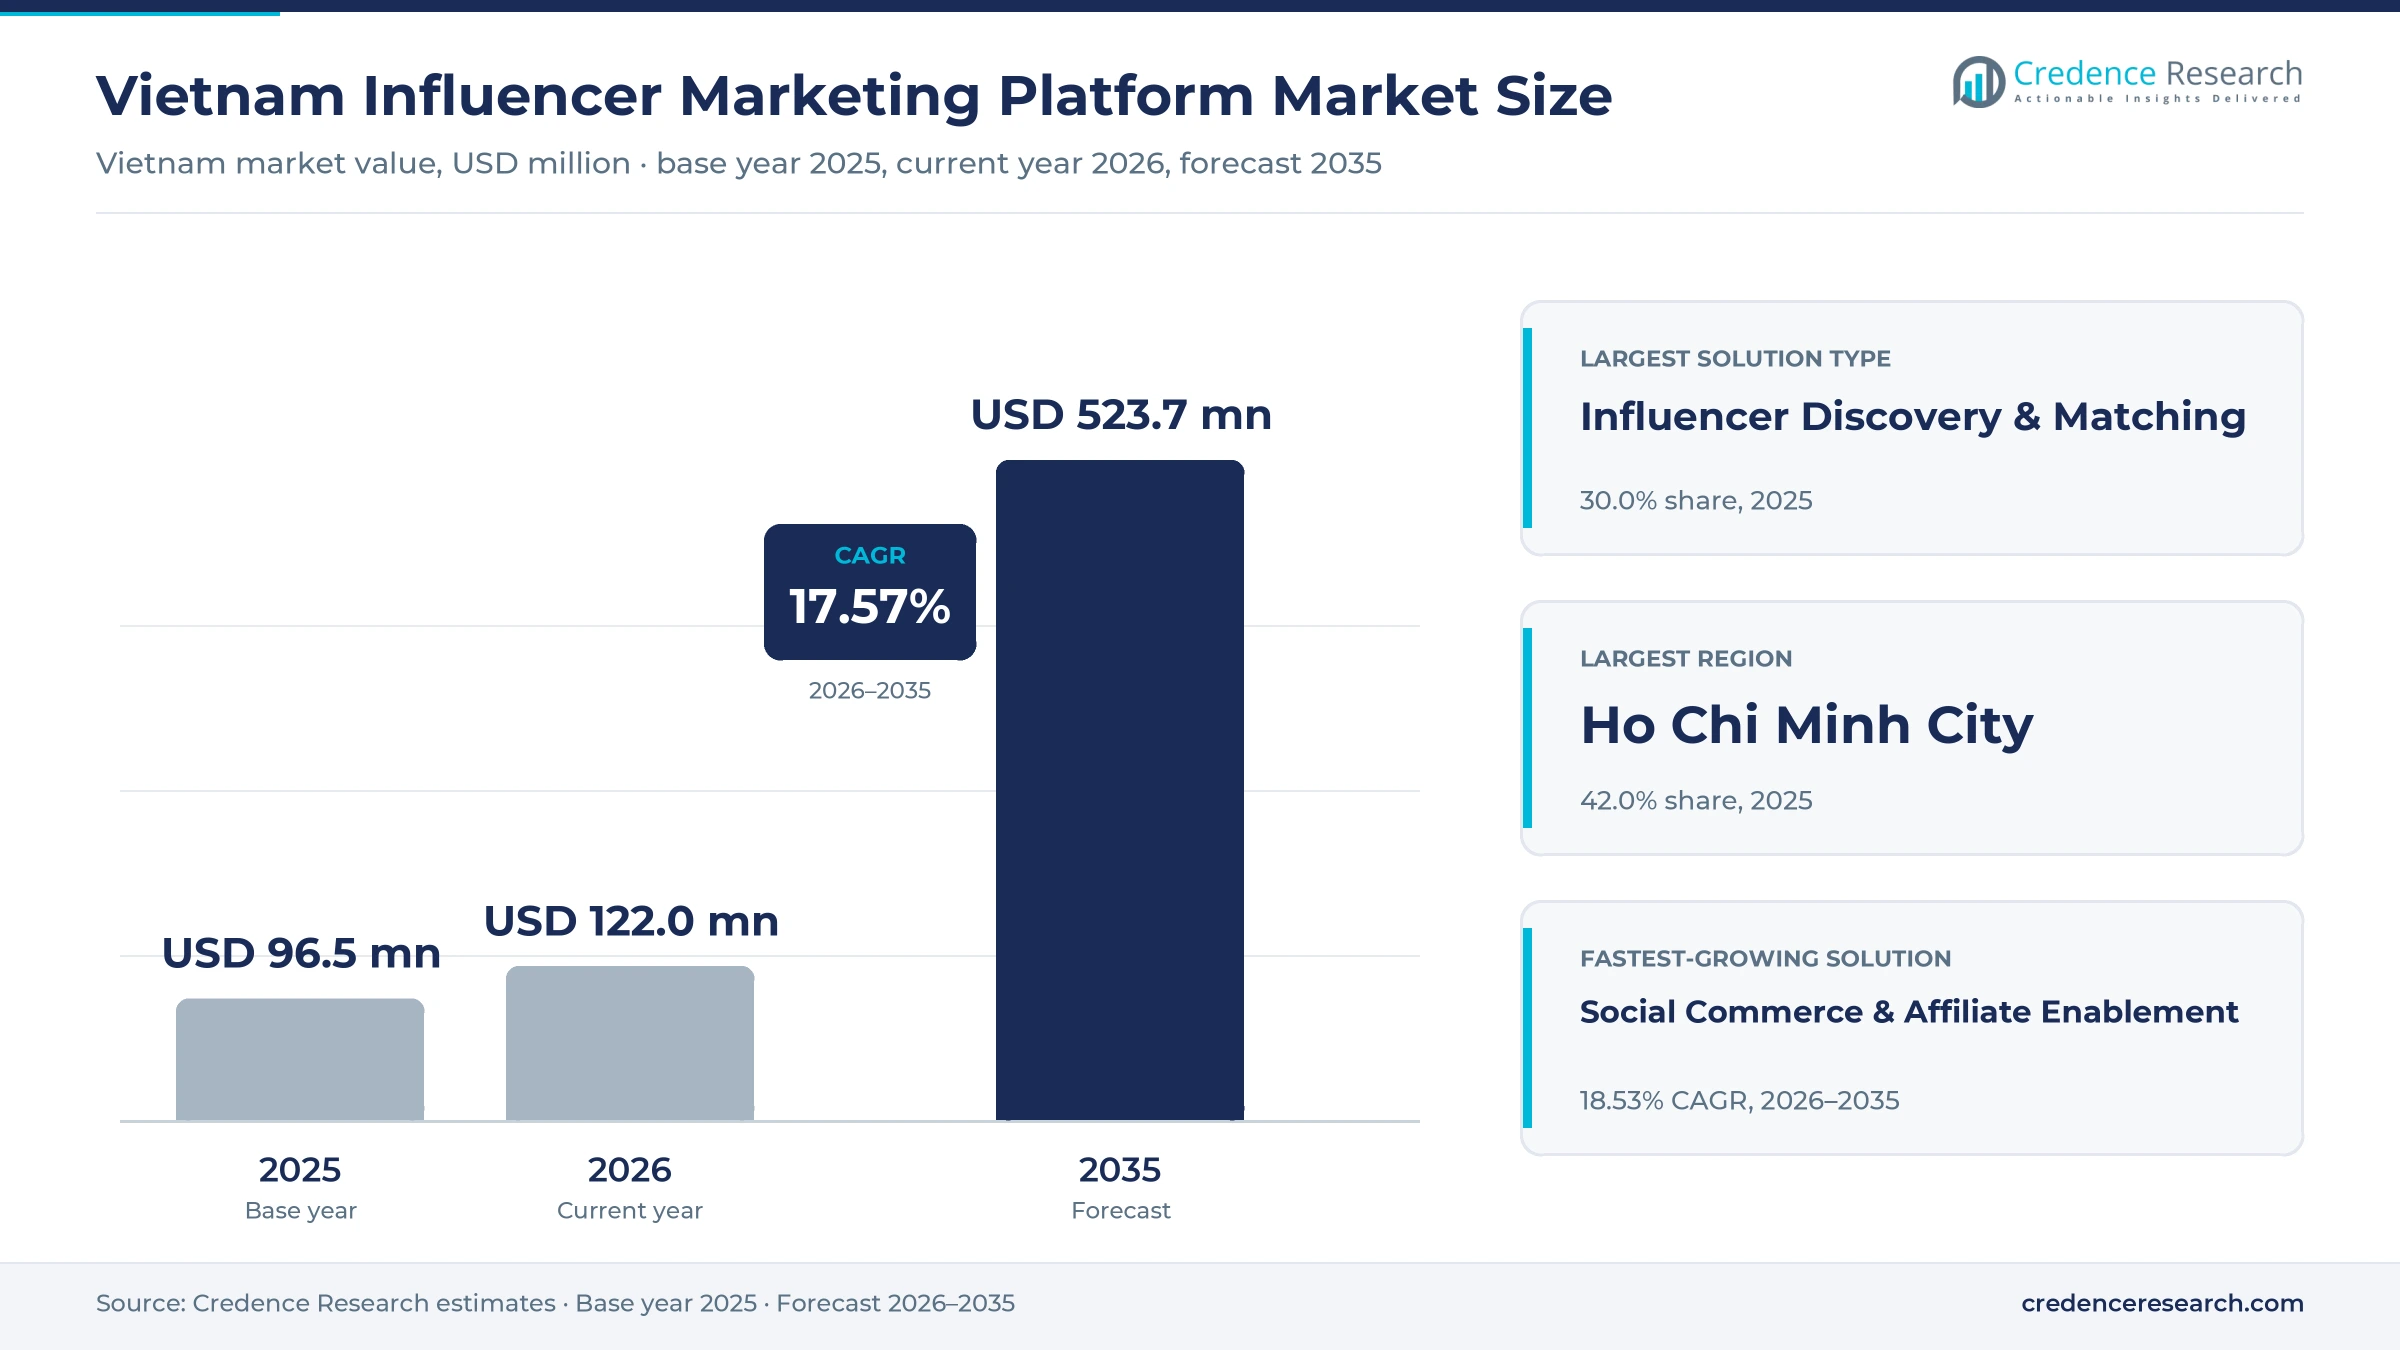
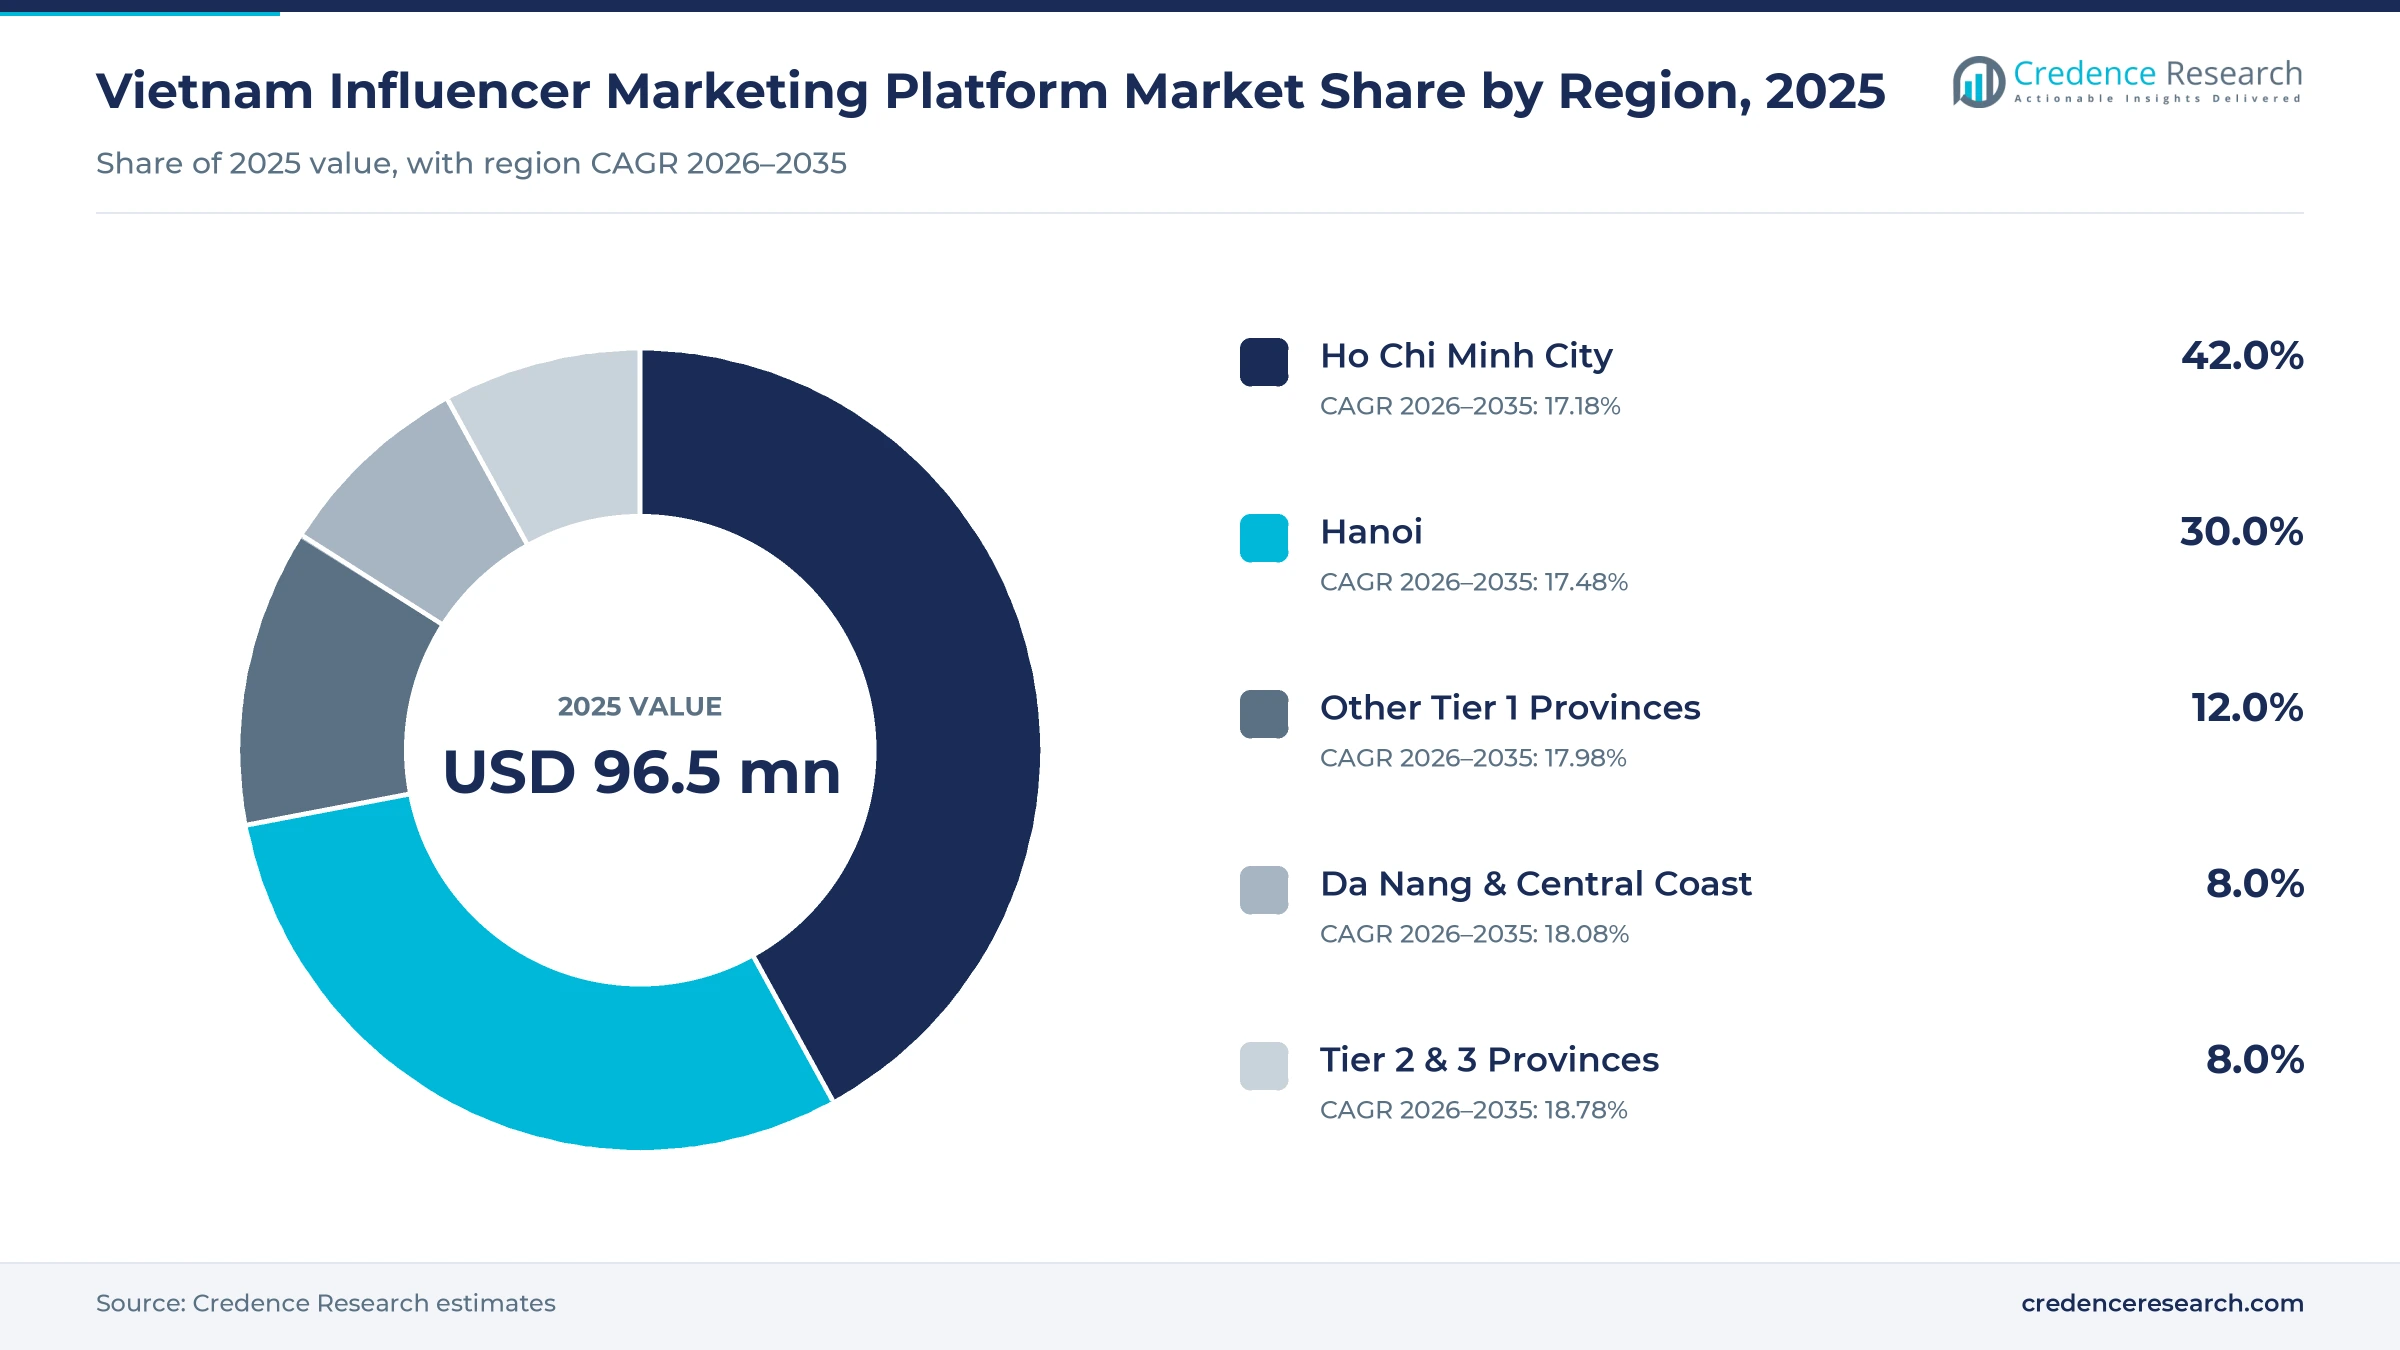
The Vietnam influencer marketing platform market was valued at USD 96.5 million in 2025 and is projected to increase from USD 122.0 million in 2026 to USD 523.7 million by 2035, registering a CAGR of 17.57% during 2026–2035. Demand comes from a large video-first audience, the fast growth of shoppable short video and livestreams, and brand pressure to prove the sales return of creator campaigns. Ho Chi Minh City held the largest regional share, 42.0% in 2025, because most consumer brands, agencies and creator networks run their campaigns from the city. Tier 2 and three provinces grow fastest at 18.78% a year, as local sellers and regional brands start paying creators to reach buyers outside the largest cities. The amended advertising law that took effect in January 2026 makes creators and brands share responsibility for sponsored content, which raises demand for tools that vet creators, store briefs and track disclosure.
Which creator software and fees are counted in Vietnam?
The estimate measures what brands, agencies and sellers in Vietnam spend on software and technology-led services used to find, hire, manage, measure and pay social media creators. It covers subscriptions, campaign commissions, managed service fees, creator marketplace take rates and performance-based fees charged by platform providers. Values are stated in USD million at current prices and exclude taxes.
The estimate excludes fees paid directly to creators, paid media bought on social networks and the value of goods sold through creator links. The value chain runs from social networks and data providers through creator platforms, agencies and creator networks to brands, sellers and individual creators.
Vietnam Influencer Marketing Platform Market Insights
- The Vietnam influencer marketing platform market was valued at USD 96.5 million in 2025 and is projected to reach USD 523.7 million by 2035, registering a CAGR of 17.57% during 2026–2035.
- Ho Chi Minh City held 42.0% of 2025 value, because consumer brands, agencies and creator networks plan most national campaigns there.
- Influencer discovery and matching tools led with 30.0% of 2025 value, since brands first need searchable creator data to plan campaigns.
- The revised advertising law passed on June 16, 2025, took effect on Jan. 1, 2026, and sets duties for people who convey advertising content.
- Social commerce and affiliate enablement grows fastest at 18.53% a year during 2026–2035, as creators earn commissions from tagged products in videos.
Discovery tools and FMCG brands carry most platform value
Why do discovery tools lead creator software spending?
Based on solution type, the market is categorized into influencer discovery and matching, campaign workflow management, analytics and attribution, social commerce and affiliate enablement, and compliance and fraud detection. Influencer Discovery & Matching led with 30.0% of 2025 value, because brands must search large creator pools before any campaign starts. Social Commerce & Affiliate Enablement grows fastest at 18.53% a year, as tagged products in short videos tie creator pay to sales.
How do self-service tools change platform buying?
Based on deployment model, the market is categorized into self-service SaaS, managed cloud platform, API-embedded platform and hybrid managed technology. Self-Service SaaS led with 38.0% of 2025 value, because agencies and large brands run frequent campaigns in-house. API-Embedded Platform grows fastest at 18.32% a year, as marketplaces and social apps build creator tools straight into their seller centers.
Which industries spend most on creator platforms?
Based on end-use industry, the market is categorized into FMCG and beauty, retail and e-commerce, fashion and lifestyle, technology and electronics, and financial services and healthcare. FMCG & Beauty led with 34.0% of 2025 value, because cosmetics and daily goods brands run creator reviews all year. Retail & E-commerce grows fastest at 18.14% a year, as online sellers pay creators per order.
| Segment Group | Leading Sub-segment | Share, 2025 | Fastest-growing Sub-segment | CAGR, 2026–2035 |
|---|---|---|---|---|
| By Solution Type | Influencer Discovery & Matching | 30.0% | Social Commerce & Affiliate Enablement | 18.53% |
| By Deployment Model | Self-Service SaaS | 38.0% | API-Embedded Platform | 18.32% |
| By End-Use Industry | FMCG & Beauty | 34.0% | Retail & E-commerce | 18.14% |
Request a Free Sample
Fill in your details and we'll send you a free sample report.
- Sample data tables & charts
- Research methodology
Social reach, shoppable video and AI matching lift demand
How does deep social reach and video use lift demand?
Deep social reach and heavy video use lift demand, because brands can reach most consumers through creators on a few large apps. Internet users reached 84.15% of the population in 2024, up from 78.08% a year earlier, according to World Bank data. TikTok reported more than 70 million monthly users in Vietnam at its July 2026 seller summit. YouTube counted more than 50 million adult users in November 2024, with about 1,800 local channels above one million subscribers. As a result, brands need software to search, compare and book creators at scale across these networks. This need explains why discovery and matching tools hold the largest share of influencer marketing platform spending.
Why does social commerce integration raise platform spending?
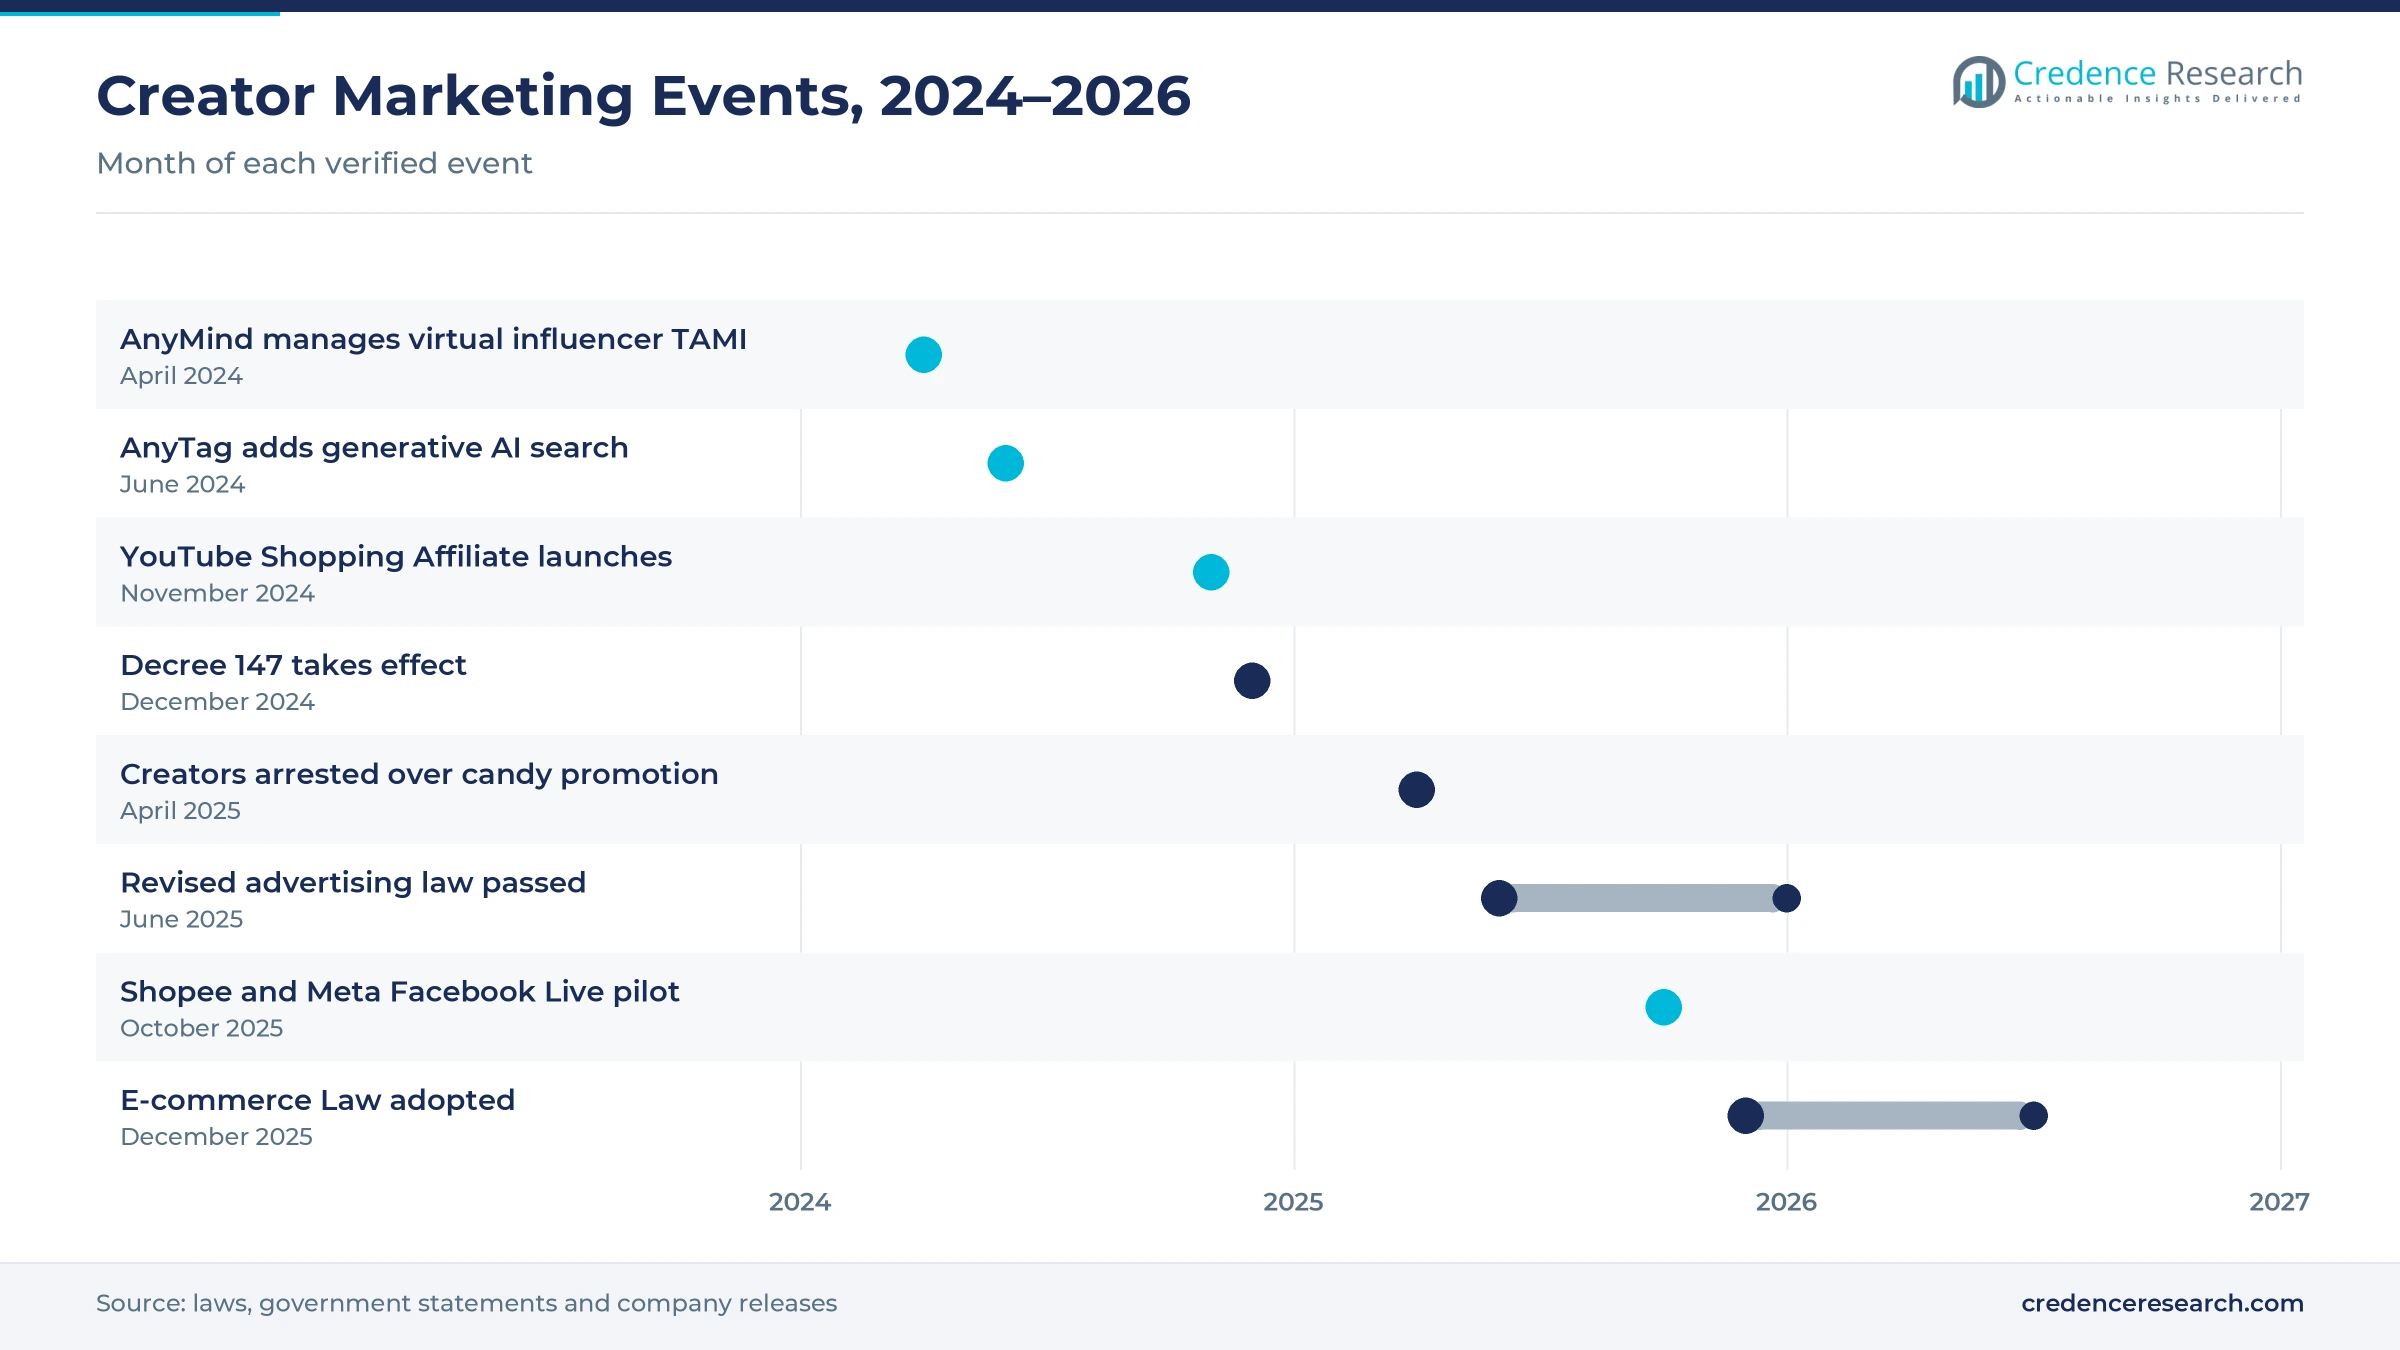
Social commerce integration raises platform spending, because creators now sell products directly inside videos and livestreams instead of only building awareness. TikTok Shop said affiliate creators rose 140% in 2025, while short videos with product links grew 45% over 2024, according to Brands Vietnam. YouTube and Shopee launched the YouTube Shopping Affiliate program in Ho Chi Minh City on Nov. 2, 2024, letting creators tag Shopee products. Shopee and Meta then added Vietnam to a Facebook Live shopping pilot in October 2025. Consequently, brands buy affiliate tracking software and payout tools, and this solution grows fastest at 18.53% a year.
How do AI matching and measurement tools drive adoption?
AI matching and performance measurement drive adoption, because brands want proof that creator budgets turn into sales. AnyMind Group added generative AI features to AnyTag in June 2024, recommending creators from a brand brief and budget. At launch, AnyTag held data on more than 750,000 influencers and more than 9,000 past campaigns across Asia Pacific. AnyMind also began managing TAMI, an AI-driven virtual influencer launched for Vietnamese audiences in January 2024. In turn, analytics and attribution tools gain budget as marketers compare creators by cost per order rather than follower count. Wider artificial intelligence adoption among local agencies supports the same shift toward measured campaigns.
Why do new advertising duties push brands to software?
New advertising duties push brands toward software, because every party in the creator chain now carries legal risk. The National Assembly passed the revised advertising law on June 16, 2025, with 453 of 461 deputies in favor, according to Viet Nam News. The law took effect on Jan. 1, 2026, and requires influencers to label sponsored content and verify advertisers. Decree 147, effective Dec. 25, 2024, also requires verified accounts before users can post or livestream. As a result, brands want platforms that store contracts, product documents and disclosure records for each creator. This demand supports compliance and fraud detection tools, which still hold a small but rising share.
Affiliate creators, AI tools and new ad rules reshape work
How is the rise of affiliate creators changing campaigns?
The rise of affiliate creators is changing campaigns, because many small creators now earn commissions instead of fixed fees. TikTok Shop reported that affiliate creators joining livestream sales doubled in 2025, while buyers rose 36%. In the first half of 2024, affiliate creators joining TikTok Shop had already grown 2.5 times. Ecomobi opened a 4,000 square meter livestream facility with 51 studios and more than 150 hosts, according to its September 2025 release. Therefore, brands shift budget from a few celebrities to hundreds of micro creators paid by results. This shift lifts demand for tools that track links, codes and payouts for each creator in one place.
Why is the shift toward AI-built content rising?
The shift toward AI-built content and virtual creators is rising, because brands want faster content at lower cost per post. AnyMind said in April 2024 that it was developing an AI livestreamer for e-commerce on its AnyX, AnyTag and AnyChat tools. Its virtual influencer TAMI had more than 100,000 Instagram followers at that time. Metub, which works with more than 5,000 creators and artists, formed a music joint venture with Virgin Music Group in September 2025. As a result, the wider creator economy in Vietnam now mixes human, virtual and label-backed talent. Platforms that rate all three types in one search therefore gain an edge with agencies.
Can compliance tools open a new revenue stream?
Compliance tools open a clear new revenue stream, because new laws make brands and creators answer for false claims. The E-commerce Law adopted on Dec. 10, 2025, takes effect on July 1, 2026, according to Apolat Legal. It requires livestream hosts to refuse sellers that lack quality or advertising documents. Hosts must also stop broadcasts and remove content once violations are found or authorities ask. In April 2025, police arrested two well-known creators over a candy promotion that sold more than 100,000 boxes. Consequently, platforms that verify product papers and creator claims can charge brands a premium, and compliance and fraud detection gains share through 2035.
Is there room to grow with smaller sellers and provinces?
Smaller sellers and provincial brands offer a second opening, because many have started selling online only recently. TikTok Shop plans 60 days of free commission for OCOP, farm and craft village sellers in the second half of 2026. The package is expected to reach up to VND100 billion in support, with training on livestreaming and creator work. Sellers on TikTok Shop also rose 42% in 2025, adding many first-time merchants and new demand for creator tools. In turn, small business accounts need low-cost self-service tools, which helps Tier 2 and three provinces become the fastest-growing zone of the market. Simple monthly plans and pay-per-order pricing fit these buyers best.
False claims, fraud and thin budgets weigh on adoption
How do false claims and creator scandals hurt trust?
False claims and creator scandals hurt trust, because buyers question products promoted by well-known faces. Police arrested Quang Linh Vlogs and Hang Du Muc in April 2025 over Kera candy, according to Tuoi Tre News. Each had already been fined VND70 million for false advertising. As a result, brands now slow approvals and ask for stricter vetting, which lengthens campaign cycles for platforms. Providers that check product papers and creator history before booking can turn this caution into steady demand.
Why does fake engagement complicate measurement?
Fake engagement complicates measurement, because bought followers and views inflate the apparent reach of many creators. Brands that pay by audience size can lose budget to accounts with little real influence. Consequently, platforms must invest in audit data and fraud checks, which raises their costs. Verified-account rules under Decree 147 help, but they do not remove paid engagement on their own. Brands therefore ask for audited audience data before they sign larger creator contracts.
How do small budgets limit software subscriptions?
Small budgets limit software subscriptions, because many local sellers spend only modest sums on each campaign. These buyers often contact creators directly through messages rather than paying for a platform license. In turn, providers struggle to convert free users into paying accounts outside large cities. Commission and pay-per-order pricing can lower this barrier for small business accounts. Bundled tools offered by marketplaces and agencies also help small sellers start with little upfront cost.
Will dependence on a few social networks raise risk?
Dependence on a few social networks raises risk, because platforms rely on data access and creator tools set by TikTok, Meta and YouTube. A change in data access, commission rules or ranking can cut the value of a third-party tool quickly. Consequently, providers spread their tools across several networks and marketplaces. Close partnerships and official API access reduce this risk over the forecast period. Providers with their own creator data also depend less on any single network.
Ho Chi Minh City leads while smaller provinces grow fastest
| Region | Value, 2025 (USD million) | Share, 2025 | CAGR, 2026–2035 |
|---|---|---|---|
| Ho Chi Minh City | 40.5 | 42.0% | 17.18% |
| Hanoi | 28.9 | 30.0% | 17.48% |
| Other Tier 1 Provinces | 11.6 | 12.0% | 17.98% |
| Da Nang & Central Coast | 7.7 | 8.0% | 18.08% |
| Tier 2 & 3 Provinces | 7.7 | 8.0% | 18.78% |
Why does Ho Chi Minh City lead creator software spending?
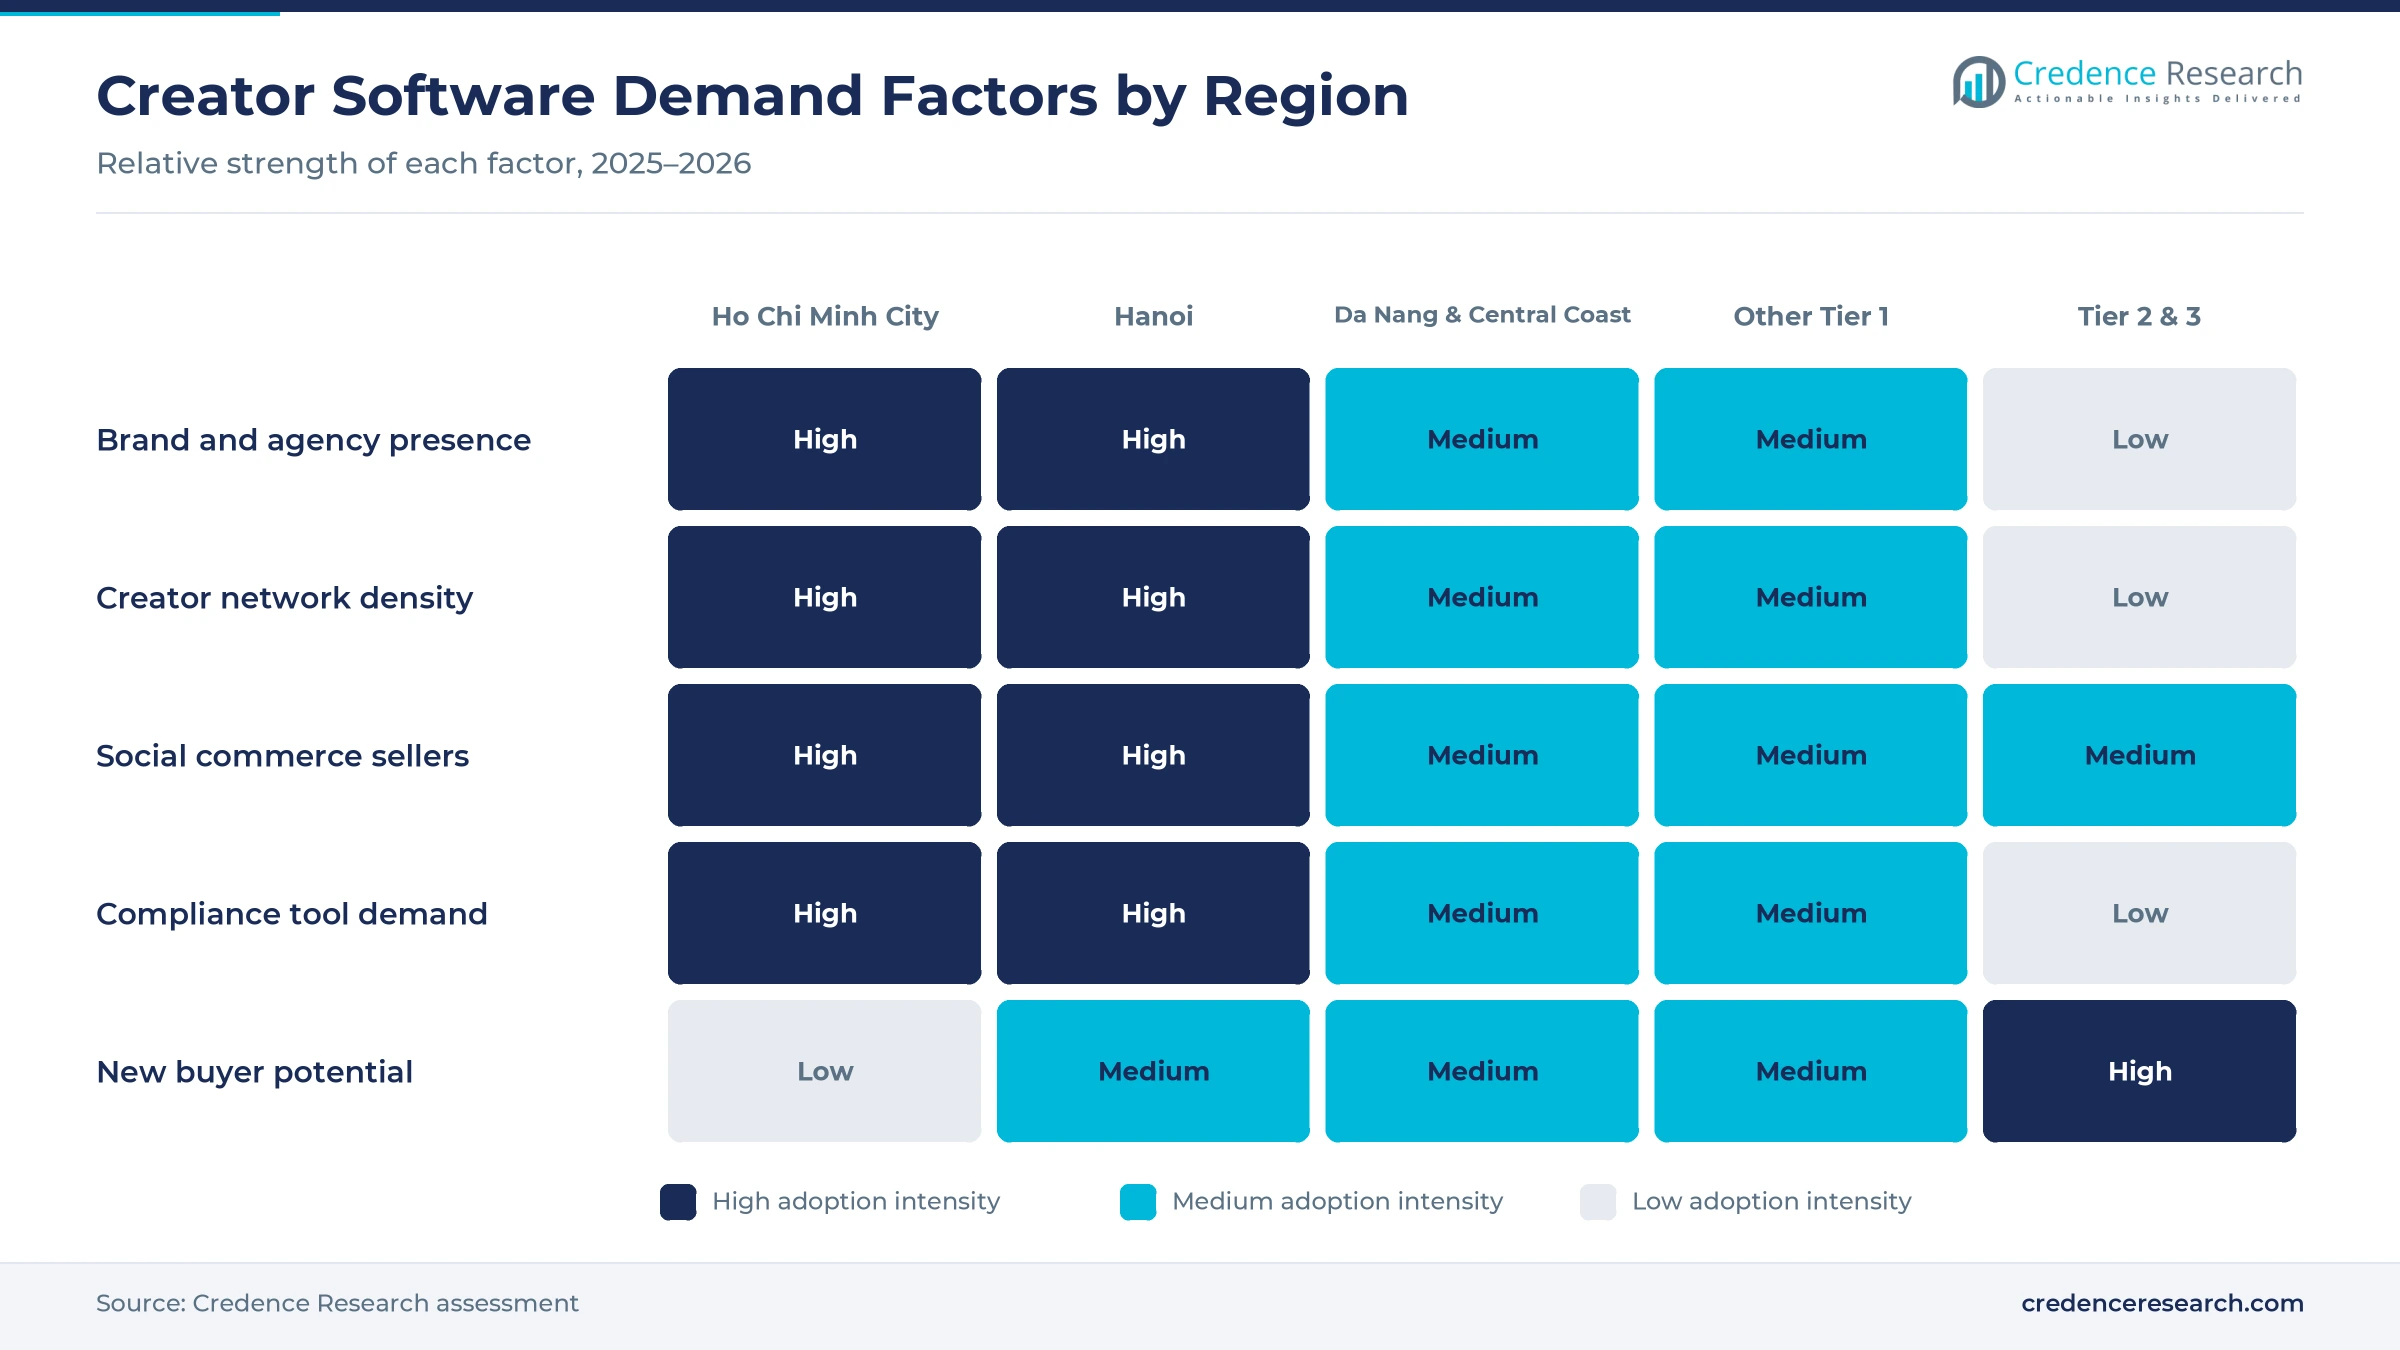
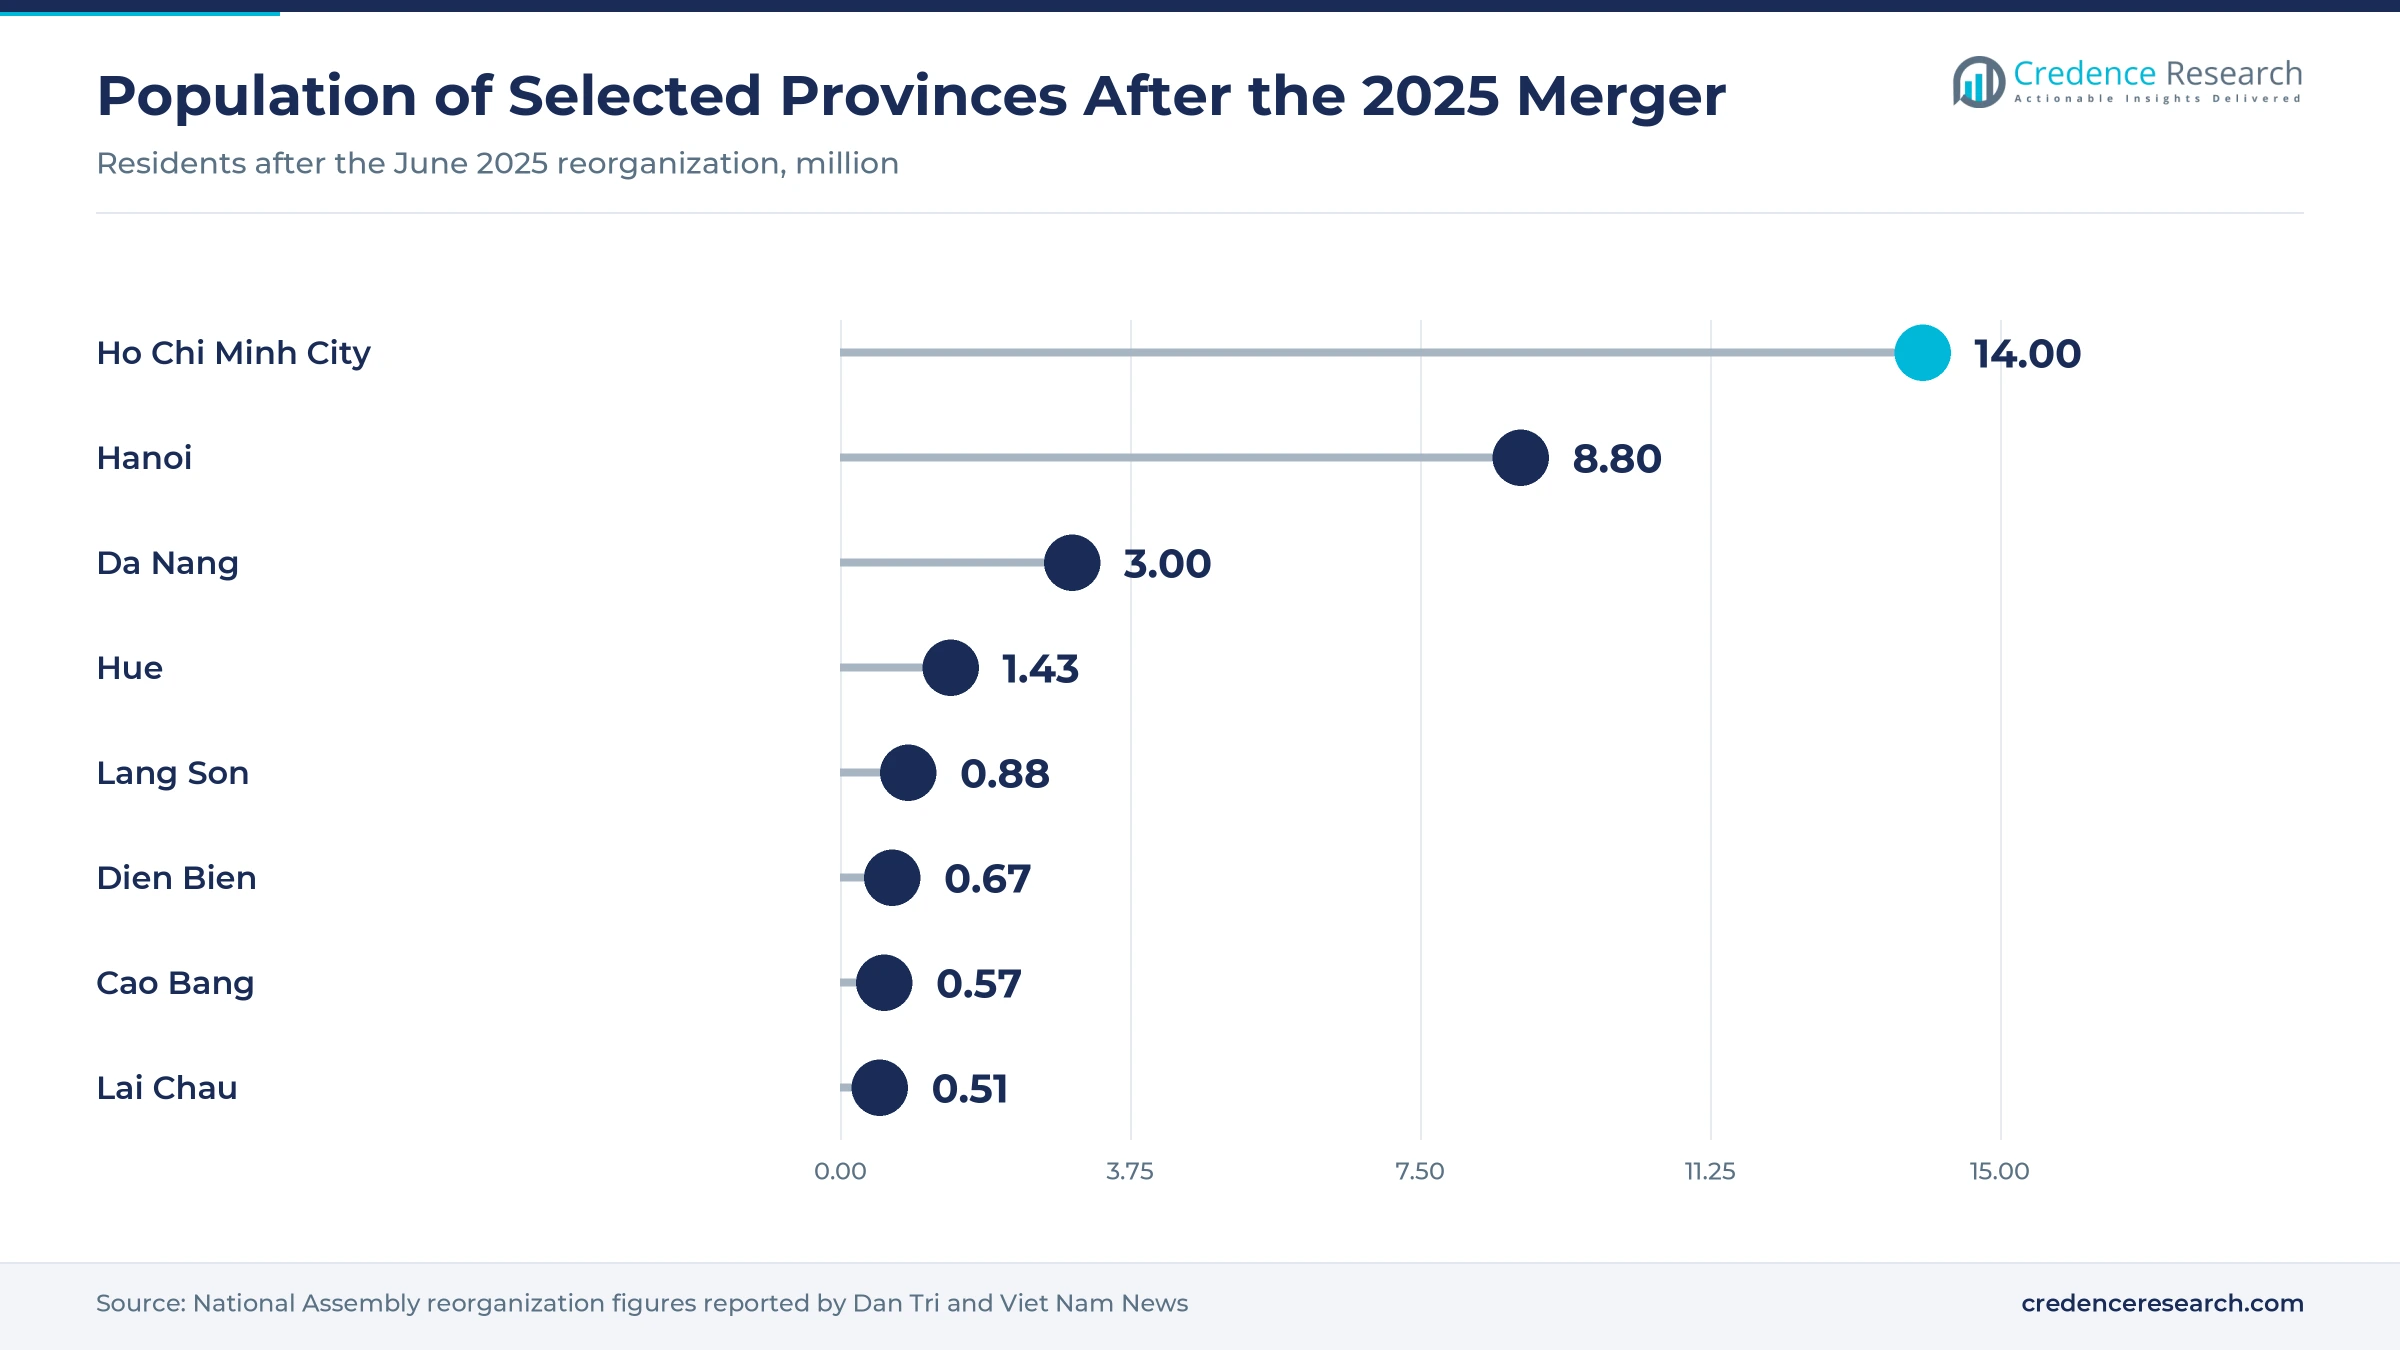
Ho Chi Minh City held 42.0% of 2025 value and grows at 17.18% a year, because most consumer brands, agencies and creator networks base their teams in the city. The enlarged city has more than 14 million people after its merger with Binh Duong and Ba Ria-Vung Tau in 2025. YouTube and Shopee also launched their shopping affiliate program there in November 2024. As a result, new platform features usually reach agencies in Ho Chi Minh City first.
How does Hanoi support platform demand?
Hanoi held 30.0% of 2025 value and grows at 17.48% a year, because the capital hosts large banks, telecom groups, state-linked brands and national media. Its population passed 8.8 million under the 2025 provincial reorganization, which widens regional demand for creator campaigns. Many financial services and technology brands plan campaigns from Hanoi offices. This mix supports demand for measurement, reporting and compliance tools in the capital. Regulated brands in banking and healthcare also need careful records for each sponsored post, which favors managed platforms with approval workflows.
What lifts demand in Other Tier 1 provinces?
Other Tier 1 provinces held 12.0% of 2025 value and grow at 17.98% a year, because cities such as Haiphong and Can Tho host growing retail and manufacturing brands. These companies increasingly hire creators to reach younger buyers in their home markets. Consequently, they adopt managed and self-service tools through agencies based in the two largest cities. Local food, retail and consumer goods makers also test affiliate campaigns with regional creators, which adds steady demand for low-cost tracking tools.
How do Da Nang and the Central Coast add creators?
Da Nang and the Central Coast held 8.0% of 2025 value and grow at 18.08% a year, because tourism and hospitality brands rely on travel creators. The merged Da Nang has about 3 million people and drew 12 million tourists in 2024, which lifts regional demand for travel creators. Hotels, resorts and food brands therefore use creator campaigns to fill rooms and tables.
Why are Tier 2 and three provinces growing fastest?
Tier 2 and three provinces held 8.0% of 2025 value and grow fastest at 18.78% a year, because farm, craft and OCOP sellers are joining social commerce for the first time. TikTok Shop support for these sellers in 2026 includes creator and livestream training. In turn, low-cost self-service tools find new buyers in these provinces.
Launches, laws and enforcement cases from 2024 to 2026
| Development | Status and market relevance |
|---|---|
| In April 2024, AnyMind Group began managing TAMI, a virtual influencer launched for Vietnamese audiences in January 2024. | Adds virtual talent to the AnyTag booking catalog |
| In June 2024, AnyMind Group added generative AI creator recommendations and image search to AnyTag. | Speeds creator discovery from a brand brief |
| In November 2024, YouTube and Shopee launched the YouTube Shopping Affiliate program in Ho Chi Minh City. | Lets creators tag Shopee products in videos |
| In June 2025, the National Assembly passed the revised advertising law, which took effect on Jan. 1, 2026. | Sets duties for influencers who convey ads |
| In September 2025, Metub formed Virgin Music Group Vietnam, a joint venture with Virgin Music Group. | Extends a creator network of more than 5,000 creators and artists |
AI search, product tagging and audits change campaign work
- AI search tools rank creators from a written brief, images and budget, which cuts the time agencies spend on shortlists.
- Product tagging in short videos and livestreams links each creator post to orders, so brands can pay by result.
- Audience audits built on social media analytics flag bought followers and weak engagement before contracts are signed.
- Compliance records store briefs, product papers and sponsored labels for each post, which helps brands meet the 2026 advertising rules.
Need a Custom Version of This Report?
Tailor the scope, geography, or segments to your exact requirements.
- Custom geography or segment scope
- Direct access to our analyst team
Regional platforms and local creator networks compete
Competition combines regional software companies, local creator networks and global tool providers. AnyMind Group runs AnyTag in Vietnam and added generative AI search in June 2024, while also managing the virtual influencer TAMI. Ecomobi links creators with sellers on TikTok Shop and Shopee and runs a large livestream facility with 51 studios. Metub manages more than 5,000 creators and artists and formed a music joint venture with Virgin Music Group in 2025. Hiip has worked with about 6,000 influencers and more than 500 brands across Vietnam and Thailand. Social networks also shape the market, because their own affiliate tools compete with third-party software. Companies compete on creator data quality, sales tracking, compliance records and pricing that suits small sellers, which defines how each influencer marketing platform wins accounts.
Companies profiled and their roles in this market
| Company | Type | Role in the market |
|---|---|---|
| AnyMind Group (AnyTag) | Regional platform | AI creator search and virtual influencer TAMI in Vietnam |
| Ecomobi | Local creator commerce network | Livestream facility with 51 studios and more than 150 hosts |
| The Metub Company | Local creator network | More than 5,000 creators; Virgin Music joint venture in 2025 |
| Hiip Asia | Local influencer platform | About 6,000 influencers and more than 500 brands in Vietnam and Thailand |
Credence Research view on compliance-ready creator tools
Credence Research's view is that Vietnamese creator software will grow strongly through 2035, as brands move from celebrity posts to measured campaigns with many smaller creators. Shoppable video on TikTok, YouTube and Facebook makes sales tracking the main reason to buy a platform. The 2026 advertising rules and the E-commerce Law add a second reason, since brands need records that prove each creator checked the product. Discovery tools should keep the largest share of the influencer marketing platform market. However, scandals and fake engagement will keep pressure on platforms to prove data quality.
How the creator software spending estimate was built
The report uses 2025 as the base year, with values in USD million at current prices. Market values come from the Credence Research model, which combines active advertisers, creator campaign volumes, average platform fees and commission rates. Regional shares and segment splits by solution type, deployment model and end-use industry are Credence Research estimates. Sources used are World Bank data, laws and decrees, government statements, company releases and news reports, and no interviews or surveys were used.
Shoppable video and compliance set the path to 2035
The market is expected to reach USD 523.7 million by 2035, a 17.57% CAGR during 2026–2035, as brands pay creators by results and need software to manage many small partners. Growth should be strongest in Tier 2 and three provinces and in social commerce tools, while Ho Chi Minh City keeps the largest share. Compliance features will become standard across creator software after the 2026 laws. In contrast, new creator scandals or tighter data access on social networks would slow platform adoption, especially among small sellers.
Frequently Asked Questions
How big is the Vietnam influencer marketing platform market?
Which region leads creator software spending in Vietnam?
Which region grows fastest?
Which solution type holds the largest share?
How do new laws affect creator campaigns?
Which solution type grows fastest?
Who are the leading companies in Vietnam?
What are the main risks to growth?
Table of Content
Chapter 1 Market Segmentation
- 1.1 Segmentation Framework
- 1.1.1 Product and Service Classification
- 1.1.2 Application and End-Use Classification
- 1.1.3 Technology and Solution Classification
- 1.1.4 Customer and Distribution Channel Classification
- 1.1.5 Geographic Segmentation
- 1.1.6 Market Segment Definitions and Boundaries
- 1.2 By Solution Type
- 1.2.1 Influencer Discovery & Matching
- 1.2.2 Campaign Workflow Management
- 1.2.3 Analytics & Attribution
- 1.2.4 Social Commerce & Affiliate Enablement
- 1.2.5 Compliance & Fraud Detection
- 1.3 By Deployment Model
- 1.3.1 Self-Service SaaS
- 1.3.2 Managed Cloud Platform
- 1.3.3 API-Embedded Platform
- 1.3.4 Hybrid Managed Technology
- 1.4 By End-Use Industry
- 1.4.1 FMCG & Beauty
- 1.4.2 Retail & E-commerce
- 1.4.3 Fashion & Lifestyle
- 1.4.4 Technology & Electronics
- 1.4.5 Financial Services & Healthcare
Chapter 2 Introduction
- 2.1 Report Objectives and Scope
- 2.2 Product Definition and Industry Terminology
- 2.3 Market Inclusions and Exclusions
- 2.4 Research Process
- 2.4.1 Primary Research and Expert Interviews
- 2.4.2 Secondary Research and Source Review
- 2.4.3 Top-Down and Bottom-Up Estimation
- 2.4.4 Data Triangulation and Verification
- 2.5 Market Size Measurement Basis
- 2.5.1 2025: USD 96.5 million → 2035: USD 523.7 million
- 2.6 Historical and Forecast Reference Periods
- 2.6.1 Historical Period: 2018-2025
- 2.6.2 Base Year: 2025
- 2.6.3 Forecast Period: 2025-2035
- 2.7 Research Assumptions and Limitations
Chapter 3 Executive Summary
- 3.1 Market Snapshot and Key Findings
- 3.2 Base-Year Market Size, 2025
- 3.3 Forecast Market Size, 2035
- 3.4 Revenue and Volume Growth Outlook
- 3.5 Key Demand and Supply Indicators
- 3.6 Leading Market Segments
- 3.7 Fastest-Growing Market Opportunities
- 3.8 Regional Performance Highlights
- 3.9 Technology and Industry Transformation
- 3.10 Competitive Landscape Summary
- 3.11 Analyst View and Strategic Implications
Chapter 4 Vietnam Influencer Marketing Platform Market Trends and Developments
- 4.1 Historical Industry Development, 2018-2025
- 4.2 Recent Market Trends and Developments
- 4.3 Demand and Customer Behavior Trends
- 4.4 Technology and Product Innovation
- 4.5 Artificial Intelligence, Automation and Digitalization
- 4.6 Local Manufacturing and Supply Chain Realignment
- 4.7 Industry Partnerships, Mergers and Acquisitions
- 4.8 Sustainability and Circular Economy Developments
- 4.9 Government and Private Sector Investment Trends
- 4.10 Emerging Business Models and Commercialization
- 4.11 Industry Developments and Announcements
Chapter 5 Vietnam Influencer Marketing Platform Market Supply and Demand Analysis
- 5.1 Demand Trend and Consumption Analysis, 2018-2025
- 5.2 Demand Forecast, 2025-2035
- 5.3 Supply Chain Structure and Procurement Trends
- 5.4 Supply-Demand Gap and Bottlenecks
- 5.5 Import Dependence and Sourcing Structure
- 5.6 Regional Supply and Demand Concentration
Chapter 6 Vietnam Influencer Marketing Platform Market Pricing Analysis
- 6.1 Pricing Structure and Measurement
- 6.2 Historical Pricing Trends, 2018-2025
- 6.3 Pricing Outlook, 2025-2035
- 6.4 Pricing by Product and Market Segment
- 6.5 Geographic Pricing Differences
- 6.6 Key Input, Energy, Labor and Logistics Costs
- 6.7 Contract Pricing and Purchasing Models
- 6.8 Pricing Sensitivity and Competitive Positioning
- 6.9 Price, Margin and Profitability Implications
Chapter 7 Vietnam Influencer Marketing Platform Market Dynamics
- 7.1 Market Growth Drivers
- 7.1.1 Demand-Side Drivers
- 7.1.2 Technology and Innovation Drivers
- 7.1.3 Infrastructure and Investment Drivers
- 7.1.4 Regulatory and Policy Drivers
- 7.2 Market Restraints
- 7.2.1 Cost and Affordability Constraints
- 7.2.2 Technology and Adoption Barriers
- 7.2.3 Supply Chain and Operational Constraints
- 7.3 Market Challenges
- 7.3.1 Competitive Pressure and Margin Erosion
- 7.3.2 Skills, Infrastructure and Implementation Gaps
- 7.4 Emerging Market Opportunities
- 7.5 Market Dynamics Impact and Time-Horizon Assessment
Chapter 8 Vietnam Influencer Marketing Platform Value Chain Analysis
- 8.1 Industry Value Chain Overview
- 8.2 Upstream Suppliers and Critical Inputs
- 8.3 Technology and Component Providers
- 8.4 Manufacturing or Service Delivery
- 8.5 Distribution, Channel Partners and Integrators
- 8.6 Downstream Applications and End Users
- 8.7 Value Addition and Profit Pools
- 8.8 Vertical Integration and Outsourcing
- 8.9 Supplier Concentration and Risk
- 8.10 Supply Chain Localization and Resilience
Chapter 9 Vietnam Influencer Marketing Platform Market Regulations and Policies
- 9.1 Relevant Laws, Standards and Compliance Frameworks
- 9.2 Product, Service, Safety and Quality Requirements
- 9.3 Government Policies, Incentives and Subsidies
- 9.4 Imports, Exports and Trade Barriers
- 9.5 Public Procurement and Local Content Requirements
- 9.6 Data Protection, AI and Cybersecurity Compliance
- 9.7 Upcoming Policy Changes and Market Implications
Chapter 10 Vietnam Influencer Marketing Platform Market Hotspots and Opportunities
- 10.1 Market Opportunity Mapping and Growth Hotspots
- 10.2 High-Growth Applications and Customer Groups
- 10.3 Underserved Markets and White-Space Opportunities
- 10.4 Emerging Technology and Product Opportunities
- 10.5 New Capacity and Investment Hotspots
- 10.6 Market Entry and Expansion Opportunities
- 10.7 Distribution and Partnership Opportunities
- 10.8 Near-Term and Long-Term Commercial Potential
- 10.9 Opportunity Attractiveness and Execution Risks
Chapter 11 Vietnam Influencer Marketing Platform Market Outlook, 2025-2035
- 11.1 Market Size and Analysis
- 11.1.1 Revenue (Market Measurement: 2025: USD 96.5 million → 2035: USD 523.7 million)
- 11.1.2 Historical Market Size, 2018-2025
- 11.1.3 Base-Year Market Size, 2025
- 11.2 Market Forecast, 2025-2035
- 11.2.1 Revenue Forecast to 2035
- 11.2.2 CAGR and Year-on-Year Growth
- 11.2.3 Incremental Revenue Opportunity
- 11.3 Forecast Assumptions and Scenario Analysis
- 11.3.1 Base-Case Forecast
- 11.3.2 Optimistic and Conservative Scenarios
- 11.3.3 Technology, Pricing and Policy Sensitivities
- 11.4 Market Attractiveness and Growth Outlook
Chapter 12 Vietnam Influencer Marketing Platform Market Segmentation and Outlook
- 12.1 Segmentation Summary and Market Shares, 2025
- 12.2 Largest and Fastest-Growing Segments
- 12.3 By Solution Type - Market Size and Forecast, 2025-2035
- 12.3.1 Segment Definition and Scope
- 12.3.2 Historical Market Size, 2018-2025
- 12.3.3 Revenue Forecast, 2025-2035
- 12.3.4 Base-Year Market Share, 2025
- 12.3.5 Segment CAGR and Growth Drivers
- 12.3.6 Subsegment Market Size and Forecast
- 12.3.6.1 Influencer Discovery & Matching
- 12.3.6.2 Campaign Workflow Management
- 12.3.6.3 Analytics & Attribution
- 12.3.6.4 Social Commerce & Affiliate Enablement
- 12.3.6.5 Compliance & Fraud Detection
- 12.3.7 Subsegment Pricing and Adoption Trends
- 12.3.8 Leading Suppliers and Competition
- 12.3.9 Regional Demand and Opportunities
- 12.4 By Deployment Model - Market Size and Forecast, 2025-2035
- 12.4.1 Segment Definition and Scope
- 12.4.2 Historical Market Size, 2018-2025
- 12.4.3 Revenue Forecast, 2025-2035
- 12.4.4 Base-Year Market Share, 2025
- 12.4.5 Segment CAGR and Growth Drivers
- 12.4.6 Subsegment Market Size and Forecast
- 12.4.6.1 Self-Service SaaS
- 12.4.6.2 Managed Cloud Platform
- 12.4.6.3 API-Embedded Platform
- 12.4.6.4 Hybrid Managed Technology
- 12.4.7 Subsegment Pricing and Adoption Trends
- 12.4.8 Leading Suppliers and Competition
- 12.4.9 Regional Demand and Opportunities
- 12.5 By End-Use Industry - Market Size and Forecast, 2025-2035
- 12.5.1 Segment Definition and Scope
- 12.5.2 Historical Market Size, 2018-2025
- 12.5.3 Revenue Forecast, 2025-2035
- 12.5.4 Base-Year Market Share, 2025
- 12.5.5 Segment CAGR and Growth Drivers
- 12.5.6 Subsegment Market Size and Forecast
- 12.5.6.1 FMCG & Beauty
- 12.5.6.2 Retail & E-commerce
- 12.5.6.3 Fashion & Lifestyle
- 12.5.6.4 Technology & Electronics
- 12.5.6.5 Financial Services & Healthcare
- 12.5.7 Subsegment Pricing and Adoption Trends
- 12.5.8 Leading Suppliers and Competition
- 12.5.9 Regional Demand and Opportunities
- 12.6 Segment Growth Comparison
- 12.7 Segment Attractiveness and Priority Matrix
Chapter 13 Vietnam Influencer Marketing Platform End-Use and Application Market Outlook
- 13.1 End-Use Industry and Customer Demand Structure
- 13.2 Leading Applications and Customer Groups
- 13.3 End-Use Market Size, Share and Forecast
- 13.4 Major End-Use Industry Deep Dives
- 13.4.1 Customer Requirements and Use Cases
- 13.4.2 Demand and Replacement Cycles
- 13.4.3 Technical and Regulatory Considerations
- 13.4.4 Purchasing and Procurement Models
- 13.4.5 Leading Vendors and Distribution Channels
- 13.4.6 Forecast and Commercial Opportunities
- 13.5 Emerging Applications and Cross-Segment Demand
- 13.6 End-Use Industry Investment Priorities
Chapter 14 Vietnam Influencer Marketing Platform Geographic Market Outlook, 2025-2035
- 14.1 Regional Market Size and Country-Level Shares, 2025
- 14.2 Country Market Size Comparison, 2025
- 14.3 Country Market Forecasts, 2025-2035
- 14.4 Subregional Industrial and Demand Clusters
- 14.5 Intra-Regional Pricing and Cost Differences
- 14.6 Cross-Border Trade and Supply Networks
- 14.7 Regional Supply and Demand Balances
- 14.8 Country Opportunity Comparison and Prioritization
Note: Every listed country is covered on the structure shown under the first country.
Chapter 15 Vietnam Influencer Marketing Platform Technology, Innovation and Sustainability Outlook
- 15.1 Technology Landscape and Maturity
- 15.2 Product, Process and Service Innovation
- 15.3 AI, Automation and Digital Tools in the Industry
- 15.4 Technology Adoption and Performance Benchmarking
- 15.5 Innovation Pipeline and R&D Investment
- 15.6 Patent and Intellectual Property Trends
- 15.7 Energy Efficiency and Resource Management
- 15.8 Sustainability, Recycling and Circularity
- 15.9 Technology Roadmap, 2025-2035
- 15.10 Risks of Obsolescence and Technology Substitution
Chapter 16 Vietnam Influencer Marketing Platform Market Key Strategic Imperatives
- 16.1 Growth and Market Entry Priorities
- 16.2 High-Return Products and Segments
- 16.3 Pricing, Profitability and Cost Optimization
- 16.4 Technology Investment and Product Differentiation
- 16.5 Supply Chain Localization and Resilience
- 16.6 Distribution and Customer Acquisition
- 16.7 Partnership, Acquisition and Capacity Strategy
- 16.8 Regional Expansion Priorities
- 16.9 Short-, Medium- and Long-Term Actions
Chapter 17 Competition Outlook
- 17.1 Industry Competition Characteristics
- 17.2 Market Structure and Concentration
- 17.3 Market Share and Competitive Positioning, 2025
- 17.4 Company-Wise Revenue and Product Benchmarking
- 17.5 Production and Service Capacity Benchmarking
- 17.6 Technology, Pricing and Differentiation
- 17.7 Regional Footprint and Distribution Strength
- 17.8 Mergers, Acquisitions and Strategic Alliances
- 17.9 New Entrants and Competitive Threats
- 17.10 Porter's Five Forces and Industry Attractiveness
- 17.11 Competitive Outlook, 2025-2035
Chapter 18 Company Profiles
- 18.1 Company Coverage and Selection Criteria
- 18.2 AnyMind Group (AnyTag)
- 18.2.1 Business Description
- 18.2.2 Company Ownership and Geographic Presence
- 18.2.3 Product and Service Portfolio
- 18.2.4 Manufacturing and Operating Footprint
- 18.2.5 Financial Performance and Investment
- 18.2.6 Market Share and Competitive Position
- 18.2.7 Technology and Innovation Capabilities
- 18.2.8 Strategic Alliances or Partnerships
- 18.2.9 Recent Developments
- 18.2.10 Growth Strategy and Outlook
- 18.3 Hiip Asia
- 18.4 REVU Vietnam
- 18.5 The Metub Company
- 18.6 CreatorIQ
- 18.7 Influencity
- 18.8 Influsoft
- 18.9 TUBRR Network
- 18.10 YouNet Media (SocialHeat)
- 18.11 Ecomobi
- 18.12 Other Relevant Market Participants
Note: Every listed company is profiled on the structure shown under the first company. The company list is preliminary and may change based on research findings, market developments, data availability and client requirements.
Chapter 19 Disclaimer
- 19.1 Research and Forecast Disclaimer
- 19.2 Data Source and Estimation Limitations
Note: The depth of individual sections depends on data availability for this market. Volume, capacity, trade and other unit-based metrics are included where applicable.

