
Factories, highways and cities move to virtual replicas
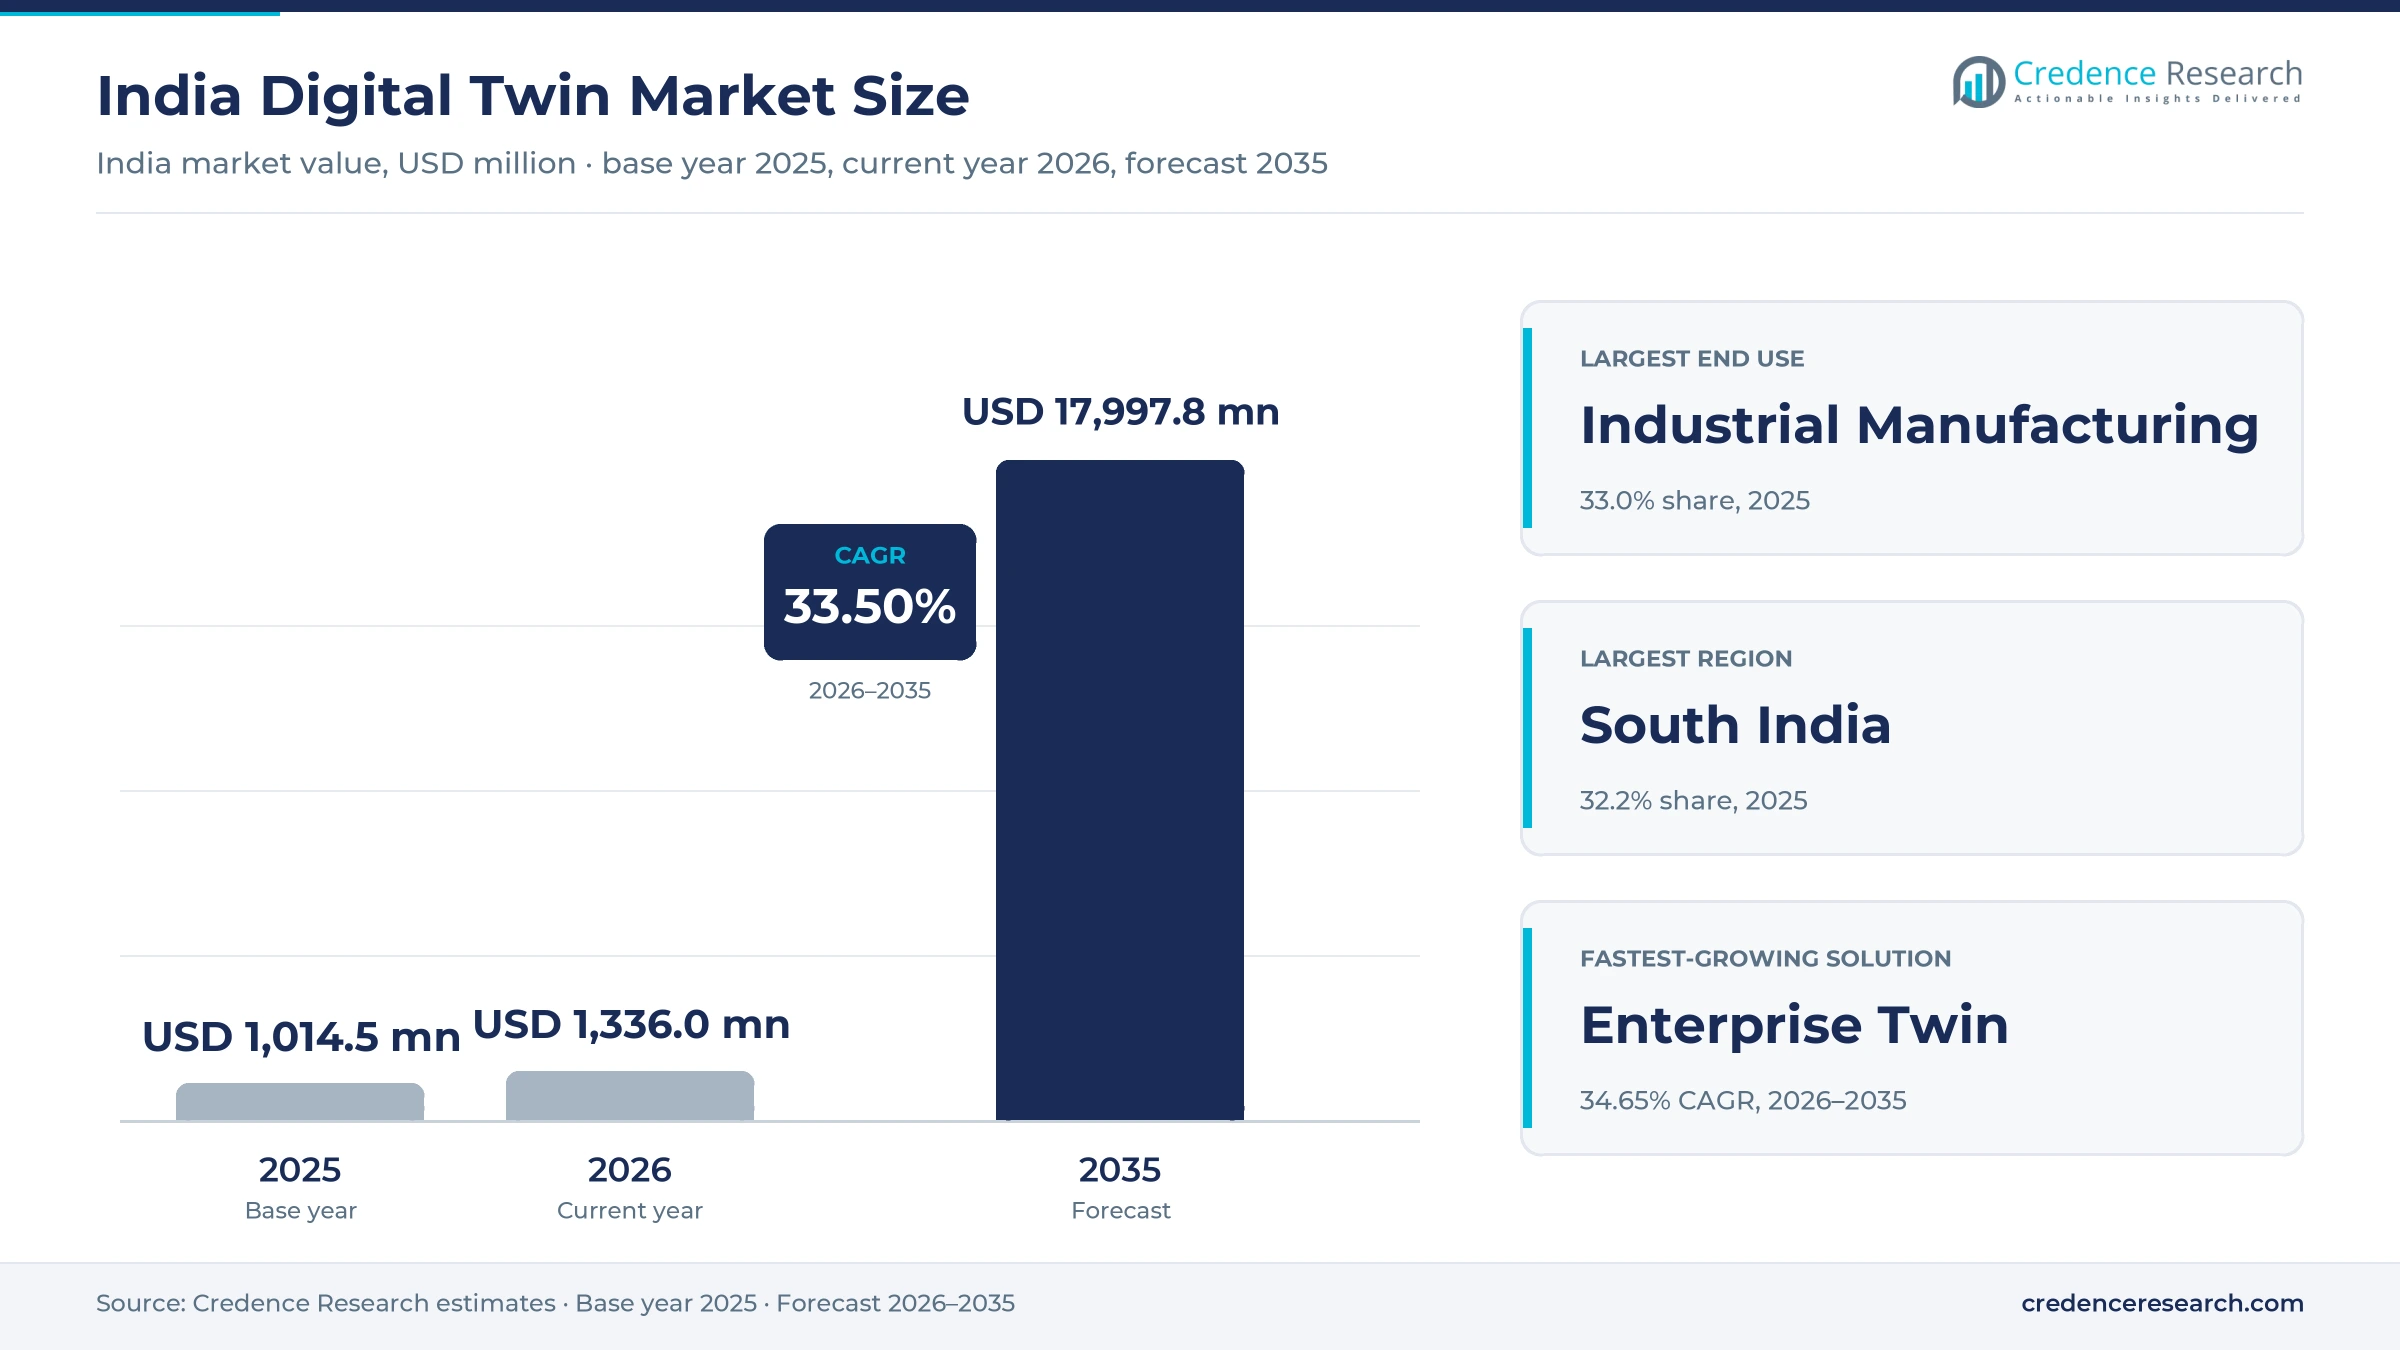
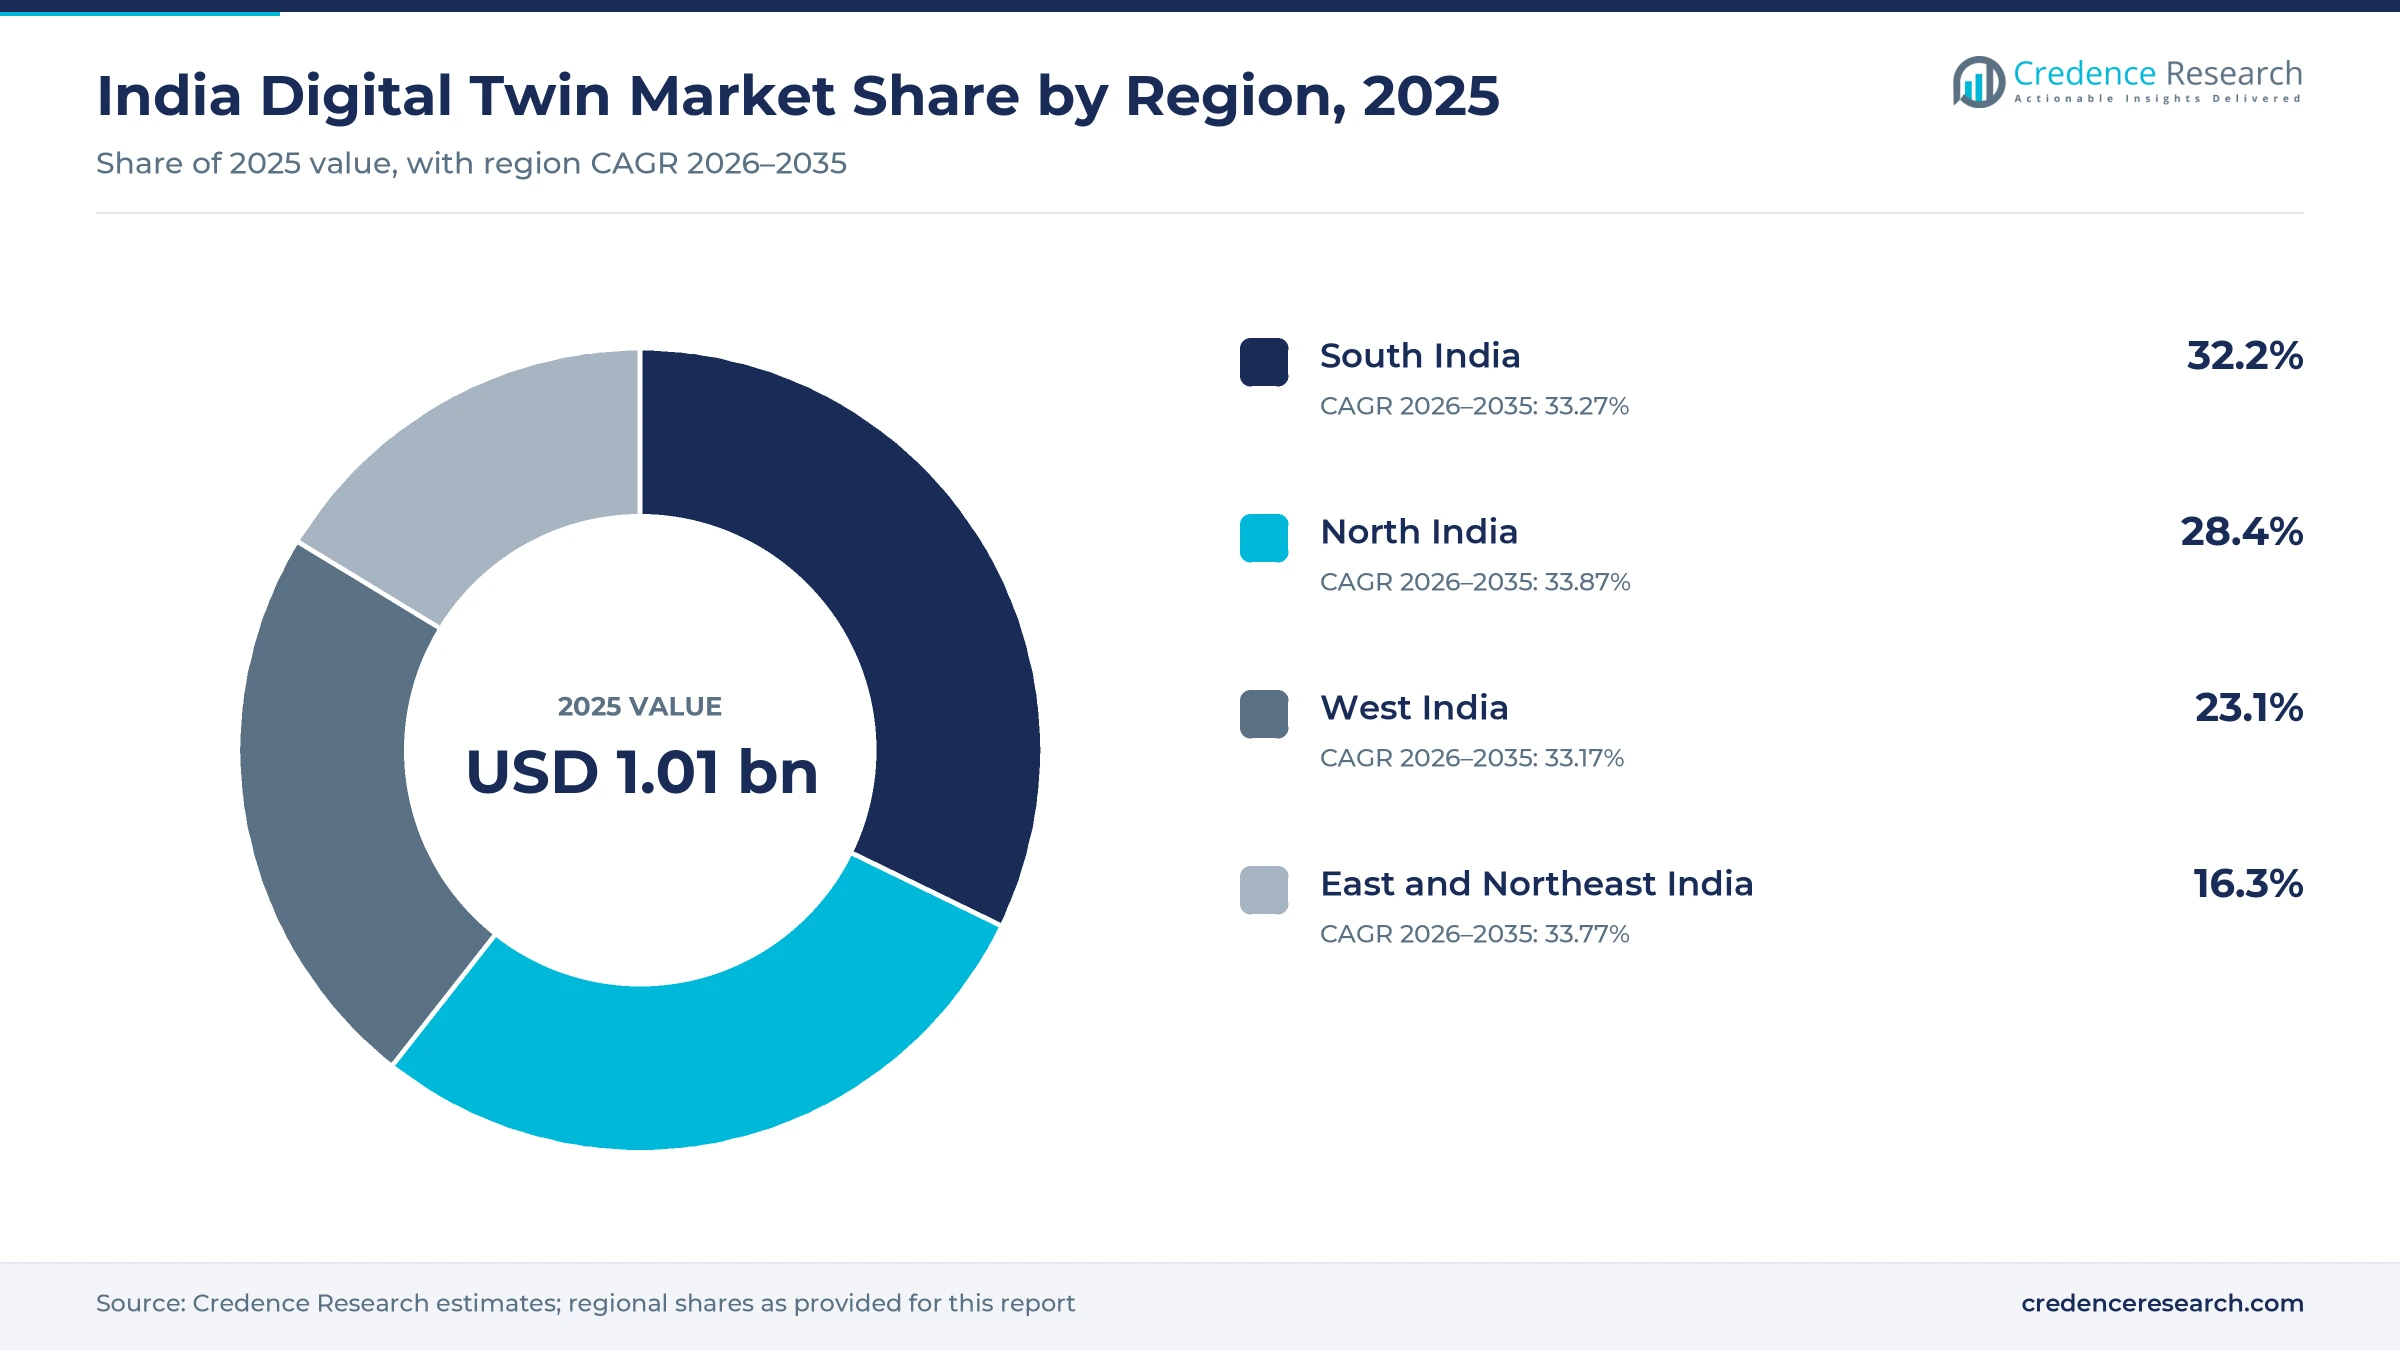
The India digital twin market was valued at USD 1.01 billion in 2025 and is projected to increase from USD 1.34 billion in 2026 to USD 18.00 billion by 2035, registering a CAGR of 33.50% during 2026–2035. Demand comes from manufacturers that simulate products and lines before they build them, from highway, water and city agencies that map assets in three dimensions, and from utilities that watch equipment health in real time. South India held the largest regional share, 32.2% in 2025, because Bengaluru, Hyderabad and Chennai host many engineering and capability centers. North India grows fastest at 33.87% a year, as Uttar Pradesh cities and national agencies in Delhi add mapping and infrastructure projects. The Union Budget of February 2025 also set up a National Geospatial Mission to build base maps for land records, urban planning and project design.
Which virtual replica software and services does this estimate count?
The estimate measures spending in India on software platforms, cloud subscriptions and implementation services that build and run virtual replicas of products, processes, systems and whole enterprises. It counts product, process, system and enterprise twins bought by manufacturers, vehicle makers, utilities and infrastructure owners under subscription, usage, license and project contracts. Values are stated in USD million at current prices, converted from Indian rupees at average annual exchange rates.
The estimate excludes stand-alone design tools used without live data, general cloud hosting, sensors and network hardware sold separately, and survey work that ends in static maps. The value chain runs from platform vendors and cloud providers through system integrators and engineering firms to plant, utility and city teams that use the models.
India Digital Twin Market Insights
- The India digital twin market was valued at USD 1.01 billion in 2025 and is projected to reach USD 18.00 billion by 2035, registering a CAGR of 33.50% during 2026–2035.
- South India held 32.2% of 2025 value, because Bengaluru, Hyderabad and Chennai host many engineering centers and factory software teams.
- Industrial manufacturing led end uses with 33.0% of 2025 value, since plants use virtual lines to test changes before they spend.
- The Union Budget of February 2025 set up a National Geospatial Mission with Rs 100 crore for 2025-26 to build base maps.
- Infrastructure planning grows fastest by application at 34.57% a year during 2026–2035, as highway, water and city agencies build 3D models.
Product twins and public cloud lead early spending
Why do product twins lead early spending?
Based on solution type, the market is categorized into product twin, process twin, system twin and enterprise twin. Product Twin led with 34.0% of 2025 value, because vehicle and machinery makers already use simulation to test parts and designs. Enterprise Twin grows fastest at 34.65% a year, as large groups link plants, supply chains and finance data into one live model.
Why does public cloud hold the largest deployment share?
Based on deployment model, the market is categorized into public cloud, private cloud, hybrid cloud and on-premises. Public Cloud led with 38.0% of 2025 value, because buyers can start projects quickly and rent compute for heavy simulation. Hybrid Cloud grows fastest at 34.00% a year, as plants keep control data on site while sending models to the cloud.
Why does industrial manufacturing take the largest share?
Based on end-use industry, the market is categorized into automotive and mobility, industrial manufacturing, energy and utilities, and infrastructure and built environment. Industrial Manufacturing led with 33.0% of 2025 value, because plants test line changes virtually before they spend. Infrastructure and Built Environment grows fastest at 34.35% a year, as highway, water and city agencies build live 3D models.
Why does predictive maintenance lead application spending?
Based on application, the market is categorized into predictive maintenance, product design and simulation, production optimization and infrastructure planning. Predictive Maintenance led with 31.0% of 2025 value, because plants and utilities can show quick savings from fewer breakdowns. Infrastructure Planning grows fastest at 34.57% a year, as public agencies plan roads, water networks and city services in three dimensions.
| Segment Group | Leading Sub-segment | Share, 2025 | Fastest-growing Sub-segment | CAGR, 2026–2035 |
|---|---|---|---|---|
| By Solution Type | Product Twin | 34.0% | Enterprise Twin | 34.65% |
| By Deployment Model | Public Cloud | 38.0% | Hybrid Cloud | 34.00% |
| By End-Use Industry | Industrial Manufacturing | 33.0% | Infrastructure and Built Environment | 34.35% |
| By Application | Predictive Maintenance | 31.0% | Infrastructure Planning | 34.57% |
Request a Free Sample
Fill in your details and we'll send you a free sample report.
- Sample data tables & charts
- Research methodology
Connected factories and geospatial programs lift demand
How do industrial automation and connected engineering lift demand?
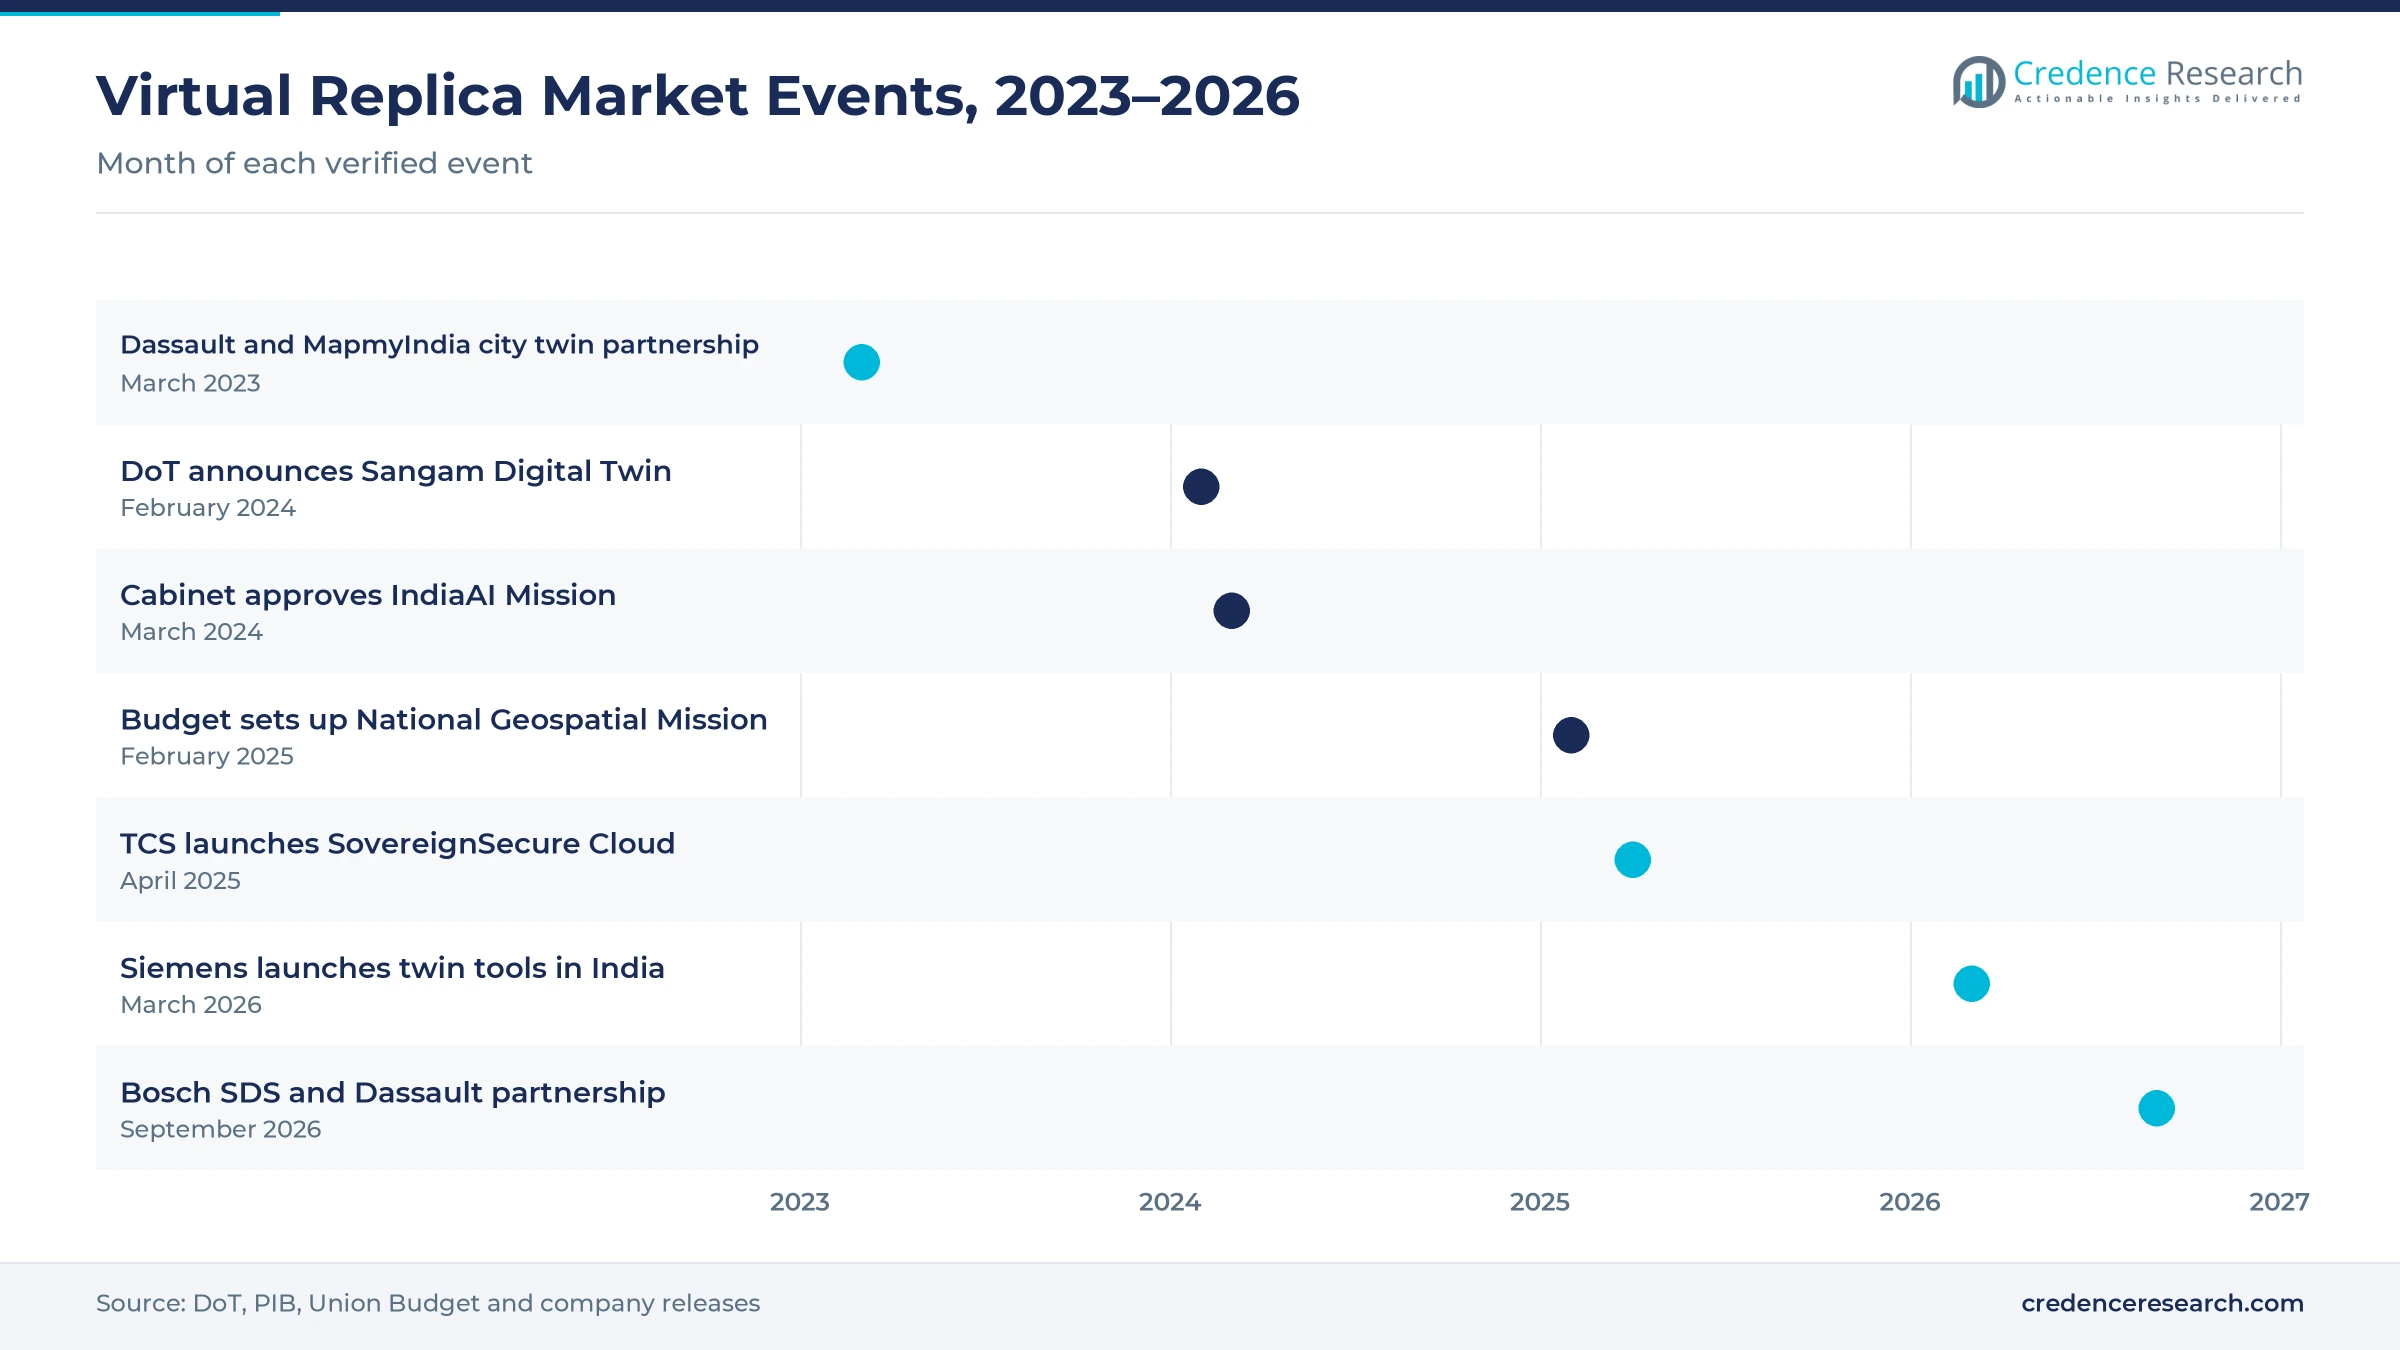
Industrial automation and connected engineering lift demand, because plants want to test line changes, robots and products virtually before they spend on hardware. More than 1,700 global capability centers operate in India and employ over 1.9 million people, according to a Lok Sabha reply on Aug. 6, 2025. Siemens introduced its Teamcenter Digital Reality Viewer and Digital Twin Composer to Indian customers at an event in Mumbai on March 6, 2026. Bosch SDS and Dassault Systèmes also announced a partnership on Sept. 10, 2026, to bring virtual twin and manufacturing software to Indian plants. As a result, industrial manufacturing led with 33.0% of 2025 value, as engineers connect CAD and PLM software with live shop-floor data.
Why do public infrastructure and geospatial programs matter?
Public infrastructure and geospatial modernization widen demand, because highway, water and city agencies now need live 3D maps of their assets. The Union Budget of Feb. 1, 2025, announced a National Geospatial Mission with Rs 100 crore for 2025-26, according to Inc42. Under SVAMITVA, more than 3.1 lakh villages had been mapped with drones by then. Varanasi Smart City and Genesys International built a city model covering about 160 sq km at 1:500 scale, according to IMPRI. Consequently, infrastructure planning grows fastest by application at 34.57% a year, as agencies combine geospatial analytics with sensors, CCTV feeds and land records.
How do AI compute and software exports support adoption?
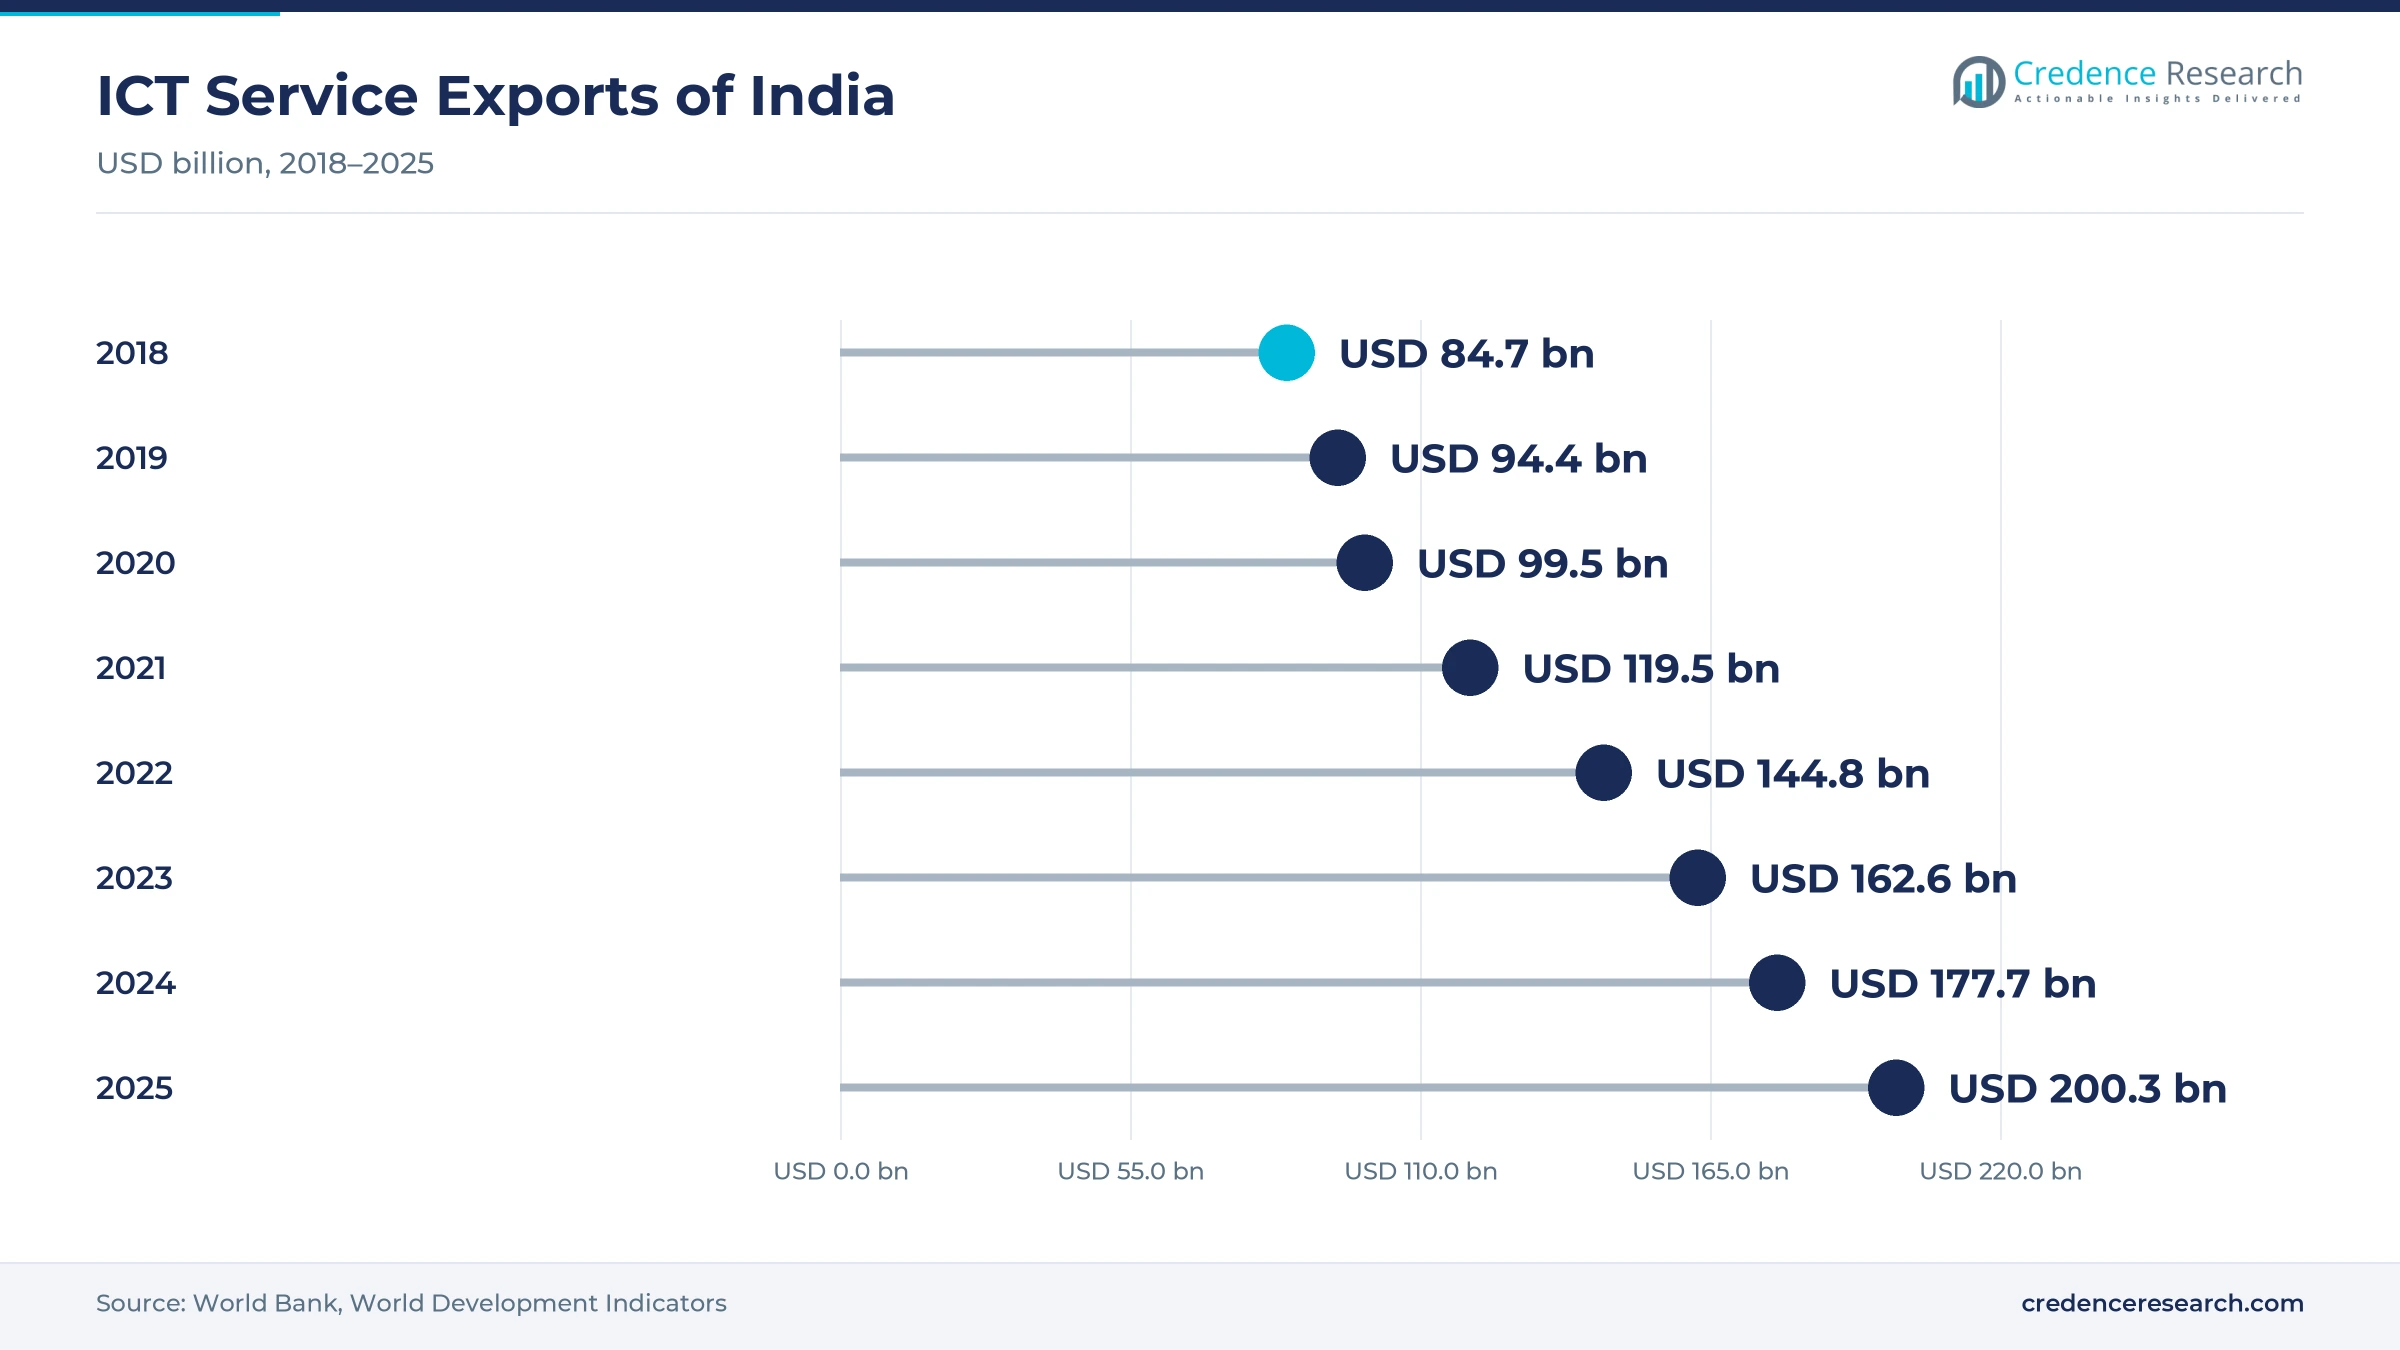
Growing AI compute and a deep software workforce support adoption, because twins need heavy simulation and skilled teams to build them. The Cabinet approved the IndiaAI Mission in March 2024 with an outlay of Rs 10,371.92 crore, and more than 38,000 GPUs had been onboarded by October 2025, according to a government factsheet. ICT service exports rose from USD 84.7 billion in 2018 to USD 200.3 billion in 2025, according to World Bank data. Internet use also reached 70% of the population in 2025, which widens the pool of connected users. In turn, public cloud led deployment with 38.0% of 2025 value, as buyers rent GPU capacity for large models.
Why do energy and mobility assets need live monitoring?
New energy and mobility assets need live monitoring, because operators must keep turbines, chargers and vehicles running with fewer site visits. Installed wind capacity reached 57,443 MW on June 30, 2026, after a record 6,057 MW was added in 2025-26. The country also registered 2.55 million electric vehicles in 2025-26, an 8.3% share of all registrations. NHAI built more than 5,600 km of national highways in 2024-25, and it runs a live digital twin platform for highway project management, according to EPC World. Therefore, predictive maintenance leads applications with 31.0% of 2025 value, as utilities and fleet owners track asset health in real time.
Sovereign cloud, city models and asset health gain ground
How is the shift to hybrid and sovereign cloud playing out?
Buyers are shifting toward hybrid and sovereign cloud setups, because plant control data and public records must stay under local rules. Tata Consultancy Services launched TCS SovereignSecure Cloud on April 24, 2025, with availability zones in Mumbai and Hyderabad for government and regulated industries. The service supports compliance with the Digital Personal Data Protection Act of 2023, which raises the bar for handling personal data. Hybrid cloud grows fastest by deployment at 34.00% a year, while on-premises systems lose share. In turn, cloud professional services firms win work to move models between plant servers, private clouds and public cloud regions.
Why are city-scale models rising?
City-scale models are rising, because municipal and national agencies want one shared view of roads, pipes, buildings and traffic. The Department of Telecommunications announced Sangam Digital Twin in February 2024 and sought expressions of interest by March 15, 2024, for a two-stage proof of concept in a major city. Dassault Systèmes and MapmyIndia Mappls signed a partnership on March 27, 2023, to deliver virtual twin solutions for urban infrastructure. The Varanasi city model also won a SKOCH Gold Award for urban development in April 2025. As a result, infrastructure and built environment grows fastest by end use at 34.35% a year.
Can asset health monitoring open new demand for utilities?
Asset health monitoring offers a clear opening, because water, power and wind operators lose money each time equipment fails without warning. Orange City Water links SCADA and GIS data in a Bentley model to run the Nagpur water system, according to speakers at a Hyderabad event on July 17, 2025. Wind generation reached a record 106.7 billion units in 2025-26, and Gujarat alone had 16,086 MW of installed wind capacity. Turbine and grid operators therefore need early warnings for gearboxes, blades and transformers. In turn, vendors that pair twins with predictive maintenance analytics can sell multi-year subscriptions to utilities and wind farm owners.
Will enterprise twins open demand among large groups?
Enterprise twins offer a second opening, because large groups want one model that links plants, suppliers, energy use and finance. Siemens said its Digital Twin Composer would become available in India toward the end of 2026, after its March 2026 launch event in Mumbai. Siemens also signed agreements with IISc and CMTI in February 2021 to build a twin platform for the machine tool industry under the SAMARTH Udyog program. Enterprise twin grows fastest by solution type at 34.65% a year from a smaller base. Therefore, vendors that combine simulation software with planning and finance data can win group-wide contracts.
Data quality, skills and integration costs slow rollouts
How do poor data quality and legacy systems slow projects?
Poor data quality and legacy systems slow projects, because many plants and agencies still keep drawings, maintenance logs and sensor data in separate formats. Teams then spend months cleaning and linking data before a model gives useful results. As a result, early projects often run late and over budget. Common data standards, phased rollouts and clear data owners help buyers move faster from pilots to plant-wide use across several sites.
Why do skills gaps limit wider adoption?
Skills gaps limit wider adoption, because building and running twins needs people who understand simulation, data engineering and the physical asset at the same time. The Varanasi project reported skills gaps among department staff as one of its challenges. Smaller cities and mid-size firms feel this gap most, since they compete with large employers for the same talent. Therefore, vendor training, university labs and shared service centers help buyers build in-house teams over time.
How do integration and upkeep costs weigh on budgets?
Integration and upkeep costs weigh on budgets, because twins need regular data updates, sensor calibration and software upgrades after launch. Public agencies often fund the first build but not the yearly upkeep that keeps models accurate. Consequently, some models fall out of date and lose value for planners. Subscription pricing and multi-year service contracts help spread costs and keep models current for operators, planners and maintenance teams.
Will data security and privacy concerns delay projects?
Data security and privacy concerns can delay projects, because twins combine CCTV, sensor, map and plant control data in one place. A single breach could expose critical infrastructure or personal data to attackers. Therefore, agencies and firms ask for local hosting, strict access controls and security testing before they approve rollouts. Sovereign cloud options and clear data rules help reduce these delays for public and private buyers.
South India leads while North India grows fastest
| Region | Value, 2025 (USD billion) | Share, 2025 | CAGR, 2026–2035 |
|---|---|---|---|
| South India | 0.33 | 32.2% | 33.27% |
| North India | 0.29 | 28.4% | 33.87% |
| West India | 0.23 | 23.1% | 33.17% |
| East and Northeast India | 0.17 | 16.3% | 33.77% |
How do southern engineering hubs keep the south ahead?
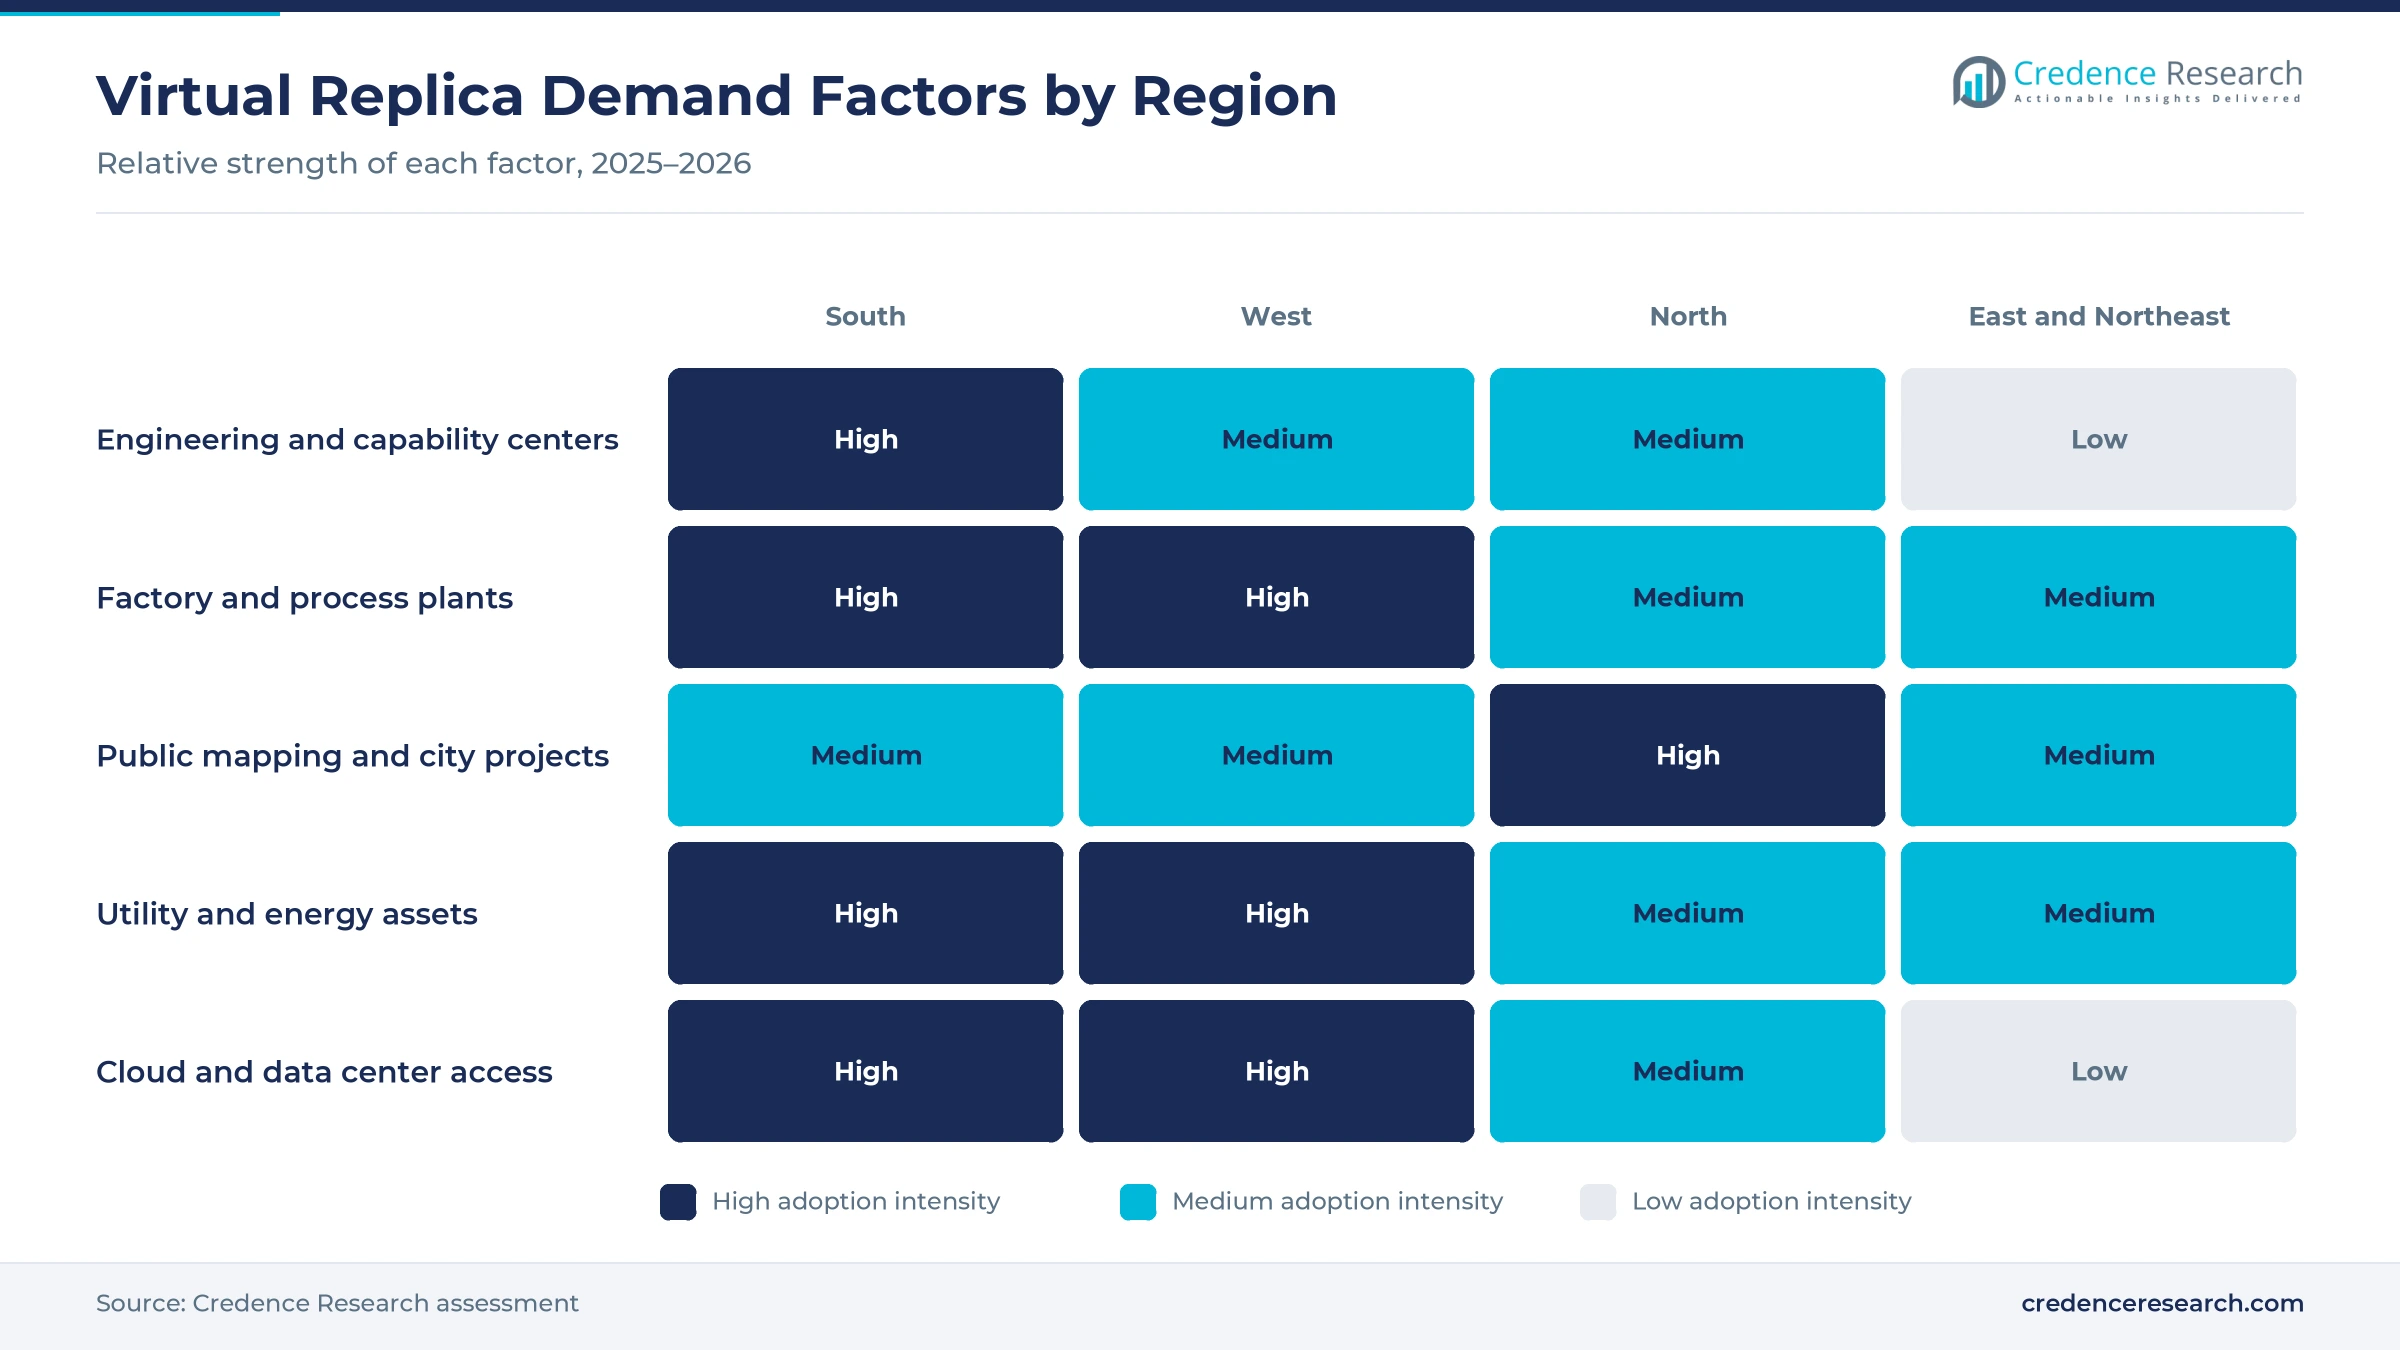
South India is the largest region, with 32.2% of 2025 spending on virtual replicas. The region grows at 33.27% a year, because Bengaluru, Hyderabad and Chennai host many engineering and capability centers. Karnataka, Tamil Nadu and Telangana each have dedicated policies for global capability centers. Bentley Systems held its Innovation Day in Hyderabad on July 17, 2025, while Siemens works with IISc and CMTI in Bengaluru. As a result, the south leads in product design and factory projects.
Why is North India the fastest-growing region?
North India held 28.4% of 2025 spending on virtual replicas, the second-largest regional share. The region grows fastest at 33.87% a year, because national agencies in Delhi and cities in Uttar Pradesh add mapping and infrastructure projects. The Varanasi city model covers about 160 sq km and links CCTV and smart sensors. Uttar Pradesh and Madhya Pradesh also have dedicated capability center policies. Therefore, northern demand mixes public infrastructure work with new engineering centers.
How do western industrial states add demand?
West India held 23.1% of 2025 spending on virtual replicas and grows at 33.17% a year. Siemens showed its Teamcenter Digital Reality Viewer at an event in Mumbai on March 6, 2026, and Orange City Water runs a Bentley model for the Nagpur water system. Gujarat and Maharashtra also host large vehicle, chemical and power plants. In turn, the region adds demand from process twins, utilities and factory upgrades.
Can East and Northeast India open new demand?
East and Northeast India held 16.3% of 2025 spending on virtual replicas and grows at 33.77% a year. Steel, mining and power assets in the eastern states need live monitoring, while smaller cities rely on national mapping programs for base data.
Platform launches, missions and partnerships since 2023
| Development | Status and market relevance |
|---|---|
| In March 2023, Dassault Systèmes and MapmyIndia Mappls agreed to deliver virtual twin solutions for urban infrastructure. | Covers planning, transport, utilities and heritage |
| In February 2024, the Department of Telecommunications announced Sangam Digital Twin for infrastructure planning. | Two-stage proof of concept in a major city |
| In February 2025, the Union Budget set up a National Geospatial Mission with Rs 100 crore for 2025-26. | Builds base maps for land records and urban planning |
| In March 2026, Siemens launched Teamcenter Digital Reality Viewer and Digital Twin Composer in India. | Composer availability expected toward the end of 2026 |
| In September 2026, Bosch SDS and Dassault Systèmes partnered on AI-led manufacturing software in India. | Early work with an Indian electric vehicle maker |
Simulation, GPUs, LiDAR and IoT reshape virtual models
- Physics-based simulation lets engineers test loads, heat and flow on virtual parts and lines, which cuts the number of physical prototypes.
- GPU compute capacity from the IndiaAI Mission and cloud providers lets firms run large, photorealistic models without buying their own clusters.
- LiDAR and drone mapping capture roads, buildings and terrain at 1:500 scale, which gives city and highway twins accurate base data.
- Industrial IoT sensors stream vibration, temperature and flow data into models, which turns a static replica into a live operating tool.
Need a Custom Version of This Report?
Tailor the scope, geography, or segments to your exact requirements.
- Custom geography or segment scope
- Direct access to our analyst team
Global software firms and Indian integrators compete
Competition mixes global engineering software firms with Indian IT services companies and local mapping specialists. Siemens launched Teamcenter Digital Reality Viewer in India in March 2026 and works with IISc and CMTI on machine tool twins. Dassault Systèmes partners with MapmyIndia Mappls on city models and with Bosch SDS on factory software. Bentley Systems promotes infrastructure twins to Indian agencies, and NHAI runs a live highway twin platform. Tata Consultancy Services offers a sovereign cloud for regulated buyers. Microsoft, Ansys, PTC, Autodesk, IBM and Infosys are listed for this market, although their specific twin projects in India could not be confirmed. Companies compete on simulation depth, data integration, local hosting, industry templates and the size of their partner networks.
Companies profiled and their roles in this market
| Company | Type | Role in the market |
|---|---|---|
| Siemens | Global software and automation company | Teamcenter Digital Reality Viewer and Digital Twin Composer launched in India, 2026 |
| Dassault Systèmes | Global software company | City twins with MapmyIndia Mappls; factory software with Bosch SDS |
| Bentley Systems | Global infrastructure software company | Infrastructure twins promoted to Indian highway and water agencies |
| Tata Consultancy Services | Indian IT services company | Sovereign cloud with Mumbai and Hyderabad zones for regulated buyers |
Credence Research view on industrial and civic adoption
Credence Research's view is that the India digital twin market will grow quickly from a modest base, as factories, utilities and public agencies move from static drawings to live virtual models. Global capability centers, AI compute and national mapping programs give the country both the skills and the base data that twins need. However, poor data quality, skills gaps and the cost of keeping models current will separate successful projects from stalled pilots. Vendors that offer local hosting and industry templates are best placed to win.
How the virtual replica spending estimate was built
The report uses 2025 as the base year, with values in USD million at current prices. Market values come from the Credence Research model, which combines software, cloud and services spending by industry, the number of active projects and average contract values. Regional shares are those set for this report, and segment splits by solution type, deployment model, end use and application are Credence Research estimates. Sources used are government factsheets, budget and parliamentary data, World Bank data, company statements and news reports, and no interviews or surveys were used.
Factory, utility and city projects set the path to 2035
The market is expected to reach USD 18.00 billion by 2035, a 33.50% CAGR during 2026–2035, as factories, utilities and city agencies adopt live virtual models. Growth should be strongest in North India and in infrastructure planning, while South India keeps the largest share. National mapping programs, AI compute and sovereign cloud options should lower barriers for public buyers. In contrast, weak data standards or tight upkeep budgets would slow the move from pilots to full rollouts and hurt smaller integrators.
Frequently Asked Questions
How big is the India digital twin market?
Which region leads spending in India?
Which region grows fastest?
Which end use holds the largest share?
Which application grows fastest?
What government programs support adoption?
Who are the leading companies in India?
What are the main risks to growth?
Table of Content
Chapter 1 Market Segmentation
- 1.1 Segmentation Framework
- 1.1.1 Product and Service Classification
- 1.1.2 Application and End-Use Classification
- 1.1.3 Technology and Solution Classification
- 1.1.4 Customer and Distribution Channel Classification
- 1.1.5 Geographic Segmentation
- 1.1.6 Market Segment Definitions and Boundaries
- 1.2 By Solution Type
- 1.2.1 Product Twin
- 1.2.2 Process Twin
- 1.2.3 System Twin
- 1.2.4 Enterprise Twin
- 1.3 By Deployment Model
- 1.3.1 Public Cloud
- 1.3.2 Private Cloud
- 1.3.3 Hybrid Cloud
- 1.3.4 On-Premises
- 1.4 By End-Use Industry
- 1.4.1 Automotive and Mobility
- 1.4.2 Industrial Manufacturing
- 1.4.3 Energy and Utilities
- 1.4.4 Infrastructure and Built Environment
- 1.5 By Application
- 1.5.1 Predictive Maintenance
- 1.5.2 Product Design and Simulation
- 1.5.3 Production Optimization
- 1.5.4 Infrastructure Planning
Chapter 2 Introduction
- 2.1 Report Objectives and Scope
- 2.2 Product Definition and Industry Terminology
- 2.3 Market Inclusions and Exclusions
- 2.4 Research Process
- 2.4.1 Primary Research and Expert Interviews
- 2.4.2 Secondary Research and Source Review
- 2.4.3 Top-Down and Bottom-Up Estimation
- 2.4.4 Data Triangulation and Verification
- 2.5 Market Size Measurement Basis
- 2.5.1 2025: USD 1.01 billion → 2035: USD 18.00 billion
- 2.6 Historical and Forecast Reference Periods
- 2.6.1 Historical Period: 2018-2025
- 2.6.2 Base Year: 2025
- 2.6.3 Forecast Period: 2025-2035
- 2.7 Research Assumptions and Limitations
Chapter 3 Executive Summary
- 3.1 Market Snapshot and Key Findings
- 3.2 Base-Year Market Size, 2025
- 3.3 Forecast Market Size, 2035
- 3.4 Revenue and Volume Growth Outlook
- 3.5 Key Demand and Supply Indicators
- 3.6 Leading Market Segments
- 3.7 Fastest-Growing Market Opportunities
- 3.8 Regional Performance Highlights
- 3.9 Technology and Industry Transformation
- 3.10 Competitive Landscape Summary
- 3.11 Analyst View and Strategic Implications
Chapter 4 India Digital Twin Market Trends and Developments
- 4.1 Historical Industry Development, 2018-2025
- 4.2 Recent Market Trends and Developments
- 4.3 Demand and Customer Behavior Trends
- 4.4 Technology and Product Innovation
- 4.5 Artificial Intelligence, Automation and Digitalization
- 4.6 Local Manufacturing and Supply Chain Realignment
- 4.7 Industry Partnerships, Mergers and Acquisitions
- 4.8 Sustainability and Circular Economy Developments
- 4.9 Government and Private Sector Investment Trends
- 4.10 Emerging Business Models and Commercialization
- 4.11 Industry Developments and Announcements
Chapter 5 India Digital Twin Market Supply and Demand Analysis
- 5.1 Demand Trend and Consumption Analysis, 2018-2025
- 5.2 Demand Forecast, 2025-2035
- 5.3 Supply Chain Structure and Procurement Trends
- 5.4 Supply-Demand Gap and Bottlenecks
- 5.5 Import Dependence and Sourcing Structure
- 5.6 Regional Supply and Demand Concentration
Chapter 6 India Digital Twin Market Pricing Analysis
- 6.1 Pricing Structure and Measurement
- 6.2 Historical Pricing Trends, 2018-2025
- 6.3 Pricing Outlook, 2025-2035
- 6.4 Pricing by Product and Market Segment
- 6.5 Geographic Pricing Differences
- 6.6 Key Input, Energy, Labor and Logistics Costs
- 6.7 Contract Pricing and Purchasing Models
- 6.8 Pricing Sensitivity and Competitive Positioning
- 6.9 Price, Margin and Profitability Implications
Chapter 7 India Digital Twin Market Dynamics
- 7.1 Market Growth Drivers
- 7.1.1 Demand-Side Drivers
- 7.1.2 Technology and Innovation Drivers
- 7.1.3 Infrastructure and Investment Drivers
- 7.1.4 Regulatory and Policy Drivers
- 7.2 Market Restraints
- 7.2.1 Cost and Affordability Constraints
- 7.2.2 Technology and Adoption Barriers
- 7.2.3 Supply Chain and Operational Constraints
- 7.3 Market Challenges
- 7.3.1 Competitive Pressure and Margin Erosion
- 7.3.2 Skills, Infrastructure and Implementation Gaps
- 7.4 Emerging Market Opportunities
- 7.5 Market Dynamics Impact and Time-Horizon Assessment
Chapter 8 India Digital Twin Value Chain Analysis
- 8.1 Industry Value Chain Overview
- 8.2 Upstream Suppliers and Critical Inputs
- 8.3 Technology and Component Providers
- 8.4 Manufacturing or Service Delivery
- 8.5 Distribution, Channel Partners and Integrators
- 8.6 Downstream Applications and End Users
- 8.7 Value Addition and Profit Pools
- 8.8 Vertical Integration and Outsourcing
- 8.9 Supplier Concentration and Risk
- 8.10 Supply Chain Localization and Resilience
Chapter 9 India Digital Twin Market Regulations and Policies
- 9.1 Relevant Laws, Standards and Compliance Frameworks
- 9.2 Product, Service, Safety and Quality Requirements
- 9.3 Government Policies, Incentives and Subsidies
- 9.4 Imports, Exports and Trade Barriers
- 9.5 Public Procurement and Local Content Requirements
- 9.6 Data Protection, AI and Cybersecurity Compliance
- 9.7 Upcoming Policy Changes and Market Implications
Chapter 10 India Digital Twin Market Hotspots and Opportunities
- 10.1 Market Opportunity Mapping and Growth Hotspots
- 10.2 High-Growth Applications and Customer Groups
- 10.3 Underserved Markets and White-Space Opportunities
- 10.4 Emerging Technology and Product Opportunities
- 10.5 New Capacity and Investment Hotspots
- 10.6 Market Entry and Expansion Opportunities
- 10.7 Distribution and Partnership Opportunities
- 10.8 Near-Term and Long-Term Commercial Potential
- 10.9 Opportunity Attractiveness and Execution Risks
Chapter 11 India Digital Twin Market Outlook, 2025-2035
- 11.1 Market Size and Analysis
- 11.1.1 Revenue (Market Measurement: 2025: USD 1.01 billion → 2035: USD 18.00 billion)
- 11.1.2 Historical Market Size, 2018-2025
- 11.1.3 Base-Year Market Size, 2025
- 11.2 Market Forecast, 2025-2035
- 11.2.1 Revenue Forecast to 2035
- 11.2.2 CAGR and Year-on-Year Growth
- 11.2.3 Incremental Revenue Opportunity
- 11.3 Forecast Assumptions and Scenario Analysis
- 11.3.1 Base-Case Forecast
- 11.3.2 Optimistic and Conservative Scenarios
- 11.3.3 Technology, Pricing and Policy Sensitivities
- 11.4 Market Attractiveness and Growth Outlook
Chapter 12 India Digital Twin Market Segmentation and Outlook
- 12.1 Segmentation Summary and Market Shares, 2025
- 12.2 Largest and Fastest-Growing Segments
- 12.3 By Solution Type - Market Size and Forecast, 2025-2035
- 12.3.1 Segment Definition and Scope
- 12.3.2 Historical Market Size, 2018-2025
- 12.3.3 Revenue Forecast, 2025-2035
- 12.3.4 Base-Year Market Share, 2025
- 12.3.5 Segment CAGR and Growth Drivers
- 12.3.6 Subsegment Market Size and Forecast
- 12.3.6.1 Product Twin
- 12.3.6.2 Process Twin
- 12.3.6.3 System Twin
- 12.3.6.4 Enterprise Twin
- 12.3.7 Subsegment Pricing and Adoption Trends
- 12.3.8 Leading Suppliers and Competition
- 12.3.9 Regional Demand and Opportunities
- 12.4 By Deployment Model - Market Size and Forecast, 2025-2035
- 12.4.1 Segment Definition and Scope
- 12.4.2 Historical Market Size, 2018-2025
- 12.4.3 Revenue Forecast, 2025-2035
- 12.4.4 Base-Year Market Share, 2025
- 12.4.5 Segment CAGR and Growth Drivers
- 12.4.6 Subsegment Market Size and Forecast
- 12.4.6.1 Public Cloud
- 12.4.6.2 Private Cloud
- 12.4.6.3 Hybrid Cloud
- 12.4.6.4 On-Premises
- 12.4.7 Subsegment Pricing and Adoption Trends
- 12.4.8 Leading Suppliers and Competition
- 12.4.9 Regional Demand and Opportunities
- 12.5 By End-Use Industry - Market Size and Forecast, 2025-2035
- 12.5.1 Segment Definition and Scope
- 12.5.2 Historical Market Size, 2018-2025
- 12.5.3 Revenue Forecast, 2025-2035
- 12.5.4 Base-Year Market Share, 2025
- 12.5.5 Segment CAGR and Growth Drivers
- 12.5.6 Subsegment Market Size and Forecast
- 12.5.6.1 Automotive and Mobility
- 12.5.6.2 Industrial Manufacturing
- 12.5.6.3 Energy and Utilities
- 12.5.6.4 Infrastructure and Built Environment
- 12.5.7 Subsegment Pricing and Adoption Trends
- 12.5.8 Leading Suppliers and Competition
- 12.5.9 Regional Demand and Opportunities
- 12.6 By Application - Market Size and Forecast, 2025-2035
- 12.6.1 Segment Definition and Scope
- 12.6.2 Historical Market Size, 2018-2025
- 12.6.3 Revenue Forecast, 2025-2035
- 12.6.4 Base-Year Market Share, 2025
- 12.6.5 Segment CAGR and Growth Drivers
- 12.6.6 Subsegment Market Size and Forecast
- 12.6.6.1 Predictive Maintenance
- 12.6.6.2 Product Design and Simulation
- 12.6.6.3 Production Optimization
- 12.6.6.4 Infrastructure Planning
- 12.6.7 Subsegment Pricing and Adoption Trends
- 12.6.8 Leading Suppliers and Competition
- 12.6.9 Regional Demand and Opportunities
- 12.7 Segment Growth Comparison
- 12.8 Segment Attractiveness and Priority Matrix
Chapter 13 India Digital Twin End-Use and Application Market Outlook
- 13.1 End-Use Industry and Customer Demand Structure
- 13.2 Leading Applications and Customer Groups
- 13.3 End-Use Market Size, Share and Forecast
- 13.4 Major End-Use Industry Deep Dives
- 13.4.1 Customer Requirements and Use Cases
- 13.4.2 Demand and Replacement Cycles
- 13.4.3 Technical and Regulatory Considerations
- 13.4.4 Purchasing and Procurement Models
- 13.4.5 Leading Vendors and Distribution Channels
- 13.4.6 Forecast and Commercial Opportunities
- 13.5 Emerging Applications and Cross-Segment Demand
- 13.6 End-Use Industry Investment Priorities
Chapter 14 India Digital Twin Geographic Market Outlook, 2025-2035
- 14.1 Regional Market Size and Country-Level Shares, 2025
- 14.2 Country Market Size Comparison, 2025
- 14.3 Country Market Forecasts, 2025-2035
- 14.4 Subregional Industrial and Demand Clusters
- 14.5 Intra-Regional Pricing and Cost Differences
- 14.6 Cross-Border Trade and Supply Networks
- 14.7 Regional Supply and Demand Balances
- 14.8 Country Opportunity Comparison and Prioritization
Note: Every listed country is covered on the structure shown under the first country.
Chapter 15 India Digital Twin Technology, Innovation and Sustainability Outlook
- 15.1 Technology Landscape and Maturity
- 15.2 Product, Process and Service Innovation
- 15.3 AI, Automation and Digital Tools in the Industry
- 15.4 Technology Adoption and Performance Benchmarking
- 15.5 Innovation Pipeline and R&D Investment
- 15.6 Patent and Intellectual Property Trends
- 15.7 Energy Efficiency and Resource Management
- 15.8 Sustainability, Recycling and Circularity
- 15.9 Technology Roadmap, 2025-2035
- 15.10 Risks of Obsolescence and Technology Substitution
Chapter 16 India Digital Twin Market Key Strategic Imperatives
- 16.1 Growth and Market Entry Priorities
- 16.2 High-Return Products and Segments
- 16.3 Pricing, Profitability and Cost Optimization
- 16.4 Technology Investment and Product Differentiation
- 16.5 Supply Chain Localization and Resilience
- 16.6 Distribution and Customer Acquisition
- 16.7 Partnership, Acquisition and Capacity Strategy
- 16.8 Regional Expansion Priorities
- 16.9 Short-, Medium- and Long-Term Actions
Chapter 17 Competition Outlook
- 17.1 Industry Competition Characteristics
- 17.2 Market Structure and Concentration
- 17.3 Market Share and Competitive Positioning, 2025
- 17.4 Company-Wise Revenue and Product Benchmarking
- 17.5 Production and Service Capacity Benchmarking
- 17.6 Technology, Pricing and Differentiation
- 17.7 Regional Footprint and Distribution Strength
- 17.8 Mergers, Acquisitions and Strategic Alliances
- 17.9 New Entrants and Competitive Threats
- 17.10 Porter's Five Forces and Industry Attractiveness
- 17.11 Competitive Outlook, 2025-2035
Chapter 18 Company Profiles
- 18.1 Company Coverage and Selection Criteria
- 18.2 Siemens
- 18.2.1 Business Description
- 18.2.2 Company Ownership and Geographic Presence
- 18.2.3 Product and Service Portfolio
- 18.2.4 Manufacturing and Operating Footprint
- 18.2.5 Financial Performance and Investment
- 18.2.6 Market Share and Competitive Position
- 18.2.7 Technology and Innovation Capabilities
- 18.2.8 Strategic Alliances or Partnerships
- 18.2.9 Recent Developments
- 18.2.10 Growth Strategy and Outlook
- 18.3 Dassault Systèmes
- 18.4 Tata Consultancy Services
- 18.5 Microsoft
- 18.6 Ansys
- 18.7 PTC
- 18.8 Autodesk
- 18.9 Bentley Systems
- 18.10 IBM
- 18.11 Infosys
- 18.12 Other Relevant Market Participants
Note: Every listed company is profiled on the structure shown under the first company. The company list is preliminary and may change based on research findings, market developments, data availability and client requirements.
Chapter 19 Disclaimer
- 19.1 Research and Forecast Disclaimer
- 19.2 Data Source and Estimation Limitations
Note: The depth of individual sections depends on data availability for this market. Volume, capacity, trade and other unit-based metrics are included where applicable.

