
Australian data halls buy more filters as AI racks arrive
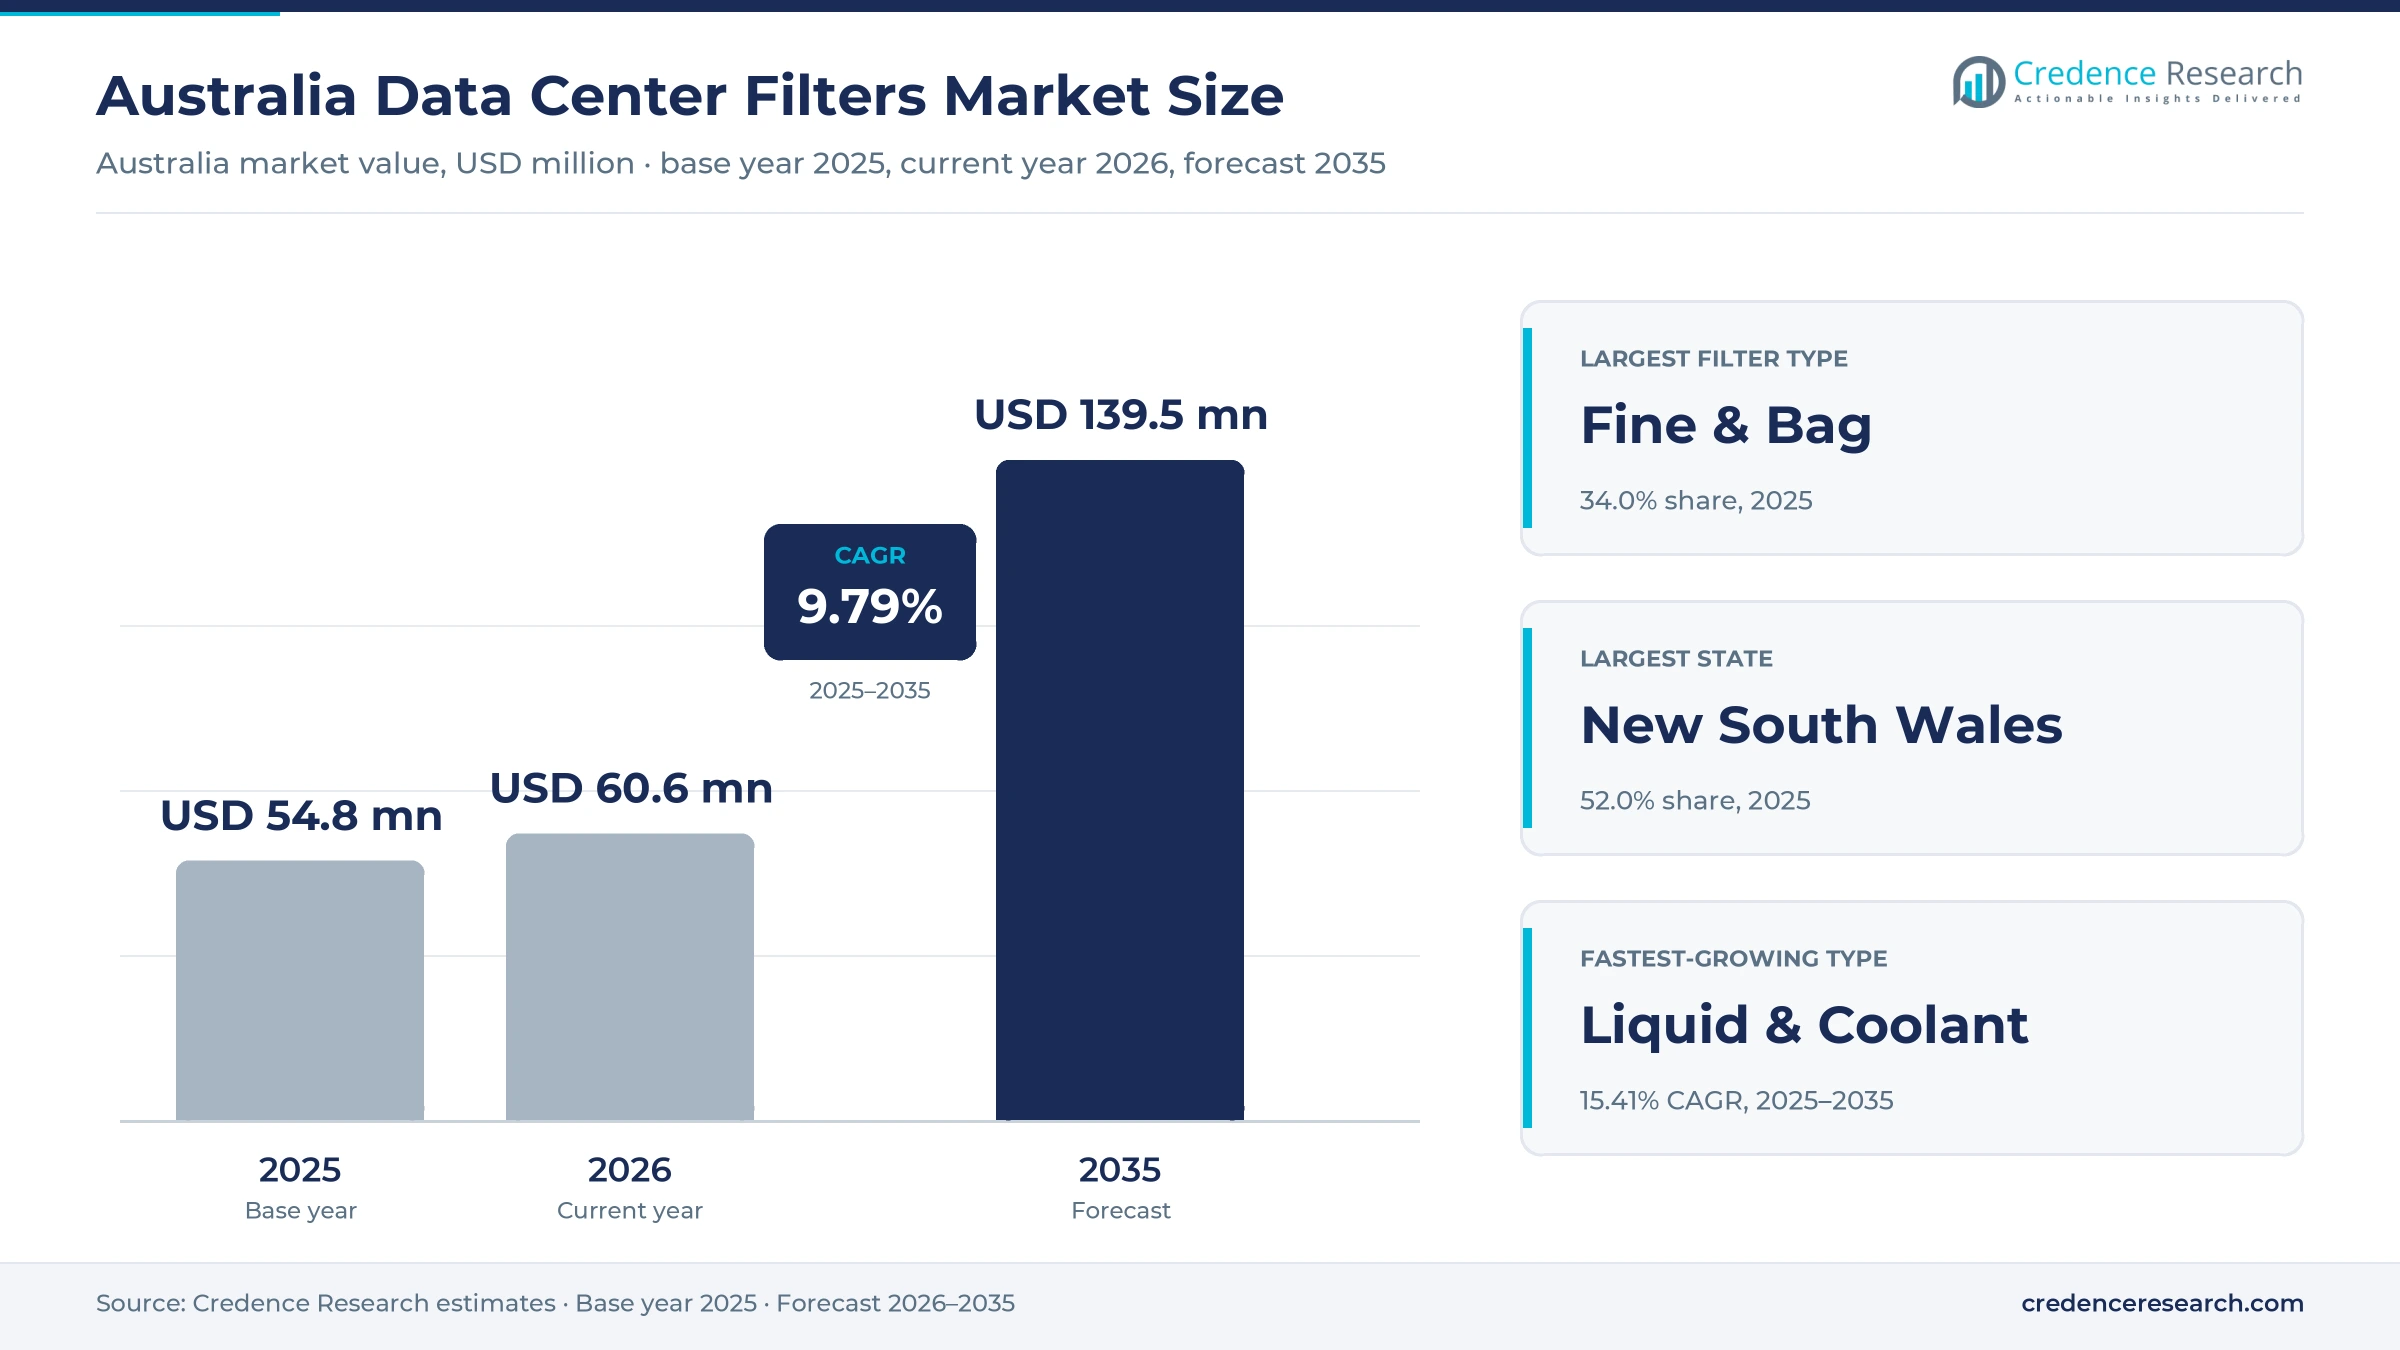
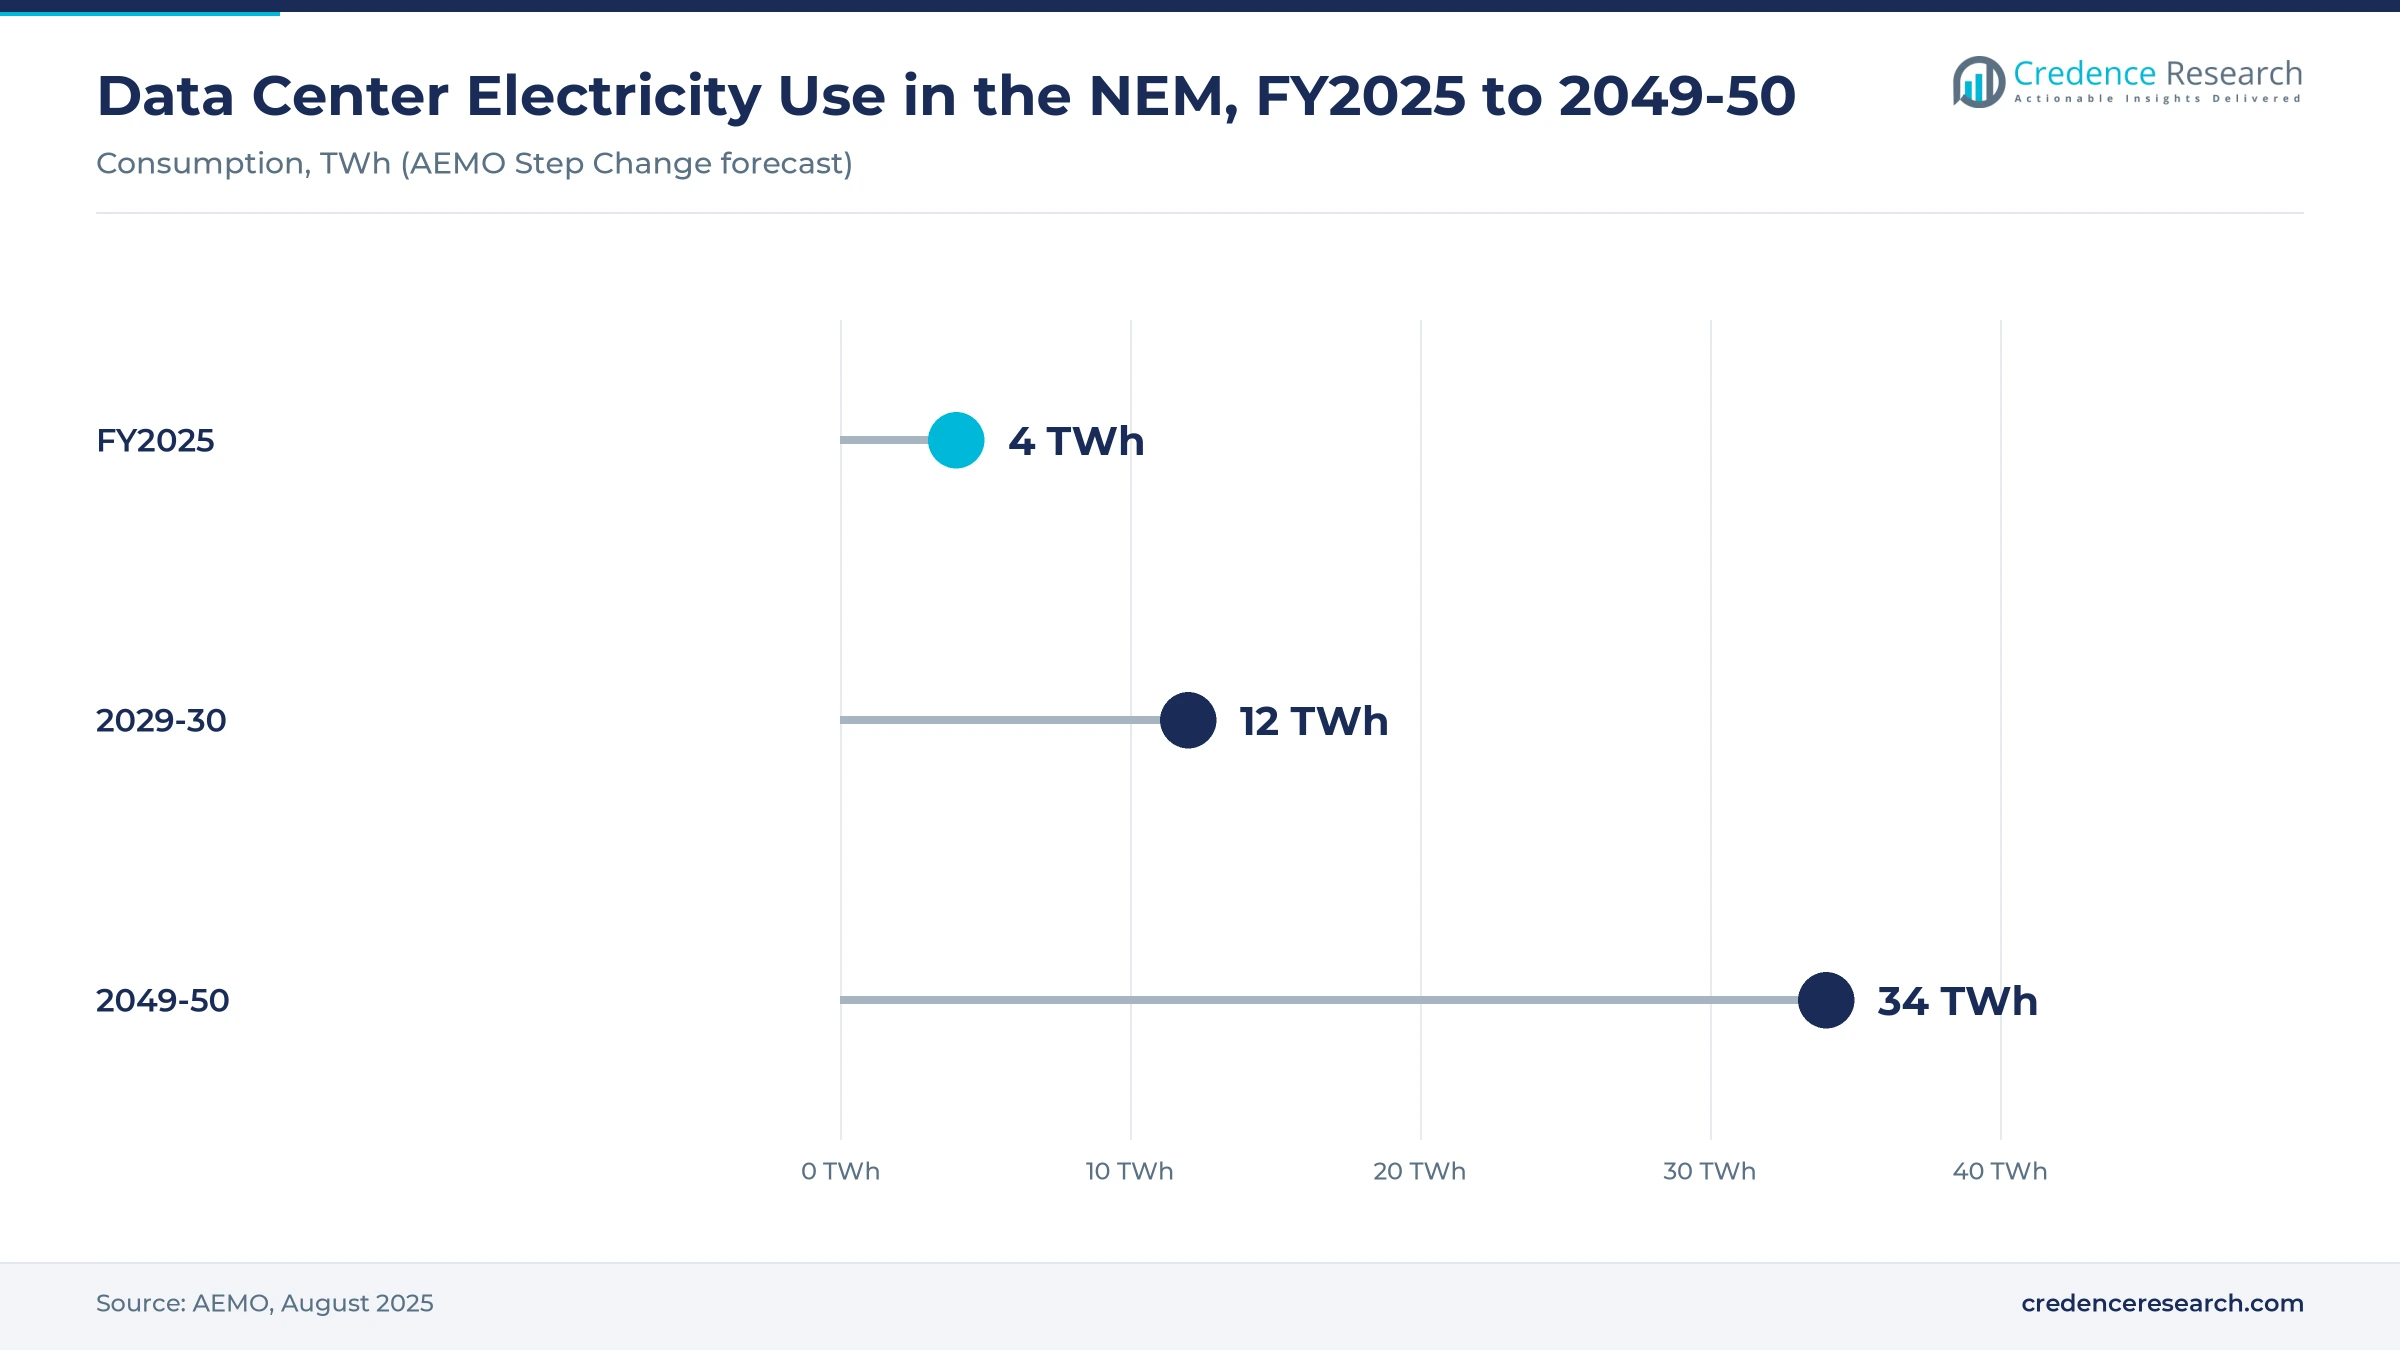
The Australia data center filters market was valued at USD 54.8 million in 2025 and is projected to increase from USD 60.6 million in 2026 to USD 139.5 million by 2035, registering a CAGR of 9.79% during 2025–2035. Three forces underpin demand, namely data center electricity use that the Australian Energy Market Operator expects to roughly triple from about 4 TWh in FY2025 to about 12 TWh by 2029-30, hyperscale and colocation construction around Sydney and Melbourne and outside air that carries dust, salt and bushfire smoke into cooling systems. New South Wales held the largest state share, 52.0% in 2025, as the home of the largest hyperscale campuses. The main technical change is direct-to-chip liquid cooling for AI racks, which creates a separate line of demand for fine coolant filtration inside chilled water, condenser water and direct-to-chip cooling loops.
Which filters does an Australian data hall consume?
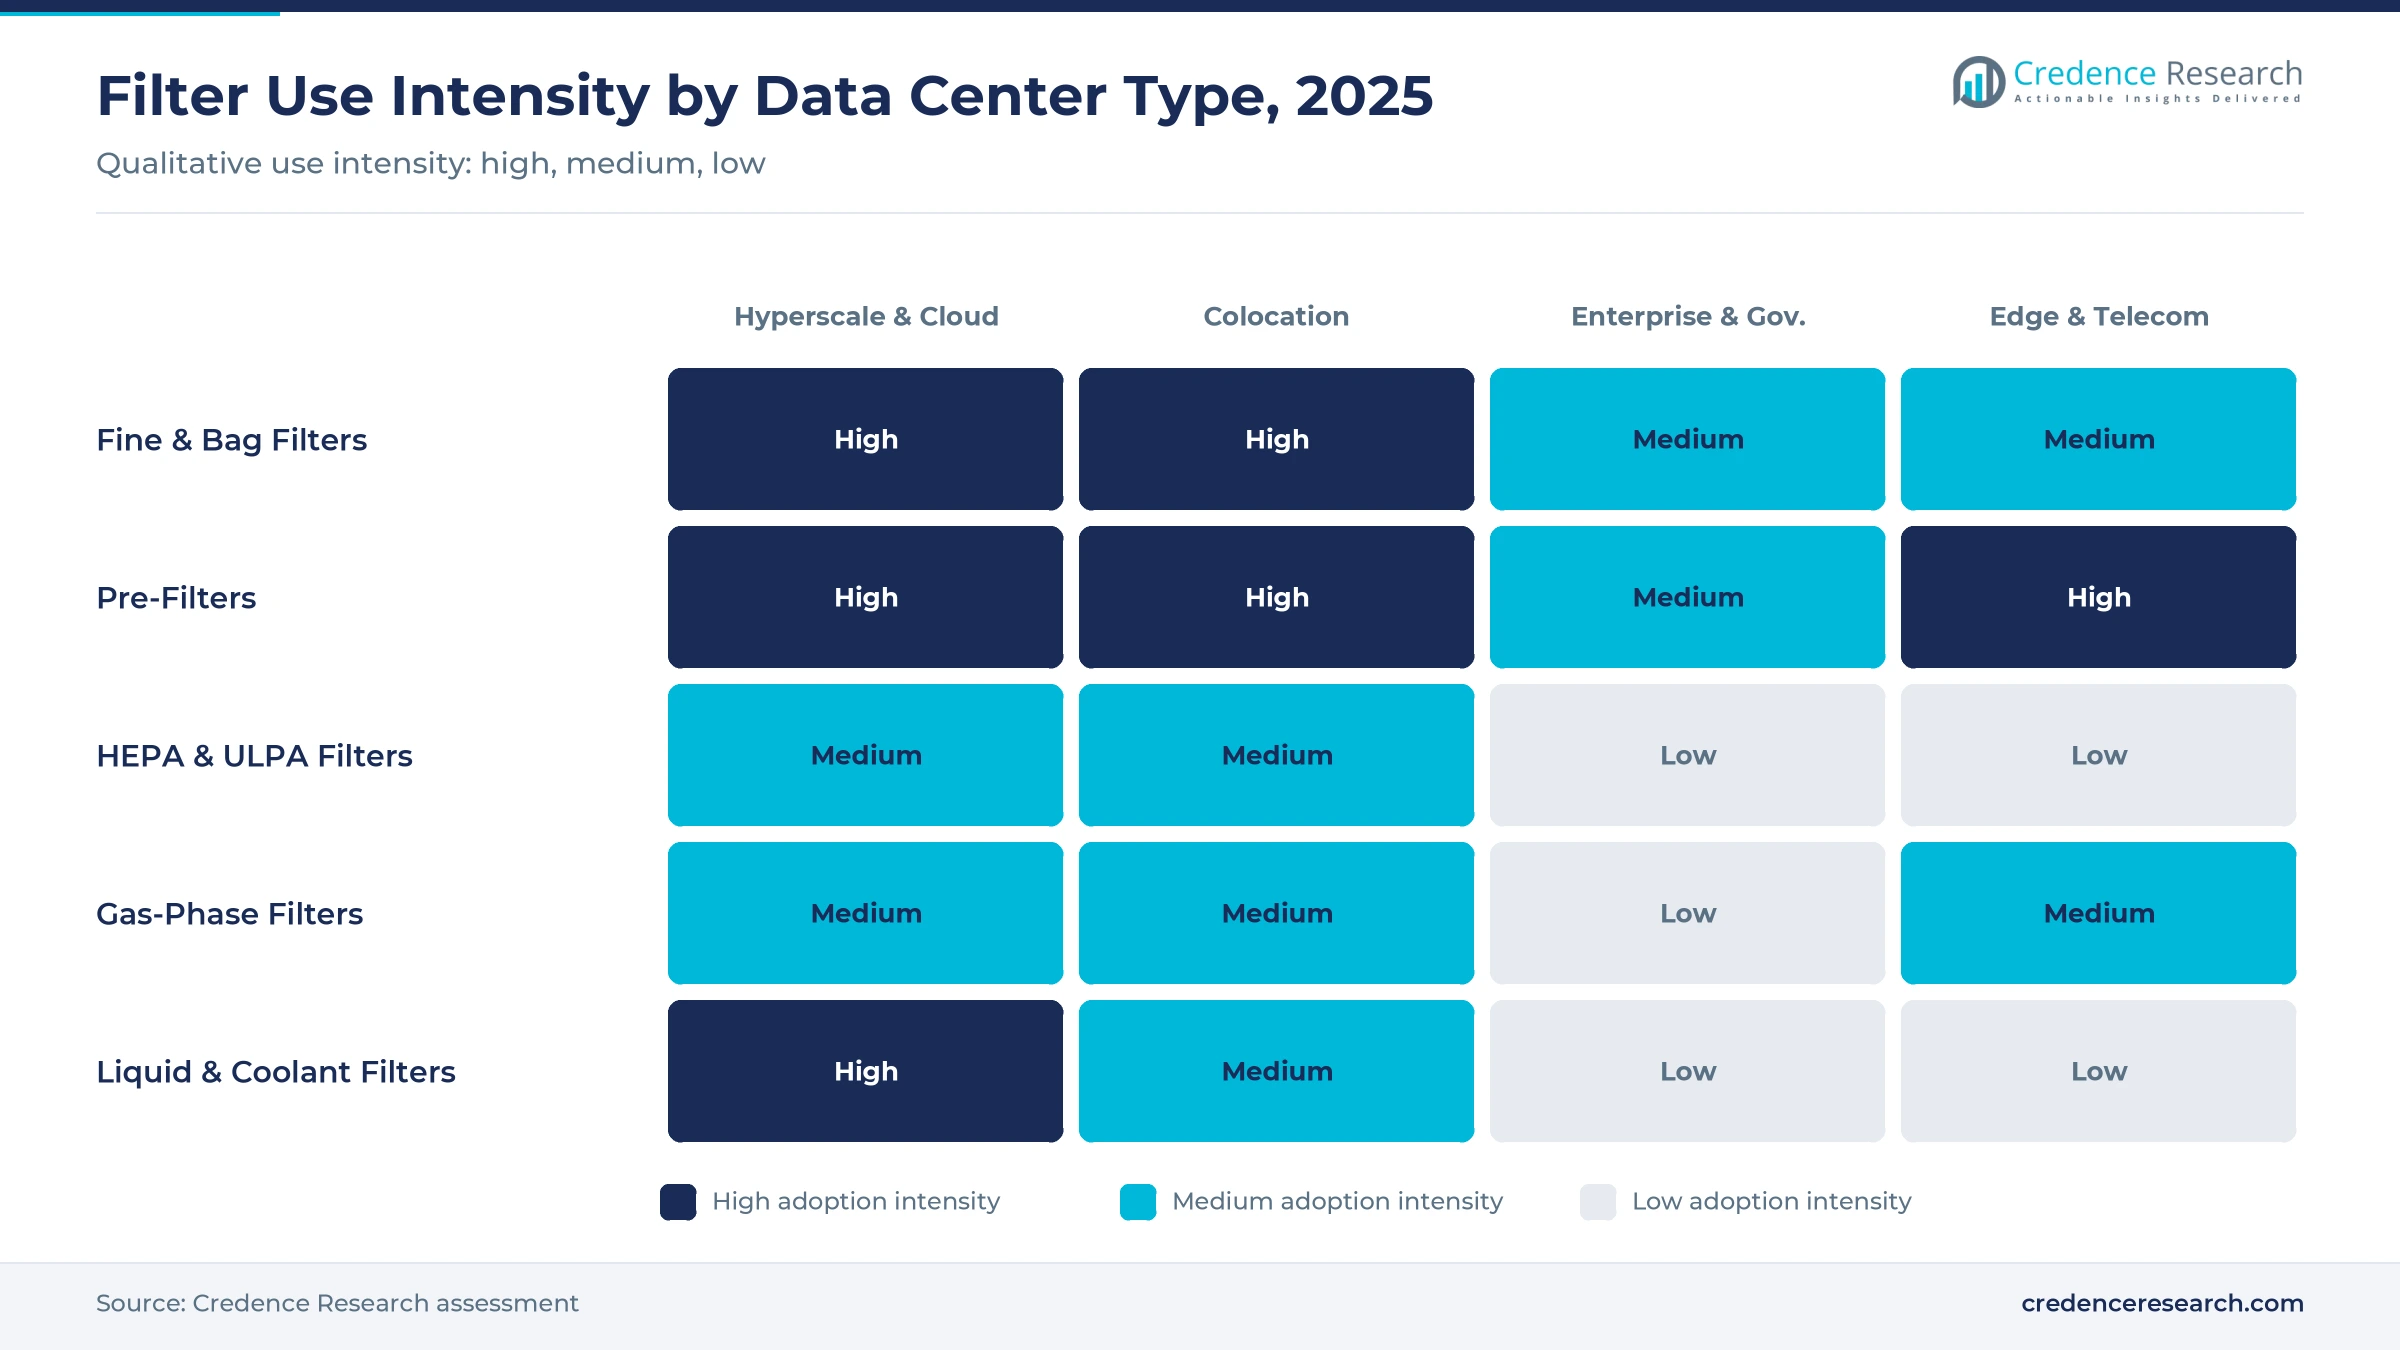
A data hall consumes filters at several points along its air and water paths. Fine and bag filters sit in air handlers and computer room air units, coarse pre-filters protect make-up air intakes, HEPA and ULPA stages serve sensitive rooms and battery areas, and gas-phase media removes corrosive gases near industrial zones and the coast. Liquid and coolant filters protect chilled water, condenser water and direct-to-chip loops. Operators buy through global filter makers, HVAC distributors and the facility management firms that run their sites.
Demand has two parts, a first fill when a hall is commissioned and recurring replacements for the rest of its life. The estimate excludes filter housings, air handling units and cooling equipment, fuel and lube filters for standby generators, and installation labor or maintenance contracts.
Australia Data Center Filters Market Insights
- The Australia data center filters market is projected to expand from USD 60.6 million in 2026 to USD 139.5 million by 2035, a 9.79% CAGR, as data center power use keeps climbing.
- New South Wales held 52.0% of 2025 value, the largest state share, because Western Sydney hosts the biggest hyperscale campuses near subsea cable landings.
- Fine and bag filters rated ePM1 or ePM2.5 accounted for 34.0% of 2025 value, the largest filter type, because every air handler carries a frequently changed fine stage.
- Liquid and coolant filters are the fastest-growing filter type at 15.41% a year through 2035 as AI racks shift to direct-to-chip cooling.
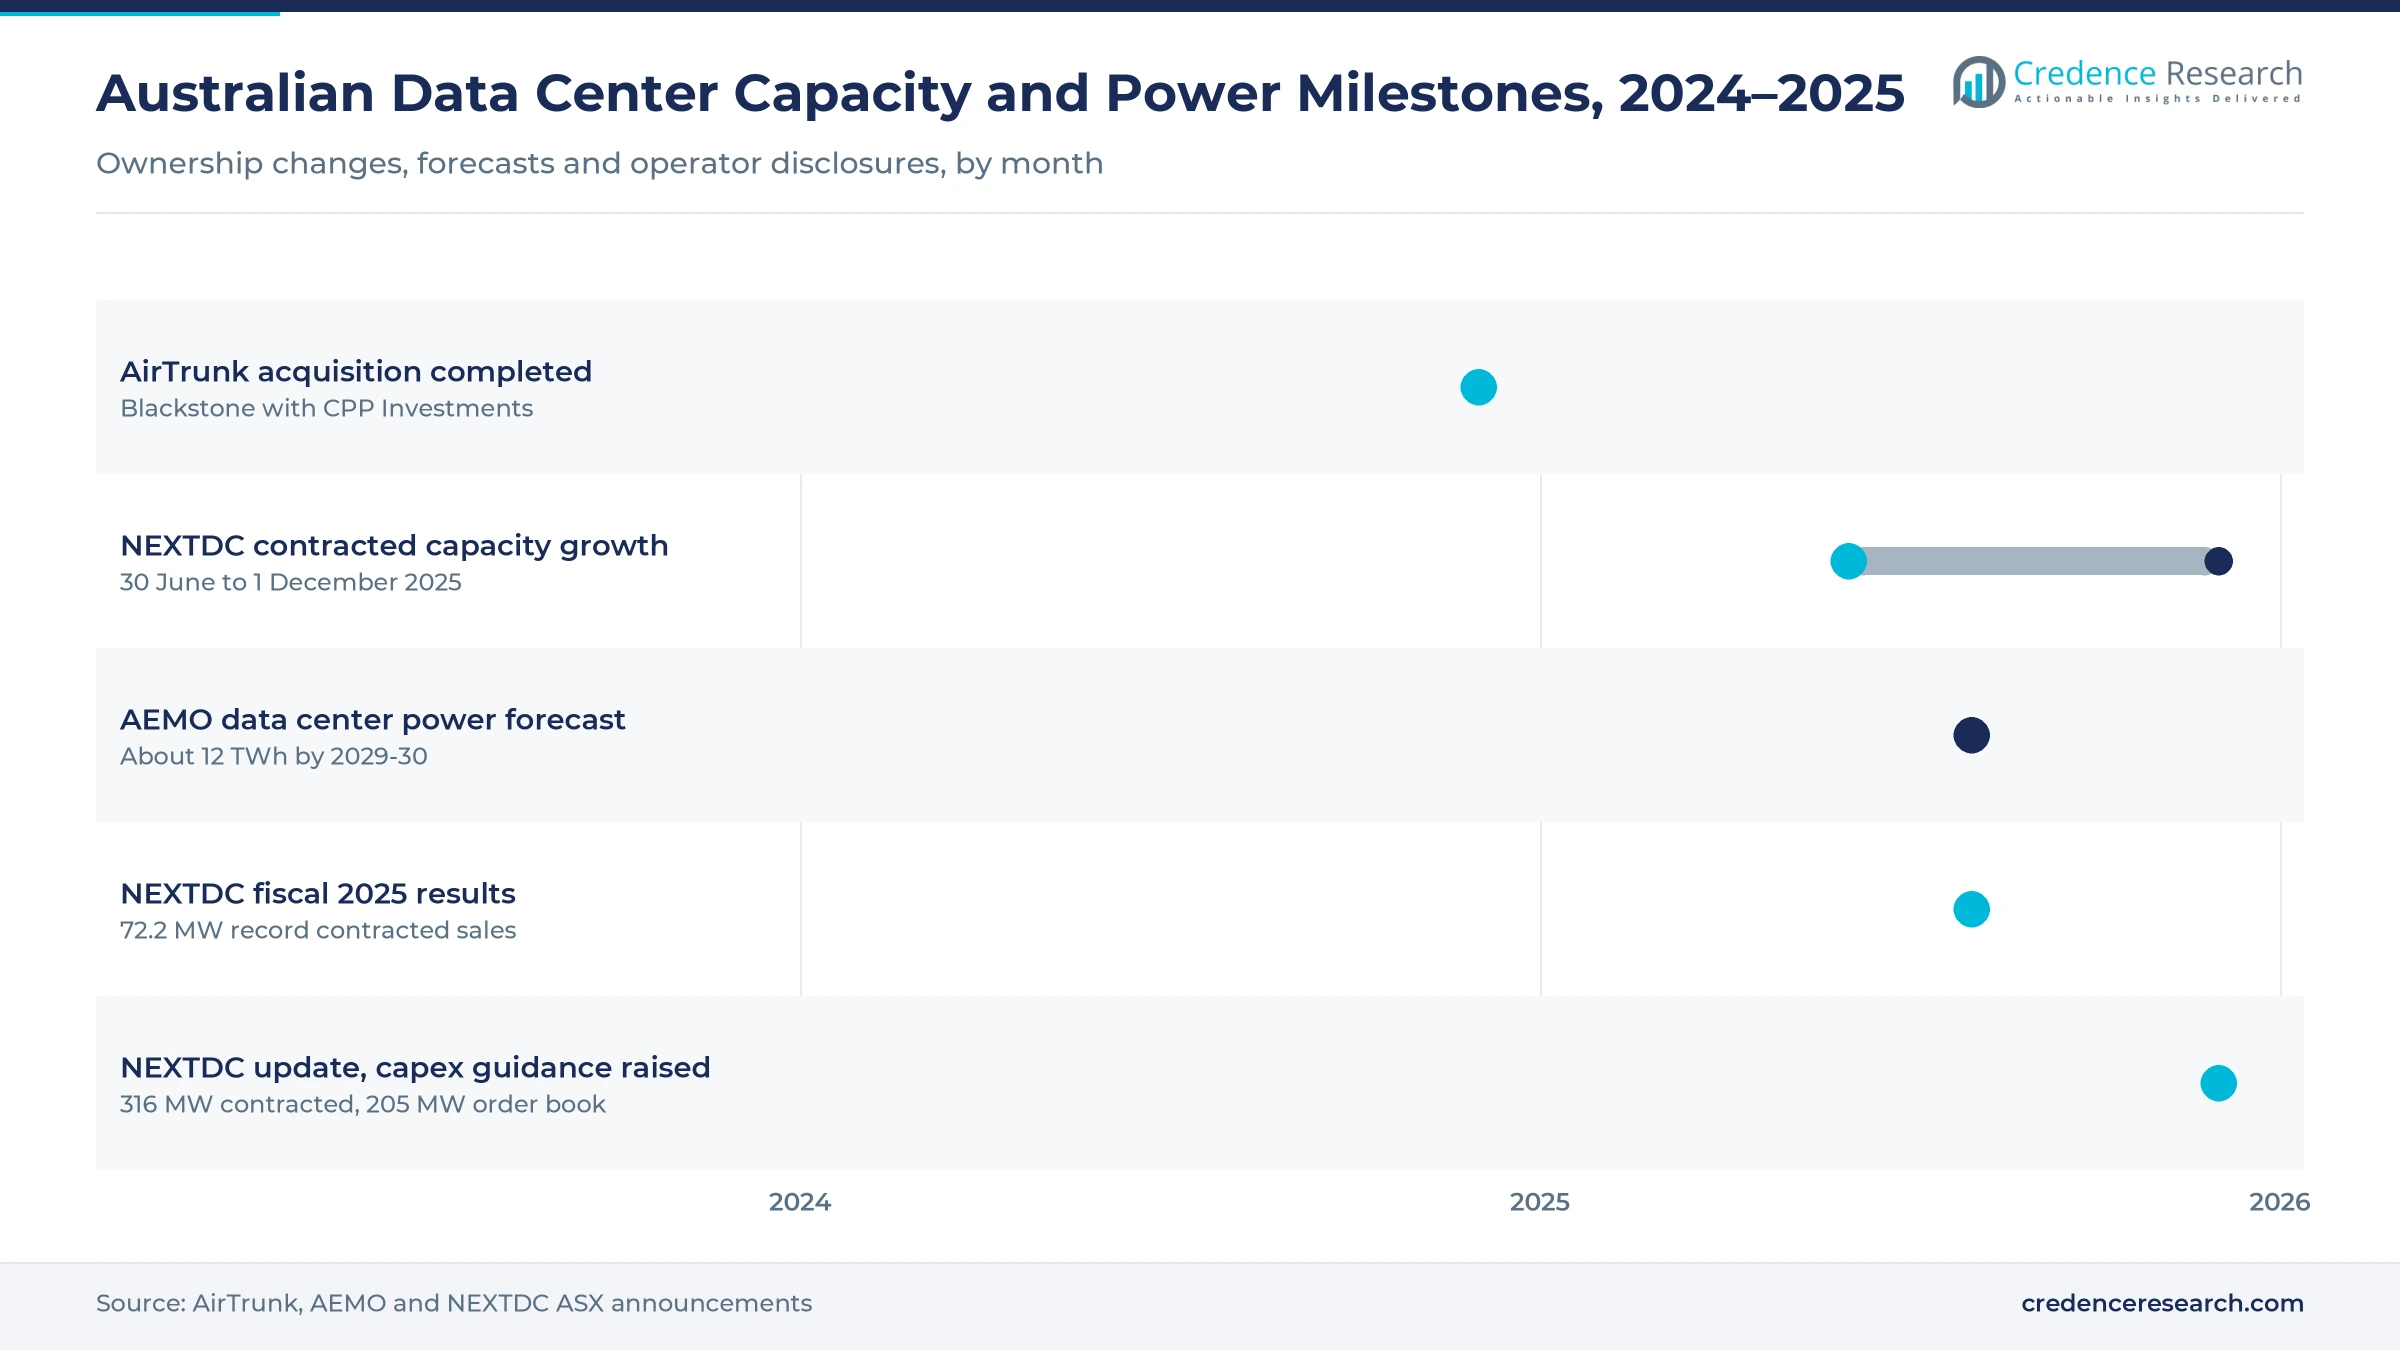
- Blackstone's December 2024 AirTrunk acquisition and NEXTDC's 205 MW forward order book in December 2025 point to sustained investment in halls that need first-fill filters.
Fine ePM1 filters lead while coolant filters add the growth
EPM1 fine filters lead by filter type while coolant filters grow fastest
Based on filter type, the market is categorized into fine and bag filters (ePM1/ePM2.5), coarse pre-filters, HEPA and ULPA filters, gas-phase and chemical filters, and liquid and coolant filters. Fine and bag filters led with 34.0% of 2025 value, because every air handler and computer room air unit carries a fine stage that is changed often. Liquid and coolant filters grow fastest at 15.41% a year as direct-to-chip cooling spreads through AI halls, which favors suppliers of cartridge and strainer filtration.
Hyperscale campuses lead by data center type while edge and telecom sites grow fastest
Based on data center type, the market is categorized into hyperscale and cloud, colocation, enterprise and government, and edge and telecom facilities. Hyperscale and cloud campuses led with 44.0% of 2025 value, since the largest halls run the most air handlers and the highest IT load per site. Edge and telecom sites grow fastest at 11.32% a year as regional towns gain small facilities that need long-life filters suited to sparse on-site staffing.
| Segment Group | Leading Sub-segment | Share, 2025 | Fastest-growing Sub-segment | CAGR, 2025–2035 |
|---|---|---|---|---|
| By Filter Type | Fine & Bag Filters (ePM1/ePM2.5) | 34.0% | Liquid & Coolant Filters | 15.41% |
| By Data Center Type | Hyperscale & Cloud | 44.0% | Edge & Telecom | 11.32% |
Request a Free Sample
Fill in your details and we'll send you a free sample report.
- Sample data tables & charts
- Research methodology
Tripling power use and new campuses lift filter orders
AEMO expects data center electricity use to triple by 2029-30
Data centers used about 4 TWh in FY2025, about 2.2% of grid demand in the National Electricity Market. In August 2025, the Australian Energy Market Operator announced an updated forecast of about 12 TWh by 2029-30, an average rise of 25% a year. Every megawatt of IT load needs air handling with pre-filters and fine filters, so each new hall adds a stream of replacement orders for its whole operating life. The effect is strongest through 2030 in New South Wales and Victoria.
Hyperscale owners with deep capital keep building large halls
Cloud and AI operators build the largest halls, and each new campus buys a full set of filters at first fill before any replacement cycle begins. In December 2024, Blackstone completed its acquisition of AirTrunk together with CPP Investments, as AirTrunk confirmed, and AirTrunk runs hyperscale campuses in Sydney and Melbourne. Such capital-backed owners support a multi-year construction pipeline, which keeps first-fill demand high through the late 2020s.
NEXTDC contracted capacity rose 71 MW in five months
Colocation operators sell space and power to enterprises and cloud tenants, and contracted megawatts translate directly into filter demand. In December 2025, NEXTDC announced through an ASX filing that pro forma contracted utilization had risen by 71 MW to 316 MW since 30 June 2025 and that its forward order book had grown 53% to 205 MW. NEXTDC also raised its fiscal 2026 capital expenditure guidance, which points to more halls entering service and more first-fill orders in the near term.
Bushfire smoke, salt air and ePM1 specifications raise filter use per hall
Many Australian halls use outside air or evaporative cooling for part of the year to save energy, which draws dust, pollen, salt and, in bushfire seasons, heavy smoke into the building and forces early change-outs. Grades are rising too, since ISO 16890-1, introduced by the International Organization for Standardization in December 2016, rates filters by capture of 1, 2.5 and 10 micron particles, and new Australian halls now specify ePM1 fine filters rather than older coarse grades, lifting spending per megawatt over the forecast.
Efficient media and sensor-led change-outs reshape buying
Low-pressure-drop media is emerging as a purchase criterion
Fan power is a large share of cooling energy in an Australian data hall, so operators increasingly choose filters with low pressure drop and longer service life. A filter that resists airflow less cuts fan energy every hour of the year, and a longer life reduces maintenance visits into secure halls. The shift moves tenders from unit price toward life-cycle cost, which favors makers that publish tested energy ratings and can show results from 2 or three seasons on site.
Differential pressure sensors replace calendar change-outs
Operators now fit particle sensors and differential pressure monitors to change filters by condition rather than by the calendar, and to switch air handlers to recirculation when bushfire smoke arrives. The approach reduces wasted filters in clean months and protects equipment in smoke events. It links filtration to airflow management, and it gives suppliers that offer monitoring services a recurring role inside large portfolios across 2 or more states.
Coolant distribution units open a new filtration opportunity
Liquid and coolant filters are the fastest-growing filter type, because AI racks cooled by direct-to-chip liquid need fine filtration in coolant distribution units to protect narrow cold-plate channels from particles and corrosion products. Suppliers of liquid filtration, including Parker Hannifin, Donaldson, MANN+HUMMEL and Pall, can extend industrial cartridge ranges into this niche, but they must qualify products with cooling equipment makers and the operators that specify each loop.
Edge and telecom sites in regional Australia offer an opportunity
Edge and telecom sites are the fastest-growing data center type, and these small facilities in regional towns run with little on-site staff, so they need long-life filters, sealed housings and remote pressure monitoring that flags change-outs before airflow drops. Distributors with national service networks and suppliers that bundle filters with monitoring can win this demand, although each site buys only a small volume and logistics costs are high.
Liquid cooling, tenders and imported media restrain revenue
Direct liquid cooling cuts air handling per megawatt in AI halls
Halls that remove most heat through liquid loops need less air handling per megawatt, which reduces fine and pre-filter volumes in AI halls even as coolant filter demand rises. Air filter makers and distributors that rely on fine and bag filters face slower volume growth per new megawatt. Suppliers mitigate the shift by adding coolant filtration to their ranges and by targeting the air handlers that still serve electrical rooms, battery areas and 1 or more office floors on each campus.
Portfolio tenders and low-cost imports squeeze filter prices
Large operators tender filters across their whole portfolios, and imported standard grades compete hard on price, which compresses margins for distributors and local fabricators. The pressure is strongest in pre-filters and bag filters, where products are easy to compare. Suppliers respond by proving lower life-cycle cost through pressure-drop and energy data and by bundling change-out services.
Restricted hall access stretches replacement intervals
Access to secure data halls is tightly controlled and maintenance windows are short, so some sites stretch replacement intervals beyond the maker's guidance. That delays revenue for filter suppliers and raises the risk of loaded filters during smoke events. Enterprise and government sites, where workloads are moving to the cloud, add the least new demand. Suppliers mitigate the issue by planning change-outs around maintenance windows and by using pressure data to justify each visit.
Imported filter media ties supply to currency and shipping
Most high-grade filter media used in Australia is imported, so supply and pricing follow exchange rates and shipping times. A weaker Australian dollar raises landed costs for operators and distributors, and long lead times can leave sites short of stock when bushfire smoke arrives. Operators hold buffer stock before each summer bushfire season, and suppliers with local fabrication, such as Airepure, or with local warehouses can shorten lead times and protect service levels.
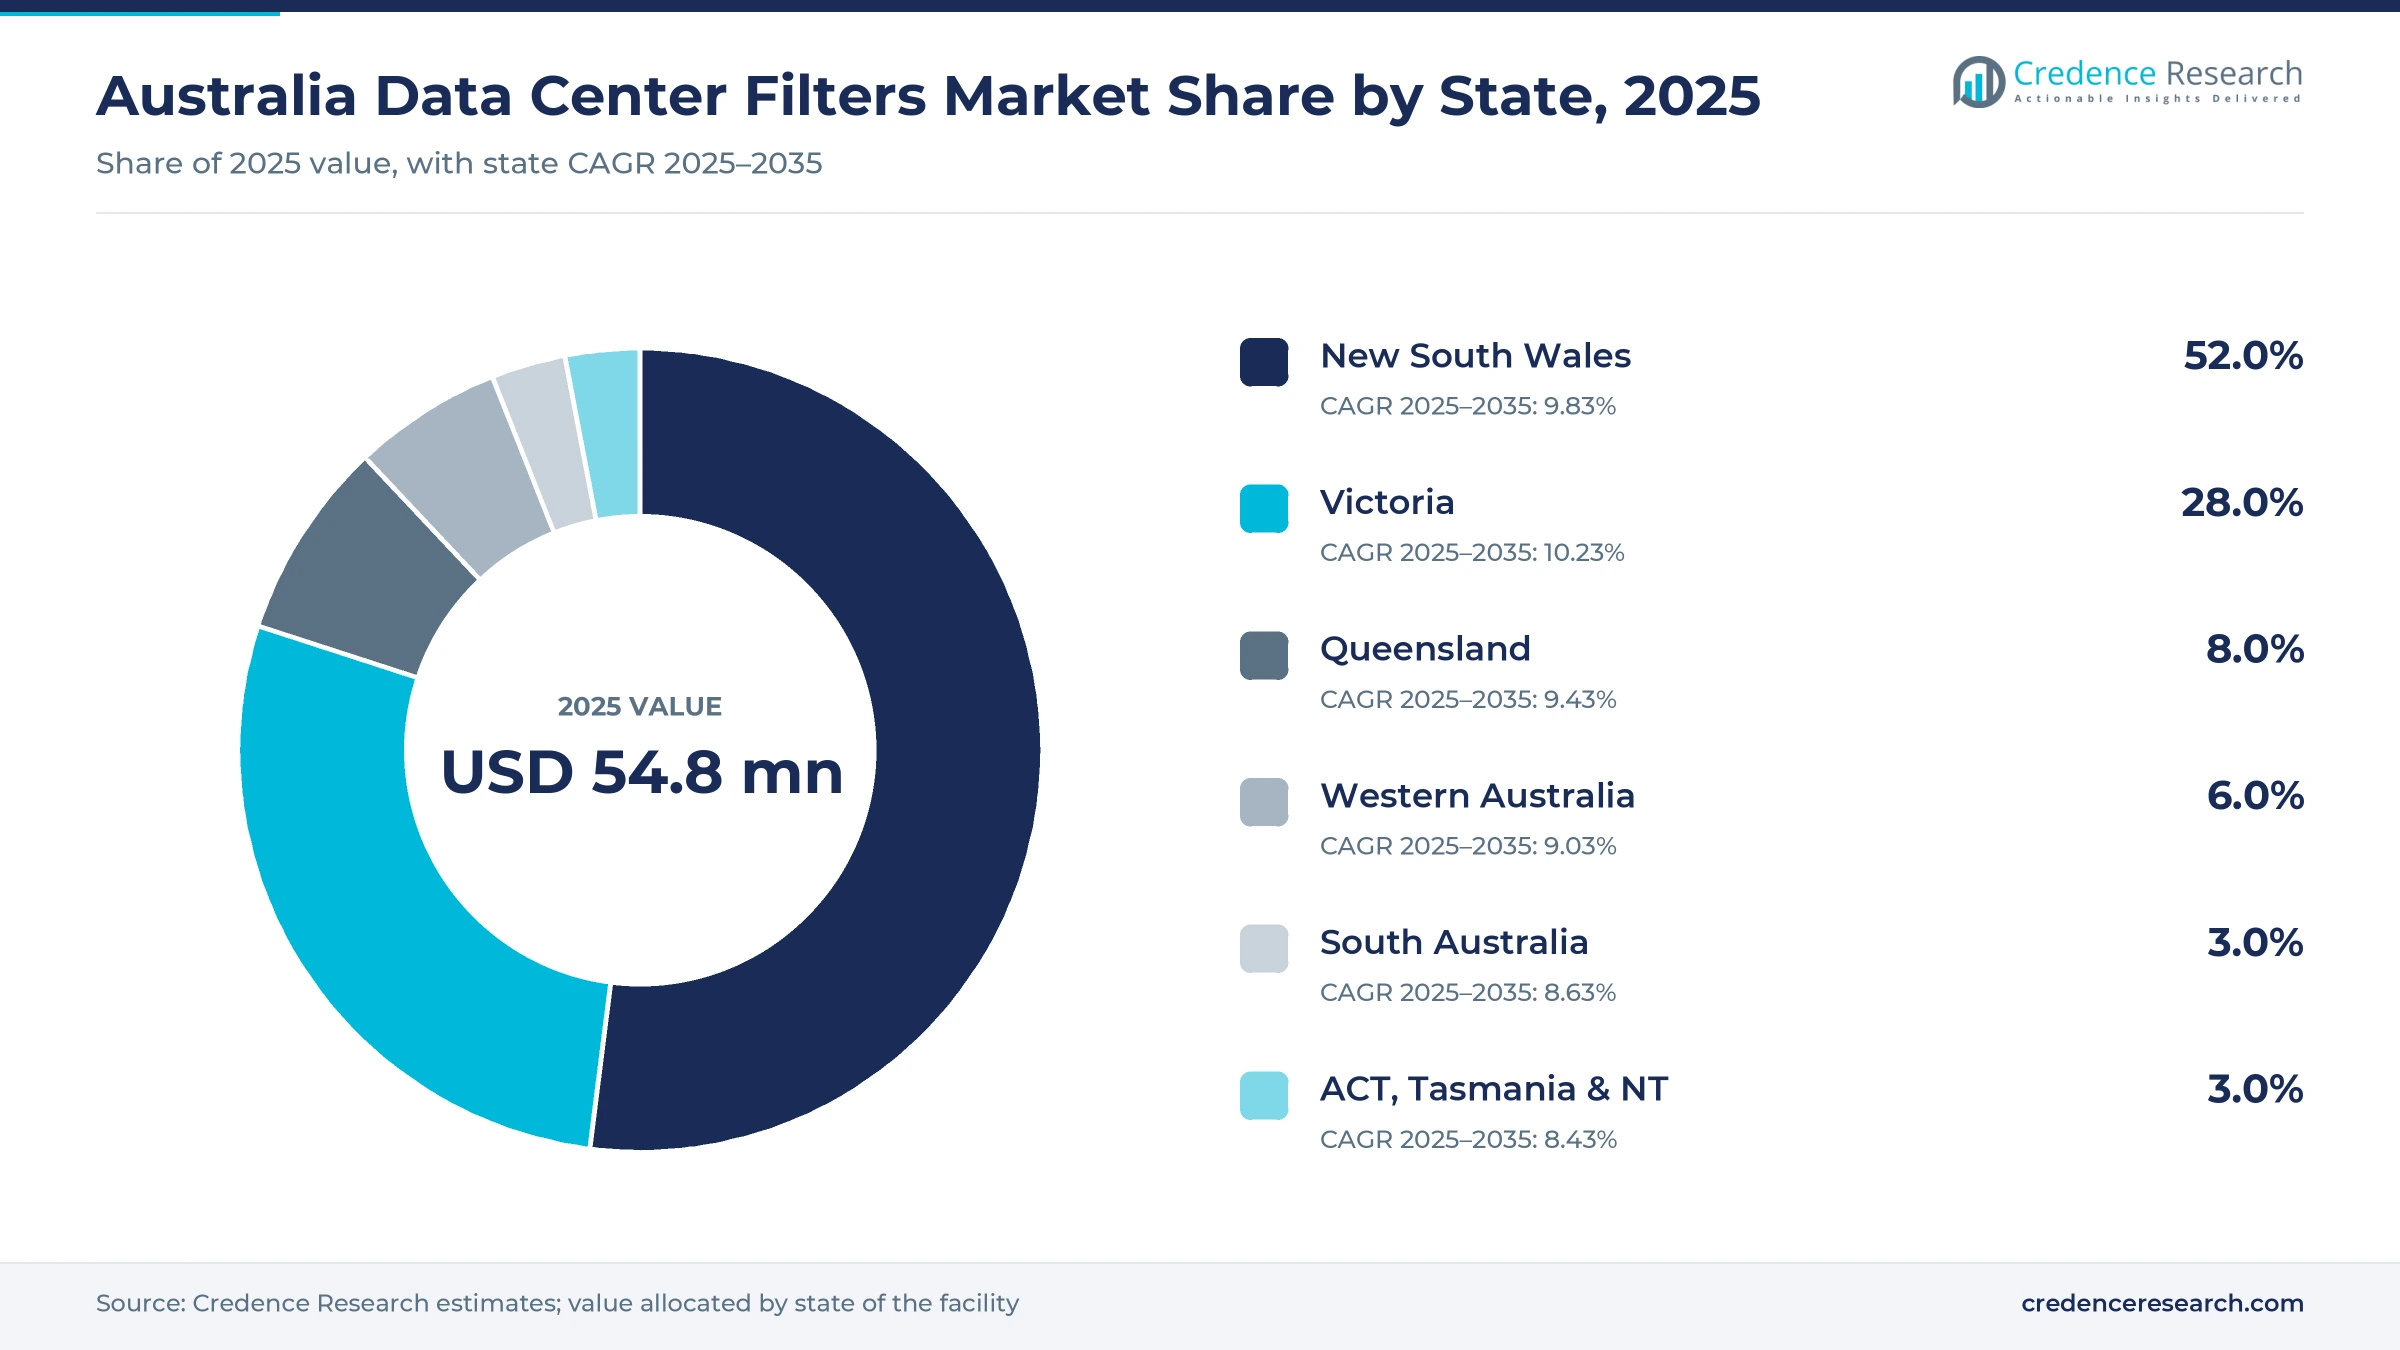
New South Wales leads while Victoria grows fastest
| State | Share, 2025 | CAGR, 2025–2035 |
|---|---|---|
| New South Wales | 52.0% | 9.83% |
| Victoria | 28.0% | 10.23% |
| Queensland | 8.0% | 9.43% |
| Western Australia | 6.0% | 9.03% |
| South Australia | 3.0% | 8.63% |
| ACT, Tasmania & NT | 3.0% | 8.43% |
New South Wales leads on Western Sydney hyperscale campuses
New South Wales held 52.0% of 2025 value and grows at 9.83% a year. Western Sydney hosts the largest hyperscale campuses, close to subsea cable landings and the main cloud regions, and the state hosts AirTrunk's Sydney campuses, part of the business Blackstone acquired in December 2024. As the largest base of installed halls, the state generates most replacement orders, while new campuses add first-fill volumes. Coastal salt air and bushfire smoke keep fine and gas-phase change-outs frequent.
Victoria becomes the fastest-growing state on Melbourne colocation growth
Victoria held 28.0% of 2025 value and is the fastest-growing state at 10.23% a year. Large colocation and hyperscale campuses sit in Melbourne's west and north, and both NEXTDC and AirTrunk operate in the city. NEXTDC's 53% rise in its forward order book to 205 MW during the second half of 2025 covers its national portfolio, including Melbourne. New halls in the state add first-fill orders before the replacement cycle begins, which lifts growth above the national 9.79%.
Queensland draws steady demand from Brisbane capacity and a warmer climate
Queensland held 8.0% of 2025 value and grows at 9.43% a year, with most capacity in Brisbane. A warmer, more humid climate means more cooling hours, which raises air handler run time and filter loading per megawatt compared with southern hubs. Growth depends on new colocation and cloud capacity outside Sydney and Melbourne, and on edge sites that serve regional towns across the state's large area, where long-life filters cut costly service trips.
Western Australia, South Australia and the territories run smaller hubs serving mining and government
Western Australia held 6.0% of 2025 value and grows at 9.03% a year, serving Perth and the mining sector. South Australia held 3.0% and grows at 8.63% a year. The ACT, Tasmania and the Northern Territory together held 3.0% and grow at 8.43% a year.
An AirTrunk takeover and AEMO forecast mark 2024–2025
| Development | Status and market relevance |
|---|---|
| In December 2025, NEXTDC announced that pro forma contracted utilization had risen by 71 MW to 316 MW and its forward order book by 53% to 205 MW since 30 June 2025, and raised fiscal 2026 capex guidance. | Announced. More colocation halls mean more first-fill and replacement filters. |
| In August 2025, NEXTDC announced fiscal 2025 results with record contracted sales of 72.2 MW and contracted utilization of 244.8 MW at 30 June 2025. | Reported. Confirms strong colocation demand in Sydney and Melbourne. |
| In August 2025, AEMO announced that data centers used about 4 TWh in FY2025 and forecast about 12 TWh by 2029-30. | Published. Sets the power path that drives filter replacement demand. |
| In December 2024, AirTrunk announced the completion of its acquisition by Blackstone, with CPP Investments. | Completed. Backs further hyperscale campus construction in Sydney and Melbourne. |
Coolant filtration and pressure sensing lead the technology
- Coolant filtration with fine cartridge and strainer filters in coolant distribution units protects direct-to-chip cold plates, the fastest-growing filter use.
- Pressure-drop sensing with differential pressure and particle sensors lets operators change filters by condition and switch to recirculation during smoke events.
- Low-resistance media made from synthetic and nanofiber materials rated under ISO 16890 reach ePM1 efficiency with lower airflow resistance, cutting fan energy.
- Gas-phase media in chemical media beds remove corrosive gases near coasts and industrial zones, protecting server boards and switching gear from corrosion where outside air is used for cooling.
Need a Custom Version of This Report?
Tailor the scope, geography, or segments to your exact requirements.
- Custom geography or segment scope
- Direct access to our analyst team
Global filter makers and liquid specialists vie for halls
Australian data centers buy filters from global makers, through HVAC distributors and through the facility management contractors that run their sites, and three groups compete. Global air filter makers, including Camfil, AAF International, part of Daikin and Freudenberg Filtration Technologies, supply fine, bag and HEPA filters for data halls from local plants or warehouses. Purafil and Camfil, in turn, supply gas-phase media for corrosive environments. Parker Hannifin, Donaldson, MANN+HUMMEL and Pall offer liquid and coolant filtration of the type used in cooling loops, although their Australian data center supply is not confirmed. Local fabricators and distributors such as Airepure compete on standard grades, fast delivery and service. Operators want proof of energy savings and uptime, so suppliers that test filters on site and plan change-outs around maintenance windows win portfolio contracts. No supplier publishes Australian data center filter sales, so no share ranking is given.
Filter suppliers serving Australian data halls and their roles
| Company | Type | Role in the market |
|---|---|---|
| Camfil | Global air filter maker | Fine, bag, HEPA and gas-phase filters for data halls |
| AAF International | Global air filter maker (Daikin group) | Fine, bag and HEPA filters for air handlers |
| Freudenberg Filtration Technologies | Global air filter maker | Fine, bag and HEPA filters for data halls |
| Airepure | Local fabricator and distributor | Locally made and imported filters for Australian facilities |
| Purafil | Gas-phase specialist | Gas-phase media for corrosive environments |
| Parker Hannifin | Liquid filtration supplier | Liquid and coolant filtration; Australian data center supply not confirmed |
| Donaldson | Liquid filtration supplier | Liquid and coolant filtration; Australian data center supply not confirmed |
| MANN+HUMMEL | Liquid filtration supplier | Liquid and coolant filtration; Australian data center supply not confirmed |
| Pall | Liquid filtration supplier | Liquid and coolant filtration; Australian data center supply not confirmed |
Filter spending follows megawatts, not floor space
Credence Research's view is that Australian filter spending follows megawatts of IT load, not floor space, and that the power path published by AEMO sets the market's direction through 2035. The largest new revenue lies in coolant filtration for AI halls and in long-life filters for edge sites, while fine filters remain the volume base. Suppliers that combine local stock, energy-rated media and condition monitoring are best placed. The main risk is that liquid cooling cuts air filter volume per megawatt faster than expected. Buyers should watch operator capacity disclosures and AEMO's forecast updates.
Power forecasts and replacement cycles behind the estimate
The report uses 2025 as the base year and forecasts to 2035, with CAGR calculated over 2025–2035. Market values come from Credence Research's market model, built from data center electricity use, operator capacity disclosures and filter replacement cycles per megawatt; segment and state splits are Credence Research estimates. Supporting evidence comes from AEMO forecasts, ASX company announcements, ISO standards information and company websites. Operators do not disclose their filter spending, which limits precision.
Coolant loops and edge sites lift filter demand through 2035
Through 2035, Australian filter demand will rise with data center power, led by hyperscale and colocation campuses in Sydney and Melbourne. Coolant filtration will grow from a small base into a standard line item for AI halls, while fine ePM1 filters remain the largest category. Condition monitoring will change how often filters are replaced, and edge sites will need long-life products. The pace will depend on how quickly operators commission new halls and on how far liquid cooling reduces air handling per megawatt.
Frequently Asked Questions
What was the size of the Australia data center filters market in 2025?
What is the forecast value and CAGR of the Australia data center filters market?
What is driving data center filter demand in Australia?
Which state holds the largest share of the Australia data center filters market?
Which filter type leads the market?
Who are the major companies in the Australia data center filters market?
Which data center type buys the most filters?
What challenges could slow the Australia data center filters market?
Table of Content
Chapter 1 Market Segmentation
- 1.1 Segmentation Framework
- 1.1.1 Product and Service Classification
- 1.1.2 Application and End-Use Classification
- 1.1.3 Technology and Solution Classification
- 1.1.4 Customer and Distribution Channel Classification
- 1.1.5 Geographic Segmentation
- 1.1.6 Market Segment Definitions and Boundaries
- 1.2 By Filter Type
- 1.2.1 Fine & Bag Filters (ePM1/ePM2.5)
- 1.2.2 Pre-Filters (Coarse)
- 1.2.3 HEPA & ULPA Filters
- 1.2.4 Gas-Phase & Chemical Filters
- 1.2.5 Liquid & Coolant Filters
- 1.3 By Data Center Type
- 1.3.1 Hyperscale & Cloud
- 1.3.2 Colocation
- 1.3.3 Enterprise & Government
- 1.3.4 Edge & Telecom
- 1.4 By State
- 1.4.1 New South Wales
- 1.4.2 Victoria
- 1.4.3 Queensland
- 1.4.4 Western Australia
- 1.4.5 South Australia
- 1.4.6 ACT, Tasmania & NT
Chapter 2 Introduction
- 2.1 Report Objectives and Scope
- 2.2 Product Definition and Industry Terminology
- 2.3 Market Inclusions and Exclusions
- 2.4 Research Process
- 2.4.1 Primary Research and Expert Interviews
- 2.4.2 Secondary Research and Source Review
- 2.4.3 Top-Down and Bottom-Up Estimation
- 2.4.4 Data Triangulation and Verification
- 2.5 Market Size Measurement Basis
- 2.5.1 2025: USD 54.8 million → 2035: USD 139.5 million
- 2.6 Historical and Forecast Reference Periods
- 2.6.1 Historical Period: 2018-2025
- 2.6.2 Base Year: 2025
- 2.6.3 Forecast Period: 2025-2035
- 2.7 Research Assumptions and Limitations
Chapter 3 Executive Summary
- 3.1 Market Snapshot and Key Findings
- 3.2 Base-Year Market Size, 2025
- 3.3 Forecast Market Size, 2035
- 3.4 Revenue and Volume Growth Outlook
- 3.5 Key Demand and Supply Indicators
- 3.6 Leading Market Segments
- 3.7 Fastest-Growing Market Opportunities
- 3.8 Regional Performance Highlights
- 3.9 Technology and Industry Transformation
- 3.10 Competitive Landscape Summary
- 3.11 Analyst View and Strategic Implications
Chapter 4 Australia Data Center Filters Market Trends and Developments
- 4.1 Historical Industry Development, 2018-2025
- 4.2 Recent Market Trends and Developments
- 4.3 Demand and Customer Behavior Trends
- 4.4 Technology and Product Innovation
- 4.5 Artificial Intelligence, Automation and Digitalization
- 4.6 Local Manufacturing and Supply Chain Realignment
- 4.7 Industry Partnerships, Mergers and Acquisitions
- 4.8 Sustainability and Circular Economy Developments
- 4.9 Government and Private Sector Investment Trends
- 4.10 Emerging Business Models and Commercialization
- 4.11 Industry Developments and Announcements
Chapter 5 Australia Data Center Filters Market Production, Supply and Demand Analysis
- 5.1 Demand Trend and Consumption Analysis, 2018-2025
- 5.2 Demand Forecast, 2025-2035
- 5.3 Production and Output Trend, 2018-2025
- 5.4 Production and Output Forecast, 2025-2035
- 5.5 Installed Capacity and Capacity Utilization
- 5.6 Company-Wise Production Plants and Statistics
- 5.6.1 Installed Production Capacity
- 5.6.2 Actual Production
- 5.6.3 Planned Capacity and Expansion Targets
- 5.7 Supply Chain Structure and Procurement Trends
- 5.8 Supply-Demand Gap and Bottlenecks
- 5.9 Import Dependence and Sourcing Structure
- 5.10 Contract Manufacturing and Outsourcing
- 5.11 Regional Supply and Demand Concentration
Chapter 6 Australia Data Center Filters Market Pricing Analysis
- 6.1 Pricing Structure and Measurement
- 6.2 Historical Pricing Trends, 2018-2025
- 6.3 Pricing Outlook, 2025-2035
- 6.4 Average Selling Price and Unit Economics
- 6.5 Pricing by Product and Market Segment
- 6.6 Geographic Pricing Differences
- 6.7 Key Input, Energy, Labor and Logistics Costs
- 6.8 Contract Pricing and Purchasing Models
- 6.9 Pricing Sensitivity and Competitive Positioning
- 6.10 Price, Margin and Profitability Implications
Chapter 7 Australia Data Center Filters Market Dynamics
- 7.1 Market Growth Drivers
- 7.1.1 Demand-Side Drivers
- 7.1.2 Technology and Innovation Drivers
- 7.1.3 Infrastructure and Investment Drivers
- 7.1.4 Regulatory and Policy Drivers
- 7.2 Market Restraints
- 7.2.1 Cost and Affordability Constraints
- 7.2.2 Technology and Adoption Barriers
- 7.2.3 Supply Chain and Operational Constraints
- 7.3 Market Challenges
- 7.3.1 Competitive Pressure and Margin Erosion
- 7.3.2 Skills, Infrastructure and Implementation Gaps
- 7.4 Emerging Market Opportunities
- 7.5 Market Dynamics Impact and Time-Horizon Assessment
Chapter 8 Australia Data Center Filters Value Chain Analysis
- 8.1 Industry Value Chain Overview
- 8.2 Upstream Suppliers and Critical Inputs
- 8.3 Technology and Component Providers
- 8.4 Manufacturing or Service Delivery
- 8.5 Distribution, Channel Partners and Integrators
- 8.6 Downstream Applications and End Users
- 8.7 Value Addition and Profit Pools
- 8.8 Vertical Integration and Outsourcing
- 8.9 Supplier Concentration and Risk
- 8.10 Supply Chain Localization and Resilience
Chapter 9 Australia Data Center Filters Market Regulations and Policies
- 9.1 Relevant Laws, Standards and Compliance Frameworks
- 9.2 Product, Service, Safety and Quality Requirements
- 9.3 Government Policies, Incentives and Subsidies
- 9.4 Imports, Exports and Trade Barriers
- 9.5 Public Procurement and Local Content Requirements
- 9.6 Environmental and Sustainability Compliance
- 9.7 Data Protection, AI and Cybersecurity Compliance
- 9.8 Upcoming Policy Changes and Market Implications
Chapter 10 Australia Data Center Filters Market Hotspots and Opportunities
- 10.1 Market Opportunity Mapping and Growth Hotspots
- 10.2 High-Growth Applications and Customer Groups
- 10.3 Underserved Markets and White-Space Opportunities
- 10.4 Emerging Technology and Product Opportunities
- 10.5 New Capacity and Investment Hotspots
- 10.6 Market Entry and Expansion Opportunities
- 10.7 Distribution and Partnership Opportunities
- 10.8 Near-Term and Long-Term Commercial Potential
- 10.9 Opportunity Attractiveness and Execution Risks
Chapter 11 Australia Data Center Filters Market Outlook, 2025-2035
- 11.1 Market Size and Analysis
- 11.1.1 Revenue (Market Measurement: 2025: USD 54.8 million → 2035: USD 139.5 million)
- 11.1.2 Market Volume and Quantity Sold
- 11.1.3 Historical Market Size, 2018-2025
- 11.1.4 Base-Year Market Size, 2025
- 11.2 Market Forecast, 2025-2035
- 11.2.1 Revenue Forecast to 2035
- 11.2.2 Volume Forecast to 2035
- 11.2.3 CAGR and Year-on-Year Growth
- 11.2.4 Incremental Revenue Opportunity
- 11.3 Forecast Assumptions and Scenario Analysis
- 11.3.1 Base-Case Forecast
- 11.3.2 Optimistic and Conservative Scenarios
- 11.3.3 Technology, Pricing and Policy Sensitivities
- 11.4 Market Attractiveness and Growth Outlook
Chapter 12 Australia Data Center Filters Market Segmentation and Outlook
- 12.1 Segmentation Summary and Market Shares, 2025
- 12.2 Largest and Fastest-Growing Segments
- 12.3 By Filter Type - Market Size and Forecast, 2025-2035
- 12.3.1 Segment Definition and Scope
- 12.3.2 Historical Market Size, 2018-2025
- 12.3.3 Revenue Forecast, 2025-2035
- 12.3.4 Volume Forecast, 2025-2035
- 12.3.5 Base-Year Market Share, 2025
- 12.3.6 Segment CAGR and Growth Drivers
- 12.3.7 Subsegment Market Size and Forecast
- 12.3.7.1 Fine & Bag Filters (ePM1/ePM2.5)
- 12.3.7.2 Pre-Filters (Coarse)
- 12.3.7.3 HEPA & ULPA Filters
- 12.3.7.4 Gas-Phase & Chemical Filters
- 12.3.7.5 Liquid & Coolant Filters
- 12.3.8 Subsegment Pricing and Adoption Trends
- 12.3.9 Leading Suppliers and Competition
- 12.3.10 Regional Demand and Opportunities
- 12.4 By Data Center Type - Market Size and Forecast, 2025-2035
- 12.4.1 Segment Definition and Scope
- 12.4.2 Historical Market Size, 2018-2025
- 12.4.3 Revenue Forecast, 2025-2035
- 12.4.4 Volume Forecast, 2025-2035
- 12.4.5 Base-Year Market Share, 2025
- 12.4.6 Segment CAGR and Growth Drivers
- 12.4.7 Subsegment Market Size and Forecast
- 12.4.7.1 Hyperscale & Cloud
- 12.4.7.2 Colocation
- 12.4.7.3 Enterprise & Government
- 12.4.7.4 Edge & Telecom
- 12.4.8 Subsegment Pricing and Adoption Trends
- 12.4.9 Leading Suppliers and Competition
- 12.4.10 Regional Demand and Opportunities
- 12.5 By State - Market Size and Forecast, 2025-2035
- 12.5.1 Segment Definition and Scope
- 12.5.2 Historical Market Size, 2018-2025
- 12.5.3 Revenue Forecast, 2025-2035
- 12.5.4 Volume Forecast, 2025-2035
- 12.5.5 Base-Year Market Share, 2025
- 12.5.6 Segment CAGR and Growth Drivers
- 12.5.7 Subsegment Market Size and Forecast
- 12.5.7.1 New South Wales
- 12.5.7.2 Victoria
- 12.5.7.3 Queensland
- 12.5.7.4 Western Australia
- 12.5.7.5 South Australia
- 12.5.7.6 ACT, Tasmania & NT
- 12.5.8 Subsegment Pricing and Adoption Trends
- 12.5.9 Leading Suppliers and Competition
- 12.5.10 Regional Demand and Opportunities
- 12.6 Segment Growth Comparison
- 12.7 Segment Attractiveness and Priority Matrix
Chapter 13 Australia Data Center Filters Geographic Market Outlook, 2025-2035
- 13.1 Domestic Market Distribution and Demand Clusters
- 13.2 State- or Province-Wise Market Size and Forecast, 2025-2035
- 13.3 City and Metropolitan Market Outlook
- 13.4 Industrial, Manufacturing and Commercial Clusters
- 13.5 Geographic Concentration of Key End Users
- 13.6 Local Pricing and Purchasing Differences
- 13.7 Domestic Production Facilities and Capacity Map
- 13.8 Local Infrastructure and Project Pipeline
- 13.9 State-Level Policy and Incentive Differences
- 13.10 Subnational Investment Hotspots and Opportunities
- 13.11 Distribution and Logistics Networks
- 13.12 Domestic Competitive Footprint
Chapter 14 Australia Data Center Filters Technology, Innovation and Sustainability Outlook
- 14.1 Technology Landscape and Maturity
- 14.2 Product, Process and Service Innovation
- 14.3 AI, Automation and Digital Tools in the Industry
- 14.4 Technology Adoption and Performance Benchmarking
- 14.5 Innovation Pipeline and R&D Investment
- 14.6 Patent and Intellectual Property Trends
- 14.7 Energy Efficiency and Resource Management
- 14.8 Sustainability, Recycling and Circularity
- 14.9 Technology Roadmap, 2025-2035
- 14.10 Risks of Obsolescence and Technology Substitution
Chapter 15 Australia Data Center Filters Market Key Strategic Imperatives
- 15.1 Growth and Market Entry Priorities
- 15.2 High-Return Products and Segments
- 15.3 Pricing, Profitability and Cost Optimization
- 15.4 Technology Investment and Product Differentiation
- 15.5 Supply Chain Localization and Resilience
- 15.6 Distribution and Customer Acquisition
- 15.7 Partnership, Acquisition and Capacity Strategy
- 15.8 Regional Expansion Priorities
- 15.9 Short-, Medium- and Long-Term Actions
Chapter 16 Competition Outlook
- 16.1 Industry Competition Characteristics
- 16.2 Market Structure and Concentration
- 16.3 Market Share and Competitive Positioning, 2025
- 16.4 Company-Wise Revenue and Product Benchmarking
- 16.5 Production and Service Capacity Benchmarking
- 16.6 Technology, Pricing and Differentiation
- 16.7 Regional Footprint and Distribution Strength
- 16.8 Mergers, Acquisitions and Strategic Alliances
- 16.9 New Entrants and Competitive Threats
- 16.10 Porter's Five Forces and Industry Attractiveness
- 16.11 Competitive Outlook, 2025-2035
Chapter 17 Company Profiles
- 17.1 Company Coverage and Selection Criteria
- 17.2 Camfil
- 17.2.1 Business Description
- 17.2.2 Company Ownership and Geographic Presence
- 17.2.3 Product and Service Portfolio
- 17.2.4 Manufacturing and Operating Footprint
- 17.2.5 Production Capacity and Expansion Plans
- 17.2.6 Financial Performance and Investment
- 17.2.7 Market Share and Competitive Position
- 17.2.8 Technology and Innovation Capabilities
- 17.2.9 Strategic Alliances or Partnerships
- 17.2.10 Recent Developments
- 17.2.11 Growth Strategy and Outlook
- 17.3 AAF International
- 17.4 Freudenberg Filtration Technologies
- 17.5 Airepure
- 17.6 Purafil
- 17.7 Parker Hannifin
- 17.8 Donaldson
- 17.9 MANN+HUMMEL
- 17.10 Pall
- 17.11 Other Relevant Market Participants
Note: Every listed company is profiled on the structure shown under the first company. The company list is preliminary and may change based on research findings, market developments, data availability and client requirements.
Chapter 18 Disclaimer
- 18.1 Research and Forecast Disclaimer
- 18.2 Data Source and Estimation Limitations
Note: The depth of individual sections depends on data availability for this market. Volume, capacity, trade and other unit-based metrics are included where applicable.

