
Creators and online stores drive made-to-order goods
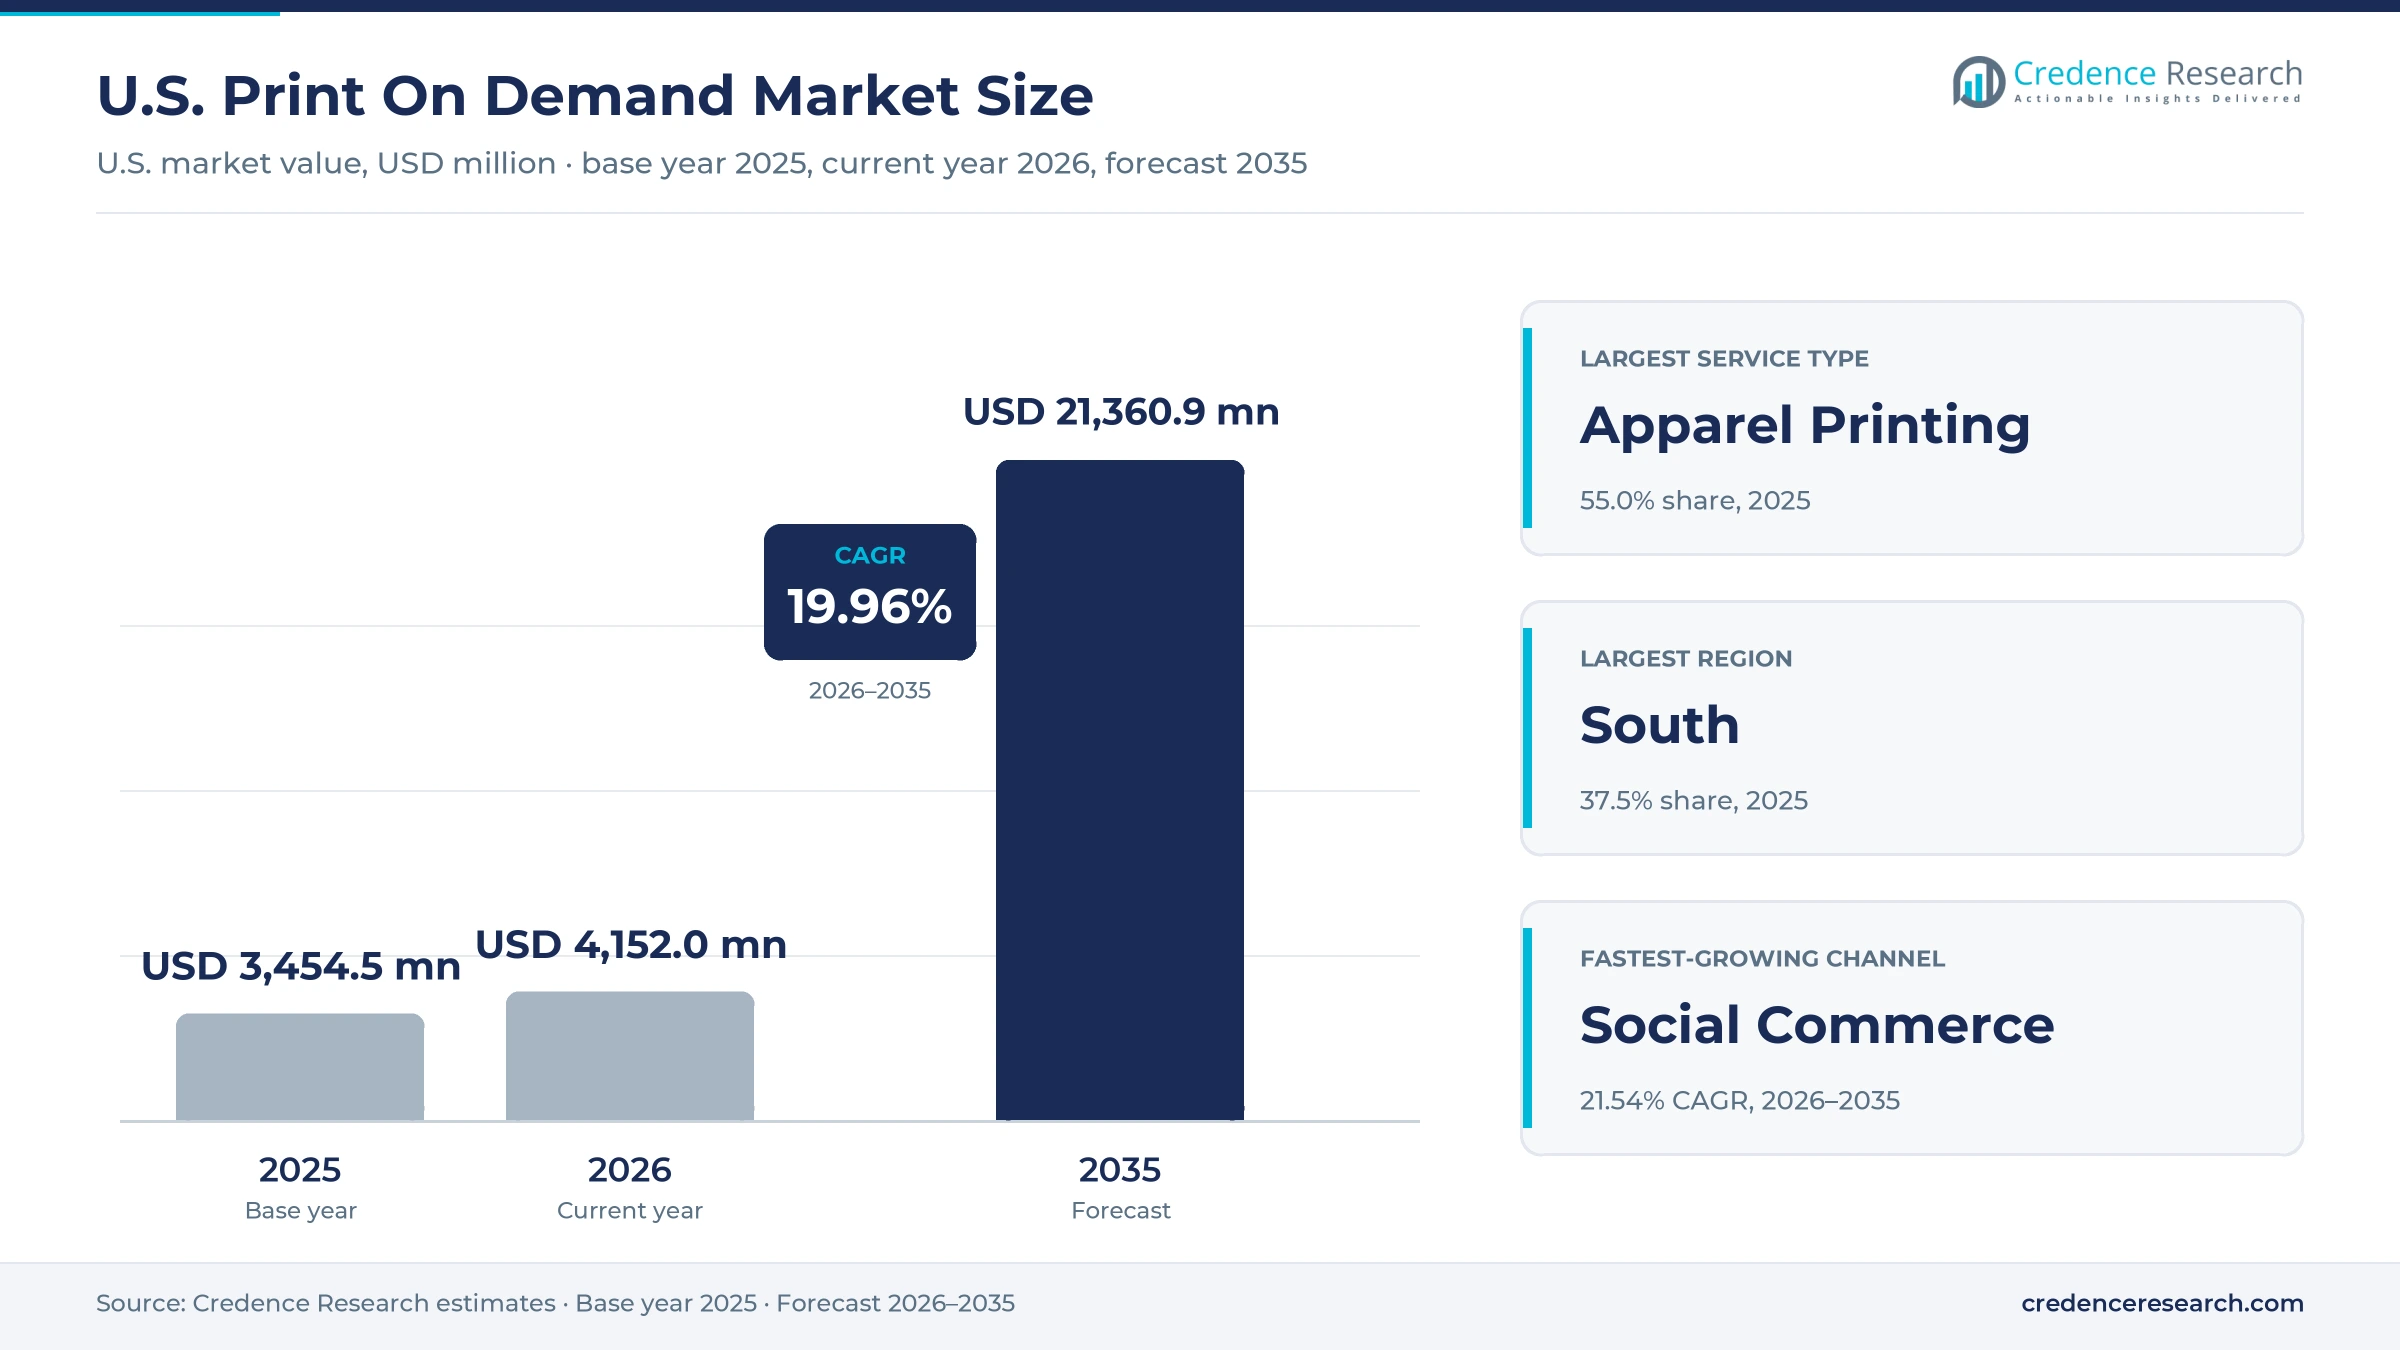
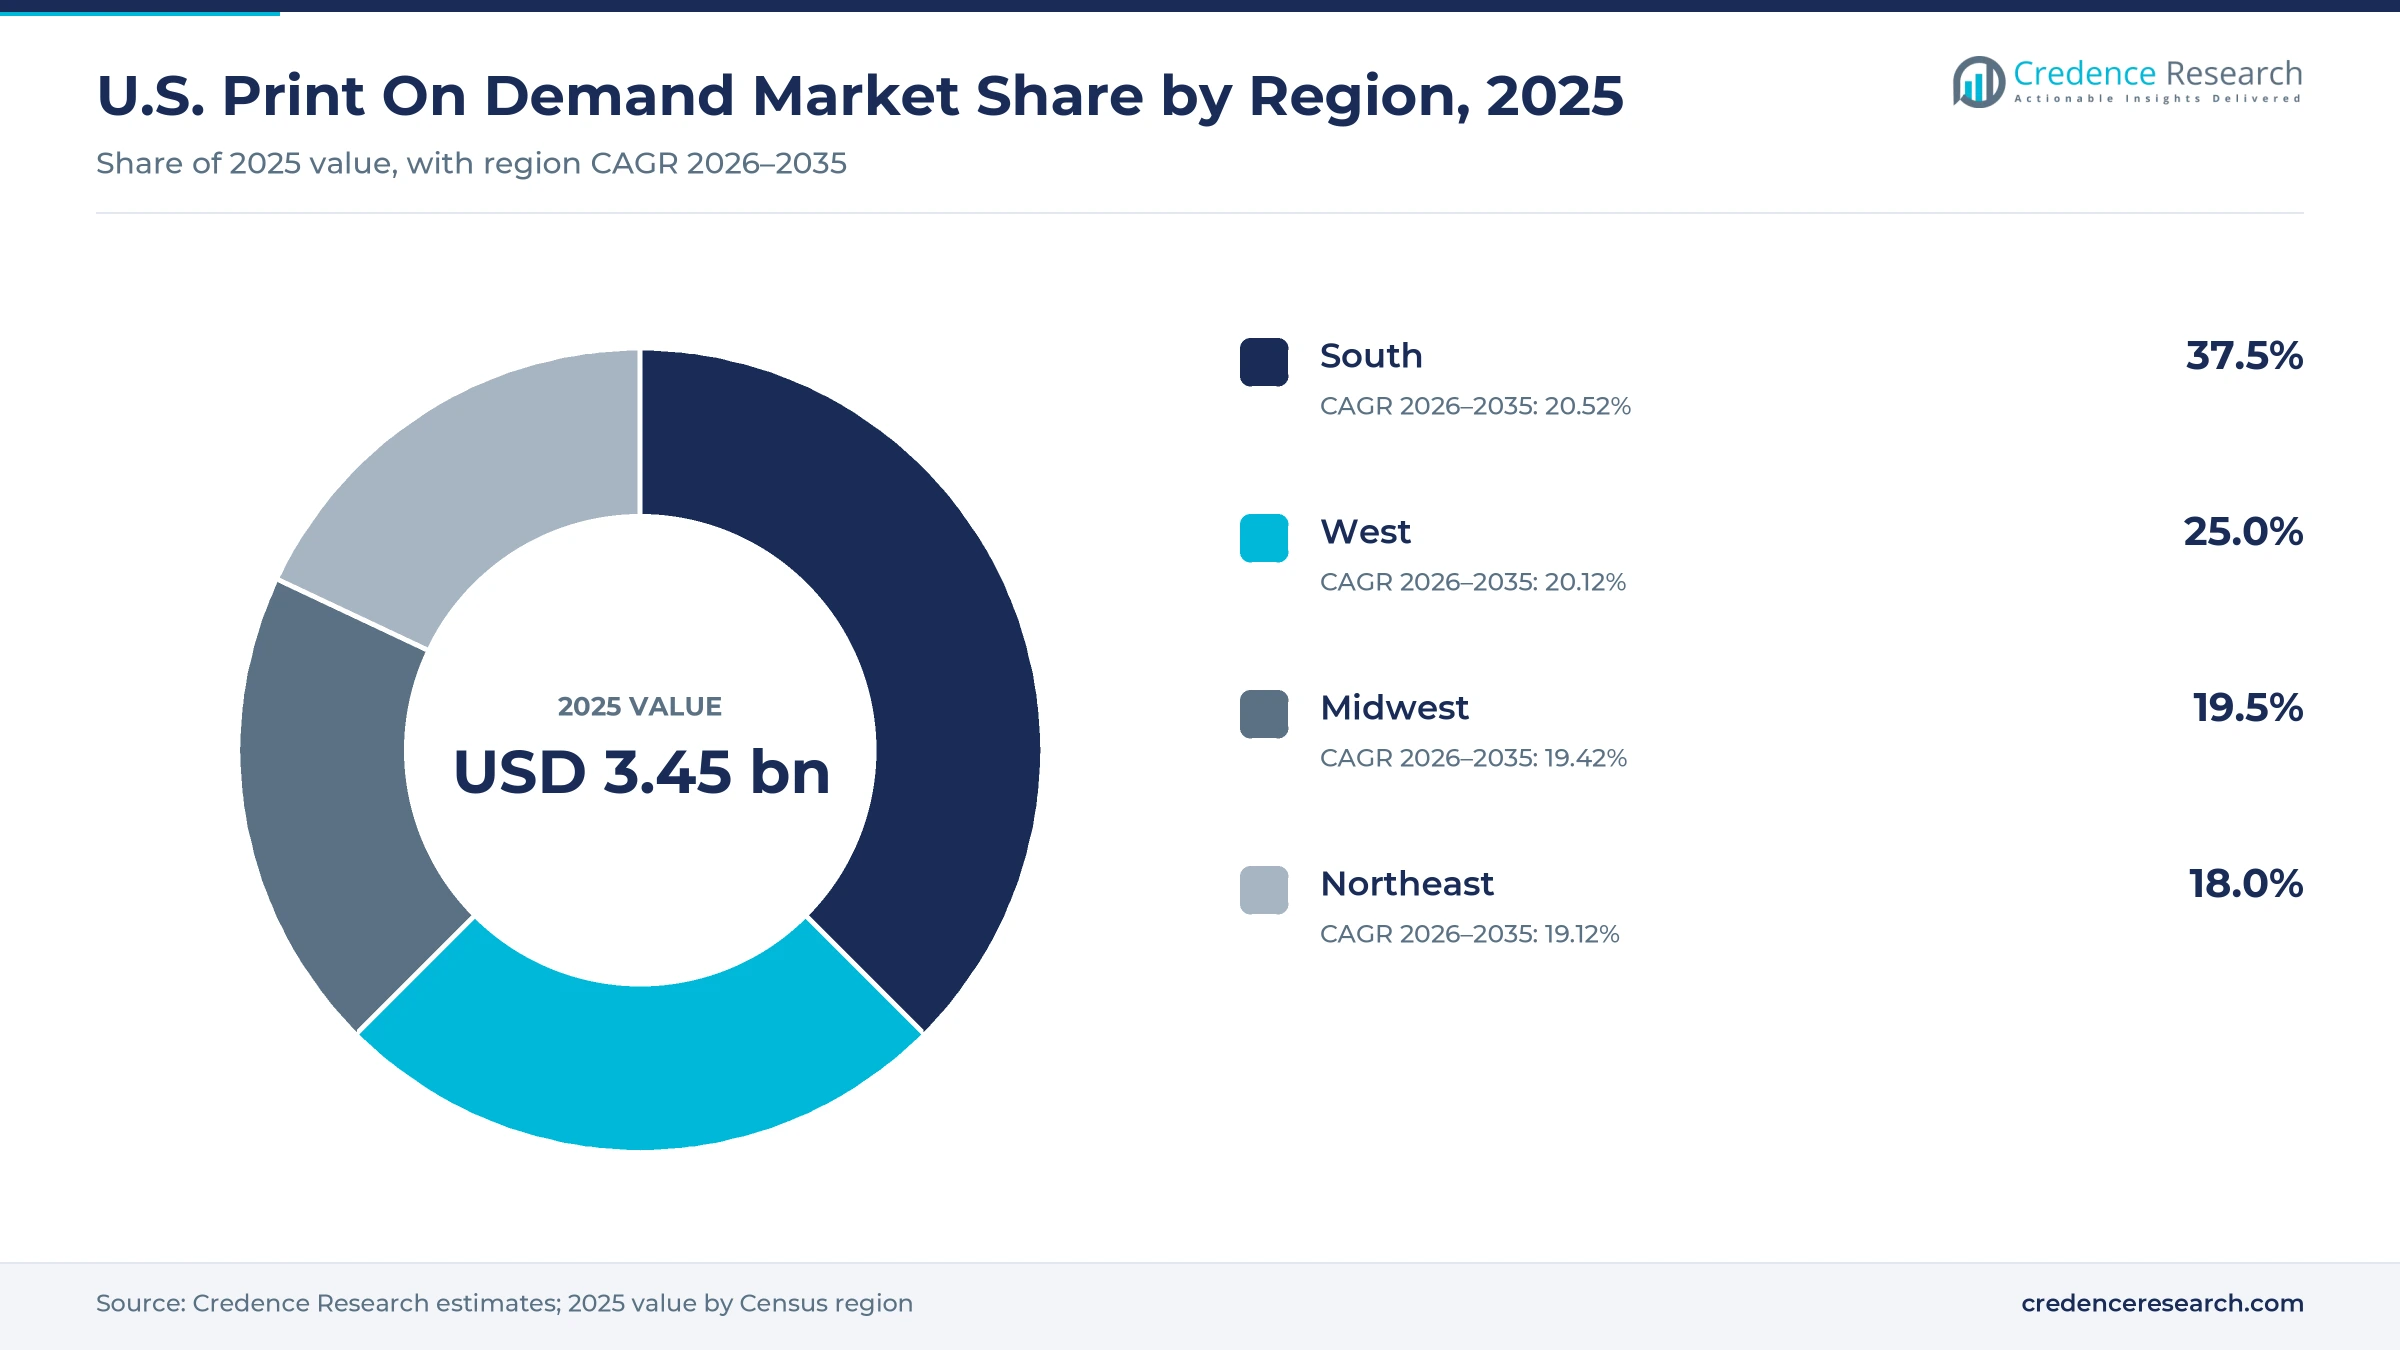
The U.S. print on demand market was valued at USD 3.45 billion in 2025 and is projected to increase from USD 4.15 billion in 2026 to USD 21.36 billion by 2035, registering a CAGR of 19.96% during 2026–2035. Demand comes from independent creators, small online brands and companies that sell custom apparel, home goods and accessories without holding stock, because each item is printed only after a buyer pays. The South held the largest regional share, 37.5% in 2025, and is also the fastest-growing region at 20.52% a year, as population and fulfillment capacity keep moving there. Online retail also keeps expanding, and e-commerce reached 17.1% of U.S. retail sales in the second quarter of 2026. A commercial change also matters, because duty-free de minimis treatment for imported parcels ended in August 2025, which favors items printed and shipped inside the country.
What does the U.S. print on demand estimate cover?
The estimate measures fees and product value paid to providers that print custom designs on apparel, home goods, accessories, paper and promotional items after each order is placed. It covers vertically integrated producers, networks that route orders to partner print shops, hybrid models and marketplace-managed fulfillment. Values are stated in USD million at current prices and are assigned to the Census region where orders are delivered.
The estimate excludes bulk screen printing runs, commercial book and packaging printing, and the retail markup that sellers add on their own stores. It also excludes design software subscriptions that are sold without fulfillment. The value chain runs from blank garment and goods suppliers through print facilities and routing software to store platforms, marketplaces and buyers.
U.S. Print On Demand Market Insights
- The market was valued at USD 3.45 billion in 2025 and is projected to reach USD 21.36 billion by 2035, registering a CAGR of 19.96% during 2026–2035.
- The South held 37.5% of 2025 value, because it has the largest and fastest-growing population and many fulfillment sites.
- Apparel printing led with 55.0% of 2025 value, as T-shirts, hoodies and caps remain the core made-to-order products that creators list first.
- Printful and Printify completed their merger in November 2024, combining a producer and a network of partner print shops.
- Taylor Corporation acquired Gooten in October 2025, linking OrderMesh order routing software with a large domestic manufacturing footprint for enterprise clients.
Apparel printing and creator stores hold the largest shares
Why does apparel printing lead order volume?
Based on service type, the market is categorized into apparel printing, home and living printing, accessories printing and paper and promotional printing. Apparel Printing led with 55.0% of 2025 value, because T-shirts, hoodies and caps are the first products most creators sell. Home and Living Printing grows fastest at 20.87% a year, as sellers add mugs, posters, blankets and drinkware with higher order values.
Which customers place the most orders?
Based on customer type, the market is categorized into independent creators, microbrands and SMB retailers, enterprise brands and institutions and communities. Independent Creators led with 44.0% of 2025 value, because artists, streamers and designers sell merchandise without upfront stock. Enterprise Brands grow fastest at 20.79% a year, as retailers use made-to-order lines to test designs and cut unsold inventory.
How do fulfillment models differ?
Based on delivery model, the market is categorized into vertically integrated fulfillment, network aggregator fulfillment, hybrid fulfillment and marketplace-managed fulfillment. Vertically Integrated Fulfillment led with 38.0% of 2025 value, because owned facilities give tighter control over print quality and timing. Hybrid Fulfillment grows fastest at 20.99% a year, as merged providers combine owned plants with partner shops.
Where do sellers find their buyers?
Based on channel, the market is categorized into owned store integrations, online marketplaces, social commerce and enterprise and API sales. Owned Store Integrations led with 46.0% of 2025 value, because creators link print providers to their own storefronts. Social Commerce grows fastest at 21.54% a year, as short videos and live selling turn audiences into buyers within one app.
| Segment Group | Leading Sub-segment | Share, 2025 | Fastest-growing Sub-segment | CAGR, 2026–2035 |
|---|---|---|---|---|
| By Service Type | Apparel Printing | 55.0% | Home and Living Printing | 20.87% |
| By Customer Type | Independent Creators | 44.0% | Enterprise Brands | 20.79% |
| By Delivery Model | Vertically Integrated Fulfillment | 38.0% | Hybrid Fulfillment | 20.99% |
| By Channel | Owned Store Integrations | 46.0% | Social Commerce | 21.54% |
Request a Free Sample
Fill in your details and we'll send you a free sample report.
- Sample data tables & charts
- Research methodology
Online retail, creators and zero inventory lift orders
How does a large e-commerce demand pool support orders?
A large and expanding online retail base is the main driver, because made-to-order goods are sold almost entirely online. U.S. e-commerce sales reached US$340.2 billion in the second quarter of 2026, up 12.2% from a year earlier, according to Census data reported by Practical Ecommerce. Online sales also rose to 17.1% of total retail, compared with 16.3% a year earlier, which widens the pool of shoppers who buy custom products. In turn, store platforms report deep U.S. adoption, and Shopify said 44% of its merchants were in the United States at the end of 2025. As a result, owned store integrations hold 46.0% of 2025 value.
Why do creator monetization and community commerce matter?
Creator monetization drives repeat demand, because artists, streamers and communities turn designs into merchandise without stock risk. Etsy reported 86.5 million active buyers and 5.6 million active sellers at the end of 2025, according to its annual report, and many sellers use production partners for printed goods. Printify lists about 10 million merchants on its platform, which shows how many small sellers rely on outsourced printing. Therefore, independent creators held 44.0% of 2025 value, while fan clubs, schools and teams add steady seasonal orders for custom apparel and accessories. Etsy buyers also purchased about three times a year on average in 2025, which keeps creator demand recurring.
How do zero-inventory technology and product range lift orders?
Zero-inventory technology lifts orders, because sellers can list hundreds of products and pay only when a buyer checks out. Printify lists about 2,000 products made by roughly 70 print providers in about 100 locations, which gives sellers a wide catalog without setup cost. CustomCat, based in Detroit, offers printing in the United States within 48 hours through its store app. Gelato also rolled out GelatoConnect for Apparel in July 2025, supporting DTG, DTF and embroidery workflows for print shops. As a result, home and living printing grows fastest among service types at 20.87% a year as sellers widen their ranges.
Why does the end of de minimis favor domestic production?
The end of duty-free de minimis treatment favors domestic production, because imported low-value parcels now pay duties and clear formal entry. Duty-free treatment for goods valued at US$800 or less was suspended for all countries from Aug. 29, 2025, according to KPMG. Cross-border sellers that shipped custom goods directly from overseas plants lost a cost advantage, while U.S. print facilities avoid customs delays. Printful also operates production sites in the United States and Mexico, which shortens delivery to American buyers. Therefore, providers with domestic capacity gain orders, and vertically integrated fulfillment keeps 38.0% of 2025 value as sellers favor shorter delivery routes.
Consolidation and automated production reshape supply
Why is consolidation among platforms rising?
Consolidation is rising, because scale lowers per-order costs and widens product range. Printful and Printify completed their merger in November 2024 and began integration on 20 November, according to Printful. The merged company took the name Fyul in January 2025, combining Printful's own factories with Printify's partner network of more than 85 printing companies at the time. Taylor Corporation then acquired Gooten in October 2025, adding the OrderMesh routing platform to its manufacturing base. As a result, hybrid fulfillment grows fastest among delivery models at 20.99% a year as owned plants and partner shops merge into single networks serving U.S. buyers.
How is the shift toward automated DTG production playing out?
Production is shifting toward automated direct-to-garment printing, because consistent quality reduces returns and reprints. Printful announced in January 2025 that it runs 86 Kornit Atlas MAX systems across its fulfillment network, which it called the largest such fleet in the industry. Gelato launched an AI quoting tool for print service providers in September 2025 and showed AI-powered production at Printing United Expo 2025. In turn, shops can quote, route and print orders with fewer manual steps, which shortens turnaround and helps apparel printing keep 55.0% of 2025 value. Printful also employs more than 2,000 people globally, so automation helps keep labor cost per order down as volumes rise.
Can enterprise and API contracts open new revenue pools?
Enterprise and API contracts are an opening, because large brands want made-to-order lines without building their own plants. Taylor Corporation, which has about 10,000 employees and print operations in dozens of U.S. states, bought Gooten in October 2025 to combine routing software with its plants. Gelato took its GelatoConnect City Tour to Chicago and Atlanta first in April 2026, aiming at print shops that serve business customers. Therefore, enterprise brands grow fastest among customer types at 20.79% a year as retailers move slow-selling items to print-after-purchase models. Printify also reports more than 60 million delivered orders, which shows that networks can now carry enterprise volumes.
Is there room to grow through social commerce?
Social commerce offers a large opening, because creators can sell custom goods inside short video and live shopping apps. Social commerce grows fastest among channels at 21.54% a year, the highest rate of any channel through 2035. Etsy said habitual buyers made up about 7% of its active buyers yet about 40% of its 2025 sales volume, which shows how loyal fan bases drive repeat merchandise buying. Pairing these fans with influencer marketing campaigns lets creators launch limited designs in hours. As a result, providers that integrate with social storefronts and live-selling tools can capture new orders in 2026 and beyond, especially for limited drops.
Thin margins, quality control and IP risks persist
How do thin unit margins limit sellers?
Thin unit margins limit many sellers, because base product, printing, platform fees and shipping leave little room for profit. As a result, small creators often raise retail prices or bundle items, which can reduce conversion. Providers face the same squeeze when blank garment costs rise. Mitigation includes regional production that cuts shipping cost and subscription plans that lower base prices for high-volume sellers.
Why does quality control stay difficult in networks?
Quality control stays difficult in network models, because the same design may be printed by different shops with different machines and blanks. Color shifts, misprints and late shipments create refunds and hurt seller ratings. In turn, platforms invest in partner scoring, standard profiles and automated DTG fleets. Sellers can also limit risk by choosing one provider for each product and ordering samples first.
How do copyright and trademark claims create risk?
Copyright and trademark claims create legal and account risk, because open upload tools let some sellers print designs they do not own. Rights holders file takedown requests, and platforms suspend stores that repeat violations. This raises screening costs for providers and marketplaces that host millions of designs. Automated image checks and clearer seller rules are the main ways to reduce these claims without slowing legitimate creators.
Why do shipping costs and delivery expectations add pressure?
Shipping costs and delivery expectations add pressure, because buyers compare custom items with the fast delivery of stocked goods. Made-to-order products need extra days for printing, so long cross-country routes can push delivery beyond a week. Therefore, providers spread production across several regions and route orders to the nearest facility. This lowers transit time, but it also raises fixed costs for smaller providers.
The South leads while all four regions grow quickly
| Region | Value, 2025 (USD billion) | Share, 2025 | CAGR, 2026–2035 |
|---|---|---|---|
| South | 1.30 | 37.5% | 20.52% |
| West | 0.86 | 25.0% | 20.12% |
| Midwest | 0.67 | 19.5% | 19.42% |
| Northeast | 0.62 | 18.0% | 19.12% |
Why does the South lead order volume?
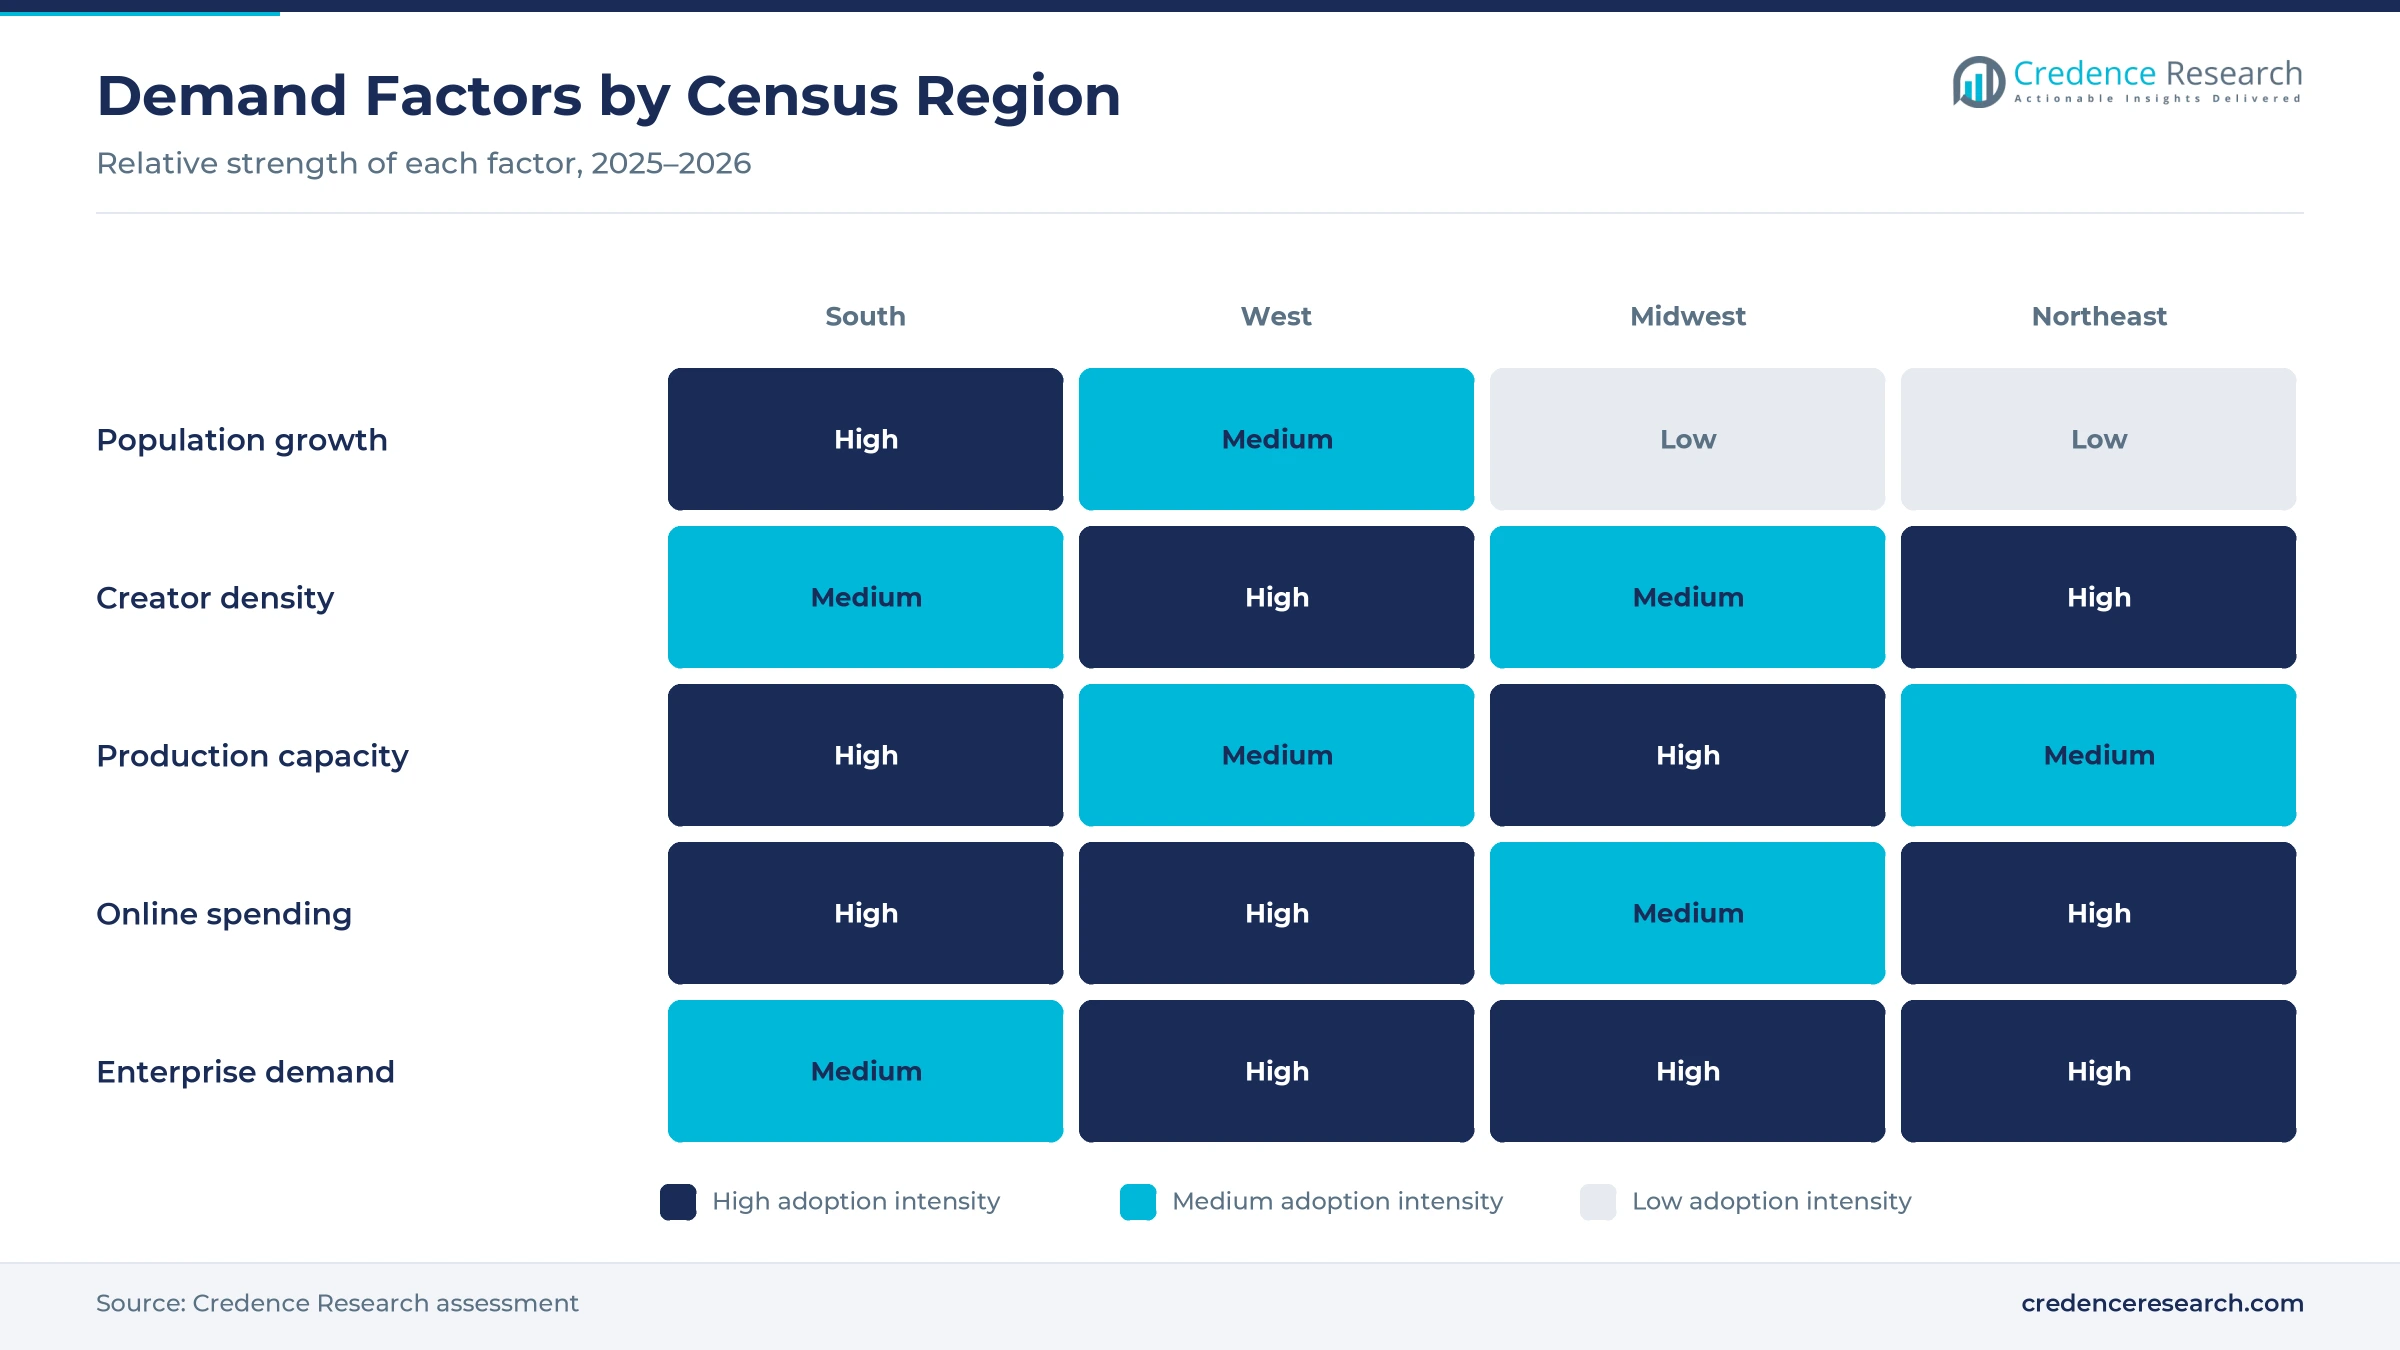
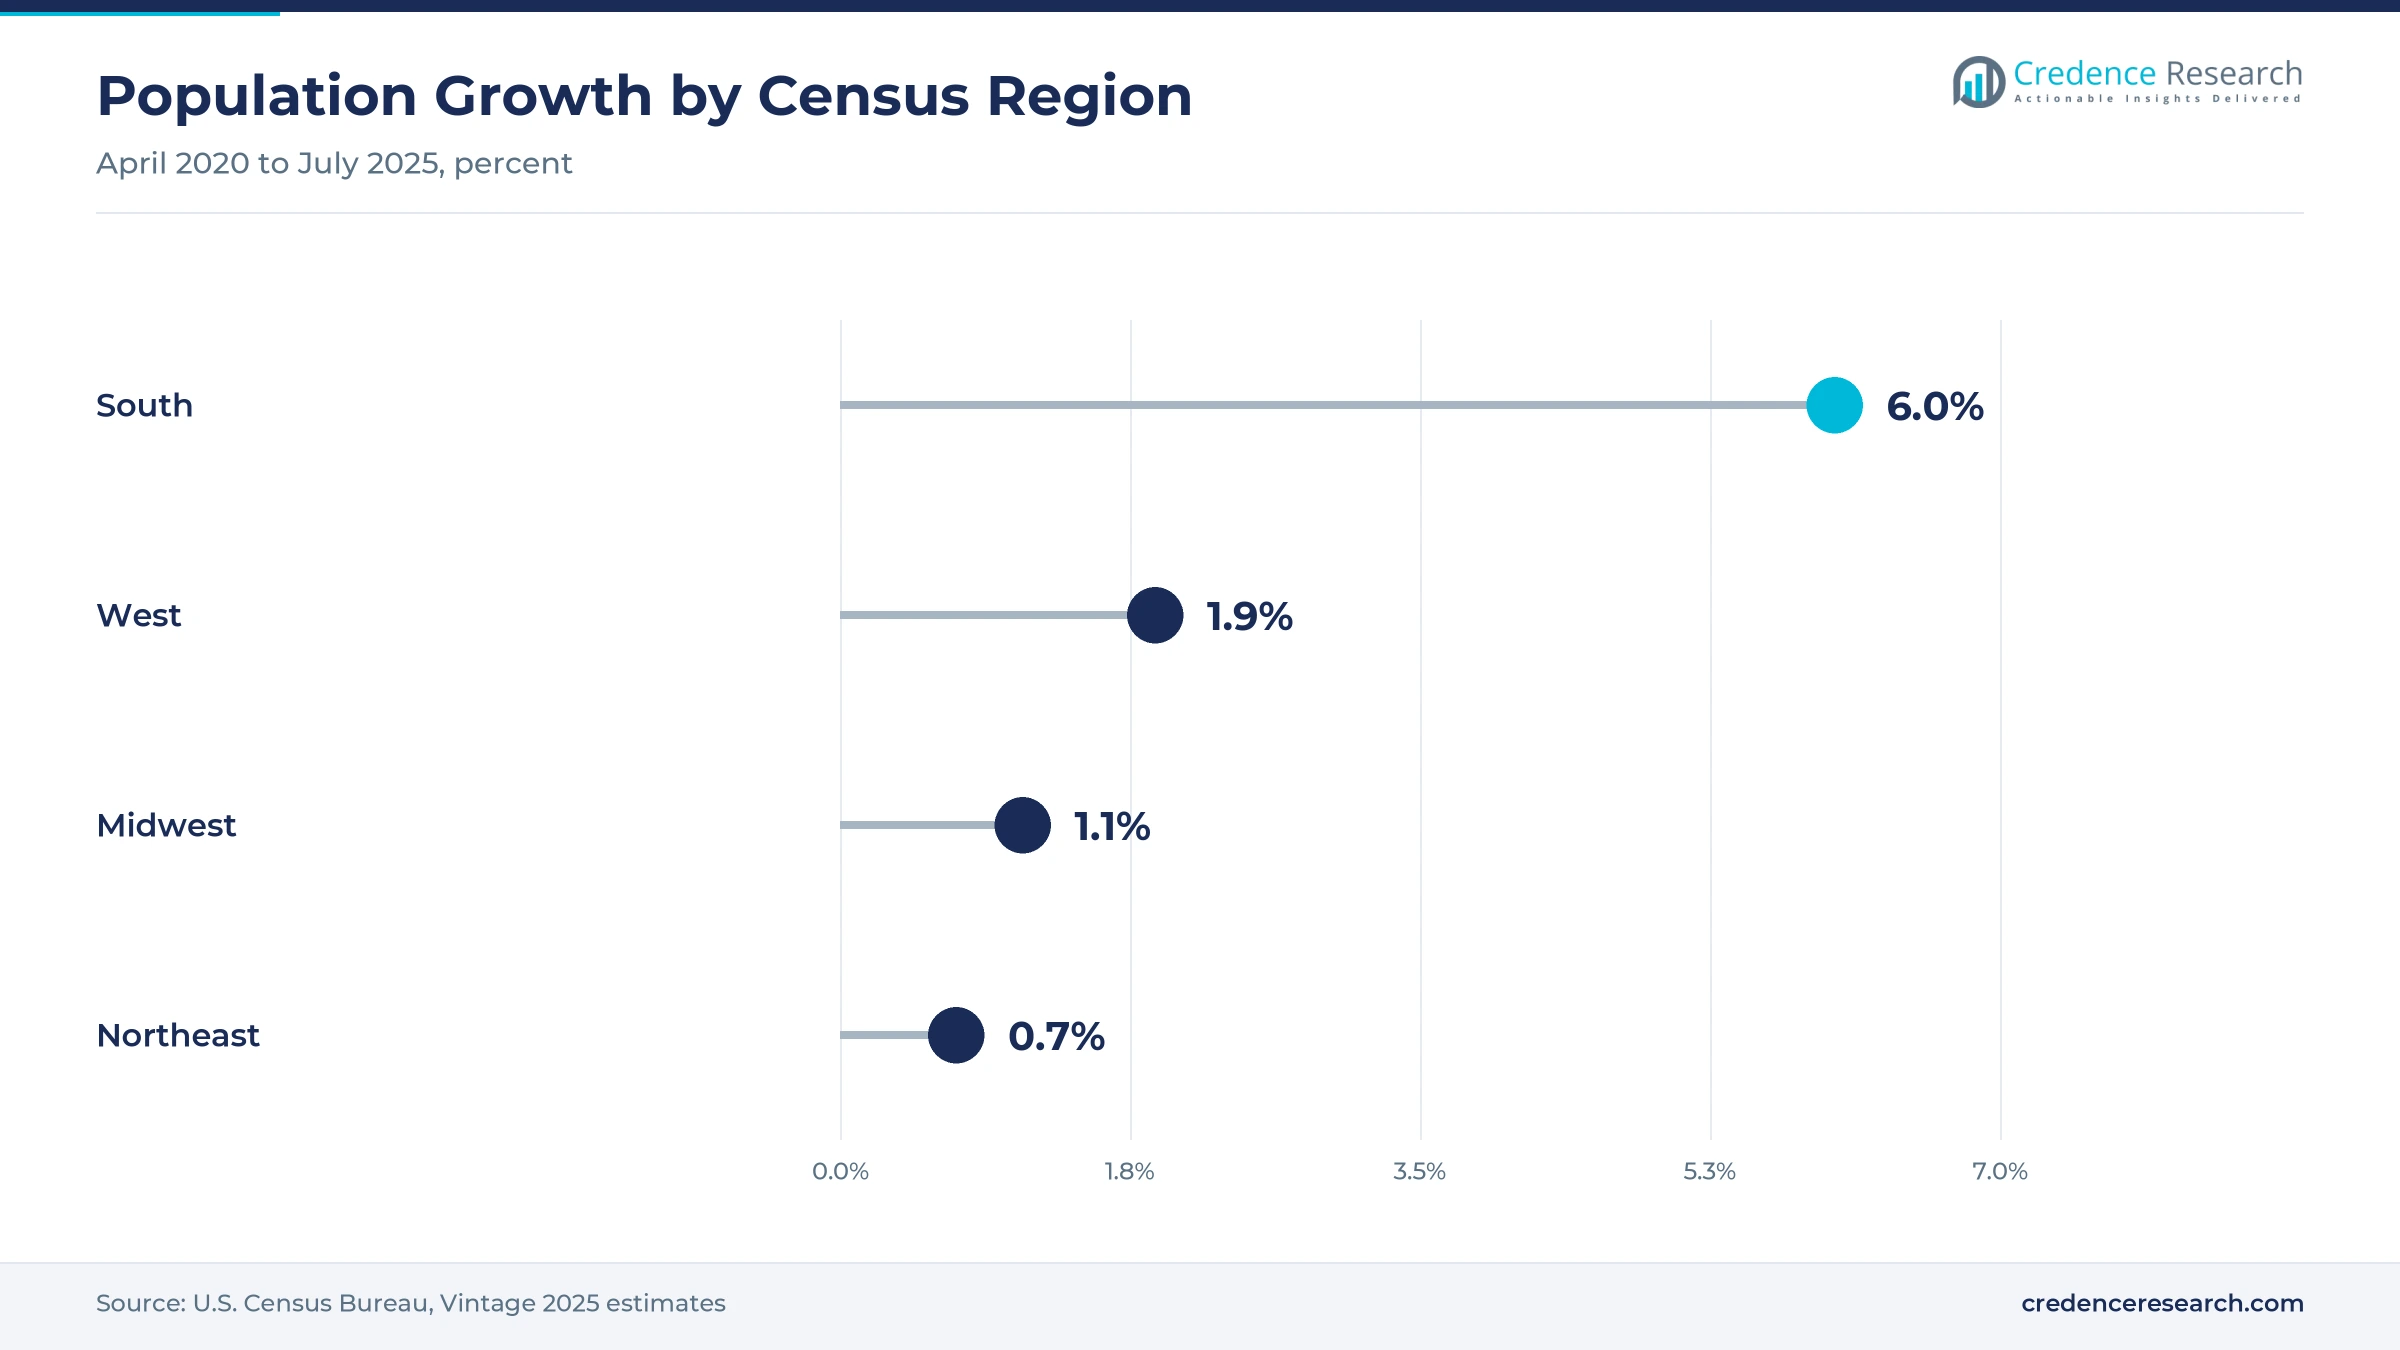
The South held 37.5% of 2025 value and grows fastest at 20.52% a year, because it has the largest population and draws new residents. Its population grew 6.0% from 2020 to 2025, about twice the national rate of 3.1%, according to the U.S. Census Bureau. Fulfillment sites and creator hubs in Texas, Georgia, Florida and North Carolina serve both local buyers and fast national shipping. This combination keeps the South ahead in made-to-order demand through 2035, as its share of national population keeps rising.
How does the West support creator demand?
The West held 25.0% of 2025 value and grows at 20.12% a year, because California, Washington and other western states host many digital creators, apparel brands and online stores. Its population grew 1.9% from 2020 to 2025, according to Census data. Western sellers also lead adoption of dropshipping and social storefronts, which keeps order volumes high. Western demand also benefits from high online spending per household, which supports growth close to the national average through 2035.
What role does the Midwest play in production?
The Midwest held 19.5% of 2025 value and grows at 19.42% a year, because it combines steady consumer demand with production sites. CustomCat prints orders in Detroit, and Taylor Corporation runs print operations from North Mankato, Minnesota, after acquiring Gooten. The region's population grew 1.1% from 2020 to 2025, so growth depends more on online spending than on new residents. Even so, central locations let Midwest plants reach most U.S. buyers within two or three days.
Why does the Northeast grow more slowly?
The Northeast held 18.0% of 2025 value and grows at 19.12% a year, because its population grew only 0.7% from 2020 to 2025. Even so, dense cities such as New York, Boston and Philadelphia supply many independent designers, universities and community groups that order custom apparel. Fast regional delivery from nearby facilities keeps the region an important market.
Mergers and acquisitions reshaped 2024 to 2026
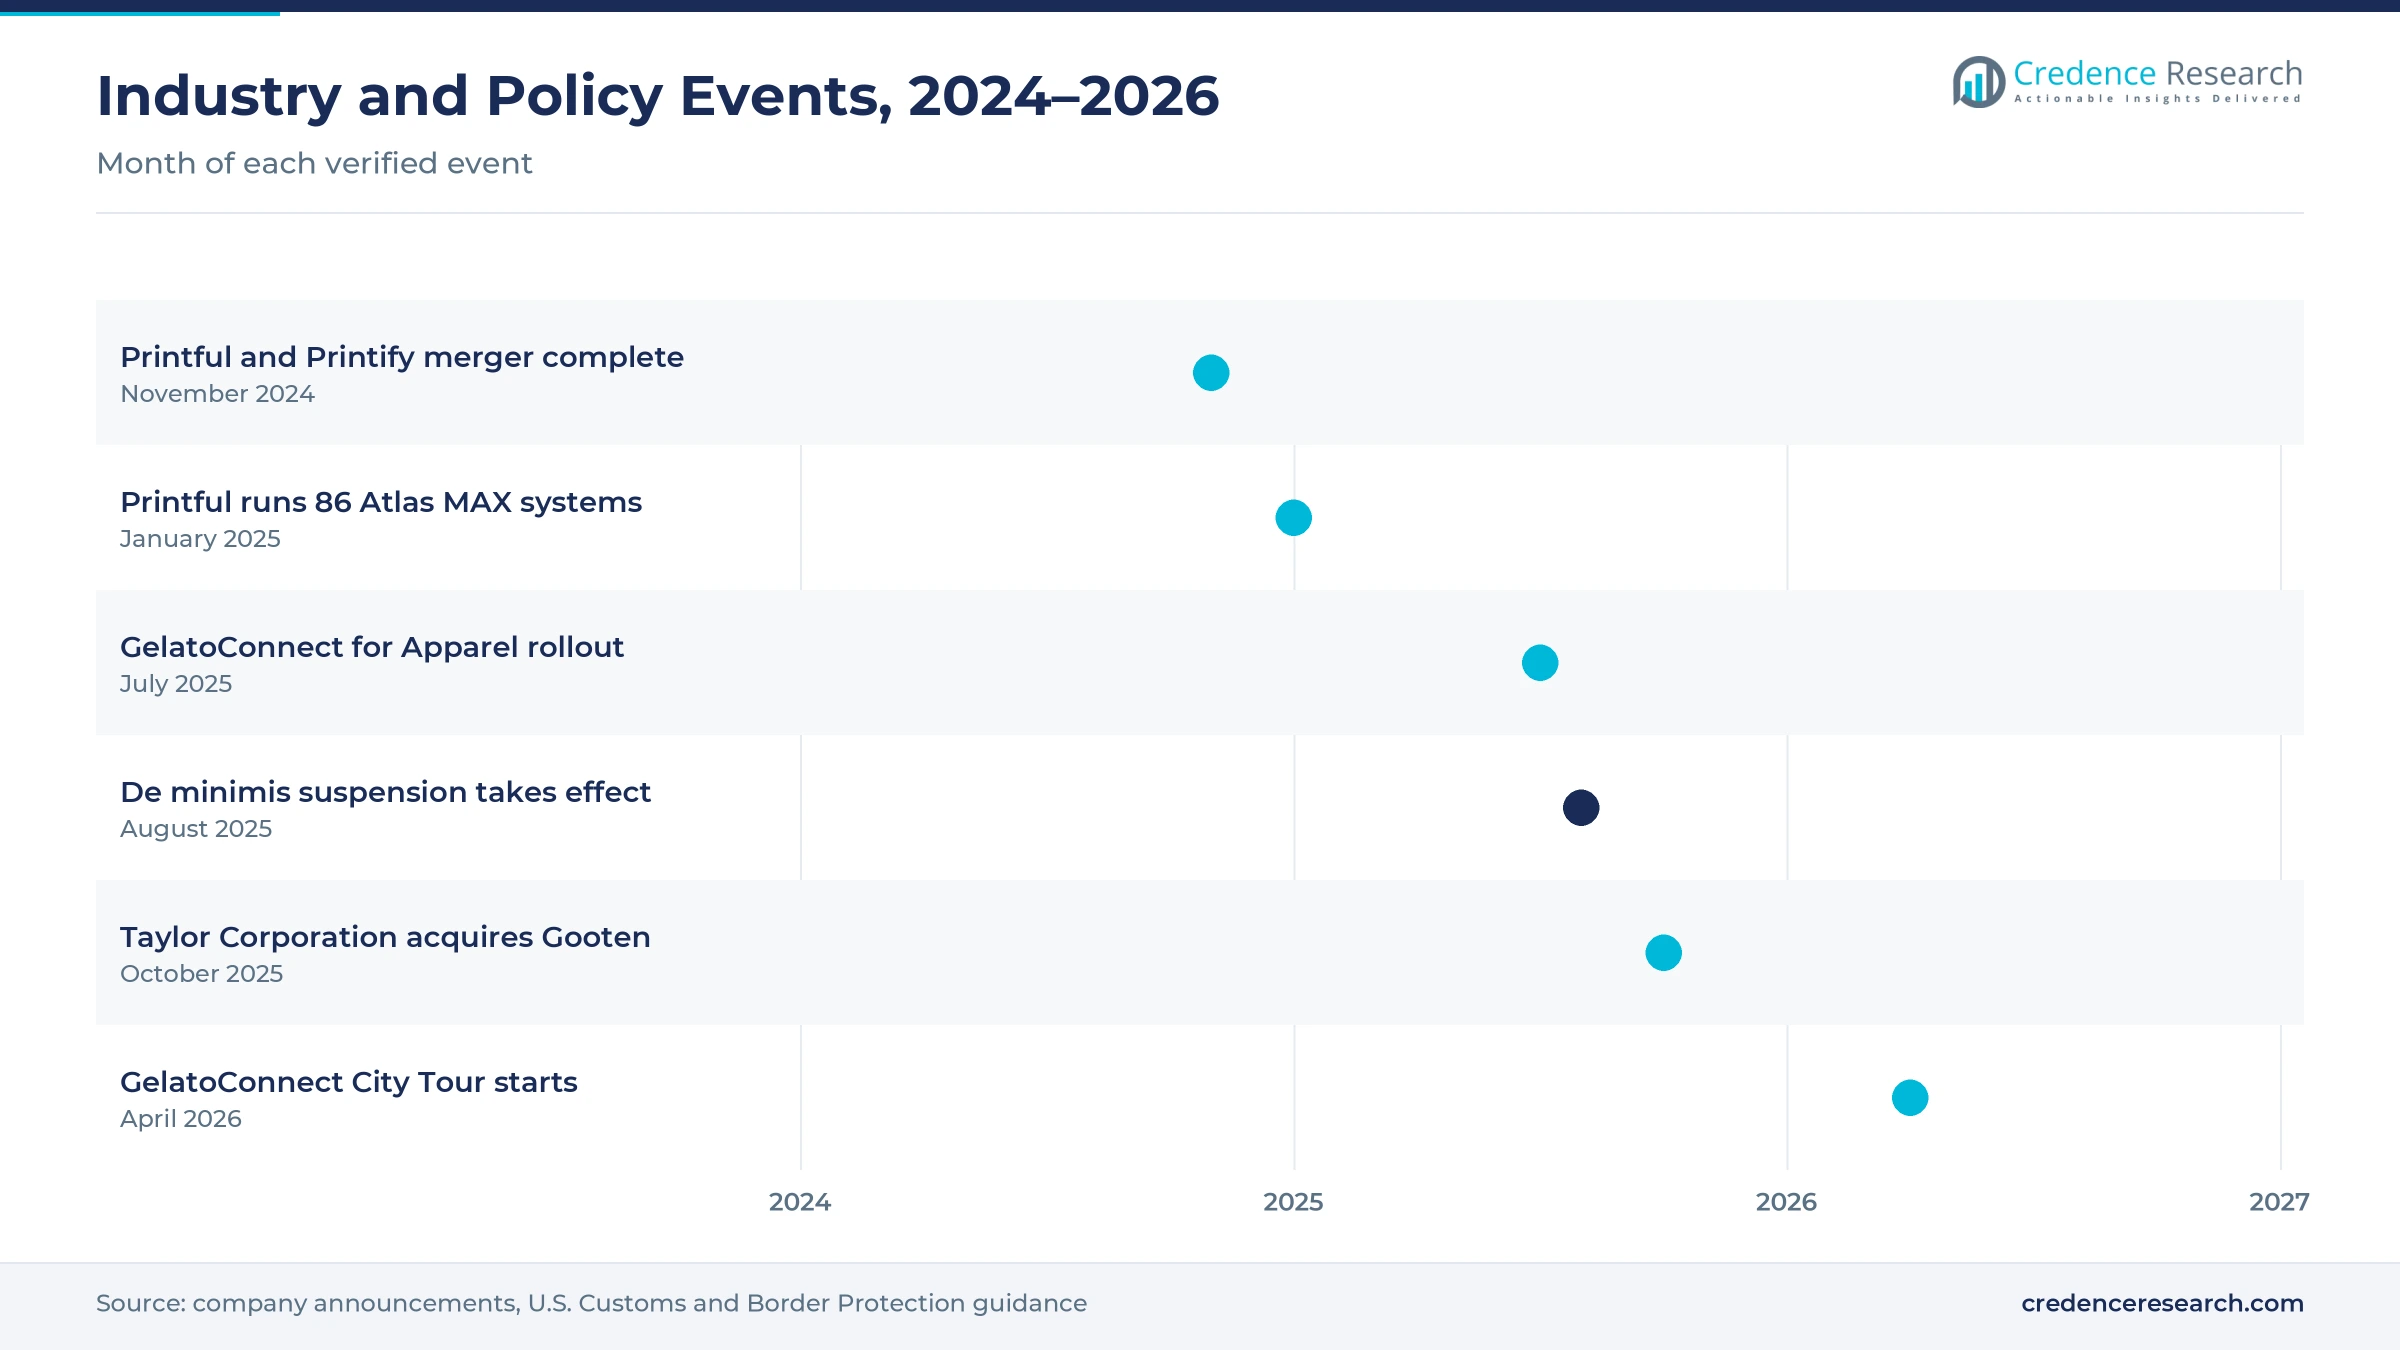
| Development | Status and market relevance |
|---|---|
| In November 2024, Printful and Printify completed their merger and began integration under a single leadership team. | Created the largest combined producer and partner network in made-to-order goods |
| In January 2025, Printful said it runs 86 Kornit Atlas MAX DTG systems across its global fulfillment network. | Raises print consistency for apparel orders shipped to U.S. buyers |
| In July 2025, Gelato rolled out GelatoConnect for Apparel, supporting DTG, DTF, embroidery and hybrid workflows. | Gives apparel print shops software for routing and producing made-to-order jobs |
| In August 2025, the United States suspended duty-free de minimis treatment for low-value parcels from all countries. | Effective Aug. 29, 2025; favors domestic print facilities over cross-border shippers |
| In October 2025, Taylor Corporation acquired Gooten, a made-to-order technology and fulfillment provider. | Combines Gooten's OrderMesh platform with Taylor's U.S. manufacturing footprint |
DTG printers, routing software and AI quoting
- Direct-to-garment printers such as the Kornit Atlas MAX print full-color designs on single garments, and Printful runs 86 of these systems.
- Order routing software such as Gooten's OrderMesh sends each order to the best facility by product, location and capacity.
- AI quoting and workflow tools such as the GelatoConnect AI Estimator help print shops price and schedule jobs with fewer manual steps.
- Store and marketplace integrations connect providers to e-commerce platforms, so orders flow to production as soon as buyers pay.
Need a Custom Version of This Report?
Tailor the scope, geography, or segments to your exact requirements.
- Custom geography or segment scope
- Direct access to our analyst team
Platforms and networks compete on speed and range
Competition is concentrated among a few platforms and networks that compete on speed, product range, print quality and integrations. Printful and Printify now operate under one company, combining owned production sites with a large network of partner print shops. Gelato competes with a global production network and software for print service providers, while CustomCat prints orders in Detroit and promises fast domestic turnaround. Gooten, now part of Taylor Corporation, offers routing software backed by a large manufacturing base for enterprise clients. Rivals also compete on seller tools, mockup generators, pricing tiers and marketplace connections. Scale, domestic capacity and automated DTG fleets increasingly decide which providers can keep delivery times short as order volumes rise.
Companies profiled and their roles in this market
| Company | Type | Role in the market |
|---|---|---|
| Printful | Vertically integrated producer | Runs 86 Kornit Atlas MAX systems and production sites in the United States and Mexico; merged with Printify in November 2024 |
| Printify | Network aggregator | Lists about 2,000 products from roughly 70 print providers in about 100 locations |
| Gelato | Production network and software | Rolled out GelatoConnect for Apparel in July 2025 and toured Chicago and Atlanta in April 2026 |
| CustomCat | U.S. producer | Based in Detroit, prints and ships from the United States within 48 hours |
| Gooten | Routing and fulfillment provider | Acquired by Taylor Corporation in October 2025; operates the OrderMesh platform |
Credence Research view on domestic made-to-order supply
Credence Research's view is that U.S. print on demand demand will keep growing fast because selling online without stock fits both creators and larger brands. The end of de minimis treatment gives domestic producers a lasting advantage over cross-border shippers. Consolidation should improve margins for the largest providers, but it may also raise prices for small sellers. Social commerce and enterprise contracts are the main upside factors, while weak consumer spending or higher blank costs could slow growth through 2035.
How the U.S. made-to-order estimate was built
The report uses 2025 as the base year, with values in USD million at current prices. Market values come from the Credence Research model, and regional, service type, customer type, delivery model and channel splits are Credence Research estimates. Inputs include Census Bureau retail and population data, company filings, company announcements, platform listings and trade press. Regional shares follow the client's split, and growth tilts reflect population trends and production locations. No interviews or surveys were used in preparing these estimates.
Social selling and enterprise orders drive 2035 growth
The market is expected to reach USD 21.36 billion by 2035, a 19.96% CAGR during 2026–2035, as online retail, creators and brands move more products to print-after-purchase models. Growth should stay strong while social selling and enterprise contracts scale, and the South should keep the largest share. Home and living products and hybrid fulfillment are expected to gain share as providers widen ranges and combine owned plants with partners. Faster delivery would lift this outlook, while weaker discretionary spending would lower it.
Frequently Asked Questions
How big is the U.S. print on demand market?
Which region leads the market?
Which service type holds the largest share?
Who buys made-to-order printing services?
How did the end of de minimis affect the market?
What major deals reshaped the market?
Which channel grows fastest?
Who are the main companies in the market?
Table of Content
Chapter 1 Market Segmentation
- 1.1 Segmentation Framework
- 1.1.1 Product and Service Classification
- 1.1.2 Application and End-Use Classification
- 1.1.3 Technology and Solution Classification
- 1.1.4 Customer and Distribution Channel Classification
- 1.1.5 Geographic Segmentation
- 1.1.6 Market Segment Definitions and Boundaries
- 1.2 By Service Type
- 1.2.1 Apparel Printing
- 1.2.2 Home and Living Printing
- 1.2.3 Accessories Printing
- 1.2.4 Paper and Promotional Printing
- 1.3 By Customer Type
- 1.3.1 Independent Creators
- 1.3.2 Microbrands and SMB Retailers
- 1.3.3 Enterprise Brands
- 1.3.4 Institutions and Communities
- 1.4 By Delivery Model
- 1.4.1 Vertically Integrated Fulfillment
- 1.4.2 Network Aggregator Fulfillment
- 1.4.3 Hybrid Fulfillment
- 1.4.4 Marketplace-Managed Fulfillment
- 1.5 By Channel
- 1.5.1 Owned Store Integrations
- 1.5.2 Online Marketplaces
- 1.5.3 Social Commerce
- 1.5.4 Enterprise and API Sales
Chapter 2 Introduction
- 2.1 Report Objectives and Scope
- 2.2 Product Definition and Industry Terminology
- 2.3 Market Inclusions and Exclusions
- 2.4 Research Process
- 2.4.1 Primary Research and Expert Interviews
- 2.4.2 Secondary Research and Source Review
- 2.4.3 Top-Down and Bottom-Up Estimation
- 2.4.4 Data Triangulation and Verification
- 2.5 Market Size Measurement Basis
- 2.5.1 2025: USD 3.45 billion → 2035: USD 21.36 billion
- 2.6 Historical and Forecast Reference Periods
- 2.6.1 Historical Period: 2018-2025
- 2.6.2 Base Year: 2025
- 2.6.3 Forecast Period: 2025-2035
- 2.7 Research Assumptions and Limitations
Chapter 3 Executive Summary
- 3.1 Market Snapshot and Key Findings
- 3.2 Base-Year Market Size, 2025
- 3.3 Forecast Market Size, 2035
- 3.4 Revenue and Volume Growth Outlook
- 3.5 Key Demand and Supply Indicators
- 3.6 Leading Market Segments
- 3.7 Fastest-Growing Market Opportunities
- 3.8 Regional Performance Highlights
- 3.9 Technology and Industry Transformation
- 3.10 Competitive Landscape Summary
- 3.11 Analyst View and Strategic Implications
Chapter 4 U.S. Print On Demand Market Trends and Developments
- 4.1 Historical Industry Development, 2018-2025
- 4.2 Recent Market Trends and Developments
- 4.3 Demand and Customer Behavior Trends
- 4.4 Technology and Product Innovation
- 4.5 Artificial Intelligence, Automation and Digitalization
- 4.6 Local Manufacturing and Supply Chain Realignment
- 4.7 Industry Partnerships, Mergers and Acquisitions
- 4.8 Sustainability and Circular Economy Developments
- 4.9 Government and Private Sector Investment Trends
- 4.10 Emerging Business Models and Commercialization
- 4.11 Industry Developments and Announcements
Chapter 5 U.S. Print On Demand Market Production, Supply and Demand Analysis
- 5.1 Demand Trend and Consumption Analysis, 2018-2025
- 5.2 Demand Forecast, 2025-2035
- 5.3 Production and Output Trend, 2018-2025
- 5.4 Production and Output Forecast, 2025-2035
- 5.5 Installed Capacity and Capacity Utilization
- 5.6 Company-Wise Production Plants and Statistics
- 5.6.1 Installed Production Capacity
- 5.6.2 Actual Production
- 5.6.3 Planned Capacity and Expansion Targets
- 5.7 Supply Chain Structure and Procurement Trends
- 5.8 Supply-Demand Gap and Bottlenecks
- 5.9 Import Dependence and Sourcing Structure
- 5.10 Contract Manufacturing and Outsourcing
- 5.11 Regional Supply and Demand Concentration
Chapter 6 U.S. Print On Demand Market Pricing Analysis
- 6.1 Pricing Structure and Measurement
- 6.2 Historical Pricing Trends, 2018-2025
- 6.3 Pricing Outlook, 2025-2035
- 6.4 Average Selling Price and Unit Economics
- 6.5 Pricing by Product and Market Segment
- 6.6 Geographic Pricing Differences
- 6.7 Key Input, Energy, Labor and Logistics Costs
- 6.8 Contract Pricing and Purchasing Models
- 6.9 Pricing Sensitivity and Competitive Positioning
- 6.10 Price, Margin and Profitability Implications
Chapter 7 U.S. Print On Demand Market Dynamics
- 7.1 Market Growth Drivers
- 7.1.1 Demand-Side Drivers
- 7.1.2 Technology and Innovation Drivers
- 7.1.3 Infrastructure and Investment Drivers
- 7.1.4 Regulatory and Policy Drivers
- 7.2 Market Restraints
- 7.2.1 Cost and Affordability Constraints
- 7.2.2 Technology and Adoption Barriers
- 7.2.3 Supply Chain and Operational Constraints
- 7.3 Market Challenges
- 7.3.1 Competitive Pressure and Margin Erosion
- 7.3.2 Skills, Infrastructure and Implementation Gaps
- 7.4 Emerging Market Opportunities
- 7.5 Market Dynamics Impact and Time-Horizon Assessment
Chapter 8 U.S. Print On Demand Value Chain Analysis
- 8.1 Industry Value Chain Overview
- 8.2 Upstream Suppliers and Critical Inputs
- 8.3 Technology and Component Providers
- 8.4 Manufacturing or Service Delivery
- 8.5 Distribution, Channel Partners and Integrators
- 8.6 Downstream Applications and End Users
- 8.7 Value Addition and Profit Pools
- 8.8 Vertical Integration and Outsourcing
- 8.9 Supplier Concentration and Risk
- 8.10 Supply Chain Localization and Resilience
Chapter 9 U.S. Print On Demand Market Regulations and Policies
- 9.1 Relevant Laws, Standards and Compliance Frameworks
- 9.2 Product, Service, Safety and Quality Requirements
- 9.3 Government Policies, Incentives and Subsidies
- 9.4 Imports, Exports and Trade Barriers
- 9.5 Public Procurement and Local Content Requirements
- 9.6 Environmental and Sustainability Compliance
- 9.7 Data Protection, AI and Cybersecurity Compliance
- 9.8 Upcoming Policy Changes and Market Implications
Chapter 10 U.S. Print On Demand Market Hotspots and Opportunities
- 10.1 Market Opportunity Mapping and Growth Hotspots
- 10.2 High-Growth Applications and Customer Groups
- 10.3 Underserved Markets and White-Space Opportunities
- 10.4 Emerging Technology and Product Opportunities
- 10.5 New Capacity and Investment Hotspots
- 10.6 Market Entry and Expansion Opportunities
- 10.7 Distribution and Partnership Opportunities
- 10.8 Near-Term and Long-Term Commercial Potential
- 10.9 Opportunity Attractiveness and Execution Risks
Chapter 11 U.S. Print On Demand Market Outlook, 2025-2035
- 11.1 Market Size and Analysis
- 11.1.1 Revenue (Market Measurement: 2025: USD 3.45 billion → 2035: USD 21.36 billion)
- 11.1.2 Market Volume and Quantity Sold
- 11.1.3 Historical Market Size, 2018-2025
- 11.1.4 Base-Year Market Size, 2025
- 11.2 Market Forecast, 2025-2035
- 11.2.1 Revenue Forecast to 2035
- 11.2.2 Volume Forecast to 2035
- 11.2.3 CAGR and Year-on-Year Growth
- 11.2.4 Incremental Revenue Opportunity
- 11.3 Forecast Assumptions and Scenario Analysis
- 11.3.1 Base-Case Forecast
- 11.3.2 Optimistic and Conservative Scenarios
- 11.3.3 Technology, Pricing and Policy Sensitivities
- 11.4 Market Attractiveness and Growth Outlook
Chapter 12 U.S. Print On Demand Market Segmentation and Outlook
- 12.1 Segmentation Summary and Market Shares, 2025
- 12.2 Largest and Fastest-Growing Segments
- 12.3 By Service Type - Market Size and Forecast, 2025-2035
- 12.3.1 Segment Definition and Scope
- 12.3.2 Historical Market Size, 2018-2025
- 12.3.3 Revenue Forecast, 2025-2035
- 12.3.4 Volume Forecast, 2025-2035
- 12.3.5 Base-Year Market Share, 2025
- 12.3.6 Segment CAGR and Growth Drivers
- 12.3.7 Subsegment Market Size and Forecast
- 12.3.7.1 Apparel Printing
- 12.3.7.2 Home and Living Printing
- 12.3.7.3 Accessories Printing
- 12.3.7.4 Paper and Promotional Printing
- 12.3.8 Subsegment Pricing and Adoption Trends
- 12.3.9 Leading Suppliers and Competition
- 12.3.10 Regional Demand and Opportunities
- 12.4 By Customer Type - Market Size and Forecast, 2025-2035
- 12.4.1 Segment Definition and Scope
- 12.4.2 Historical Market Size, 2018-2025
- 12.4.3 Revenue Forecast, 2025-2035
- 12.4.4 Volume Forecast, 2025-2035
- 12.4.5 Base-Year Market Share, 2025
- 12.4.6 Segment CAGR and Growth Drivers
- 12.4.7 Subsegment Market Size and Forecast
- 12.4.7.1 Independent Creators
- 12.4.7.2 Microbrands and SMB Retailers
- 12.4.7.3 Enterprise Brands
- 12.4.7.4 Institutions and Communities
- 12.4.8 Subsegment Pricing and Adoption Trends
- 12.4.9 Leading Suppliers and Competition
- 12.4.10 Regional Demand and Opportunities
- 12.5 By Delivery Model - Market Size and Forecast, 2025-2035
- 12.5.1 Segment Definition and Scope
- 12.5.2 Historical Market Size, 2018-2025
- 12.5.3 Revenue Forecast, 2025-2035
- 12.5.4 Volume Forecast, 2025-2035
- 12.5.5 Base-Year Market Share, 2025
- 12.5.6 Segment CAGR and Growth Drivers
- 12.5.7 Subsegment Market Size and Forecast
- 12.5.7.1 Vertically Integrated Fulfillment
- 12.5.7.2 Network Aggregator Fulfillment
- 12.5.7.3 Hybrid Fulfillment
- 12.5.7.4 Marketplace-Managed Fulfillment
- 12.5.8 Subsegment Pricing and Adoption Trends
- 12.5.9 Leading Suppliers and Competition
- 12.5.10 Regional Demand and Opportunities
- 12.6 By Channel - Market Size and Forecast, 2025-2035
- 12.6.1 Segment Definition and Scope
- 12.6.2 Historical Market Size, 2018-2025
- 12.6.3 Revenue Forecast, 2025-2035
- 12.6.4 Volume Forecast, 2025-2035
- 12.6.5 Base-Year Market Share, 2025
- 12.6.6 Segment CAGR and Growth Drivers
- 12.6.7 Subsegment Market Size and Forecast
- 12.6.7.1 Owned Store Integrations
- 12.6.7.2 Online Marketplaces
- 12.6.7.3 Social Commerce
- 12.6.7.4 Enterprise and API Sales
- 12.6.8 Subsegment Pricing and Adoption Trends
- 12.6.9 Leading Suppliers and Competition
- 12.6.10 Regional Demand and Opportunities
- 12.7 Segment Growth Comparison
- 12.8 Segment Attractiveness and Priority Matrix
Chapter 13 U.S. Print On Demand End-Use and Application Market Outlook
- 13.1 End-Use Industry and Customer Demand Structure
- 13.2 Leading Applications and Customer Groups
- 13.3 End-Use Market Size, Share and Forecast
- 13.4 Major End-Use Industry Deep Dives
- 13.4.1 Customer Requirements and Use Cases
- 13.4.2 Demand and Replacement Cycles
- 13.4.3 Technical and Regulatory Considerations
- 13.4.4 Purchasing and Procurement Models
- 13.4.5 Leading Vendors and Distribution Channels
- 13.4.6 Forecast and Commercial Opportunities
- 13.5 Emerging Applications and Cross-Segment Demand
- 13.6 End-Use Industry Investment Priorities
Chapter 14 U.S. Print On Demand Geographic Market Outlook, 2025-2035
- 14.1 Regional Market Size and Country-Level Shares, 2025
- 14.2 Country Market Size Comparison, 2025
- 14.3 Country Market Forecasts, 2025-2035
- 14.4 Subregional Industrial and Demand Clusters
- 14.5 Intra-Regional Pricing and Cost Differences
- 14.6 Cross-Border Trade and Supply Networks
- 14.7 Regional Supply and Demand Balances
- 14.8 Country Opportunity Comparison and Prioritization
Note: Every listed country is covered on the structure shown under the first country.
Chapter 15 U.S. Print On Demand Technology, Innovation and Sustainability Outlook
- 15.1 Technology Landscape and Maturity
- 15.2 Product, Process and Service Innovation
- 15.3 AI, Automation and Digital Tools in the Industry
- 15.4 Technology Adoption and Performance Benchmarking
- 15.5 Innovation Pipeline and R&D Investment
- 15.6 Patent and Intellectual Property Trends
- 15.7 Energy Efficiency and Resource Management
- 15.8 Sustainability, Recycling and Circularity
- 15.9 Technology Roadmap, 2025-2035
- 15.10 Risks of Obsolescence and Technology Substitution
Chapter 16 U.S. Print On Demand Market Key Strategic Imperatives
- 16.1 Growth and Market Entry Priorities
- 16.2 High-Return Products and Segments
- 16.3 Pricing, Profitability and Cost Optimization
- 16.4 Technology Investment and Product Differentiation
- 16.5 Supply Chain Localization and Resilience
- 16.6 Distribution and Customer Acquisition
- 16.7 Partnership, Acquisition and Capacity Strategy
- 16.8 Regional Expansion Priorities
- 16.9 Short-, Medium- and Long-Term Actions
Chapter 17 Competition Outlook
- 17.1 Industry Competition Characteristics
- 17.2 Market Structure and Concentration
- 17.3 Market Share and Competitive Positioning, 2025
- 17.4 Company-Wise Revenue and Product Benchmarking
- 17.5 Production and Service Capacity Benchmarking
- 17.6 Technology, Pricing and Differentiation
- 17.7 Regional Footprint and Distribution Strength
- 17.8 Mergers, Acquisitions and Strategic Alliances
- 17.9 New Entrants and Competitive Threats
- 17.10 Porter's Five Forces and Industry Attractiveness
- 17.11 Competitive Outlook, 2025-2035
Chapter 18 Company Profiles
- 18.1 Company Coverage and Selection Criteria
- 18.2 Printful
- 18.2.1 Business Description
- 18.2.2 Company Ownership and Geographic Presence
- 18.2.3 Product and Service Portfolio
- 18.2.4 Manufacturing and Operating Footprint
- 18.2.5 Production Capacity and Expansion Plans
- 18.2.6 Financial Performance and Investment
- 18.2.7 Market Share and Competitive Position
- 18.2.8 Technology and Innovation Capabilities
- 18.2.9 Strategic Alliances or Partnerships
- 18.2.10 Recent Developments
- 18.2.11 Growth Strategy and Outlook
- 18.3 Printify
- 18.4 Gelato
- 18.5 CustomCat
- 18.6 Gooten
- 18.7 Other Relevant Market Participants
Note: Every listed company is profiled on the structure shown under the first company. The company list is preliminary and may change based on research findings, market developments, data availability and client requirements.
Chapter 19 Disclaimer
- 19.1 Research and Forecast Disclaimer
- 19.2 Data Source and Estimation Limitations
Note: The depth of individual sections depends on data availability for this market. Volume, capacity, trade and other unit-based metrics are included where applicable.

