
Near-universal internet and bundles widen streaming reach
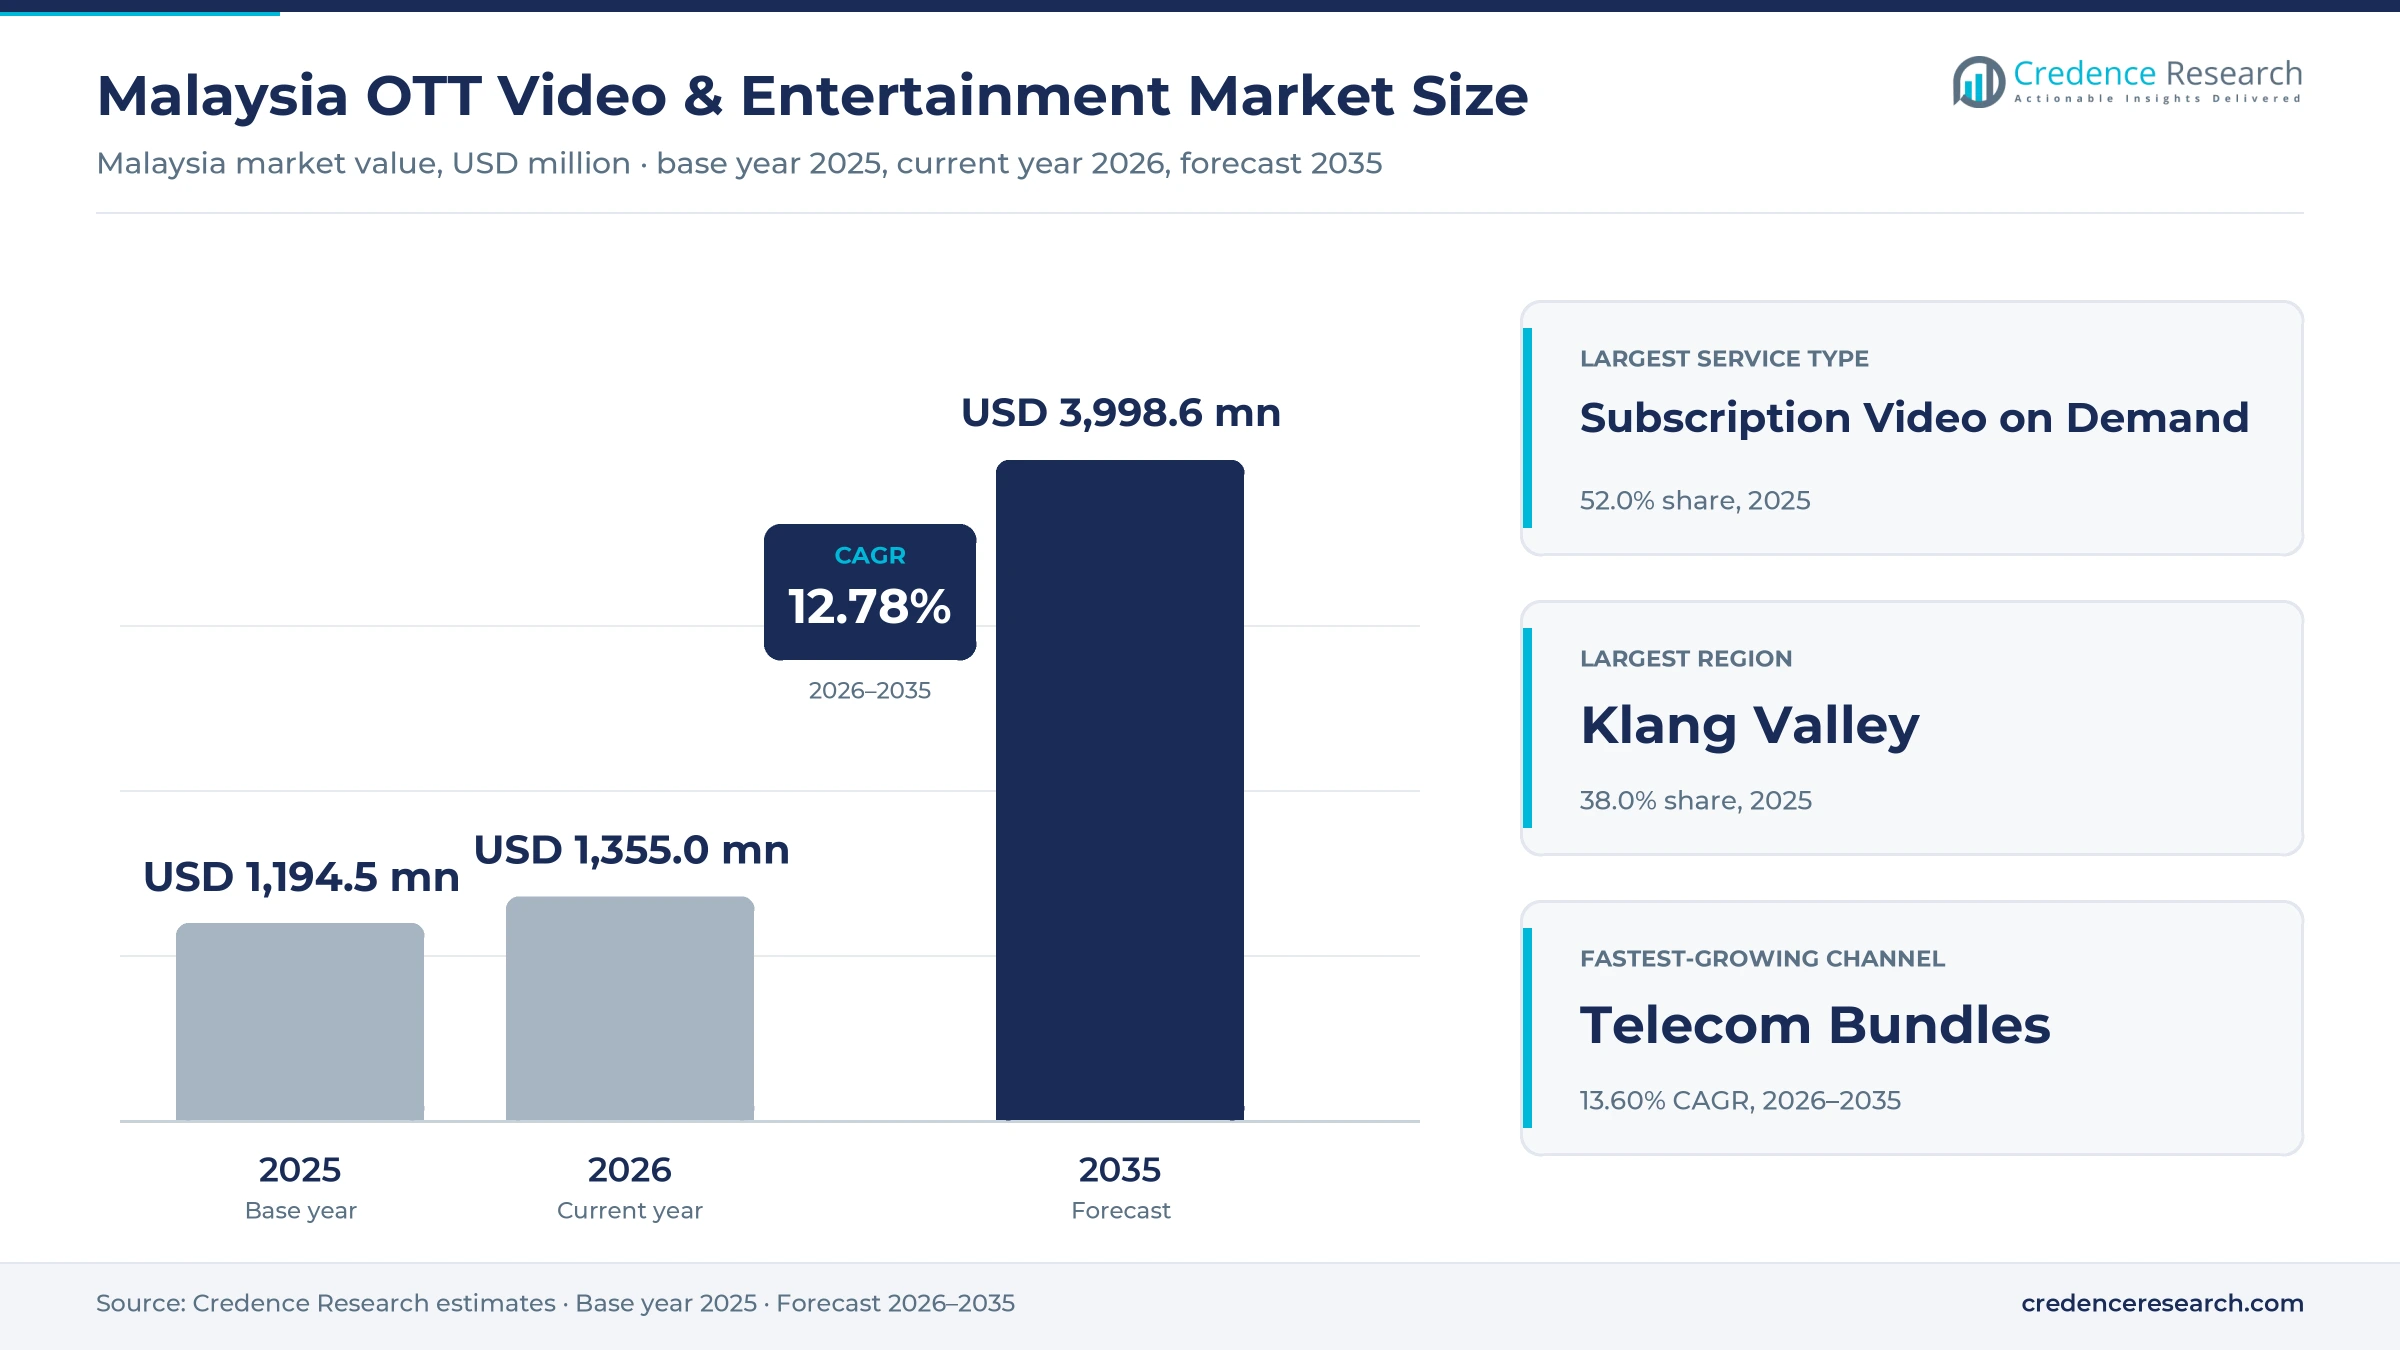
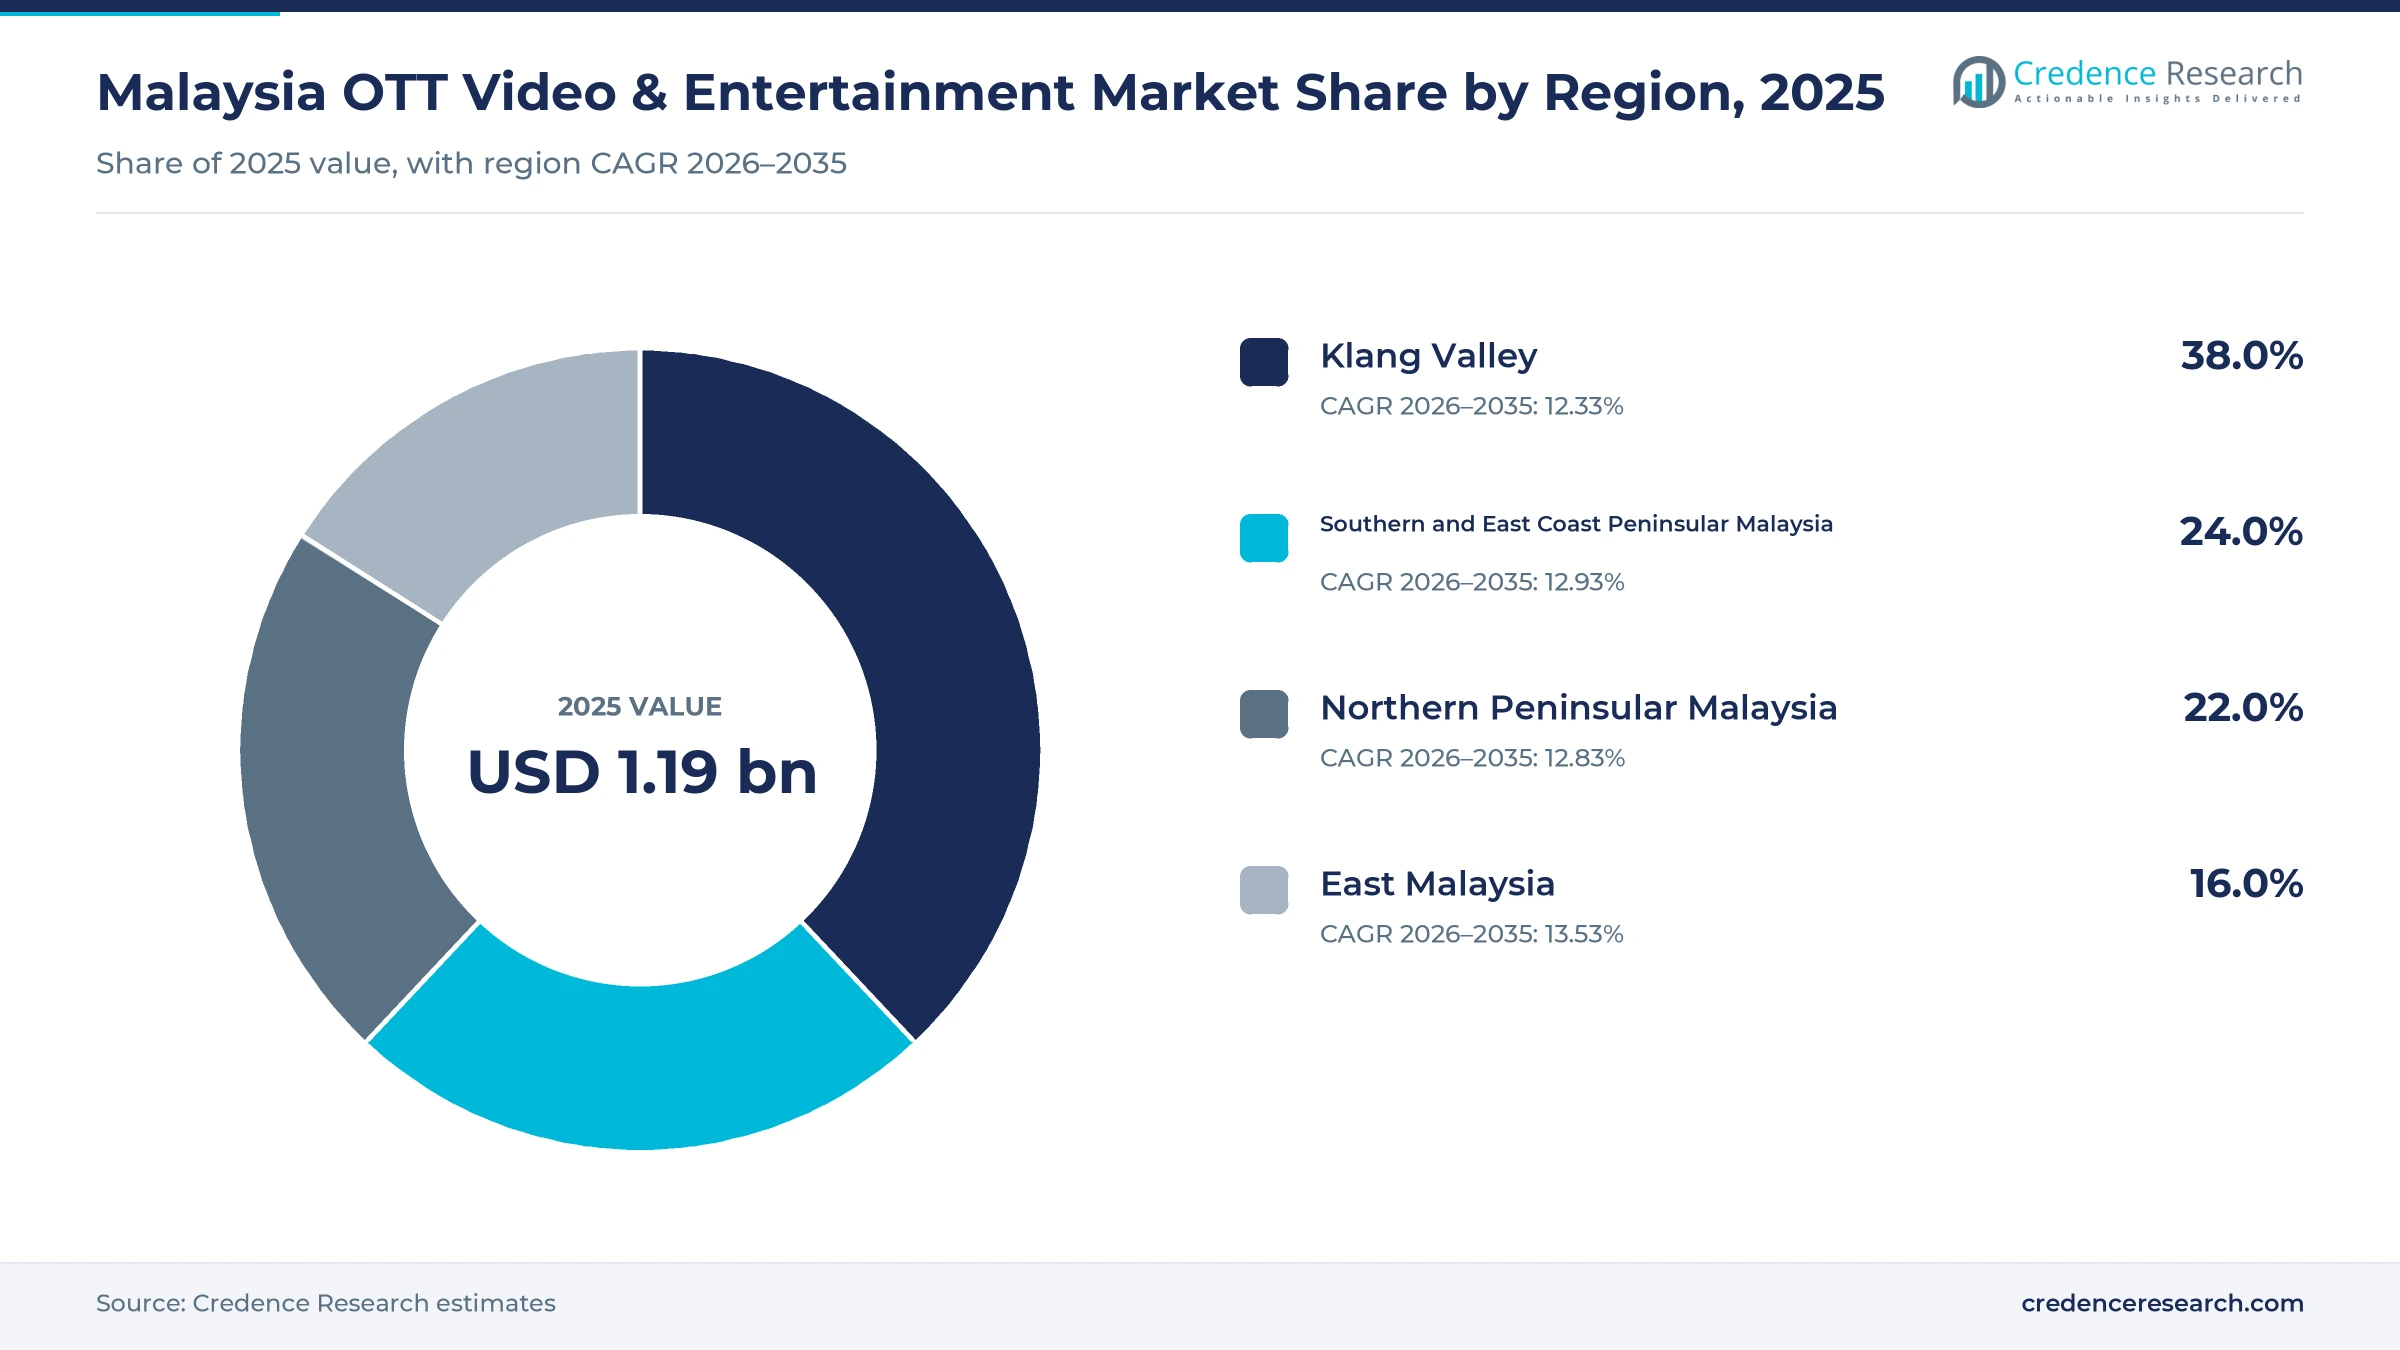
The Malaysia OTT video & entertainment market was valued at USD 1.19 billion in 2025 and is projected to increase from USD 1.35 billion in 2026 to USD 4.00 billion by 2035, registering a CAGR of 12.78% during 2026–2035. Demand comes from almost universal internet access, fast 5G rollout, the move of pay-TV households to app-based packs and strong appetite for Malay, Chinese and Tamil content. Klang Valley held the largest regional share, 38.0% in 2025, because Kuala Lumpur and Selangor combine the highest incomes with full household internet access. East Malaysia grows fastest at 13.53% a year, as Sabah and Sarawak close their connectivity gap and more homes buy streaming packs for the first time. Pay-TV and broadband operators now sell aggregated packs that combine linear channels with global streaming apps, which turns former rivals into distribution partners for subscription services.
Which streaming services and fees are counted in Malaysia?
The estimate measures consumer and advertiser spending on internet-delivered video in Malaysia, including subscription, advertising-funded and transactional video on demand and live streaming of sports and events. It covers fees paid directly to apps and websites, through telecom and broadband bundles, through pay-TV aggregator packs and through device app stores. Values are stated in USD million at current prices, converted from ringgit at average annual exchange rates.
The estimate excludes linear satellite and terrestrial broadcast fees, cinema box office, music and audio streaming, games and user-generated video income earned by creators. The value chain runs from studios, broadcasters and sports rights holders through streaming platforms and aggregators to telecom carriers, device makers and households.
Malaysia OTT Video & Entertainment Market Insights
- The Malaysia OTT video & entertainment market was valued at USD 1.19 billion in 2025 and is projected to reach USD 4.00 billion by 2035, registering a CAGR of 12.78% during 2026–2035.
- Klang Valley held 38.0% of 2025 value, because Kuala Lumpur and Selangor combine high incomes with near-complete household internet access.
- Subscription video on demand led with 52.0% of 2025 value, since global and regional platforms sell monthly plans across every price tier.
- Netflix raised Malaysian plan prices from Oct. 23, 2026, with its Basic plan moving from RM29.90 to RM33.90 a month.
- Telecom bundles grow fastest at 13.60% a year during 2026–2035, as carriers package streaming apps with mobile data plans.
Subscription services and phones carry most streaming value
Why do subscription services lead streaming spending?
Based on service type, the market is categorized into subscription video on demand, advertising video on demand, transactional video on demand and live OTT streaming. Subscription Video on Demand led with 52.0% of 2025 value, because global and regional platforms sell monthly plans to most connected homes. Advertising Video on Demand grows fastest at 13.33% a year, as free tiers and ad-supported plans reach price-sensitive viewers outside large cities.
How do telecom bundles change streaming distribution?
Based on distribution channel, the market is categorized into direct-to-consumer apps and web, telecom bundles, pay-TV and ISP aggregation, and device and app-store billing. Direct-to-Consumer Apps and Web led with 45.0% of 2025 value, because viewers still sign up on platform websites and apps. Telecom Bundles grow fastest at 13.60% a year, as mobile carriers sell several streaming apps with data in one monthly plan.
Which screens carry most streaming in Malaysia?
Based on device type, the market is categorized into smartphones and tablets, smart TVs and connected TV, laptops and desktops, and streaming devices and consoles. Smartphones and Tablets led with 48.0% of 2025 value, because most viewers watch on mobile networks with wide 5G coverage. Smart TVs and Connected TV grow fastest at 13.61% a year, as families move shared viewing to large screens and aggregator boxes.
| Segment Group | Leading Sub-segment | Share, 2025 | Fastest-growing Sub-segment | CAGR, 2026–2035 |
|---|---|---|---|---|
| By Service Type | Subscription Video on Demand | 52.0% | Advertising Video on Demand | 13.33% |
| By Distribution Channel | Direct-to-Consumer Apps and Web | 45.0% | Telecom Bundles | 13.60% |
| By Device Type | Smartphones and Tablets | 48.0% | Smart TVs and Connected TV | 13.61% |
Request a Free Sample
Fill in your details and we'll send you a free sample report.
- Sample data tables & charts
- Research methodology
Connectivity, pay-TV bundling and local shows lift demand
How does near-universal digital connectivity lift streaming?
Near-universal digital connectivity lifts streaming, because almost every household can now reach video entertainment at home and on mobile networks. Internet users reached about 98.0% of the population in 2024, according to World Bank data. Household internet access rose to 97.1% in 2025, up from 96.8% a year earlier, based on national household survey data. Internet coverage in populated areas reached 98.82% by July 31, 2025, while 5G covered 82.4% of populated areas, according to Malay Mail. 5G mobile broadband penetration also reached 82.7 subscriptions per 100 inhabitants. As a result, smartphones and tablets hold 48.0% of 2025 value, and high-definition streaming becomes practical outside large cities.
Why is the shift from linear pay-TV accelerating?
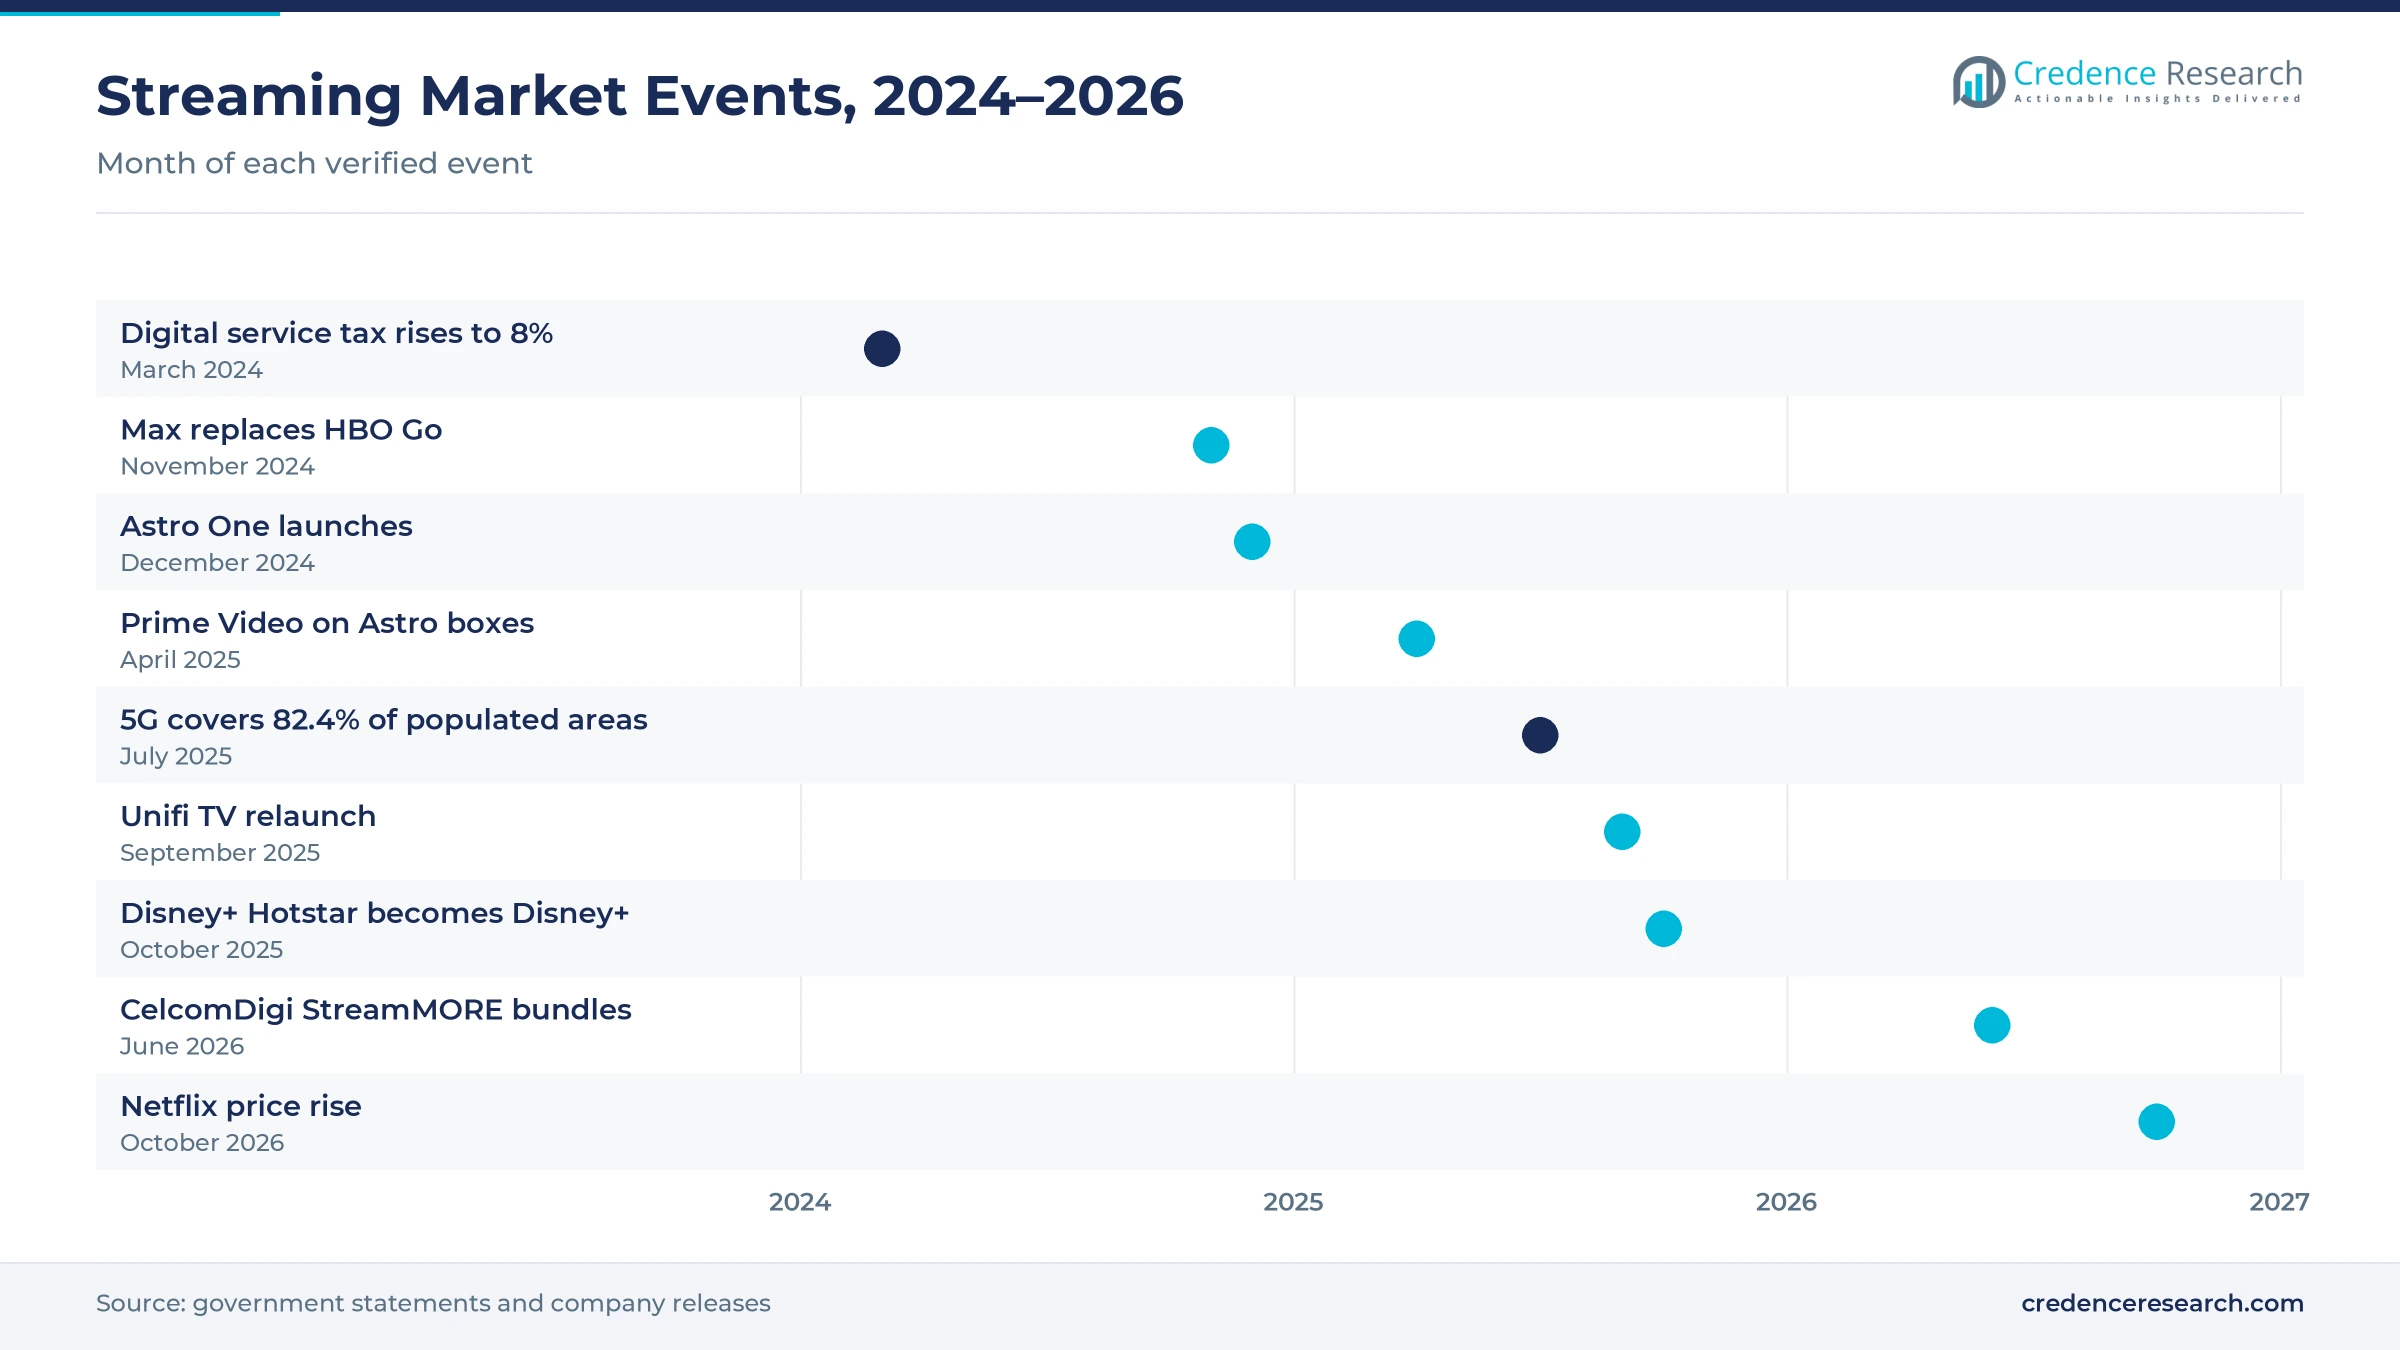
The shift from linear pay-TV is accelerating, because operators now sell streaming apps inside their own packs instead of competing against them. Astro launched Astro One in December 2024, with packs from RM49.99 that give access to up to 14 global streaming apps, according to Astro. Astro also reported that net video customer losses fell 84% in its 2025 financial year, while gross pay-TV additions rose 52%. Telekom Malaysia relaunched Unifi TV on Sept. 13, 2025, with more than 70 channels and 15 streaming services, plans from RM8 a month and access for non-Unifi customers, according to TM. Consequently, pay-TV and ISP aggregation holds a steady part of streaming spending.
How do local content and engagement drive viewing?
Local content and streaming engagement drive viewing, because Malaysian audiences favor video entertainment in Malay, Chinese and Tamil, from dramas to films and sports. Local content took 79% of total watch time on Astro in the 12 months to January 2025, up from 64% five years earlier. Astro's sooka streaming service lifted monthly active users 13% to 1.2 million, and its paying base doubled in the same year. In its latest quarter, sooka also recorded 204 million monthly minutes, its highest on record. Local films earned a record RM247.95 million at the box office in 2025, which later builds demand for streaming windows. As a result, series and dramas keep strong engagement across services.
Why are telecom carriers bundling streaming apps?
Telecom carriers are bundling streaming apps, because video lifts data use and helps them keep mobile customers. CelcomDigi launched StreamMORE bundles in June 2026, starting at RM19.90 a month with iQIYI, Viu Premium, Vision+ and 5GB of data. Its Family Bundle costs RM79.90 a month and combines Disney+ Premium, sooka Premium and Viu Premium with 10GB of data. The Sports Bundle pairs Prime Video with sooka Premium and 100GB of data for RM59.90 a month. In turn, telecom bundles grow fastest at 13.60% a year, as carriers price several services below their combined stand-alone fees. This approach also moves billing to the carrier, which lowers payment friction for prepaid users.
Price rises, rebrands and sports streaming reshape services
How is the rise in subscription prices playing out?
Subscription prices are rising, because global platforms are passing higher content and tax costs to Malaysian viewers. Netflix raised its Malaysian prices from Oct. 23, 2026, according to The Star, with Basic moving from RM29.90 to RM33.90 and Standard from RM49.90 to RM55.90 a month. Its Premium plan rose from RM62.90 to RM69.90, while each extra member now costs RM14.90 a month. Service tax on digital services from foreign providers had already risen from 6% to 8% on March 1, 2024. As a result, price-sensitive households rotate between services, which supports growth in advertising-funded plans at 13.33% a year. Annual plans and bundles also gain favor as households look for lower prices per service.
Why are platform rebrands and super-aggregation rising?
Platform rebrands and super-aggregation are rising, because global owners are merging catalogs while local operators gather apps under one bill. Max replaced HBO Go in Malaysia on Nov. 19, 2024, and launched on the same day in six other Asian markets. Disney+ Hotstar became Disney+ on Oct. 9, 2025, with Hulu titles replacing the Star brand for general entertainment. In June 2025, Astro One listed Max, Prime Video, Netflix, Disney+ Hotstar, Viu, iQIYI and WeTV among 14 apps on its boxes. Therefore, viewers increasingly reach streaming platforms through a single home screen and billing account. This shift gives aggregators more say over pricing and placement of each app.
Can live sports streaming open new revenue?
Live sports streaming offers a clear opening, because Malaysian viewers follow badminton, football and global tournaments in large numbers. Astro reported a combined 15.4 million viewers for UEFA Euro 2024, Copa America 2024 and the Paris Olympics. The PETRONAS Malaysia Open 2026 drew more than 37 million total views, while the Piala FA final drew 5.4 million total views. Sooka's VIP paying base also grew 44% year on year in Astro's latest quarter. Platforms that combine live rights with highlights and on-demand replays could therefore lift live OTT streaming, which holds a growing part of OTT video & entertainment spending through 2035. Short highlight clips can also draw new viewers to full paid plans.
Is there room to grow in East Malaysia and on TVs?
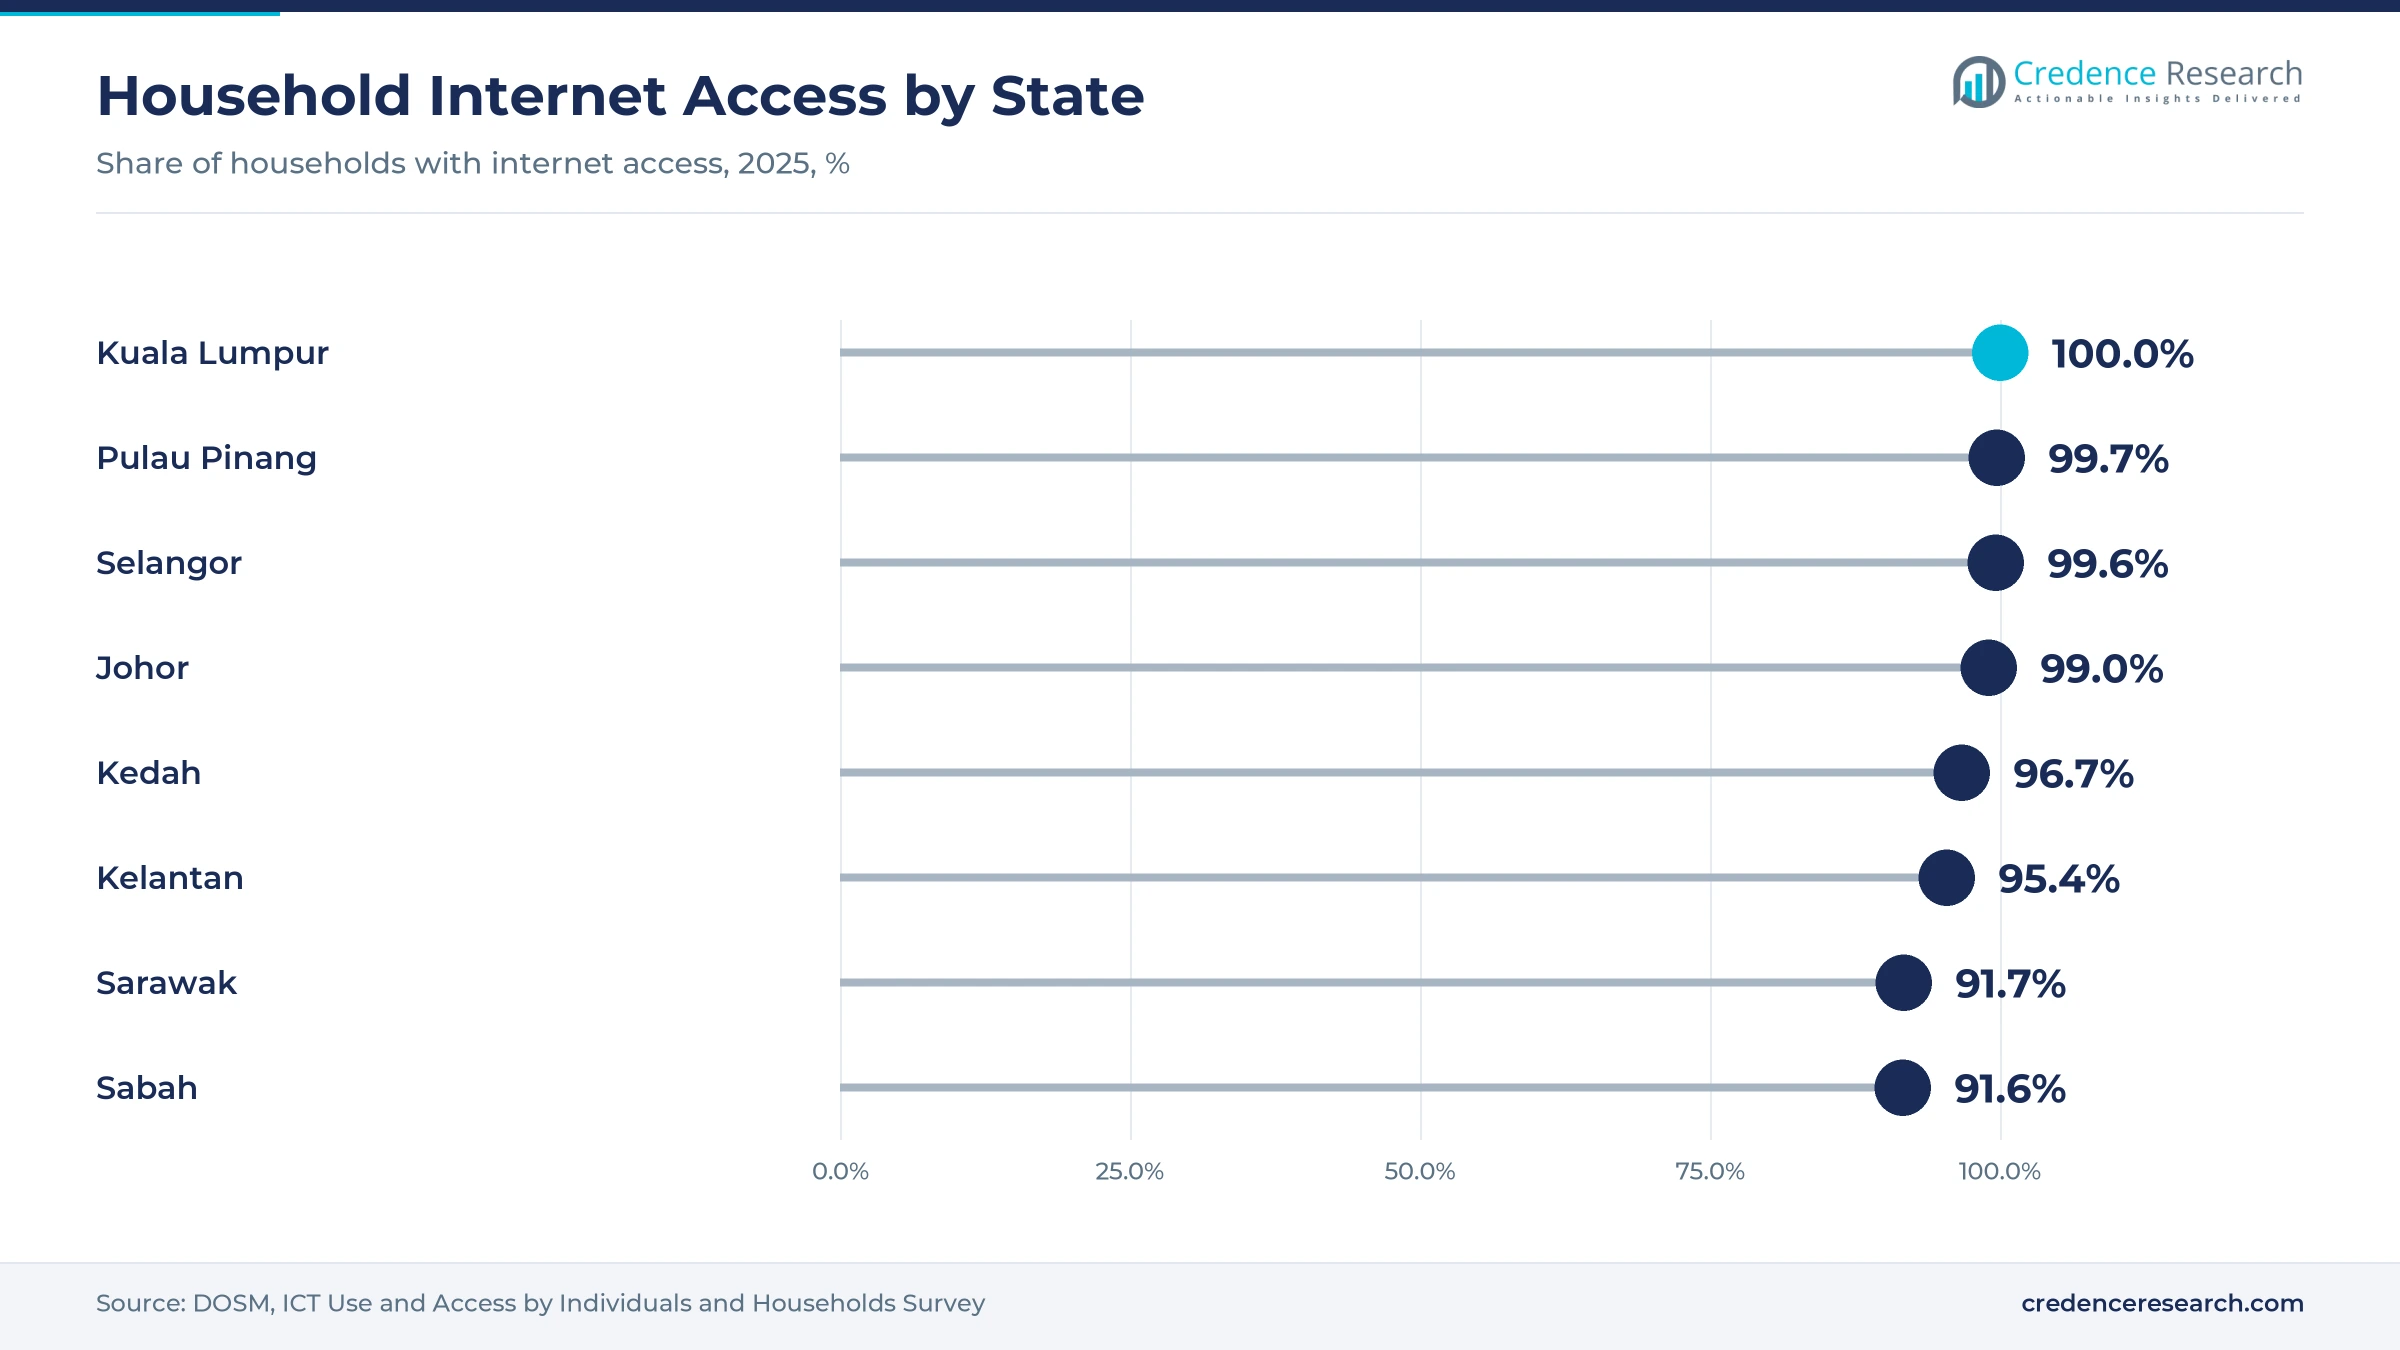
East Malaysia and the living-room screen offer a second opening, because both still have room to add paying homes. Household internet access reached 91.6% in Sabah and 91.7% in Sarawak in 2025, compared with 100.0% in Kuala Lumpur. National 5G coverage of populated areas reached 82.4% from 7,489 transmitter sites built by Digital Nasional Bhd. Unifi TV now syncs one account across TV boxes, phones, tablets and smart TVs. In turn, smart TVs and connected TV grow fastest at 13.61% a year, while demand for smart TVs rises with household streaming budgets. Rural homes that gain fiber or 5G links often start with phone viewing and then add a TV plan.
Piracy, price fatigue and content costs weigh on growth
How does piracy limit paid streaming?
Piracy limits paid streaming, because illicit set-top boxes and apps offer channels and films at very low prices. Astro has estimated that the industry loses about RM3 billion a year to digital piracy. The Intellectual Property High Court has ruled that selling illicit streaming devices that give access to copyrighted works is infringement. However, enforcement still depends on blocking orders and raids, so paid services must compete on price and convenience.
Why does price fatigue raise churn?
Price fatigue raises churn, because households already pay for broadband, mobile data and several video entertainment apps each month. Recent price rises and higher service tax add to monthly bills for families with more than one plan. As a result, many viewers subscribe for a single series or tournament and cancel afterward. Platforms respond with annual plans, ad-supported tiers and bundles that lower the effective price per service.
How do content and sports rights costs weigh?
Content and sports rights costs weigh on margins, because platforms must fund local dramas while bidding for regional football, badminton and Asian series. Rights fees often rise faster than subscriber numbers in a mid-sized market with many competing services. Consequently, smaller platforms share rights or sublicense titles to larger partners. Operators with production arms and long rights contracts can spread these costs across television, streaming and social channels.
Will a soft advertising market slow free streaming?
A soft advertising market can slow free streaming, because advertising-funded services depend on brand budgets that follow consumer sentiment. Astro described muted consumer sentiment during 2025, even as advertising began to recover. In turn, platforms that rely on ads face uneven quarterly income and lower rates per view. Better audience data, addressable TV ads and partnerships with retailers can help reduce this risk over the forecast period.
Klang Valley leads while East Malaysia grows fastest
| Region | Value, 2025 (USD billion) | Share, 2025 | CAGR, 2026–2035 |
|---|---|---|---|
| Klang Valley | 0.45 | 38.0% | 12.33% |
| Southern and East Coast Peninsular Malaysia | 0.29 | 24.0% | 12.93% |
| Northern Peninsular Malaysia | 0.26 | 22.0% | 12.83% |
| East Malaysia | 0.19 | 16.0% | 13.53% |
Why does the Klang Valley lead streaming spending?
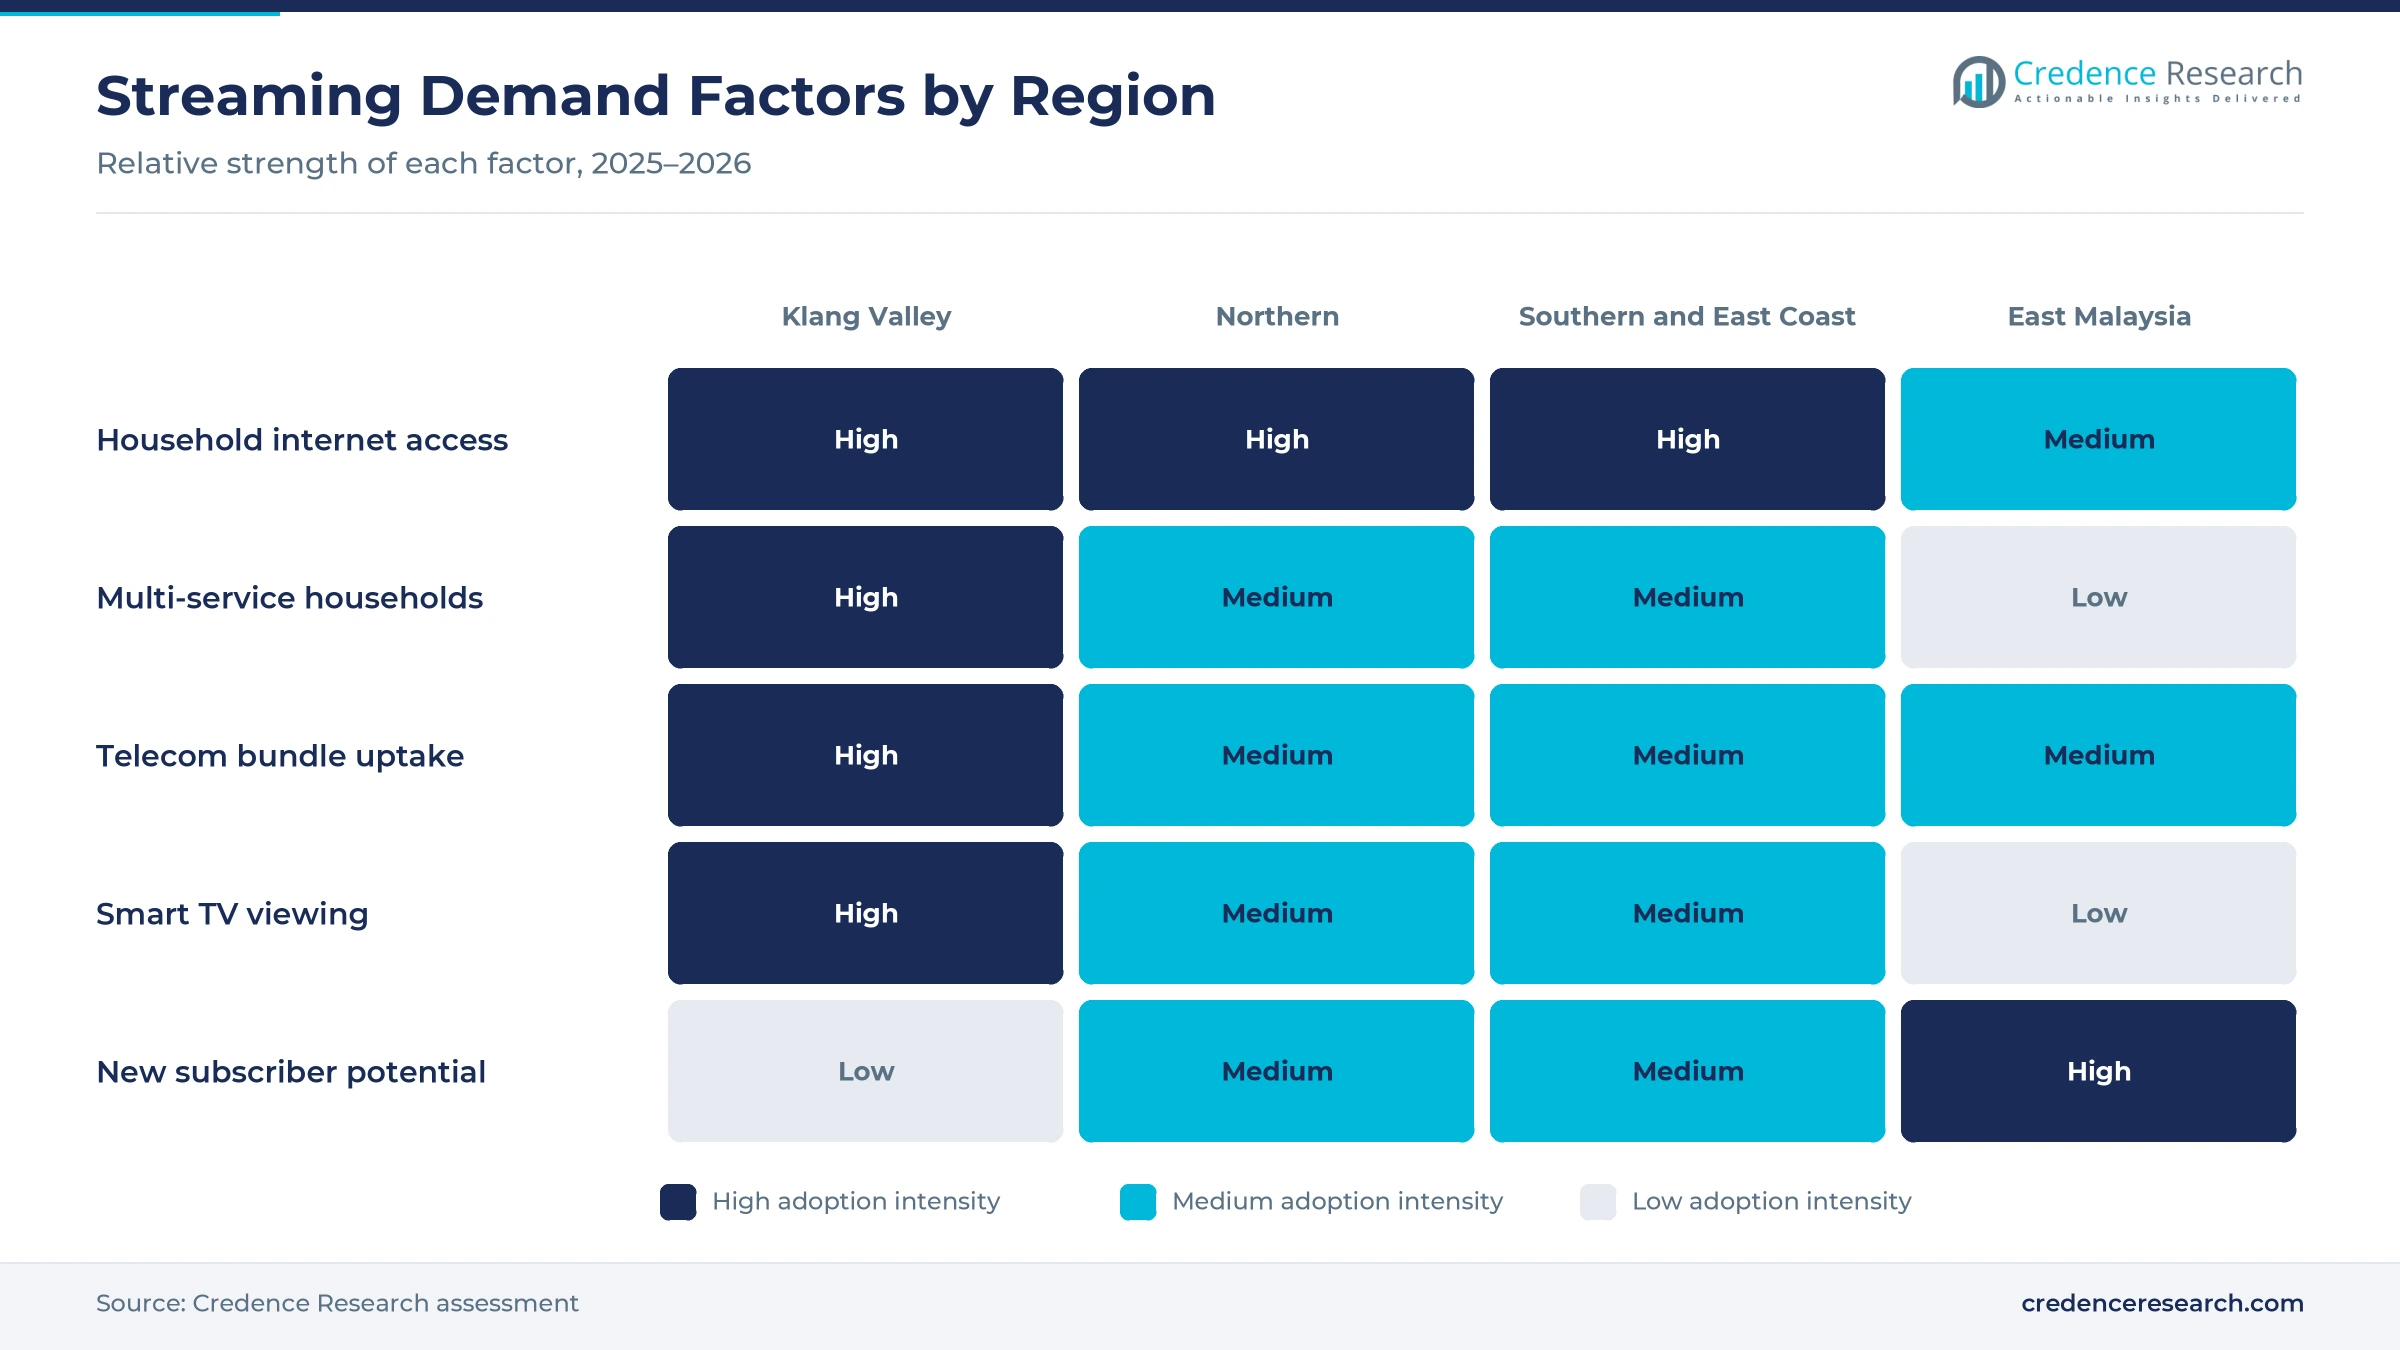
Klang Valley held 38.0% of 2025 value and grows at 12.33% a year, because Kuala Lumpur and Selangor combine the highest household incomes with near-complete internet access. Household internet access reached 100.0% in Kuala Lumpur and 99.6% in Selangor in 2025. Many homes in the region pay for several services and premium plans. The region also hosts most broadcasters, studios and data center capacity that support local delivery. As a result, new platforms usually launch campaigns and partnerships in the Klang Valley first.
What drives demand in the southern and eastern states?
Southern and East Coast Peninsular Malaysia held 24.0% of 2025 value and grows at 12.93% a year, because Johor reached 99.0% household internet access in 2025. Kelantan, Terengganu and Pahang recorded lower access, between 95.4% and 96.1%, which leaves room for new homes. Malay dramas, religious programs and football draw strong audiences across these states. Each newly connected home in the east coast states therefore adds paying potential for local and regional platforms.
How does Northern Peninsular Malaysia add viewers?
Northern Peninsular Malaysia held 22.0% of 2025 value and grows at 12.83% a year, because Penang reached 99.7% household internet access in 2025. Kedah, Perlis and Perak recorded access between 96.1% and 96.9%, which supports mobile viewing in smaller towns. Chinese and Malay content both draw large audiences across the region. Penang's urban households support Chinese-language dramas on regional platforms, while smaller towns rely more on telecom bundles and free ad-supported apps.
Why is East Malaysia growing fastest?
East Malaysia held 16.0% of 2025 value and grows fastest at 13.53% a year, because Sabah and Sarawak are closing the connectivity gap with the peninsula. Household internet access reached 91.6% in Sabah and 91.7% in Sarawak in 2025, up from about 91% a year earlier. New 5G sites and fiber links let more rural homes stream on phones and TVs for the first time.
Launches, rebrands and new bundles from 2024 to 2026
| Development | Status and market relevance |
|---|---|
| In November 2024, Max replaced HBO Go in Malaysia and launched on the same day in six other Asian markets. | Brings Warner Bros. Discovery content under one direct service |
| In December 2024, Astro launched Astro One packs from RM49.99 with access to up to 14 global streaming apps. | Moves pay-TV homes to aggregated streaming bundles |
| In September 2025, Telekom Malaysia relaunched Unifi TV with more than 70 channels, 15 streaming services and plans from RM8. | Opens the platform to non-Unifi customers |
| In October 2025, Disney+ Hotstar was rebranded as Disney+ in Malaysia, with Hulu titles added. | Simplifies the Disney catalog for Malaysian viewers |
| In June 2026, CelcomDigi launched StreamMORE bundles from RM19.90 a month with Disney+, Prime Video, iQIYI, Viu and sooka. | Expands telecom-led streaming distribution |
Aggregator boxes, 5G and smart TVs change how viewers watch
- Aggregator boxes from pay-TV and broadband operators put linear channels and several streaming apps on one home screen with one bill.
- 5G networks covering more than four-fifths of populated areas let viewers stream high-definition video on phones outside fixed-line areas.
- Connected TVs and internet TV services move family viewing from satellite dishes to apps, which lifts demand for premium plans.
- Ad-supported tiers and short-form vertical series let platforms reach price-sensitive viewers and test new formats at lower cost.
Need a Custom Version of This Report?
Tailor the scope, geography, or segments to your exact requirements.
- Custom geography or segment scope
- Direct access to our analyst team
Global platforms and local broadcasters compete on bundles
Competition in video entertainment combines global streaming platforms, regional Asian services and local broadcasters that also act as aggregators. Netflix competes on original series and films and raised its Malaysian plan prices in October 2026. Astro runs the sooka service and sells Astro One packs that bundle Netflix, Prime Video, Max, Disney+ Hotstar, Viu, iQIYI and WeTV. Disney+ rebranded from Disney+ Hotstar in October 2025, while Max replaced HBO Go in November 2024. Viu and iQIYI focus on Asian dramas and reach many viewers through telecom bundles. Telekom Malaysia and CelcomDigi sell streaming apps with broadband and mobile plans, which makes carriers key partners. Companies compete on local content, sports rights, price per service and access through bundles and connected TVs.
Companies profiled and their roles in this market
| Company | Type | Role in the market |
|---|---|---|
| Netflix, Inc. | Global platform | Subscription streaming; raised Malaysian plan prices from Oct. 23, 2026 |
| Astro Malaysia Holdings Berhad | Local broadcaster and aggregator | Runs sooka and Astro One packs with 14 streaming apps |
| The Walt Disney Company (Disney+) | Global platform | Rebranded Disney+ Hotstar as Disney+ in October 2025 |
| PCCW Media (Viu) | Regional platform | Asian dramas; sold in CelcomDigi and Unifi TV bundles |
| iQIYI, Inc. | Regional platform | Chinese and Asian series; part of CelcomDigi StreamMORE bundles |
| Tencent Holdings Limited (WeTV) | Regional platform | Asian series; listed among Astro One apps |
| Amazon.com, Inc. (Prime Video) | Global platform | Available on Astro Ultra and Ulti boxes since April 2025 |
| WarnerMedia Direct Asia Pacific, LLC (HBO Max) | Global platform | Max replaced HBO Go in Malaysia in November 2024 |
Credence Research view on bundling and local content
Credence Research's view is that Malaysian streaming video entertainment will grow strongly through 2035, with bundles rather than single apps driving most new subscriptions. Internet access is already near-universal, so growth now depends on how many services each home keeps and how much it pays. Local content took 79% of Astro watch time, which favors platforms with Malay, Chinese and Tamil series. Subscription services should keep the largest share of OTT video & entertainment spending. However, piracy and price fatigue will keep churn high for single-service platforms.
How the streaming spending estimate was built
The report uses 2025 as the base year, with values in USD million at current prices. Market values come from the Credence Research model, which combines connected households, paying subscriptions, average prices, bundle mix and advertising spend. Regional shares and segment splits by service type, distribution channel and device type are Credence Research estimates. Sources used are national household survey data, World Bank data, government statements, company releases and news reports, and no interviews or surveys were used.
Bundles, live sports and connected TVs set the path to 2035
The market is expected to reach USD 4.00 billion by 2035, a 12.78% CAGR during 2026–2035, as more homes keep several video entertainment services through telecom and pay-TV bundles. Growth should be strongest in East Malaysia and on smart TVs, while the Klang Valley keeps the largest share. Ad-supported plans and live sports will add new paying and free viewers. In contrast, wider piracy or sharp price increases would slow subscription growth, especially among younger viewers who switch services often.
Frequently Asked Questions
How big is the Malaysia OTT video & entertainment market?
Which region leads streaming spending in Malaysia?
Which region grows fastest?
Which service type holds the largest share?
How are pay-TV operators adapting to streaming?
Which distribution channel grows fastest?
Who are the leading companies in Malaysian streaming?
What are the main risks to growth?
Table of Content
Chapter 1 Market Segmentation
- 1.1 Segmentation Framework
- 1.1.1 Product and Service Classification
- 1.1.2 Application and End-Use Classification
- 1.1.3 Technology and Solution Classification
- 1.1.4 Customer and Distribution Channel Classification
- 1.1.5 Geographic Segmentation
- 1.1.6 Market Segment Definitions and Boundaries
- 1.2 By Service Type
- 1.2.1 Subscription Video on Demand
- 1.2.2 Advertising Video on Demand
- 1.2.3 Transactional Video on Demand
- 1.2.4 Live OTT Streaming
- 1.3 By Device Type
- 1.3.1 Smartphones and Tablets
- 1.3.2 Smart TVs and Connected TV
- 1.3.3 Laptops and Desktops
- 1.3.4 Streaming Devices and Consoles
Chapter 2 Introduction
- 2.1 Report Objectives and Scope
- 2.2 Product Definition and Industry Terminology
- 2.3 Market Inclusions and Exclusions
- 2.4 Research Process
- 2.4.1 Primary Research and Expert Interviews
- 2.4.2 Secondary Research and Source Review
- 2.4.3 Top-Down and Bottom-Up Estimation
- 2.4.4 Data Triangulation and Verification
- 2.5 Market Size Measurement Basis
- 2.5.1 2025: USD 1.19 billion → 2035: USD 4.00 billion
- 2.6 Historical and Forecast Reference Periods
- 2.6.1 Historical Period: 2018-2025
- 2.6.2 Base Year: 2025
- 2.6.3 Forecast Period: 2025-2035
- 2.7 Research Assumptions and Limitations
Chapter 3 Executive Summary
- 3.1 Market Snapshot and Key Findings
- 3.2 Base-Year Market Size, 2025
- 3.3 Forecast Market Size, 2035
- 3.4 Revenue and Volume Growth Outlook
- 3.5 Key Demand and Supply Indicators
- 3.6 Leading Market Segments
- 3.7 Fastest-Growing Market Opportunities
- 3.8 Regional Performance Highlights
- 3.9 Technology and Industry Transformation
- 3.10 Competitive Landscape Summary
- 3.11 Analyst View and Strategic Implications
Chapter 4 Malaysia OTT Video & Entertainment Market Trends and Developments
- 4.1 Historical Industry Development, 2018-2025
- 4.2 Recent Market Trends and Developments
- 4.3 Demand and Customer Behavior Trends
- 4.4 Technology and Product Innovation
- 4.5 Artificial Intelligence, Automation and Digitalization
- 4.6 Local Manufacturing and Supply Chain Realignment
- 4.7 Industry Partnerships, Mergers and Acquisitions
- 4.8 Sustainability and Circular Economy Developments
- 4.9 Government and Private Sector Investment Trends
- 4.10 Emerging Business Models and Commercialization
- 4.11 Industry Developments and Announcements
Chapter 5 Malaysia OTT Video & Entertainment Market Production, Supply and Demand Analysis
- 5.1 Demand Trend and Consumption Analysis, 2018-2025
- 5.2 Demand Forecast, 2025-2035
- 5.3 Production and Output Trend, 2018-2025
- 5.4 Production and Output Forecast, 2025-2035
- 5.5 Installed Capacity and Capacity Utilization
- 5.6 Company-Wise Production Plants and Statistics
- 5.6.1 Installed Production Capacity
- 5.6.2 Actual Production
- 5.6.3 Planned Capacity and Expansion Targets
- 5.7 Supply Chain Structure and Procurement Trends
- 5.8 Supply-Demand Gap and Bottlenecks
- 5.9 Import Dependence and Sourcing Structure
- 5.10 Contract Manufacturing and Outsourcing
- 5.11 Regional Supply and Demand Concentration
Chapter 6 Malaysia OTT Video & Entertainment Market Pricing Analysis
- 6.1 Pricing Structure and Measurement
- 6.2 Historical Pricing Trends, 2018-2025
- 6.3 Pricing Outlook, 2025-2035
- 6.4 Average Selling Price and Unit Economics
- 6.5 Pricing by Product and Market Segment
- 6.6 Geographic Pricing Differences
- 6.7 Key Input, Energy, Labor and Logistics Costs
- 6.8 Contract Pricing and Purchasing Models
- 6.9 Pricing Sensitivity and Competitive Positioning
- 6.10 Price, Margin and Profitability Implications
Chapter 7 Malaysia OTT Video & Entertainment Market Dynamics
- 7.1 Market Growth Drivers
- 7.1.1 Demand-Side Drivers
- 7.1.2 Technology and Innovation Drivers
- 7.1.3 Infrastructure and Investment Drivers
- 7.1.4 Regulatory and Policy Drivers
- 7.2 Market Restraints
- 7.2.1 Cost and Affordability Constraints
- 7.2.2 Technology and Adoption Barriers
- 7.2.3 Supply Chain and Operational Constraints
- 7.3 Market Challenges
- 7.3.1 Competitive Pressure and Margin Erosion
- 7.3.2 Skills, Infrastructure and Implementation Gaps
- 7.4 Emerging Market Opportunities
- 7.5 Market Dynamics Impact and Time-Horizon Assessment
Chapter 8 Malaysia OTT Video & Entertainment Value Chain Analysis
- 8.1 Industry Value Chain Overview
- 8.2 Upstream Suppliers and Critical Inputs
- 8.3 Technology and Component Providers
- 8.4 Manufacturing or Service Delivery
- 8.5 Distribution, Channel Partners and Integrators
- 8.6 Downstream Applications and End Users
- 8.7 Value Addition and Profit Pools
- 8.8 Vertical Integration and Outsourcing
- 8.9 Supplier Concentration and Risk
- 8.10 Supply Chain Localization and Resilience
Chapter 9 Malaysia OTT Video & Entertainment Market Regulations and Policies
- 9.1 Relevant Laws, Standards and Compliance Frameworks
- 9.2 Product, Service, Safety and Quality Requirements
- 9.3 Government Policies, Incentives and Subsidies
- 9.4 Imports, Exports and Trade Barriers
- 9.5 Public Procurement and Local Content Requirements
- 9.6 Environmental and Sustainability Compliance
- 9.7 Data Protection, AI and Cybersecurity Compliance
- 9.8 Upcoming Policy Changes and Market Implications
Chapter 10 Malaysia OTT Video & Entertainment Market Hotspots and Opportunities
- 10.1 Market Opportunity Mapping and Growth Hotspots
- 10.2 High-Growth Applications and Customer Groups
- 10.3 Underserved Markets and White-Space Opportunities
- 10.4 Emerging Technology and Product Opportunities
- 10.5 New Capacity and Investment Hotspots
- 10.6 Market Entry and Expansion Opportunities
- 10.7 Distribution and Partnership Opportunities
- 10.8 Near-Term and Long-Term Commercial Potential
- 10.9 Opportunity Attractiveness and Execution Risks
Chapter 11 Malaysia OTT Video & Entertainment Market Outlook, 2025-2035
- 11.1 Market Size and Analysis
- 11.1.1 Revenue (Market Measurement: 2025: USD 1.19 billion → 2035: USD 4.00 billion)
- 11.1.2 Market Volume and Quantity Sold
- 11.1.3 Historical Market Size, 2018-2025
- 11.1.4 Base-Year Market Size, 2025
- 11.2 Market Forecast, 2025-2035
- 11.2.1 Revenue Forecast to 2035
- 11.2.2 Volume Forecast to 2035
- 11.2.3 CAGR and Year-on-Year Growth
- 11.2.4 Incremental Revenue Opportunity
- 11.3 Forecast Assumptions and Scenario Analysis
- 11.3.1 Base-Case Forecast
- 11.3.2 Optimistic and Conservative Scenarios
- 11.3.3 Technology, Pricing and Policy Sensitivities
- 11.4 Market Attractiveness and Growth Outlook
Chapter 12 Malaysia OTT Video & Entertainment Market Segmentation and Outlook
- 12.1 Segmentation Summary and Market Shares, 2025
- 12.2 Largest and Fastest-Growing Segments
- 12.3 By Service Type - Market Size and Forecast, 2025-2035
- 12.3.1 Segment Definition and Scope
- 12.3.2 Historical Market Size, 2018-2025
- 12.3.3 Revenue Forecast, 2025-2035
- 12.3.4 Volume Forecast, 2025-2035
- 12.3.5 Base-Year Market Share, 2025
- 12.3.6 Segment CAGR and Growth Drivers
- 12.3.7 Subsegment Market Size and Forecast
- 12.3.7.1 Subscription Video on Demand
- 12.3.7.2 Advertising Video on Demand
- 12.3.7.3 Transactional Video on Demand
- 12.3.7.4 Live OTT Streaming
- 12.3.8 Subsegment Pricing and Adoption Trends
- 12.3.9 Leading Suppliers and Competition
- 12.3.10 Regional Demand and Opportunities
- 12.4 By Device Type - Market Size and Forecast, 2025-2035
- 12.4.1 Segment Definition and Scope
- 12.4.2 Historical Market Size, 2018-2025
- 12.4.3 Revenue Forecast, 2025-2035
- 12.4.4 Volume Forecast, 2025-2035
- 12.4.5 Base-Year Market Share, 2025
- 12.4.6 Segment CAGR and Growth Drivers
- 12.4.7 Subsegment Market Size and Forecast
- 12.4.7.1 Smartphones and Tablets
- 12.4.7.2 Smart TVs and Connected TV
- 12.4.7.3 Laptops and Desktops
- 12.4.7.4 Streaming Devices and Consoles
- 12.4.8 Subsegment Pricing and Adoption Trends
- 12.4.9 Leading Suppliers and Competition
- 12.4.10 Regional Demand and Opportunities
- 12.5 Segment Growth Comparison
- 12.6 Segment Attractiveness and Priority Matrix
Chapter 13 Malaysia OTT Video & Entertainment Geographic Market Outlook, 2025-2035
- 13.1 Regional Market Size and Country-Level Shares, 2025
- 13.2 Country Market Size Comparison, 2025
- 13.3 Country Market Forecasts, 2025-2035
- 13.4 Subregional Industrial and Demand Clusters
- 13.5 Intra-Regional Pricing and Cost Differences
- 13.6 Cross-Border Trade and Supply Networks
- 13.7 Regional Supply and Demand Balances
- 13.8 Country Opportunity Comparison and Prioritization
Note: Every listed country is covered on the structure shown under the first country.
Chapter 14 Malaysia OTT Video & Entertainment Technology, Innovation and Sustainability Outlook
- 14.1 Technology Landscape and Maturity
- 14.2 Product, Process and Service Innovation
- 14.3 AI, Automation and Digital Tools in the Industry
- 14.4 Technology Adoption and Performance Benchmarking
- 14.5 Innovation Pipeline and R&D Investment
- 14.6 Patent and Intellectual Property Trends
- 14.7 Energy Efficiency and Resource Management
- 14.8 Sustainability, Recycling and Circularity
- 14.9 Technology Roadmap, 2025-2035
- 14.10 Risks of Obsolescence and Technology Substitution
Chapter 15 Malaysia OTT Video & Entertainment Market Key Strategic Imperatives
- 15.1 Growth and Market Entry Priorities
- 15.2 High-Return Products and Segments
- 15.3 Pricing, Profitability and Cost Optimization
- 15.4 Technology Investment and Product Differentiation
- 15.5 Supply Chain Localization and Resilience
- 15.6 Distribution and Customer Acquisition
- 15.7 Partnership, Acquisition and Capacity Strategy
- 15.8 Regional Expansion Priorities
- 15.9 Short-, Medium- and Long-Term Actions
Chapter 16 Competition Outlook
- 16.1 Industry Competition Characteristics
- 16.2 Market Structure and Concentration
- 16.3 Market Share and Competitive Positioning, 2025
- 16.4 Company-Wise Revenue and Product Benchmarking
- 16.5 Production and Service Capacity Benchmarking
- 16.6 Technology, Pricing and Differentiation
- 16.7 Regional Footprint and Distribution Strength
- 16.8 Mergers, Acquisitions and Strategic Alliances
- 16.9 New Entrants and Competitive Threats
- 16.10 Porter's Five Forces and Industry Attractiveness
- 16.11 Competitive Outlook, 2025-2035
Chapter 17 Company Profiles
- 17.1 Company Coverage and Selection Criteria
- 17.2 Netflix, Inc.
- 17.2.1 Business Description
- 17.2.2 Company Ownership and Geographic Presence
- 17.2.3 Product and Service Portfolio
- 17.2.4 Manufacturing and Operating Footprint
- 17.2.5 Production Capacity and Expansion Plans
- 17.2.6 Financial Performance and Investment
- 17.2.7 Market Share and Competitive Position
- 17.2.8 Technology and Innovation Capabilities
- 17.2.9 Strategic Alliances or Partnerships
- 17.2.10 Recent Developments
- 17.2.11 Growth Strategy and Outlook
- 17.3 Astro Malaysia Holdings Berhad
- 17.4 The Walt Disney Company (Disney+)
- 17.5 PCCW Media (Viu)
- 17.6 iQIYI, Inc.
- 17.7 Tencent Holdings Limited (WeTV)
- 17.8 Amazon.com, Inc. (Prime Video)
- 17.9 WarnerMedia Direct Asia Pacific, LLC (HBO Max)
- 17.10 Apple Inc. (Apple TV)
- 17.11 Media Prima Berhad (Tonton)
- 17.12 Other Relevant Market Participants
Note: Every listed company is profiled on the structure shown under the first company. The company list is preliminary and may change based on research findings, market developments, data availability and client requirements.
Chapter 18 Disclaimer
- 18.1 Research and Forecast Disclaimer
- 18.2 Data Source and Estimation Limitations
Note: The depth of individual sections depends on data availability for this market. Volume, capacity, trade and other unit-based metrics are included where applicable.

