| REPORT ATTRIBUTE | DETAILS |
|---|---|
| Historical Period | 2019-2022 |
| Base Year | 2023 |
| Forecast Period | 2024-2032 |
| WAN Optimization Controllers Market Size 2024 | USD 20,025 Million |
| WAN Optimization Controllers Market, CAGR | 9.4% |
| WAN Optimization Controllers Market Size 2032 | USD 41087.63 Million |
Market Overview:
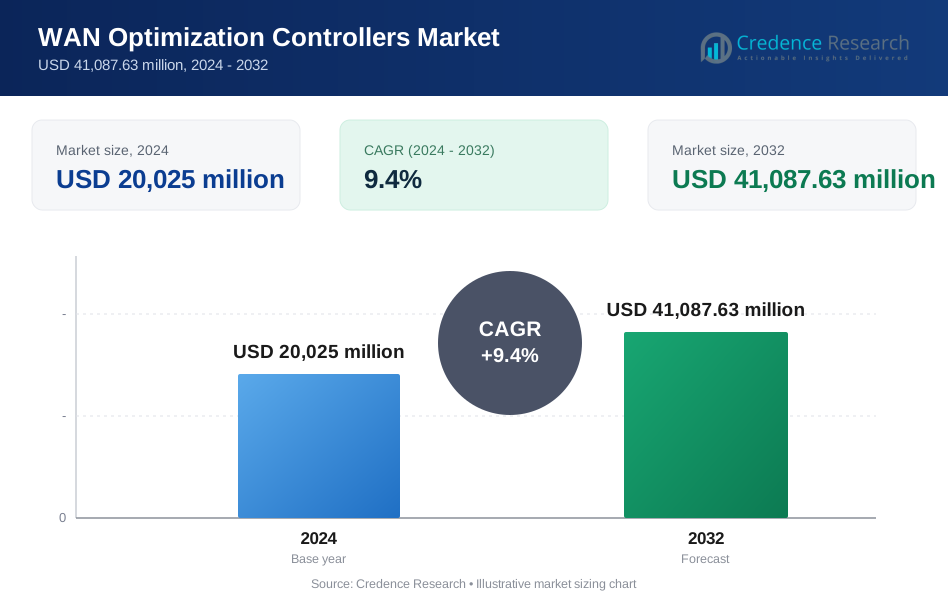
The WAN Optimization Controllers Market is projected to grow from USD 20,025 million in 2024 to an estimated USD 41087.63 million by 2032, with a compound annual growth rate (CAGR) of 9.4% from 2024 to 2032.
Key drivers propelling the WAN Optimization Controllers market include the rapid digital transformation of businesses, the surge in cloud computing adoption, and the increasing volume of data traffic. Businesses are increasingly reliant on WAN technologies to connect geographically dispersed operations, and as data demands grow, traditional WAN setups struggle to ensure optimal performance. WOCs help improve application performance, reduce bandwidth costs, and ensure more reliable connections. Moreover, the increasing use of software-defined WAN (SD-WAN) solutions has further fueled market growth, as WOCs integrate seamlessly with SD-WAN architectures to optimize both on-premises and cloud applications.
Regionally, North America holds the largest market share for WAN Optimization Controllers, driven by the early adoption of cloud technologies, high network traffic, and the presence of key players in the region. The United States, in particular, has a high demand for WAN optimization solutions due to its significant number of data centers and enterprises seeking to enhance network infrastructure. The Asia-Pacific region is anticipated to experience the highest growth during the forecast period, supported by rapid digitalization, increasing internet penetration, and the growing number of small and medium-sized enterprises (SMEs) adopting advanced networking solutions. In addition, the increasing adoption of Internet of Things (IoT) devices and applications is contributing to a rapid rise in data traffic across networks, further accelerating the demand for effective WAN optimization. The ability of WOCs to prioritize critical applications, reduce latency, and enhance network reliability in the face of such high demand is invaluable for organizations looking to stay competitive in an increasingly connected world. With these advancements, the market for WAN Optimization Controllers is expected to experience sustained growth, fueled by technological innovations and growing reliance on cloud-based and remote solutions.
Market Drivers:
Increasing Demand for Enhanced Network Performance
As businesses rely more on cloud-based services and data-intensive applications, the need for high-performance networks has become critical. For instance, Riverbed Technology reported that their WAN Optimization Controllers (WOCs) helped a leading global law firm reduce latency by 50% and improve application performance. WAN Optimization Controllers (WOCs) significantly improve network efficiency by minimizing latency, enhancing bandwidth utilization, and ensuring smoother application delivery. As organizations embrace remote work, distributed teams, and digital collaboration tools, the demand for optimized network performance continues to drive the adoption of WOCs across various industries.
Surge in Cloud Computing Adoption
The rapid shift toward cloud computing is a major driver of the WAN Optimization Controllers market. As organizations increasingly migrate their operations to cloud platforms, they face challenges related to bandwidth management, application performance, and data transfer speed. For example, Citrix Systems successfully deployed WOCs for a multinational retail company, enhancing data transfer speeds by 45% between their on-premise infrastructure and cloud-based applications.WOCs help mitigate these challenges by optimizing the flow of data between on-premise infrastructure and cloud-based applications. The growing preference for hybrid and multi-cloud architectures further underscores the need for effective WAN optimization solutions.
Rise in Data Traffic and Global Connectivity Needs
The exponential growth in data traffic, fueled by the proliferation of Internet of Things (IoT) devices and multimedia content, places substantial pressure on traditional WAN setups. For example, Ericsson reported that global mobile data traffic is expected to reach 303 exabytes per month by 2030, highlighting the need for high-performance networks. Businesses must ensure that their networks can handle vast amounts of data across different geographies while maintaining high-speed performance. WAN Optimization Controllers enable organizations to optimize their data traffic and reduce congestion, ensuring seamless connectivity across geographically dispersed locations and enhancing operational efficiency.
Integration with Software-Defined WAN (SD-WAN) Solutions
The growing adoption of Software-Defined WAN (SD-WAN) technology is another key driver of the WAN Optimization Controllers market. For instance, Riverbed Technology integrated SD-WAN with their WOCs for Global Retail Corp, achieving a 40% improvement in application performance and a 25% increase in network reliability. SD-WAN solutions enable businesses to create cost-effective, flexible, and scalable wide-area networks. By integrating WOCs with SD-WAN, organizations can achieve significant improvements in network performance, control, and security. The synergy between these technologies helps companies efficiently manage their network resources and optimize application performance in a rapidly evolving digital landscape.
Market Trends:
Growing Adoption of SD-WAN Integration One of the key trends in the WAN Optimization Controllers (WOC) market is the increasing integration of WOCs with Software-Defined WAN (SD-WAN) solutions. For example, Cisco Systems has successfully integrated SD-WAN with Azure hub-and-spoke network topologies, optimizing connectivity for branches with local internet breakouts. As businesses strive for cost-effective, flexible, and scalable network management, the combination of SD-WAN and WOC technologies offers a powerful solution. SD-WAN provides centralized control over network traffic while WOCs optimize the performance of applications across the network. This synergy allows organizations to ensure better performance, enhanced application delivery, and improved bandwidth utilization, making this integration one of the most prominent trends in the industry.
Shift Toward Cloud-Native WAN Optimization
With the growing reliance on cloud services, there has been a noticeable shift toward cloud-native WAN optimization solutions. Traditional WAN optimization methods, often reliant on hardware appliances, are being replaced by cloud-based solutions that offer more flexibility, scalability, and cost-efficiency. For instance, the Cloud-Native SD-WAN (CN-WAN) Project by Cisco bridges the gap between SD-WAN technologies and cloud-native applications running on Kubernetes .Cloud-native WOCs are gaining traction as they enable businesses to optimize data flow to and from cloud environments without the constraints of legacy systems. This trend is further fueled by the rise of multi-cloud and hybrid cloud infrastructures, which require more dynamic and scalable optimization approaches.
Focus on Security in WAN Optimization
As cybersecurity threats continue to evolve, security has become a critical component of WAN optimization strategies. Organizations are increasingly seeking solutions that not only enhance network performance but also ensure secure data transmission across distributed environments. For example, Cisco Systems offers WOCs with advanced security features such as encryption, secure tunneling, and traffic monitoring.WOCs that integrate with advanced security features such as encryption, secure tunneling, and traffic monitoring are in high demand. This focus on security within WAN optimization solutions is expected to continue as businesses prioritize both performance and protection against cyber threats.
AI and Machine Learning Integration
Artificial intelligence (AI) and machine learning (ML) are becoming integral to WAN optimization solutions. These technologies help enhance the ability of WOCs to predict and respond to network conditions in real-time, enabling more proactive performance optimization. For instance, Cisco's AI-driven analytics can analyze large volumes of network traffic data, identify patterns, optimize routing decisions, and improve the overall efficiency of WANs .By analyzing large volumes of network traffic data, AI and ML can identify patterns, optimize routing decisions, and improve the overall efficiency of WANs. As these technologies mature, their role in WAN optimization is set to expand, providing organizations with smarter and more adaptive network management capabilities.
Market Challenges Analysis:
Complexity of Integration with Existing Infrastructure
One of the primary challenges in the WAN Optimization Controllers (WOC) market is the complexity of integrating new optimization solutions with existing network infrastructure. Many organizations still rely on legacy network systems, which can be difficult to modernize and integrate with advanced WAN optimization technologies. The process of deploying WOCs often requires significant adjustments to existing hardware, software, and network configurations, which can be both time-consuming and costly. This integration complexity can deter businesses from adopting WOCs, particularly small and medium-sized enterprises (SMEs) with limited IT resources. As businesses grow and expand their operations, their networking needs become more complex and demand higher scalability. Traditional WAN optimization solutions, often reliant on hardware appliances, can struggle to scale efficiently with the increasing volume of data and traffic. For large enterprises with multiple branches and remote sites, managing WAN optimization at scale can become challenging. Additionally, hardware-dependent solutions may be difficult to adapt to rapidly changing network conditions or evolving business requirements, limiting their effectiveness in dynamic environments.
Rising Costs of WAN Optimization Implementation
While WAN optimization solutions offer significant performance benefits, the costs associated with their implementation and maintenance can be prohibitive for some organizations. The upfront costs of purchasing WOC hardware, along with ongoing maintenance and licensing fees, can be substantial. For many businesses, particularly SMEs, the financial burden of adopting WAN optimization technologies may outweigh the perceived benefits, slowing down market adoption. Furthermore, the complexity of deployment may require additional investments in training and support, adding to the total cost of ownership. With the growing emphasis on cloud adoption and distributed networks, ensuring the security and privacy of sensitive data during WAN optimization remains a significant challenge. Organizations need to ensure that WAN optimization solutions do not expose their networks to potential cybersecurity threats, particularly when optimizing traffic across public and hybrid cloud environments. Concerns about data breaches and unauthorized access to corporate data can hinder the adoption of WAN optimization solutions, especially in highly regulated industries.
Market Segmentation Analysis:
By Solution
The WAN Optimization Controllers market is primarily segmented into hardware-based solutions and software-based solutions. Hardware-based WOCs dominate the market, offering dedicated devices designed to optimize network traffic, improve performance, and reduce bandwidth usage. However, software-based solutions are gaining traction due to their scalability, flexibility, and lower upfront costs. These solutions are increasingly preferred by organizations that seek cloud-native optimization capabilities or want to reduce their dependency on physical hardware.
By Application
The WAN Optimization Controllers market is driven by applications in a wide range of industries, including data centers, enterprise networks, cloud applications, and remote office setups. As businesses increasingly move to cloud platforms and adopt hybrid IT environments, cloud applications are seeing significant demand for WAN optimization to improve application delivery and user experience. Additionally, WAN optimization in enterprise networks ensures seamless communication between remote branches and headquarters, making it a critical application for improving global connectivity.
By End-User
The WAN Optimization Controllers market serves various end-user segments, including large enterprises, small and medium-sized enterprises (SMEs), and service providers. Large enterprises are the largest consumers of WOCs due to their complex, geographically dispersed networks that require efficient bandwidth management and improved performance. SMEs are increasingly adopting WAN optimization to enhance their network efficiency as they scale. Service providers also form a key segment, leveraging WOCs to improve their network services and offer better connectivity solutions to their clients.
Segmentations:
By Solution:
- Services
- Physical Appliances
- Virtual Appliances
- Managed Services
- WAN Optimization Controllers
- Professional Services
By Application:
- Hybrid Network Optimization
- Network Traffic Acceleration and Monitoring
- Others
By End User:
- CSPs
- Network Operators
- Enterprises
- Others
By Region
- North America
- U.S.
- Canada
- Mexico
- Europe
- Germany
- France
- U.K.
- Italy
- Spain
- Rest of Europe
- Asia Pacific
- China
- Japan
- India
- South Korea
- South-east Asia
- Rest of Asia Pacific
- Latin America
- Brazil
- Argentina
- Rest of Latin America
- Middle East & Africa
- GCC Countries
- South Africa
- Rest of the Middle East and Africa
Regional Analysis:
North America
North America holds the largest market share in the WAN Optimization Controllers (WOC) market, accounting for 40%. The region's dominance is primarily attributed to the high demand for advanced networking solutions, especially in the United States, which is home to numerous enterprises and data centers. The rapid adoption of cloud technologies, increasing reliance on data centers, and the need for improved network performance across wide-area networks are key factors fueling the growth of WAN optimization solutions in this region. Additionally, North America benefits from the presence of major market players and technological advancements that accelerate the adoption of WOCs. Enterprises focusing on hybrid IT environments and digital transformation are also driving the need for these solutions to ensure optimal connectivity and application performance.
Europe
Europe holds a 25% share of the global WOC market, with demand driven by sectors like healthcare, finance, and telecommunications, which require efficient network management. The increasing adoption of cloud-based applications and hybrid infrastructures across the region necessitates WAN optimization to maintain optimal performance across geographically dispersed networks. Additionally, Europe’s stringent data protection regulations, such as the General Data Protection Regulation (GDPR), make secure and efficient WAN optimization solutions essential for businesses seeking to protect sensitive information and ensure compliance.
Asia-Pacific
Asia-Pacific is expected to see the highest growth rate, with a 20% market share. The region is experiencing rapid digital transformation, characterized by expanding internet penetration and the rise of small and medium-sized enterprises (SMEs) adopting advanced networking solutions. Countries such as China, India, and Japan are leading in technological development and infrastructure expansion, further driving demand for WAN optimization solutions. The shift towards cloud computing, hybrid cloud environments, and the increased use of IoT devices is also contributing to the growing need for WAN optimization in the region.
Latin America
Latin America holds an 8% market share in the global WOC market. Although smaller compared to other regions, the market is growing steadily due to increased adoption of cloud computing and the need for better network efficiency among enterprises. Digital transformation initiatives and expanding telecom infrastructure in countries like Brazil and Mexico are driving demand for WAN optimization solutions. Businesses are increasingly seeking cost-effective and efficient ways to optimize their wide-area networks.
Middle East & Africa
The Middle East & Africa (MEA) region holds a 7% market share. Despite being a smaller market, it is experiencing steady growth due to rising digitalization, particularly in countries like the UAE, Saudi Arabia, and South Africa. The demand for improved connectivity in remote locations, along with the adoption of cloud-based applications and SD-WAN solutions, is driving the growth of WAN optimization in this region. As businesses expand their digital infrastructure, the WAN optimization market in MEA holds significant potential for growth.
Key Player Analysis:
- Nutanix
- Citrix Systems
- Silver Peak
- Allot Communications
- Arista Networks
- GTT Communications
- Hewlett Packard Enterprise
- Aryaka Networks
- Cisco Systems
- Juniper Networks
- Peplink
Competitive Analysis:
The WAN Optimization Controllers (WOC) market is highly competitive, with several key players dominating the landscape. Leading companies include Cisco Systems, Riverbed Technology, Citrix Systems, and Nokia, all of which offer robust and scalable solutions for optimizing wide-area networks. These companies leverage advanced technologies such as Software-Defined WAN (SD-WAN) integration, cloud-native optimization, and AI-based analytics to enhance network performance and meet the growing demands of digital transformation. The market is characterized by significant product innovation, with players focusing on providing flexible, cost-effective, and secure WAN optimization solutions that cater to both large enterprises and SMEs. For example, Citrix Systems launched a new WAN optimization product that reduced costs by 20% for SMEs, and Nokia introduced a solution that enhanced security for large enterprises. Strategic partnerships and acquisitions are common in this space, as companies aim to expand their product portfolios and enhance their market presence. Additionally, emerging players are introducing specialized solutions tailored to specific industries or regional needs, intensifying competition and driving further market growth.
Recent Developments:
- In May 2024, Citrix Systems revealed plans for a tech preview of a new CVAD plug-in supporting Nutanix Prism Central. This integration aims to enhance hybrid multi-cloud deployments by enabling streamlined operations and improved performance for large-scale deployments.
- In February 2023, Nutanix launched a new NetScaler VPX image specifically designed for deployment on Nutanix Acropolis Hypervisor (AHV). This enhancement aims to streamline the provisioning and deployment of application delivery controllers, improving application performance within virtualized environments.
- In March 2023, Arista Networks introduced the Arista WAN Routing System, which combines enterprise-class routing platforms, cloud-neutral internet transit capabilities, and the CloudVision Pathfinder Service. This system modernizes WAN management and provisioning, allowing for automated configuration and traffic engineering, resulting in a self-healing network architecture.
Market Concentration & Characteristics:
The WAN Optimization Controllers (WOC) market exhibits a moderately concentrated structure, with a few key players holding significant market share, while several smaller and emerging companies offer specialized solutions. Major players like Cisco Systems, Riverbed Technology, and Citrix Systems dominate the market through product innovation, strategic acquisitions, and strong brand recognition. However, the market remains competitive, with numerous regional and niche players targeting specific industries or geographic areas. The increasing adoption of cloud-based solutions, SD-WAN integration, and AI-driven optimization technologies is driving innovation, allowing both established and new players to differentiate their offerings. As businesses of all sizes seek cost-effective, scalable, and secure WAN optimization solutions, the market is expected to experience further fragmentation, with both large enterprises and SMEs seeking tailored solutions that meet their evolving network performance and connectivity needs.
Report Coverage:
The research report offers an in-depth analysis based on solution, application, end-user and region. It details leading market players, providing an overview of their business, product offerings, investments, revenue streams, and key applications. Additionally, the report includes insights into the competitive environment, SWOT analysis, current market trends, as well as the primary drivers and constraints. Furthermore, it discusses various factors that have driven market expansion in recent years. The report also explores market dynamics, regulatory scenarios, and technological advancements that are shaping the industry. It assesses the impact of external factors and global economic changes on market growth. Lastly, it provides strategic recommendations for new entrants and established companies to navigate the complexities of the market.
Future Outlook:
- The WAN Optimization Controllers market will continue to grow as businesses increasingly rely on cloud-based applications and remote workforces.
- Integration of SD-WAN and WAN optimization solutions will become more prevalent, offering enhanced performance and flexibility for businesses.
- Cloud-native WAN optimization solutions will see rising adoption due to their scalability, cost-efficiency, and ability to optimize cloud traffic effectively.
- AI and machine learning technologies will play a significant role in the evolution of WAN optimization, enabling more intelligent traffic management and proactive network adjustments.
- Enterprises will increasingly prioritize secure WAN optimization solutions to safeguard data and ensure compliance with strict data privacy regulations.
- Small and medium-sized enterprises (SMEs) will adopt WAN optimization as they scale, benefiting from more affordable and scalable solutions.
- The demand for WAN optimization will rise in emerging markets, especially in Asia-Pacific, as digital transformation accelerates.
- Increased adoption of IoT devices and data-driven applications will drive the need for more efficient bandwidth management across wide-area networks.
- Edge computing will complement WAN optimization, helping reduce latency and improving application performance for distributed operations.
- As businesses transition to hybrid and multi-cloud environments, WAN optimization will become essential for ensuring seamless connectivity and optimized performance across complex network infrastructures.
Request a Free Sample
Fill in your details and we'll send you a free sample report.
- Sample data tables & charts
- Research methodology
Market Dynamics
Increasing Demand for Enhanced Network Performance
As organizations rely more on cloud-based services and data-intensive applications, the need for high-performance, low-latency networks is critical. WAN Optimization Controllers (WOCs) help minimize latency, improve bandwidth utilization, and ensure smoother application delivery, driving adoption across industries.
Surge in Cloud Computing Adoption
The rapid migration to cloud platforms creates challenges in bandwidth management and application performance. WOCs optimize data flow between on-premise and cloud environments, making them essential for organizations adopting hybrid and multi-cloud architectures.
Rise in Data Traffic and Global Connectivity Needs
The proliferation of IoT devices and multimedia content is causing exponential growth in data traffic, straining traditional WAN setups. WOCs enable organizations to efficiently manage and optimize data traffic across geographically dispersed locations, ensuring seamless connectivity and operational efficiency.
Integration with Software-Defined WAN (SD-WAN) Solutions
The adoption of SD-WAN technology is accelerating, and WOCs are increasingly integrated with SD-WAN architectures. This synergy allows businesses to achieve better network performance, control, and security, further fueling market growth.
Focus on Security and Compliance
With evolving cybersecurity threats and stringent data protection regulations, organizations are seeking WAN optimization solutions that also ensure secure data transmission. WOCs with advanced security features such as encryption and traffic monitoring are in high demand, especially in regulated industries.
Need a Custom Version of This Report?
Tailor the scope, geography, or segments to your exact requirements.
- Custom geography or segment scope
- Direct access to our analyst team
Frequently Asked Questions
What is the projected growth of the WAN Optimization Controllers market?
What factors are driving the growth of the WAN Optimization Controllers market?
How do WAN Optimization Controllers improve business performance?
Which region holds the largest market share for WAN Optimization Controllers?
Which region is expected to experience the highest growth in the WAN Optimization Controllers market?
Table of Content
Chapter 1 Market Segmentation
- 1.1 Segmentation Framework
- 1.1.1 Product and Service Classification
- 1.1.2 Application and End-Use Classification
- 1.1.3 Technology and Solution Classification
- 1.1.4 Customer and Distribution Channel Classification
- 1.1.5 Geographic Segmentation
- 1.1.6 Market Segment Definitions and Boundaries
- 1.2 By End User
- 1.2.1 CSPs
- 1.2.2 Network Operators
- 1.2.3 Enterprises
- 1.2.4 Others
- 1.3 By Solution
- 1.3.1 Services
- 1.3.2 Physical Appliances
- 1.3.3 Virtual Appliances
- 1.3.4 Managed Services
- 1.3.5 WAN Optimization Controllers
- 1.3.6 Professional Services
- 1.4 By Application
- 1.4.1 Hybrid Network Optimization
- 1.4.2 Network Traffic Acceleration and Monitoring
- 1.4.3 Others
Chapter 2 Introduction
- 2.1 Report Objectives and Scope
- 2.2 Product Definition and Industry Terminology
- 2.3 Market Inclusions and Exclusions
- 2.4 Research Process
- 2.4.1 Primary Research and Expert Interviews
- 2.4.2 Secondary Research and Source Review
- 2.4.3 Top-Down and Bottom-Up Estimation
- 2.4.4 Data Triangulation and Verification
- 2.5 Market Size Measurement Basis
- 2.5.1 2024: USD 20,025 million → 2032: USD 41,087.63 million
- 2.6 Historical and Forecast Reference Periods
- 2.6.1 Base Year: 2024
- 2.6.2 Forecast Period: 2024-2032
- 2.7 Research Assumptions and Limitations
Chapter 3 Executive Summary
- 3.1 Market Snapshot and Key Findings
- 3.2 Base-Year Market Size, 2024
- 3.3 Forecast Market Size, 2032
- 3.4 Revenue and Volume Growth Outlook
- 3.5 Key Demand and Supply Indicators
- 3.6 Leading Market Segments
- 3.7 Fastest-Growing Market Opportunities
- 3.8 Regional Performance Highlights
- 3.9 Technology and Industry Transformation
- 3.10 Competitive Landscape Summary
- 3.11 Analyst View and Strategic Implications
Chapter 4 Global WAN Optimization Controllers Market Trends and Developments
- 4.1 Historical Industry Development
- 4.2 Recent Market Trends and Developments
- 4.3 Demand and Customer Behavior Trends
- 4.4 Technology and Product Innovation
- 4.5 Artificial Intelligence, Automation and Digitalization
- 4.6 Local Manufacturing and Supply Chain Realignment
- 4.7 Industry Partnerships, Mergers and Acquisitions
- 4.8 Sustainability and Circular Economy Developments
- 4.9 Government and Private Sector Investment Trends
- 4.10 Emerging Business Models and Commercialization
- 4.11 Industry Developments and Announcements
Chapter 5 Global WAN Optimization Controllers Market Production, Supply and Demand Analysis
- 5.1 Demand Trend and Consumption Analysis
- 5.2 Demand Forecast, 2024-2032
- 5.3 Production and Output Trend
- 5.4 Production and Output Forecast, 2024-2032
- 5.5 Installed Capacity and Capacity Utilization
- 5.6 Company-Wise Production Plants and Statistics
- 5.6.1 Installed Production Capacity
- 5.6.2 Actual Production
- 5.6.3 Planned Capacity and Expansion Targets
- 5.7 Supply Chain Structure and Procurement Trends
- 5.8 Supply-Demand Gap and Bottlenecks
- 5.9 Import Dependence and Sourcing Structure
- 5.10 Contract Manufacturing and Outsourcing
- 5.11 Regional Supply and Demand Concentration
Chapter 6 Global WAN Optimization Controllers Market Pricing Analysis
- 6.1 Pricing Structure and Measurement
- 6.2 Historical Pricing Trends
- 6.3 Pricing Outlook, 2024-2032
- 6.4 Average Selling Price and Unit Economics
- 6.5 Pricing by Product and Market Segment
- 6.6 Geographic Pricing Differences
- 6.7 Key Input, Energy, Labor and Logistics Costs
- 6.8 Contract Pricing and Purchasing Models
- 6.9 Pricing Sensitivity and Competitive Positioning
- 6.10 Price, Margin and Profitability Implications
Chapter 7 Global WAN Optimization Controllers Market Dynamics
- 7.1 Market Growth Drivers
- 7.1.1 Demand-Side Drivers
- 7.1.2 Technology and Innovation Drivers
- 7.1.3 Infrastructure and Investment Drivers
- 7.1.4 Regulatory and Policy Drivers
- 7.2 Market Restraints
- 7.2.1 Cost and Affordability Constraints
- 7.2.2 Technology and Adoption Barriers
- 7.2.3 Supply Chain and Operational Constraints
- 7.3 Market Challenges
- 7.3.1 Competitive Pressure and Margin Erosion
- 7.3.2 Skills, Infrastructure and Implementation Gaps
- 7.4 Emerging Market Opportunities
- 7.5 Market Dynamics Impact and Time-Horizon Assessment
Chapter 8 Global WAN Optimization Controllers Value Chain Analysis
- 8.1 Industry Value Chain Overview
- 8.2 Upstream Suppliers and Critical Inputs
- 8.3 Technology and Component Providers
- 8.4 Manufacturing or Service Delivery
- 8.5 Distribution, Channel Partners and Integrators
- 8.6 Downstream Applications and End Users
- 8.7 Value Addition and Profit Pools
- 8.8 Vertical Integration and Outsourcing
- 8.9 Supplier Concentration and Risk
- 8.10 Supply Chain Localization and Resilience
Chapter 9 Global WAN Optimization Controllers Market Regulations and Policies
- 9.1 Relevant Laws, Standards and Compliance Frameworks
- 9.2 Product, Service, Safety and Quality Requirements
- 9.3 Government Policies, Incentives and Subsidies
- 9.4 Imports, Exports and Trade Barriers
- 9.5 Public Procurement and Local Content Requirements
- 9.6 Environmental and Sustainability Compliance
- 9.7 Upcoming Policy Changes and Market Implications
Chapter 10 Global WAN Optimization Controllers Market Hotspots and Opportunities
- 10.1 Market Opportunity Mapping and Growth Hotspots
- 10.2 High-Growth Applications and Customer Groups
- 10.3 Underserved Markets and White-Space Opportunities
- 10.4 Emerging Technology and Product Opportunities
- 10.5 New Capacity and Investment Hotspots
- 10.6 Market Entry and Expansion Opportunities
- 10.7 Distribution and Partnership Opportunities
- 10.8 Near-Term and Long-Term Commercial Potential
- 10.9 Opportunity Attractiveness and Execution Risks
Chapter 11 Global WAN Optimization Controllers Market Outlook, 2024-2032
- 11.1 Market Size and Analysis
- 11.1.1 Revenue (Market Measurement: 2024: USD 20,025 million → 2032: USD 41,087.63 million)
- 11.1.2 Market Volume and Quantity Sold
- 11.1.3 Historical Market Size
- 11.1.4 Base-Year Market Size, 2024
- 11.2 Market Forecast, 2024-2032
- 11.2.1 Revenue Forecast to 2032
- 11.2.2 Volume Forecast to 2032
- 11.2.3 CAGR and Year-on-Year Growth
- 11.2.4 Incremental Revenue Opportunity
- 11.3 Forecast Assumptions and Scenario Analysis
- 11.3.1 Base-Case Forecast
- 11.3.2 Optimistic and Conservative Scenarios
- 11.3.3 Technology, Pricing and Policy Sensitivities
- 11.4 Market Attractiveness and Growth Outlook
Chapter 12 Global WAN Optimization Controllers Market Segmentation and Outlook
- 12.1 Segmentation Summary and Market Shares, 2024
- 12.2 Largest and Fastest-Growing Segments
- 12.3 By End User - Market Size and Forecast, 2024-2032
- 12.3.1 Segment Definition and Scope
- 12.3.2 Historical Market Size
- 12.3.3 Revenue Forecast, 2024-2032
- 12.3.4 Volume Forecast, 2024-2032
- 12.3.5 Base-Year Market Share, 2024
- 12.3.6 Segment CAGR and Growth Drivers
- 12.3.7 Subsegment Market Size and Forecast
- 12.3.7.1 CSPs
- 12.3.7.2 Network Operators
- 12.3.7.3 Enterprises
- 12.3.7.4 Others
- 12.3.8 Subsegment Pricing and Adoption Trends
- 12.3.9 Leading Suppliers and Competition
- 12.3.10 Regional Demand and Opportunities
- 12.4 By Solution - Market Size and Forecast, 2024-2032
- 12.4.1 Segment Definition and Scope
- 12.4.2 Historical Market Size
- 12.4.3 Revenue Forecast, 2024-2032
- 12.4.4 Volume Forecast, 2024-2032
- 12.4.5 Base-Year Market Share, 2024
- 12.4.6 Segment CAGR and Growth Drivers
- 12.4.7 Subsegment Market Size and Forecast
- 12.4.7.1 Services
- 12.4.7.2 Physical Appliances
- 12.4.7.3 Virtual Appliances
- 12.4.7.4 Managed Services
- 12.4.7.5 WAN Optimization Controllers
- 12.4.7.6 Professional Services
- 12.4.8 Subsegment Pricing and Adoption Trends
- 12.4.9 Leading Suppliers and Competition
- 12.4.10 Regional Demand and Opportunities
- 12.5 By Application - Market Size and Forecast, 2024-2032
- 12.5.1 Segment Definition and Scope
- 12.5.2 Historical Market Size
- 12.5.3 Revenue Forecast, 2024-2032
- 12.5.4 Volume Forecast, 2024-2032
- 12.5.5 Base-Year Market Share, 2024
- 12.5.6 Segment CAGR and Growth Drivers
- 12.5.7 Subsegment Market Size and Forecast
- 12.5.7.1 Hybrid Network Optimization
- 12.5.7.2 Network Traffic Acceleration and Monitoring
- 12.5.7.3 Others
- 12.5.8 Subsegment Pricing and Adoption Trends
- 12.5.9 Leading Suppliers and Competition
- 12.5.10 Regional Demand and Opportunities
- 12.6 Segment Growth Comparison
- 12.7 Segment Attractiveness and Priority Matrix
Chapter 13 Global WAN Optimization Controllers End-Use and Application Market Outlook
- 13.1 End-Use Industry and Customer Demand Structure
- 13.2 Leading Applications and Customer Groups
- 13.3 End-Use Market Size, Share and Forecast
- 13.4 Major End-Use Industry Deep Dives
- 13.4.1 Customer Requirements and Use Cases
- 13.4.2 Demand and Replacement Cycles
- 13.4.3 Technical and Regulatory Considerations
- 13.4.4 Purchasing and Procurement Models
- 13.4.5 Leading Vendors and Distribution Channels
- 13.4.6 Forecast and Commercial Opportunities
- 13.5 Emerging Applications and Cross-Segment Demand
- 13.6 End-Use Industry Investment Priorities
Chapter 14 Global WAN Optimization Controllers Geographic Market Outlook, 2024-2032
- 14.1 Regional Market Size and Share, 2024
- 14.2 Regional Market Forecast, 2024-2032
- 14.3 Regional Pricing, Production and Demand Differences
- 14.4 North America
- 14.4.1 United States
- 14.4.2 Canada
- 14.4.3 Mexico
- 14.5 Europe
- 14.5.1 Germany
- 14.5.2 France
- 14.5.3 Italy
- 14.5.4 United Kingdom
- 14.5.5 Spain
- 14.5.6 Poland
- 14.5.7 Russia
- 14.5.8 Netherlands
- 14.5.9 Belgium
- 14.5.10 Sweden
- 14.5.11 Denmark
- 14.5.12 Norway
- 14.5.13 Rest of Europe
- 14.6 Asia Pacific
- 14.6.1 China
- 14.6.2 India
- 14.6.3 Japan
- 14.6.4 South Korea
- 14.6.5 Thailand
- 14.6.6 Indonesia
- 14.6.7 Vietnam
- 14.6.8 Malaysia
- 14.6.9 Australia
- 14.6.10 Rest of Asia Pacific
- 14.7 Latin America
- 14.7.1 Brazil
- 14.7.2 Argentina
- 14.7.3 Colombia
- 14.7.4 Chile
- 14.7.5 Rest of Latin America
- 14.8 Middle East
- 14.8.1 Saudi Arabia
- 14.8.2 United Arab Emirates
- 14.8.3 Turkey
- 14.8.4 Israel
- 14.8.5 Iran
- 14.8.6 Rest of the Middle East
- 14.9 Africa
- 14.9.1 South Africa
- 14.9.2 Egypt
- 14.9.3 Nigeria
- 14.9.4 Morocco
- 14.9.5 Rest of Africa
- 14.10 Regional Investment, Policy and Supply Chain Differences
- 14.11 Regional Competitive Landscape
- 14.12 Geographic Growth Hotspots
Chapter 15 Global WAN Optimization Controllers Technology, Innovation and Sustainability Outlook
- 15.1 Technology Landscape and Maturity
- 15.2 Product, Process and Service Innovation
- 15.3 AI, Automation and Digital Tools in the Industry
- 15.4 Technology Adoption and Performance Benchmarking
- 15.5 Innovation Pipeline and R&D Investment
- 15.6 Patent and Intellectual Property Trends
- 15.7 Energy Efficiency and Resource Management
- 15.8 Sustainability, Recycling and Circularity
- 15.9 Technology Roadmap, 2024-2032
- 15.10 Risks of Obsolescence and Technology Substitution
Chapter 16 Global WAN Optimization Controllers Market Key Strategic Imperatives
- 16.1 Growth and Market Entry Priorities
- 16.2 High-Return Products and Segments
- 16.3 Pricing, Profitability and Cost Optimization
- 16.4 Technology Investment and Product Differentiation
- 16.5 Supply Chain Localization and Resilience
- 16.6 Distribution and Customer Acquisition
- 16.7 Partnership, Acquisition and Capacity Strategy
- 16.8 Regional Expansion Priorities
- 16.9 Short-, Medium- and Long-Term Actions
Chapter 17 Competition Outlook
- 17.1 Industry Competition Characteristics
- 17.2 Market Structure and Concentration
- 17.3 Market Share and Competitive Positioning, 2024
- 17.4 Company-Wise Revenue and Product Benchmarking
- 17.5 Production and Service Capacity Benchmarking
- 17.6 Technology, Pricing and Differentiation
- 17.7 Regional Footprint and Distribution Strength
- 17.8 Mergers, Acquisitions and Strategic Alliances
- 17.9 New Entrants and Competitive Threats
- 17.10 Porter's Five Forces and Industry Attractiveness
- 17.11 Competitive Outlook, 2024-2032
Chapter 18 Company Profiles
- 18.1 Company Coverage and Selection Criteria
- 18.2 Cisco Systems
- 18.2.1 Business Description
- 18.2.2 Company Ownership and Geographic Presence
- 18.2.3 Product and Service Portfolio
- 18.2.4 Manufacturing and Operating Footprint
- 18.2.5 Production Capacity and Expansion Plans
- 18.2.6 Financial Performance and Investment
- 18.2.7 Market Share and Competitive Position
- 18.2.8 Technology and Innovation Capabilities
- 18.2.9 Strategic Alliances or Partnerships
- 18.2.10 Recent Developments
- 18.2.11 Growth Strategy and Outlook
- 18.3 Citrix Systems
- 18.4 Nutanix
- 18.5 Silver Peak
- 18.6 Allot Communications
- 18.7 Arista Networks
- 18.8 Hewlett Packard Enterprise
- 18.9 Aryaka Networks
- 18.10 Juniper Networks
- 18.11 Peplink
- 18.12 Other Relevant Market Participants
Note: Every listed company is profiled on the structure shown under the first company. The company list is preliminary and may change based on research findings, market developments, data availability and client requirements.
Chapter 19 Disclaimer
- 19.1 Research and Forecast Disclaimer
- 19.2 Data Source and Estimation Limitations
Note: The depth of individual sections depends on data availability for this market. Volume, capacity, trade and other unit-based metrics are included where applicable.