Field decline, not demand growth, sets most spending
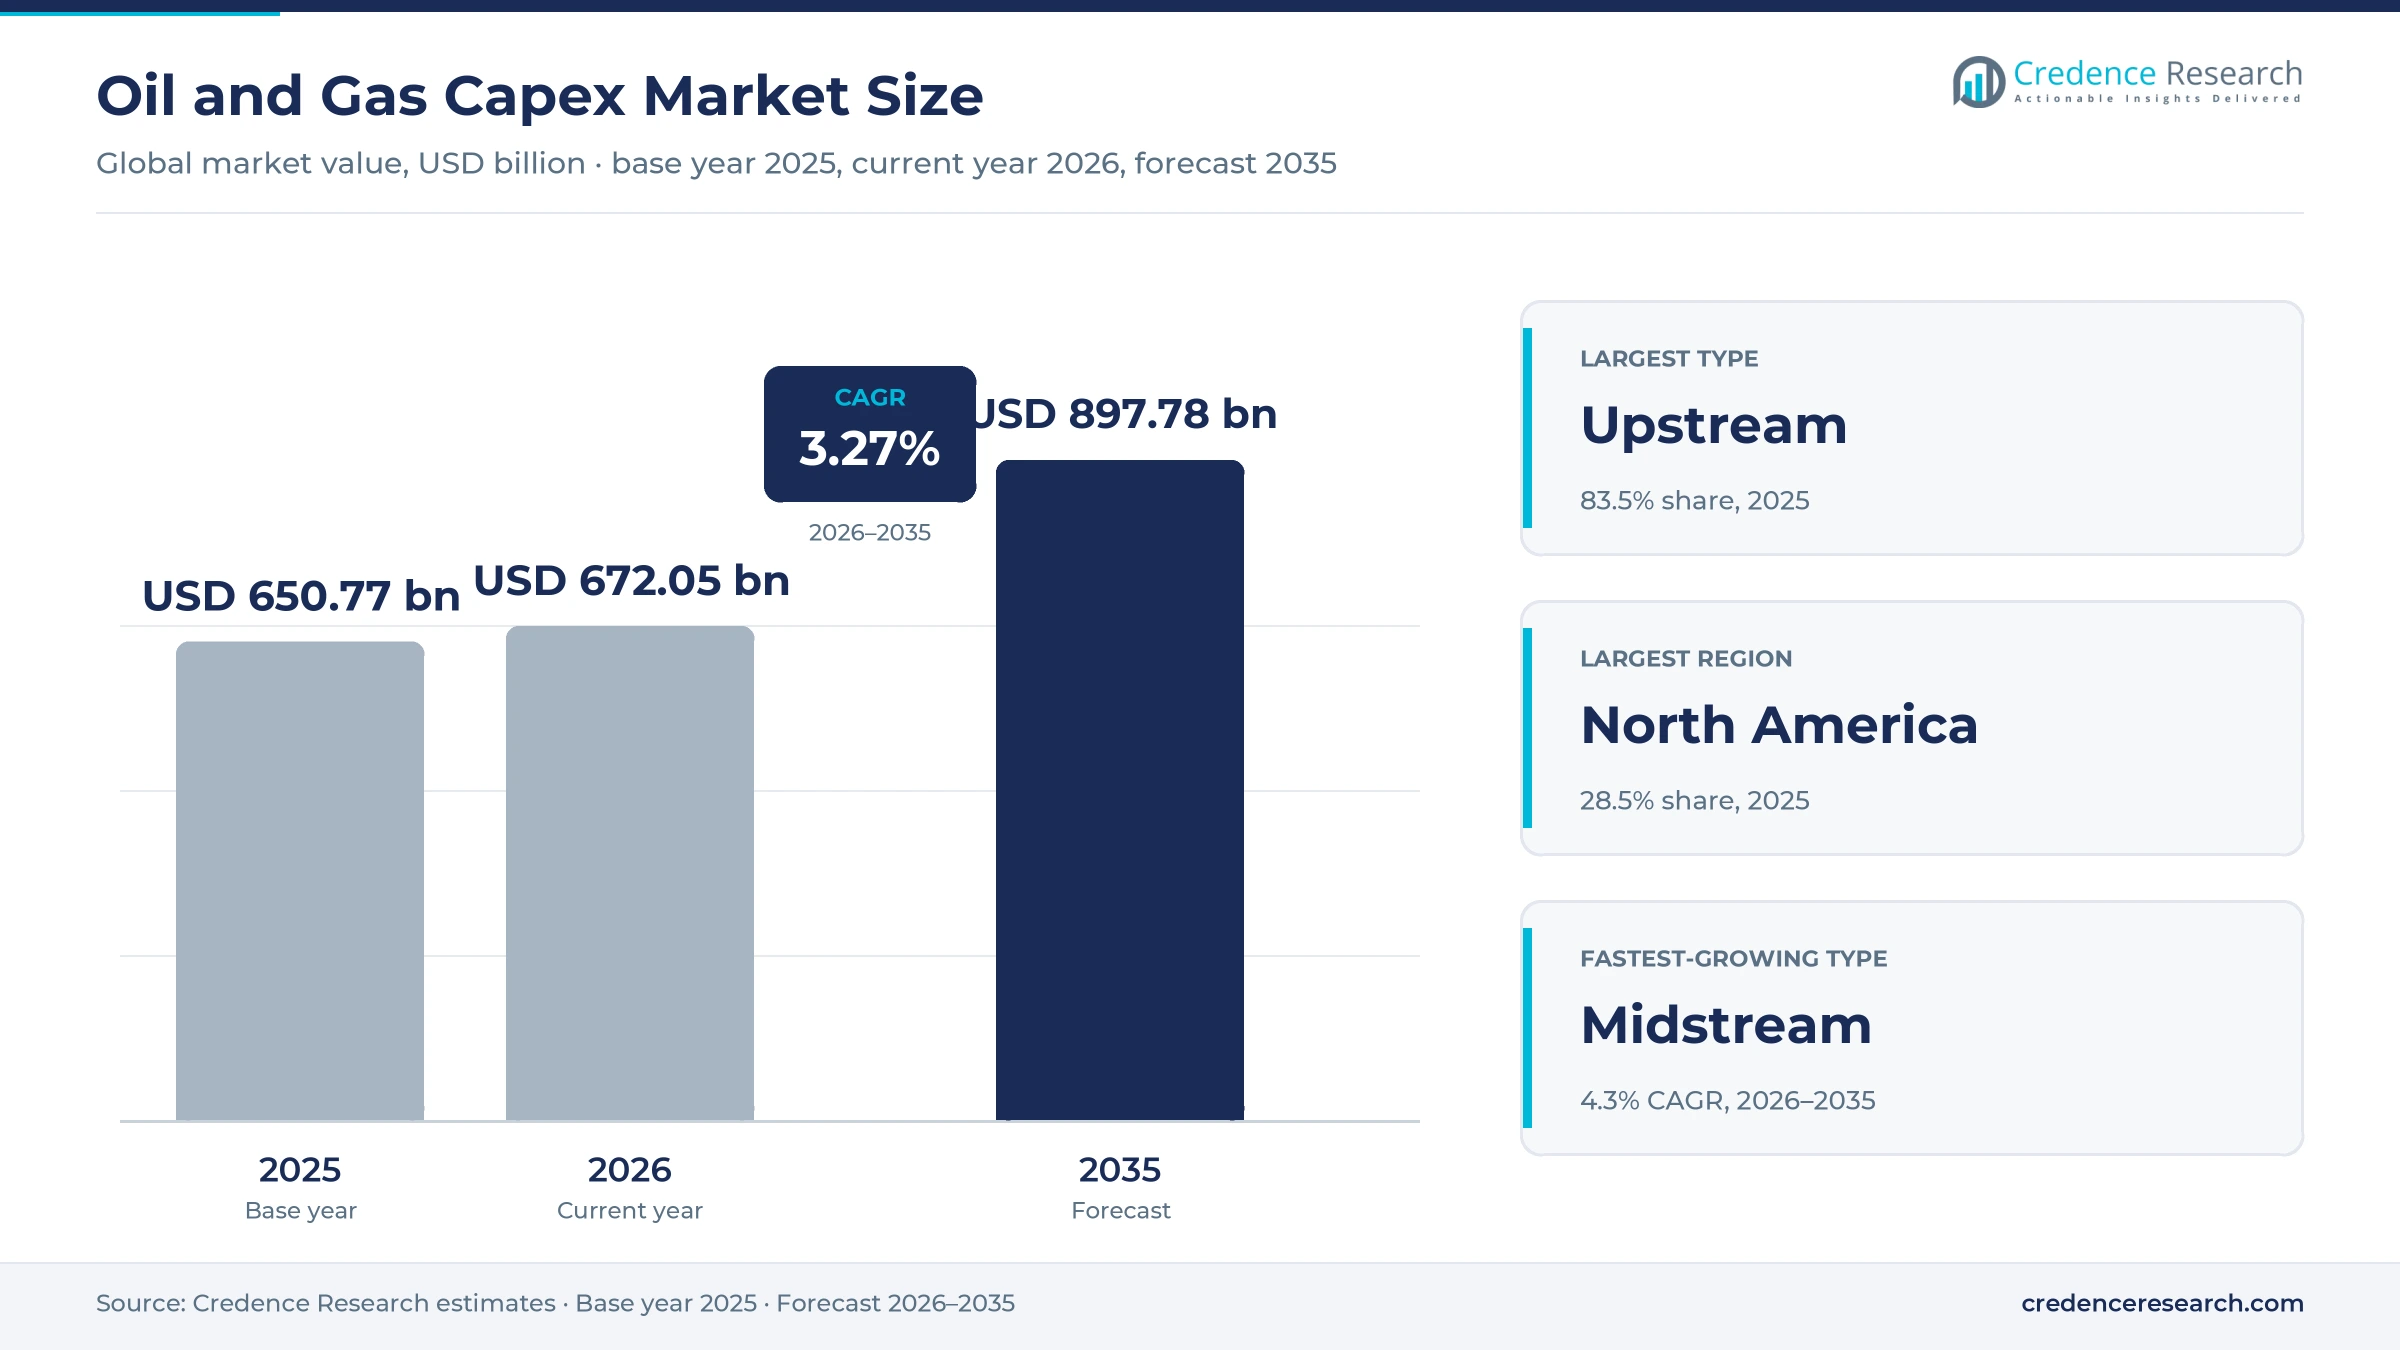
The global oil and gas capex market was valued at USD 650.77 billion in 2025 and is projected to increase from USD 672.05 billion in 2026 to USD 897.78 billion by 2035, registering a CAGR of 3.27% during 2026–2035. Spending covers drilling and completing wells, building offshore production hubs, liquefaction trains and pipelines, and upgrading refineries, and most of it is needed to keep output from falling at fields already in production. North America held the largest regional share, 28.5% in 2025, because U.S. shale, Canadian oil sands and new Gulf Coast LNG plants absorb steady capital every year. Latin America is the fastest-growing region at 4.5% a year, as deepwater projects off Brazil and Guyana move from approval to construction. The most important change is the war that followed the attacks on Iran on Feb. 28, 2026, which shut Qatar's Ras Laffan LNG complex and disrupted Gulf exports, pushing buyers toward supply security outside the region.
Capital goes first to holding output at existing fields
The market counts the capital expenditure that national oil companies, international majors and independent producers commit to finding, developing, transporting and refining oil and natural gas. It includes exploration and development wells, offshore platforms and floating production units, LNG liquefaction and export terminals, crude and gas pipelines, storage and refinery upgrades. Buyers commit this spending through multi-year budgets and project approvals, and most of it is paid out to drilling contractors, service companies, equipment makers and engineering contractors.
Operating costs, acquisitions of producing assets, share buybacks and spending on power, renewables and low-carbon businesses are excluded, as is petrochemical capacity that is not integrated with a refinery. The value chain runs from the operator budget through engineering and construction contractors to rig owners and equipment suppliers, and each link earns its margin from how much of a project it controls.
Oil and Gas Capex Market Insights
- The oil and gas capex market was valued at USD 650.77 billion in 2025 and reaches USD 897.78 billion by 2035, growing at a 3.27% CAGR during 2026–2035.
- North America held 28.5% of 2025 spending, as shale drilling, Canadian oil sands and new Gulf Coast LNG plants draw capital every year.
- Upstream took 83.5% of 2025 spending, because nearly 90% of upstream investment since 2019 has gone to offsetting field decline, according to the IEA.
- Natural gas spending is set to rise by more than 10% to USD 330 billion in 2026 while oil supply spending falls below USD 500 billion, according to the IEA.
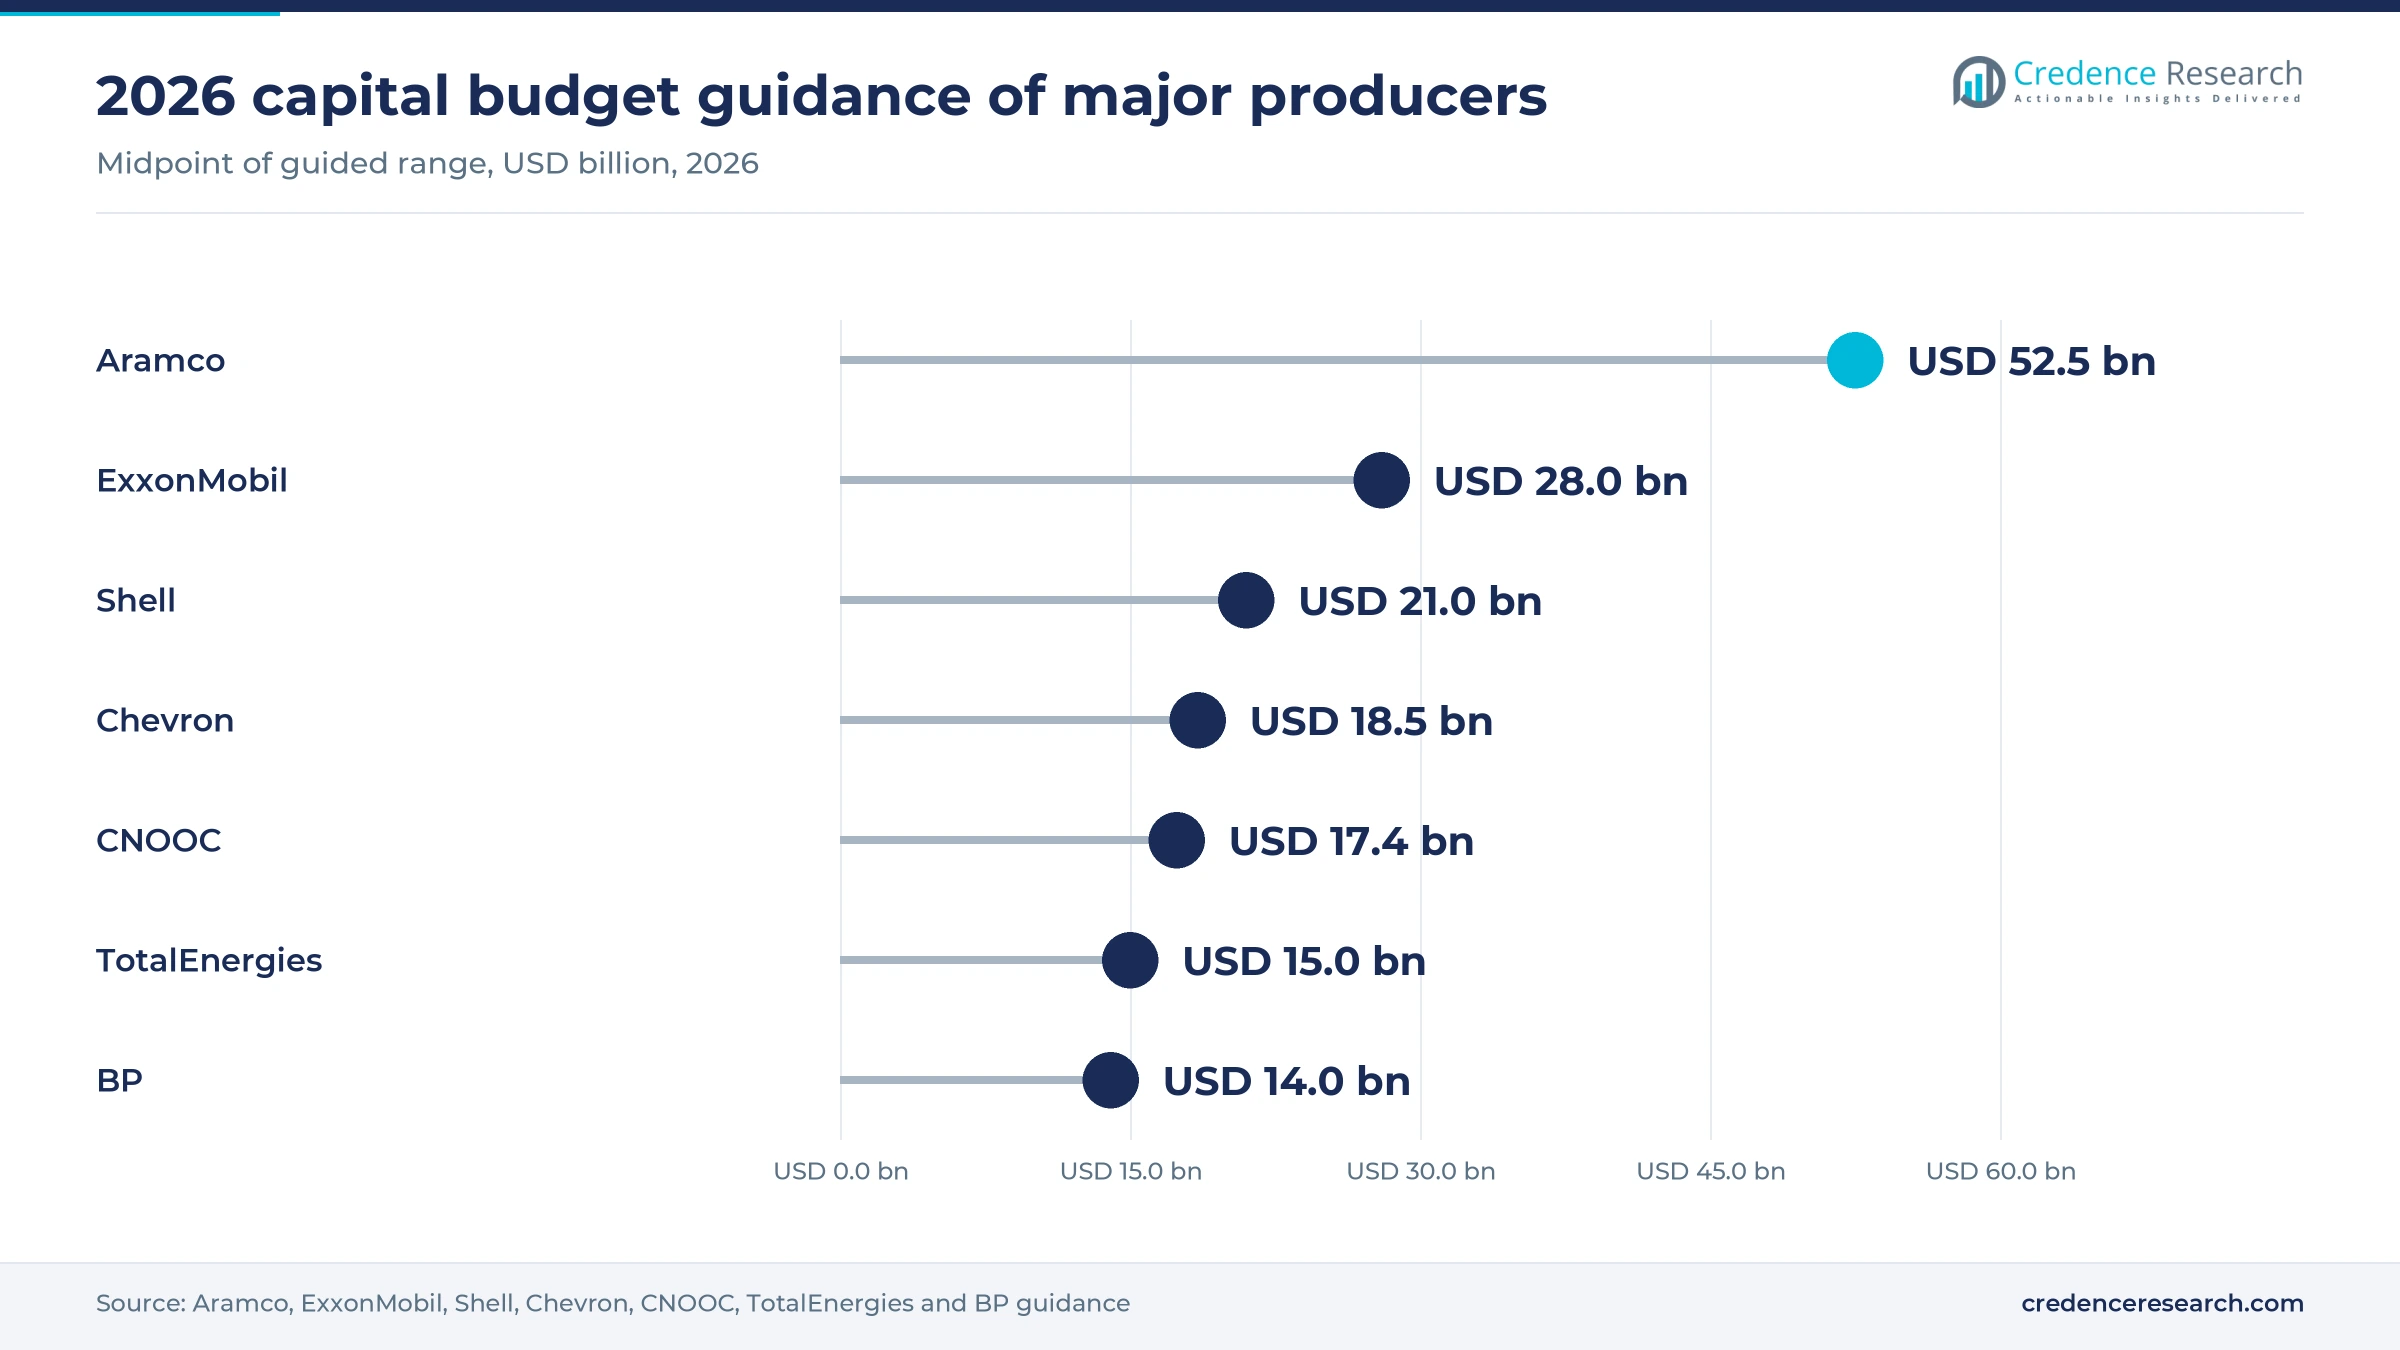
- Aramco set 2026 capital investment guidance at USD 50 billion to USD 55 billion, the largest single capital budget among oil and gas producers.
Upstream wells take most capital while LNG grows fastest
Wells take most capital while LNG and pipelines grow fastest
Based on type, the market is categorized into upstream, midstream and downstream. Upstream led with 83.5% of 2025 spending because wells and production facilities must be replaced continuously, and the IEA World Energy Investment 2026 report shows upstream investment broadly steady at about USD 546 billion in 2026, according to MEES. Midstream grows fastest at 4.3% as export capacity is built out, with more than 80 bcm a year of U.S. liquefaction capacity approved in 2025 across Louisiana LNG, Corpus Christi, CP2, Rio Grande and Port Arthur, according to Oil & Gas Journal.
Onshore wells lead while deepwater hubs grow faster
Based on application, the market is categorized into onshore and offshore. Onshore held 67.0% of 2025 spending because shale, tight oil and Middle East land fields need constant new wells, and Chevron expects nearly USD 6.0 billion of its 2026 budget to go to U.S. shale and tight assets. Offshore grows fastest at 4.1% as large discoveries move into development, and Chevron also plans about USD 7.0 billion for offshore growth in Guyana, the Eastern Mediterranean and the Gulf of America. Offshore projects lock in spending for several years once they are approved.
State producers lead and grow fastest on reserve control
Based on end user, the market is categorized into national oil companies, international oil companies and independent E&P companies. National Oil Companies led with 52.0% of 2025 spending because they control most remaining reserves, and OPEC members held 1,241 billion of the world's 1,567 billion barrels of proven crude reserves at the end of 2024, according to OPEC. National Oil Companies also grow fastest at 3.7%, for a different reason, because their budgets are set against five-year capacity targets rather than quarterly returns, with Petrobras setting capex of USD 109 billion for 2026 to 2030. Independents trail because their shale budgets track short-term oil prices.
| Segment Group | Leading Sub-segment | Share, 2025 | Fastest-growing Sub-segment | CAGR, 2026–2035 |
|---|---|---|---|---|
| By Type | Upstream | 83.5% | Midstream | 4.3% |
| By Application | Onshore | 67.0% | Offshore | 4.1% |
| By End User | National Oil Companies | 52.0% | National Oil Companies | 3.7% |
Capacity costs set the bill for each new project
Project cost is set by the unit of capacity a buyer is paying for, whether a metric ton of LNG, a barrel a day of pipeline throughput or a cubic foot of gas. Large projects are priced through lump-sum or reimbursable engineering contracts, so steel, labor and contractor capacity move the final bill more than the oil price does. Woodside's Louisiana LNG works out at about USD 1,060 per metric ton of annual capacity, while the Vaca Muerta Sur export pipeline costs roughly USD 5,200 per barrel a day of peak capacity. Projects with existing permits and pipeline access come in cheaper, which favors brownfield expansions over new sites.
| Project type | Typical price or fee | Basis |
|---|---|---|
| LNG export plant | About USD 1,060 per metric ton a year (USD 17.5 bn for 16.5 Mtpa) | Credence Research estimate from Woodside figures, April 2025 |
| Crude export pipeline | About USD 5,200 per b/d (about USD 2.9 bn for up to 550,000 b/d) | Credence Research estimate from VMOS financing, July 2025 |
| Shale gas development | About USD 50 bn per Bcf/d (USD 100 bn for about 2 Bcf/d by 2030) | Credence Research estimate from Aramco Jafurah figures, December 2025 |
| Asian upstream portfolio | More than USD 15 bn over five years for eight projects and 15 wells | Eni, November 2025 |
Request a Free Sample
Fill in your details and we'll send you a free sample report.
- Sample data tables & charts
- Research methodology
Decline rates, gas build-out and state budgets lift spend
Natural decline forces spending just to hold output
Most upstream capital is spent to replace barrels that existing fields lose every year, which keeps budgets high even when demand growth slows. Nearly 90% of upstream oil and gas investment since 2019 has gone to offsetting declines rather than meeting new demand, according to the IEA. Without new investment, oil output would fall by about 5.5 million barrels a day each year over the next decade, the agency estimates. Deep offshore oil fields decline at 10.3% a year after peak, against 4.2% for onshore fields. This treadmill favors drilling contractors and service firms with steady infill work, and it limits how far producers can cut capex in a price downturn.
Gas and LNG projects draw a rising share of capital
Gas supply is taking a larger part of budgets because buyers in Asia and Europe want long-term LNG volumes and producers see steadier returns from contracted gas. Global investment in natural gas projects is set to rise by more than 10% to USD 330 billion in 2026, while oil supply investment falls below USD 500 billion, according to the IEA World Energy Investment 2026 report cited by Gas Processing News. U.S. projects under construction in 2025 would add about 130 bcm of annual export capacity, nearly doubling U.S. export capacity, the IEA said. Shell plans to grow LNG sales by 4% to 5% a year to 2030. Liquefaction contractors and gas pipeline builders gain the most from this shift.
State capacity programs keep the largest budgets running
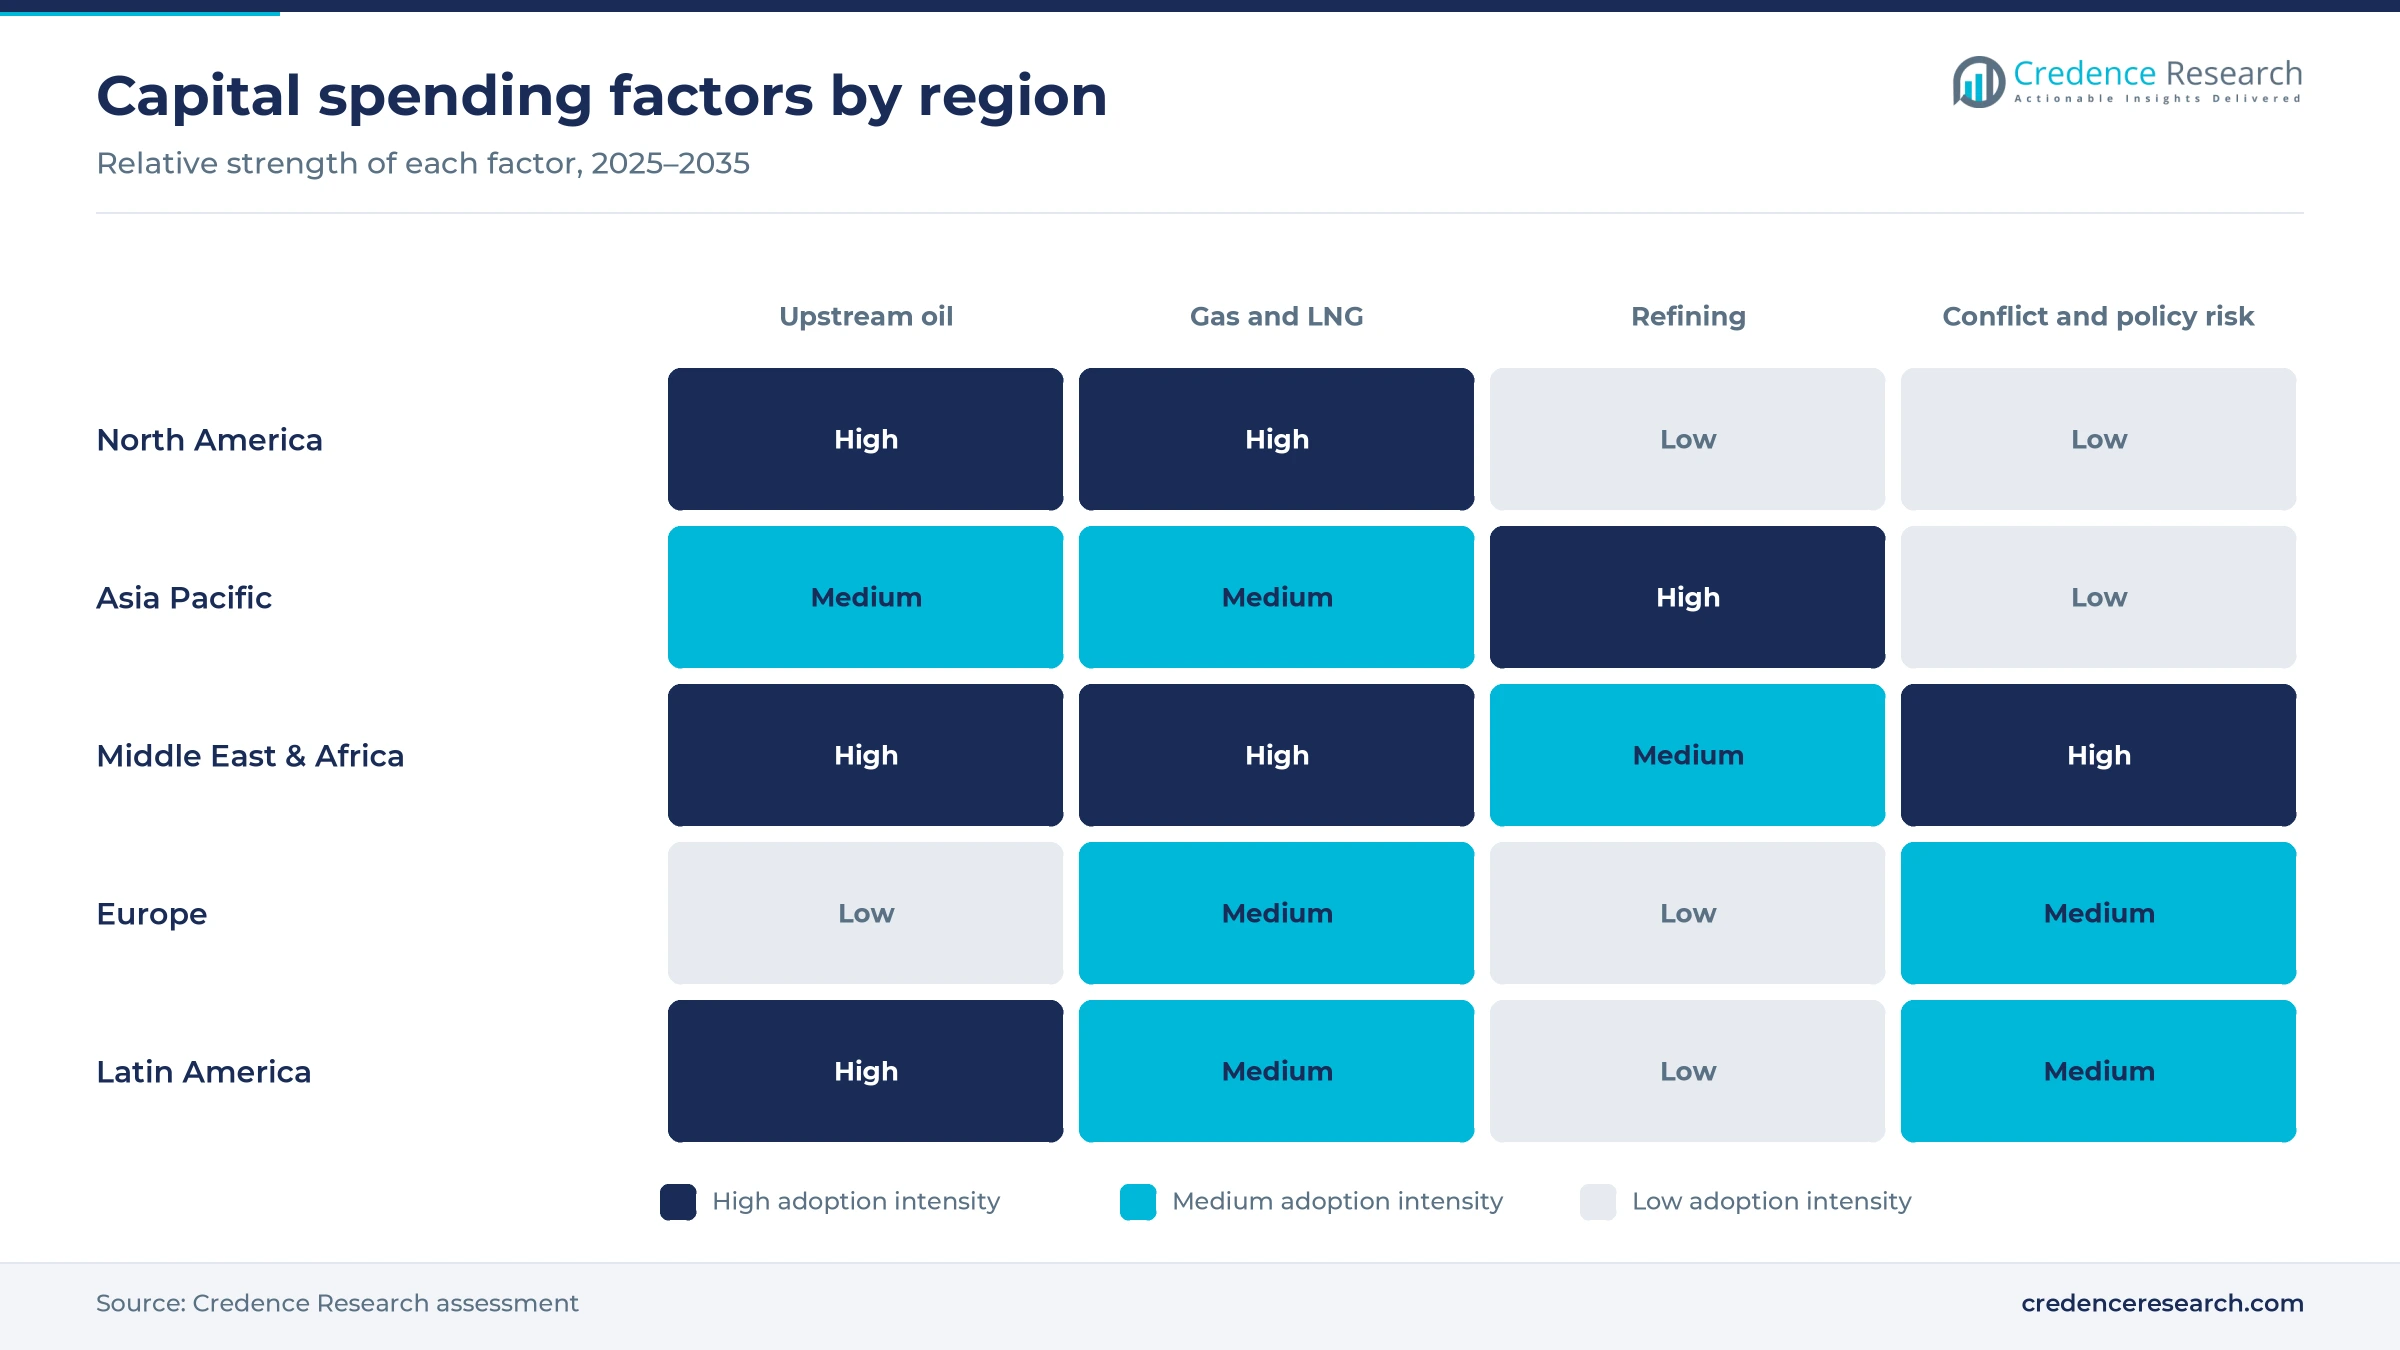
National oil companies spend to defend market share and fund long-term capacity targets, so their budgets move less with short-term prices than those of listed producers. Aramco invested USD 52.2 billion in 2025 and set guidance of USD 50 billion to USD 55 billion for 2026, according to Zawya. In November 2022, ADNOC said its board approved a USD 150 billion budget for 2023 to 2027 and brought its 5 million barrels a day capacity target forward to 2027. Aramco has also raised its gas growth target to 80% above 2021 levels, according to World Oil. These programs give Gulf contractors a multi-year order book and keep the region's rig fleet busy.
Supply security after the Gulf war revives short-cycle drilling
Higher prices and lost Gulf barrels have turned supply security into a budget priority for producers outside the Middle East. The U.S. Energy Information Administration expects Brent to stay near USD 100 a barrel for the rest of 2026 and to ease to about USD 77 by the fourth quarter of 2027. U.S. commercial crude inventories fell to 410 million barrels at the end of October 2026, the lowest end-October level since 2014. The agency forecasts record U.S. crude output of 14.3 million barrels a day in 2027. SLB expects short-cycle activity in North America and parts of Latin America to strengthen first, followed by deepwater projects, according to IntelliNews.
Majors trim budgets while shale does more with fewer rigs
Majors are shifting toward smaller, higher-return budgets
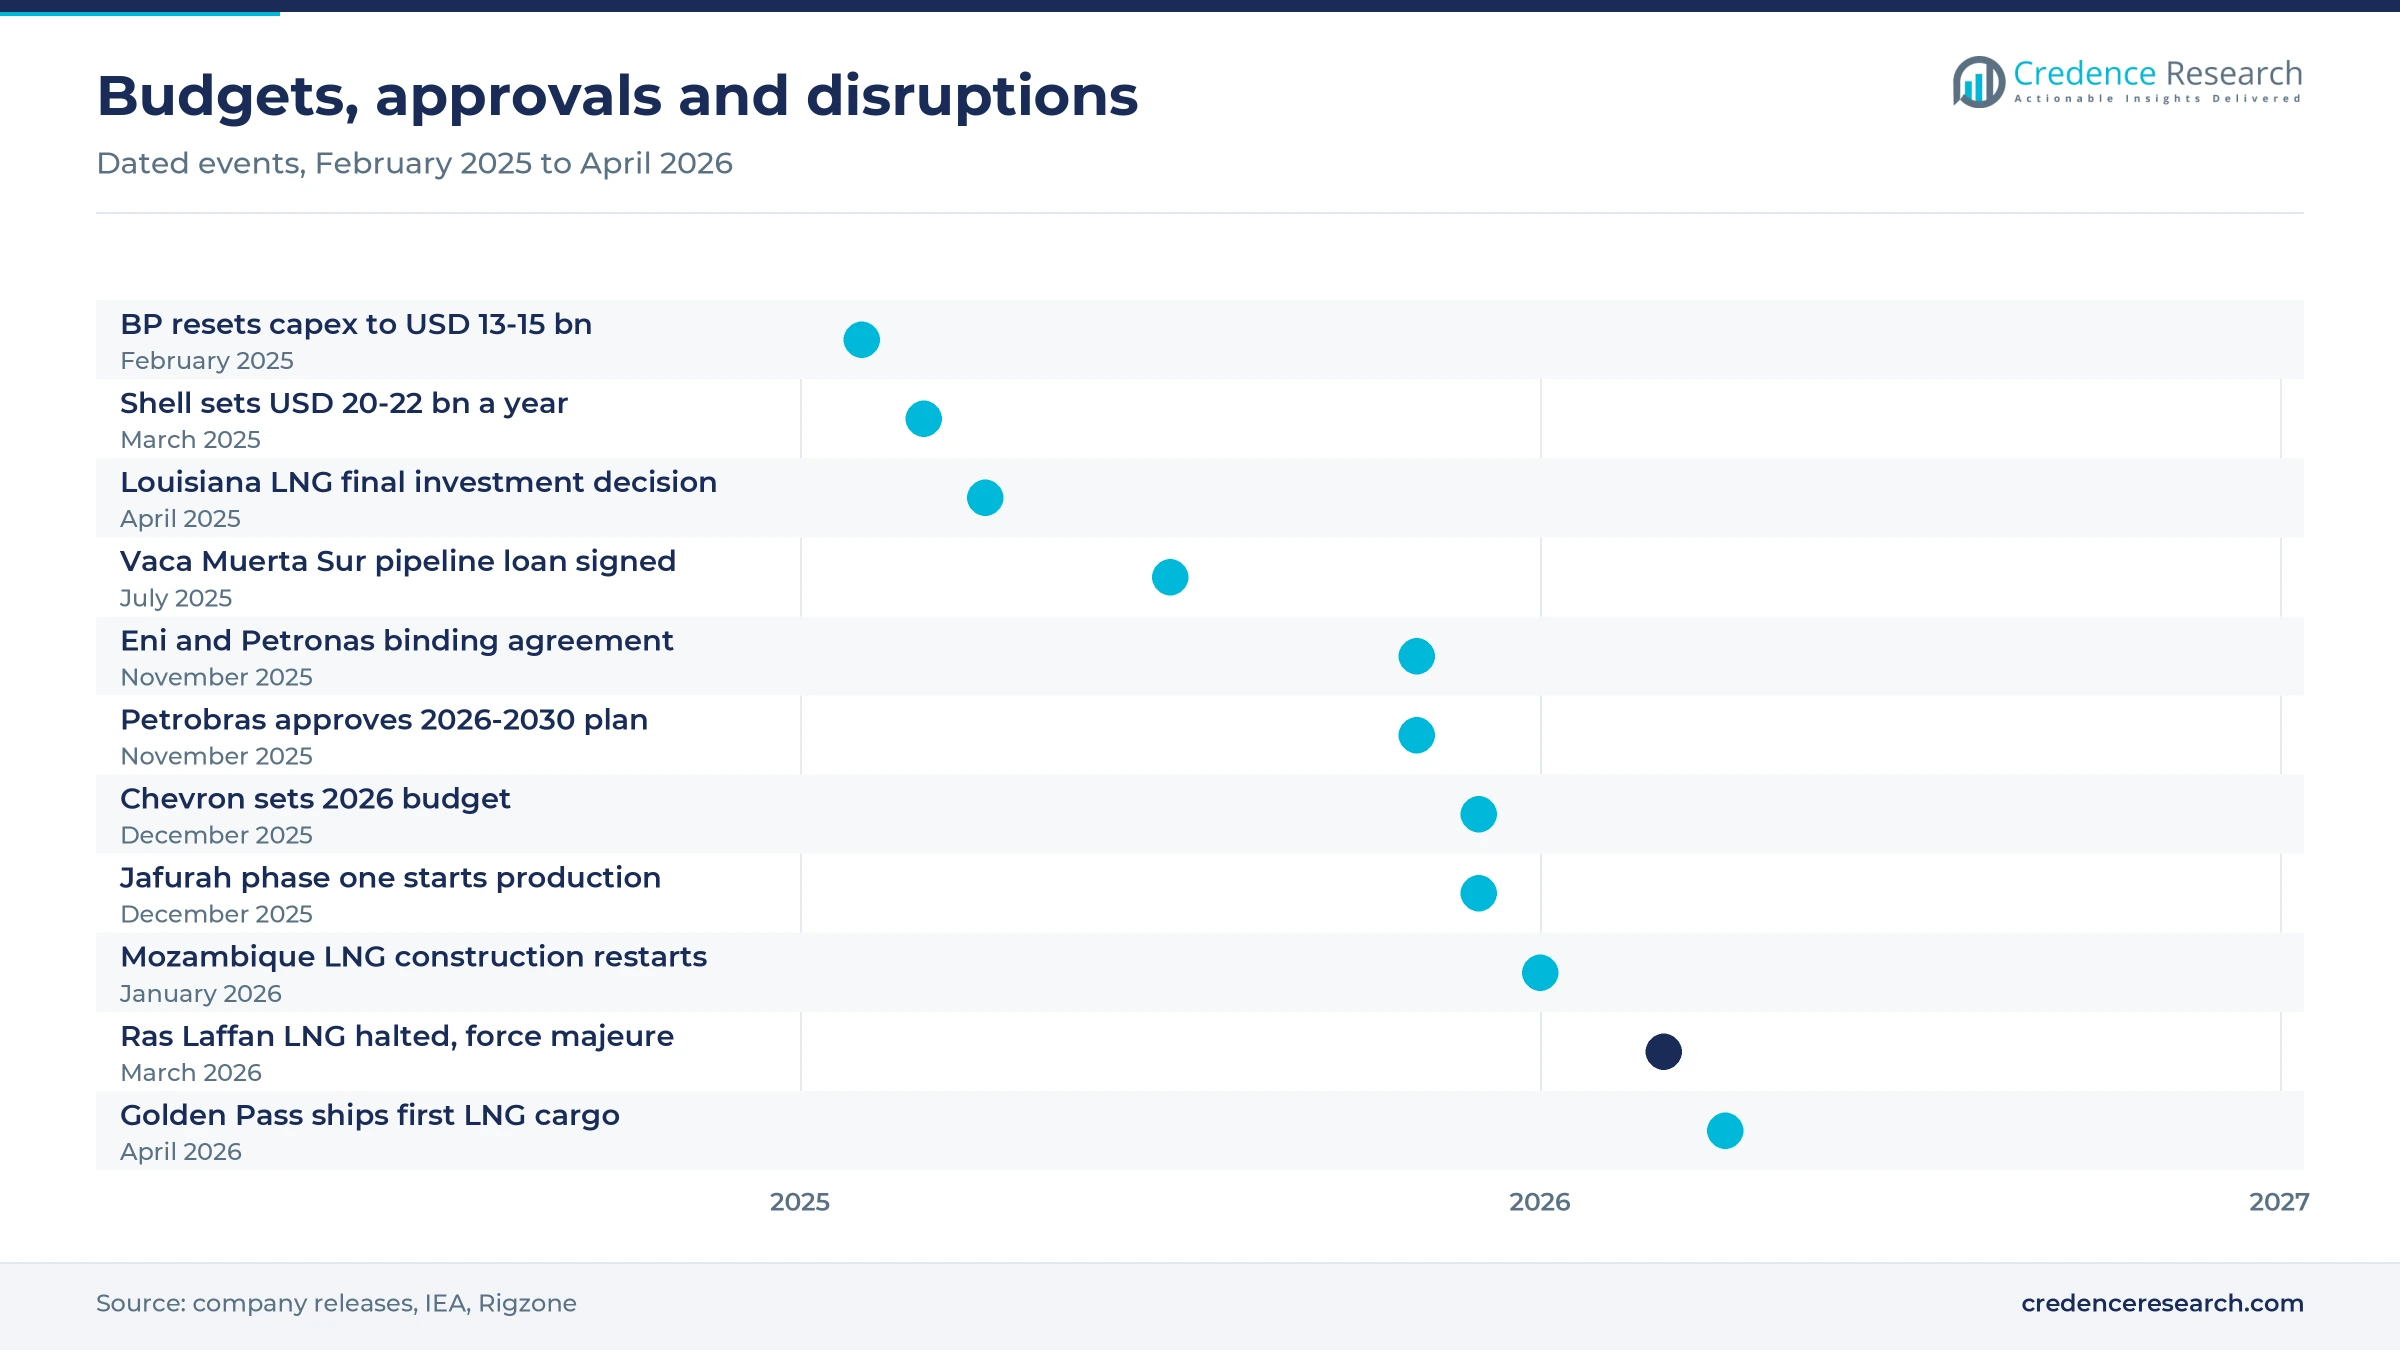
International majors are shifting toward tighter capital budgets to protect shareholder payouts, which concentrates their spending on a short list of advantaged assets. BP cut its capex to USD 13 billion to USD 15 billion a year through 2027 in its February 2025 reset, with about USD 10 billion a year for upstream oil and gas. Shell set USD 20 billion to USD 22 billion a year for 2025 to 2028, down from USD 22 billion to USD 25 billion. TotalEnergies expects net investment of about USD 15 billion in 2026, against about USD 17.1 billion in 2025, according to Rigzone. Contractors that win work on Guyana, the Permian and LNG gain, while marginal basins lose capital.
Shale operators are shifting toward more output per rig
U.S. shale producers are shifting toward longer laterals and faster drilling, so output rises while rig activity and capital per barrel fall. Lower 48 active rigs dropped from 750 in December 2022 to 517 in October 2025, while Permian oil output rose 18% even as Permian rigs fell 29%, according to EIA data. Diamondback said its well costs per lateral foot had fallen to 2020 levels, and it cut its 2025 capex by USD 500 million. Pressure pumpers in the hydraulic fracturing business feel this most, because efficiency gains reduce the number of frac fleets needed for each barrel produced.
Deepwater basins open a long-cycle opening for contractors
Deepwater basins in South America offer a multi-year opening for floating production, subsea and drilling contractors, because approved projects commit spending for five years or more. Petrobras plans USD 69.2 billion of E&P projects in its 2026 to 2030 implementation portfolio and eight new production systems by 2030, seven already contracted, according to Petrobras. ExxonMobil started Yellowtail in Guyana four months ahead of schedule in 2025, adding 250,000 barrels of oil equivalent a day of capacity. Builders of floating production, storage and offloading vessels with yard slots and standard hull designs are best placed to win the next orders.
Asian refining expansion opens a gap in downstream spending
Refinery builders have an opening in Asia, where fuel demand is still growing while refinery investment elsewhere has fallen to a low. Global refinery investment in 2025 was set to reach its lowest level in ten years, according to the IEA. India plans to lift its refining capacity from 258.1 million metric tons a year to 309.5 million metric tons by 2030, according to a Ministry of Petroleum and Natural Gas release of Dec. 1, 2025. Chevron expects only USD 0.9 billion to USD 1.1 billion of downstream capex in 2026, showing how little majors now commit to refining. Licensors, process equipment makers and Indian engineering firms gain most from this gap, while Western refiners keep closing older units.
Price swings, tariffs and Gulf conflict cloud budgets
Price swings make annual budgets hard to set
Price risk constrains budget planning, and it exposes listed independents with short-cycle shale programs most. Brent averaged USD 69.04 a barrel in 2025, and in January 2026 the EIA expected USD 55.87 for 2026, according to Rigzone, before the Gulf war lifted prices toward USD 100. At USD 50 oil, almost half of executives in the Dallas Fed survey of July 2025 expected significant production declines. This price sensitivity makes listed independents the swing spenders in the market, while state producers set the floor under total capex.
Steel tariffs raise the cost of every U.S. well
Higher U.S. steel tariffs lift the cost of drilling and completion, and smaller operators without long-term supply contracts carry most of the increase. Tariffs raised drilling and completion costs for about three quarters of executives after the rate rose from 25% to 50%, and the most common answer was an increase of 4% to 6%, according to the Dallas Fed in July 2025. Buyers of casing and tubing face the largest price change, which reduces the number of wells each budget can fund.
Gulf conflict halts projects and delays contractor work
The war that began on Feb. 28, 2026 has damaged facilities and stopped work, which hits Gulf contractors and LNG buyers first. QatarEnergy halted LNG production at Ras Laffan on March 2, 2026, after a drone attack and declared force majeure on a plant that supplies about a fifth of global LNG, according to Rigzone. The IEA expects Middle East oil and gas investment to fall 1% in 2026. Halliburton cited lower activity in Saudi Arabia and Qatar in its first-quarter 2026 results.
Sanctions shrink the capital pool open to Western suppliers
Sanctions keep large reserve holders outside the reach of Western capital and service firms, which narrows the market that international contractors can bid for. Russia's share of global upstream investment has fallen to about 6%, according to the IEA World Energy Investment 2025 report, and Iran remains under broad U.S. sanctions. Service companies that exited Russia lost a large customer base, while Chinese and local suppliers took over much of the work. This access constraint is unlikely to ease before 2030, which limits the bidding pool for Western suppliers.
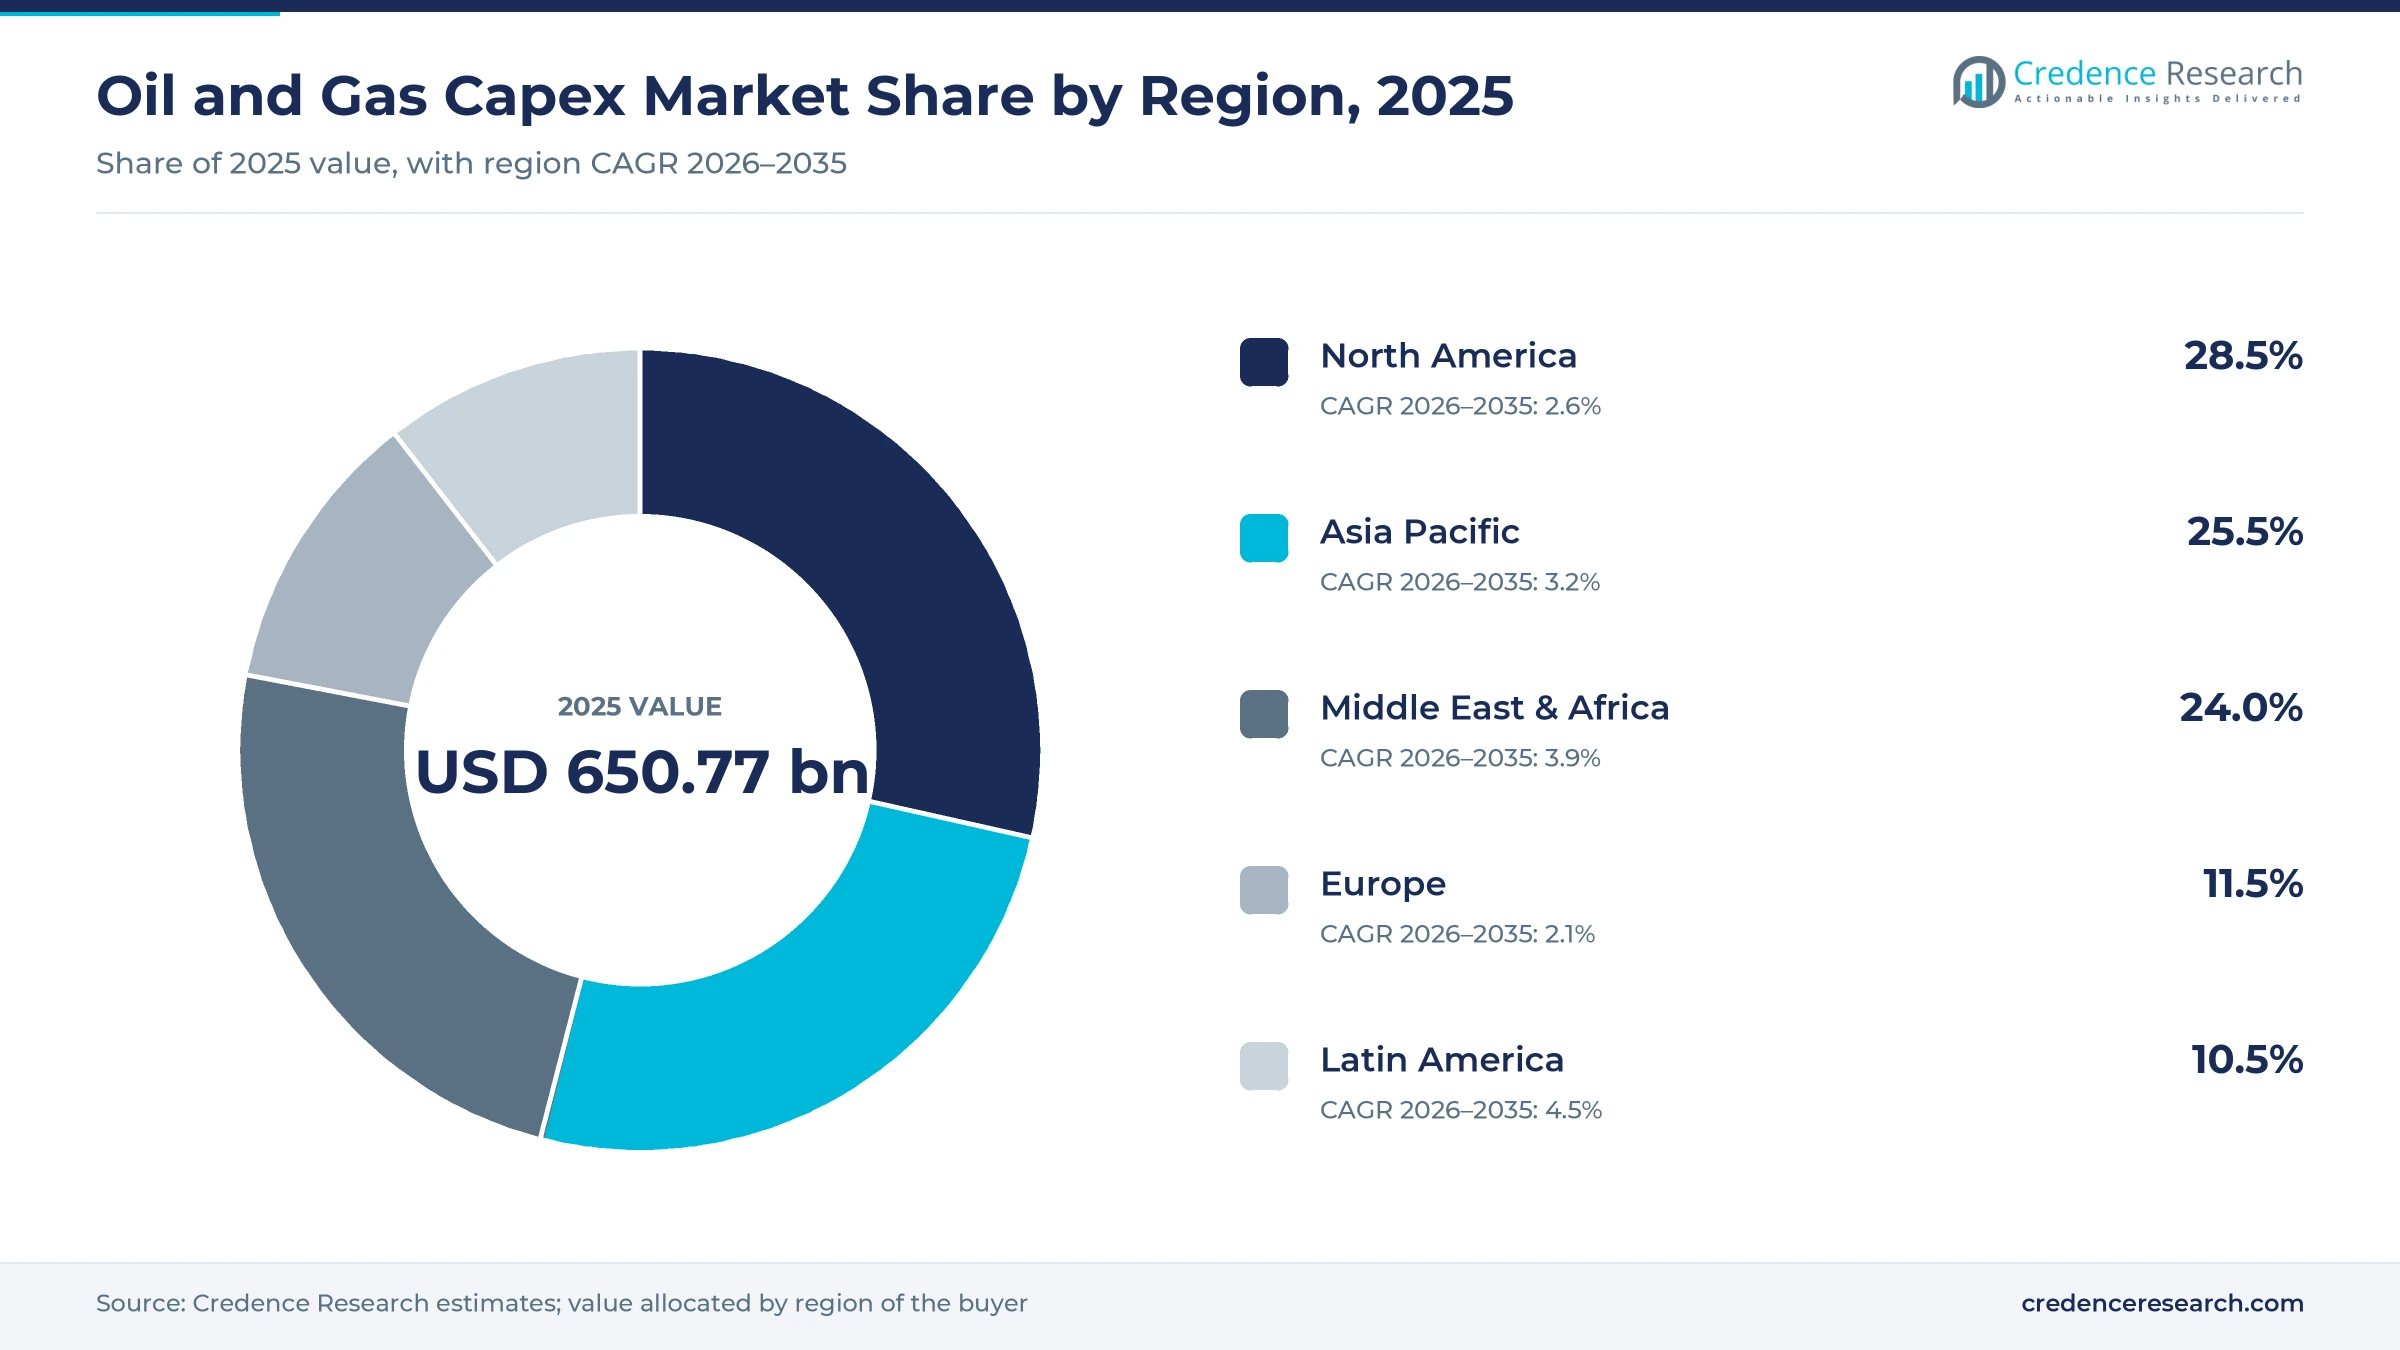
North America leads as Latin America adds deepwater
| Region | Value, 2025 (USD billion) | Share, 2025 | CAGR, 2026–2035 |
|---|---|---|---|
| North America | 185.47 | 28.5% | 2.6% |
| Asia Pacific | 165.95 | 25.5% | 3.2% |
| Middle East & Africa | 156.18 | 24.0% | 3.9% |
| Europe | 74.84 | 11.5% | 2.1% |
| Latin America | 68.33 | 10.5% | 4.5% |
North America leads on shale, oil sands and Gulf Coast LNG
North America held 28.5% of 2025 spending and grows at 2.6% a year, the largest regional pool because U.S. shale needs continuous drilling and Gulf Coast LNG plants are under construction. Lower 48 crude output set a monthly record of 11.4 million barrels a day in July 2025, according to the EIA. In Canada, capital spending of roughly CAD 41 billion is expected in 2026, slightly up from 2025, according to CAPP. Growth stays below the global rate because efficiency gains cut the capital needed for each barrel.
Asia Pacific spends on offshore China and Southeast Asian gas
Asia Pacific held 25.5% of 2025 spending and grows at 3.2% a year, led by Chinese state producers and regional gas developers. CNOOC set a 2026 capex budget of RMB 112 billion to RMB 122 billion and started adjustment projects at Penglai 19-3, Weizhou 10-3 and Huizhou 25-8 in the first half of 2026, according to Rigzone. The Eni and Petronas venture listed in recent developments adds a new Southeast Asian spender. The Indian refining plan noted above keeps downstream spending in the region higher than elsewhere.
Middle East & Africa holds share despite the Gulf conflict
Middle East & Africa held 24.0% of 2025 spending and grows at 3.9% a year, supported by state budgets that move less with prices. The Middle East's share of global upstream investment reached 20% in 2025, the highest on record, according to the IEA. The Gulf conflict noted in the challenges trims 2026 spending, but the ADNOC and Aramco programs keep a high floor under regional budgets. In Africa, the restart of Mozambique LNG returns one of the continent's largest projects to construction.
Europe sustains Norwegian investment as Russia drops out
Europe held 11.5% of 2025 spending and grows slowest at 2.1% a year, because Russian spending is shrinking and most North Sea basins are mature. Norway is the exception, as oil and gas companies invested a record NOK 273 billion in 2025 and expect NOK 275 billion in 2026 before a fall to NOK 227 billion in 2027, according to Statistics Norway survey data reported by Baird Maritime. Suppliers that depend on Norwegian projects face a step down in orders after 2026.
Latin America grows fastest on Brazil, Guyana and Vaca Muerta
Latin America held 10.5% of 2025 spending and grows fastest at 4.5% a year, as deepwater and shale projects move into construction. Guyana set a quarterly production record of more than 900,000 gross barrels a day in the first quarter of 2026, according to ExxonMobil. In Argentina, the Vaca Muerta Sur pipeline priced above is set to start operating by the end of 2026, with capacity rising to 550,000 barrels a day in 2027. The Petrobras program described in the trends makes Brazil the region's largest spender.
LNG approvals and Asian upstream deals, 2025 to 2026
| Development | Status and market relevance |
|---|---|
| In November 2025, Eni and Petronas signed a binding agreement to create an equally owned company combining 19 upstream assets in Indonesia and Malaysia, with more than USD 15 billion of planned investment over five years. | Agreement signed; closing is expected in 2026 subject to government and partner approvals. |
| In April 2025, Woodside took the final investment decision on the three-train, 16.5 Mtpa Louisiana LNG project, with forecast capital expenditure of USD 17.5 billion and first LNG targeted for 2029. | Final investment decision taken; construction under way. |
| In January 2026, TotalEnergies and its partners restarted onshore and offshore construction at Mozambique LNG after lifting force majeure in November 2025, with first LNG targeted for 2029. | Construction resumed after a halt in place since 2021. |
| In December 2025, Aramco began gas production at phase one of Jafurah at 450 MMcfd, the first output from the largest liquids-rich shale gas play in the Middle East. | Operational launch of phase one; later phases still under development. |
| In April 2026, Golden Pass LNG shipped its first export cargo after Train 1 achieved first LNG production, according to ExxonMobil. | Operational launch of the first train; further trains still in construction. |
Longer laterals, floating hubs and subsea tiebacks
- Extended-reach horizontal wells let shale operators drain more rock from each pad, which is why rig counts fall while output rises.
- Standardized floating production units shorten delivery times for deepwater hubs, as Petrobras and ExxonMobil repeat hull designs across projects.
- Subsea tiebacks connect small discoveries to existing hubs through subsea production and processing systems, avoiding the cost of a new platform.
- Modular liquefaction trains are built in fabrication yards and shipped to site, reducing field labor on large LNG projects.
Need a Custom Version of This Report?
Tailor the scope, geography, or segments to your exact requirements.
- Custom geography or segment scope
- Direct access to our analyst team
State producers outspend majors on capacity growth
Capex is captured by a supply chain of service companies, engineering contractors, rig owners and equipment makers, while the largest spenders are Saudi Aramco, ADNOC, PetroChina, CNOOC and Petrobras, followed by ExxonMobil, Chevron, Shell, TotalEnergies and BP. ExxonMobil said in its December 2025 corporate plan that its higher 2030 outlook comes with no increase in capital spending. SLB, Halliburton and Baker Hughes compete for well construction, completions and reservoir work, with Weatherford in completions and managed pressure drilling. TechnipFMC won subsea production system work for Eni's Maha project offshore Indonesia in November 2025, and Saipem's merger with Subsea7 into Saipem7 cleared U.S. review in August 2026, with completion expected in the second half of 2026. Bechtel and Technip Energies lead LNG engineering, and Technip Energies won six modular trains for the 9.5 Mtpa Commonwealth LNG plant in August 2025. Transocean supplies deepwater rigs, Tenaris supplies casing and tubing and NOV supplies rigs and drilling equipment.
Who captures the spending once a budget is approved
Spending decisions are concentrated among a few dozen operators, while the work is spread across a layered supply chain. State producers set the largest budgets, because they hold most reserves, as the OPEC figures above show. The capital then flows to engineering and construction contractors, drilling contractors, rig owners and service majors, which compete for well construction, subsea and reservoir work. Entry barriers are highest in deepwater and LNG, where only a handful of contractors can take on lump-sum risk. Margins sit with owners of scarce assets such as drillships and yard slots, while land drilling stays competitive.
Companies profiled and their roles in this market
| Company | Type | Role in the market |
|---|---|---|
| SLB | Oilfield services | Well construction, reservoir characterization and production systems for operators worldwide |
| Halliburton Company | Oilfield services | Completions, drilling and reservoir testing services, strongest in North American shale |
| Baker Hughes Company | Oilfield services and equipment | Oilfield services and equipment, including wireline and well integrity evaluation |
| TechnipFMC plc | Subsea systems | Subsea 2.0 trees, flowlines, controls and integrated iEPCI subsea projects |
| Saipem S.p.A. | Offshore engineering and construction | Offshore construction and drilling; merger with Subsea7 into Saipem7 pending |
| Technip Energies N.V. | LNG engineering contractor | Modular SnapLNG liquefaction trains and LNG engineering, procurement and construction |
| Bechtel Corporation | LNG engineering contractor | EPC contractor for Woodside's Louisiana LNG export project |
| Transocean Ltd. | Offshore drilling contractor | Ultra-deepwater and harsh-environment floating rigs for deepwater wells |
| Tenaris S.A. | Tubular supplier | OCTG casing and tubing plus offshore line pipe |
| NOV Inc. | Equipment maker | Land rigs, drilling equipment and completion tools |
| Weatherford International plc | Oilfield services | Completions, drilling and managed pressure drilling services |
Gas and state budgets will carry spending growth
Credence Research's view is that spending growth through 2035 will come mostly from gas, deepwater and state budgets, while listed majors keep their capex flat. The Gulf war has made supply security a budget line in its own right, but it has also shown how quickly projects in one region can stop. Buyers of services should expect steady infill and decline-management work everywhere, with the largest new orders in LNG, Brazil, Guyana and the Gulf once output is restored. Producers with low-cost reserves and long-term gas contracts will keep the strongest negotiating position with contractors.
Company budgets and IEA investment data anchor the model
The report uses 2025 as the base year and forecasts to 2035. Market values in this report come from the Credence Research model, which this edition rolls forward from the previous 2024 estimate using its own growth rate and checks against IEA investment data and published company capital budgets. Segment and regional shares are Credence Research estimates based on company budgets and guidance, IEA and EIA data, OPEC statistics, Statistics Norway and CAPP figures and project announcements. No interviews or surveys were carried out for this edition.
Spending tilts toward gas, deepwater and the Gulf
Through 2035 spending keeps growing at a modest rate, with gas, LNG and pipelines taking a larger share than oil wells. Upstream remains the largest type because decline at existing fields never stops, while midstream grows fastest as new liquefaction trains are approved. Latin America and the Middle East add the most new capacity, and North America stays the largest region on shale and LNG. Europe shrinks once the current Norwegian project wave is complete. Price swings will move listed producers' budgets from year to year, but state programs set the floor under total spending.
Oil prices and Gulf recovery decide the spending path
The outcome depends mainly on how quickly Gulf production recovers and where oil prices settle once inventories rebuild. A fast return of Gulf barrels with Brent back in the 50s would push listed producers to cut budgets and hold the market near the downside case. A lasting security premium, more LNG approvals and steady state budgets would move spending toward the upside case by 2035, while the base case assumes gas growth offsets flat oil spending.
| Scenario | CAGR, 2026–2035 | Value, 2035 | What has to hold |
|---|---|---|---|
| Downside | 1.8% | USD 787.01 billion | Brent returns to the 50s and listed producers cut shale and exploration budgets |
| Base | 3.27% | USD 897.78 billion | Gas and LNG growth offsets flat oil spending as Gulf output recovers by mid-2027 |
| Upside | 4.5% | USD 996.15 billion | A lasting security premium lifts LNG approvals, deepwater sanctions and short-cycle drilling |
Frequently Asked Questions
How big is the oil and gas capex market?
Which oil and gas companies have the highest capital expenditure?
How much is spent on upstream oil and gas each year?
How much crude oil is left in the world?
Which segment takes the largest share of oil and gas capex?
Which region leads oil and gas capital spending?
How has the 2026 Gulf conflict affected oil and gas capex?
Why are oil majors cutting capital spending?
Table of Content
Chapter 1 Market Segmentation
- 1.1 Segmentation Framework
- 1.1.1 Product and Service Classification
- 1.1.2 Application and End-Use Classification
- 1.1.3 Technology and Solution Classification
- 1.1.4 Customer and Distribution Channel Classification
- 1.1.5 Geographic Segmentation
- 1.1.6 Market Segment Definitions and Boundaries
- 1.2 By Type
- 1.2.1 Upstream
- 1.2.2 Midstream
- 1.2.3 Downstream
- 1.3 By Application
- 1.3.1 Onshore
- 1.3.2 Offshore
- 1.4 By End User
- 1.4.1 National Oil Companies
- 1.4.2 International Oil Companies
- 1.4.3 Independent E&P Companies
Chapter 2 Introduction
- 2.1 Report Objectives and Scope
- 2.2 Product Definition and Industry Terminology
- 2.3 Market Inclusions and Exclusions
- 2.4 Research Process
- 2.4.1 Primary Research and Expert Interviews
- 2.4.2 Secondary Research and Source Review
- 2.4.3 Top-Down and Bottom-Up Estimation
- 2.4.4 Data Triangulation and Verification
- 2.5 Market Size Measurement Basis
- 2.5.1 2025: USD 650.77 billion → 2035: USD 897.78 billion
- 2.6 Historical and Forecast Reference Periods
- 2.6.1 Historical Period: 2018-2025
- 2.6.2 Base Year: 2025
- 2.6.3 Forecast Period: 2025-2035
- 2.7 Research Assumptions and Limitations
Chapter 3 Executive Summary
- 3.1 Market Snapshot and Key Findings
- 3.2 Base-Year Market Size, 2025
- 3.3 Forecast Market Size, 2035
- 3.4 Revenue and Volume Growth Outlook
- 3.5 Key Demand and Supply Indicators
- 3.6 Leading Market Segments
- 3.7 Fastest-Growing Market Opportunities
- 3.8 Regional Performance Highlights
- 3.9 Technology and Industry Transformation
- 3.10 Competitive Landscape Summary
- 3.11 Analyst View and Strategic Implications
Chapter 4 Global Oil and Gas Capex Market Trends and Developments
- 4.1 Historical Industry Development, 2018-2025
- 4.2 Recent Market Trends and Developments
- 4.3 Demand and Customer Behavior Trends
- 4.4 Technology and Product Innovation
- 4.5 Artificial Intelligence, Automation and Digitalization
- 4.6 Local Manufacturing and Supply Chain Realignment
- 4.7 Industry Partnerships, Mergers and Acquisitions
- 4.8 Sustainability and Circular Economy Developments
- 4.9 Government and Private Sector Investment Trends
- 4.10 Emerging Business Models and Commercialization
- 4.11 Industry Developments and Announcements
Chapter 5 Global Oil and Gas Capex Market Production, Supply and Demand Analysis
- 5.1 Demand Trend and Consumption Analysis, 2018-2025
- 5.2 Demand Forecast, 2025-2035
- 5.3 Production and Output Trend, 2018-2025
- 5.4 Production and Output Forecast, 2025-2035
- 5.5 Installed Capacity and Capacity Utilization
- 5.6 Company-Wise Production Plants and Statistics
- 5.6.1 Installed Production Capacity
- 5.6.2 Actual Production
- 5.6.3 Planned Capacity and Expansion Targets
- 5.7 Supply Chain Structure and Procurement Trends
- 5.8 Supply-Demand Gap and Bottlenecks
- 5.9 Import Dependence and Sourcing Structure
- 5.10 Contract Manufacturing and Outsourcing
- 5.11 Regional Supply and Demand Concentration
Chapter 6 Global Oil and Gas Capex Market Pricing Analysis
- 6.1 Pricing Structure and Measurement
- 6.2 Historical Pricing Trends, 2018-2025
- 6.3 Pricing Outlook, 2025-2035
- 6.4 Average Selling Price and Unit Economics
- 6.5 Pricing by Product and Market Segment
- 6.6 Geographic Pricing Differences
- 6.7 Key Input, Energy, Labor and Logistics Costs
- 6.8 Contract Pricing and Purchasing Models
- 6.9 Pricing Sensitivity and Competitive Positioning
- 6.10 Price, Margin and Profitability Implications
Chapter 7 Global Oil and Gas Capex Market Dynamics
- 7.1 Market Growth Drivers
- 7.1.1 Demand-Side Drivers
- 7.1.2 Technology and Innovation Drivers
- 7.1.3 Infrastructure and Investment Drivers
- 7.1.4 Regulatory and Policy Drivers
- 7.2 Market Restraints
- 7.2.1 Cost and Affordability Constraints
- 7.2.2 Technology and Adoption Barriers
- 7.2.3 Supply Chain and Operational Constraints
- 7.3 Market Challenges
- 7.3.1 Competitive Pressure and Margin Erosion
- 7.3.2 Skills, Infrastructure and Implementation Gaps
- 7.4 Emerging Market Opportunities
- 7.5 Market Dynamics Impact and Time-Horizon Assessment
Chapter 8 Global Oil and Gas Capex Value Chain Analysis
- 8.1 Industry Value Chain Overview
- 8.2 Upstream Suppliers and Critical Inputs
- 8.3 Technology and Component Providers
- 8.4 Manufacturing or Service Delivery
- 8.5 Distribution, Channel Partners and Integrators
- 8.6 Downstream Applications and End Users
- 8.7 Value Addition and Profit Pools
- 8.8 Vertical Integration and Outsourcing
- 8.9 Supplier Concentration and Risk
- 8.10 Supply Chain Localization and Resilience
Chapter 9 Global Oil and Gas Capex Market Regulations and Policies
- 9.1 Relevant Laws, Standards and Compliance Frameworks
- 9.2 Product, Service, Safety and Quality Requirements
- 9.3 Government Policies, Incentives and Subsidies
- 9.4 Imports, Exports and Trade Barriers
- 9.5 Public Procurement and Local Content Requirements
- 9.6 Environmental and Sustainability Compliance
- 9.7 Upcoming Policy Changes and Market Implications
Chapter 10 Global Oil and Gas Capex Market Hotspots and Opportunities
- 10.1 Market Opportunity Mapping and Growth Hotspots
- 10.2 High-Growth Applications and Customer Groups
- 10.3 Underserved Markets and White-Space Opportunities
- 10.4 Emerging Technology and Product Opportunities
- 10.5 New Capacity and Investment Hotspots
- 10.6 Market Entry and Expansion Opportunities
- 10.7 Distribution and Partnership Opportunities
- 10.8 Near-Term and Long-Term Commercial Potential
- 10.9 Opportunity Attractiveness and Execution Risks
Chapter 11 Global Oil and Gas Capex Market Outlook, 2025-2035
- 11.1 Market Size and Analysis
- 11.1.1 Revenue (Market Measurement: 2025: USD 650.77 billion → 2035: USD 897.78 billion)
- 11.1.2 Market Volume and Quantity Sold
- 11.1.3 Historical Market Size, 2018-2025
- 11.1.4 Base-Year Market Size, 2025
- 11.2 Market Forecast, 2025-2035
- 11.2.1 Revenue Forecast to 2035
- 11.2.2 Volume Forecast to 2035
- 11.2.3 CAGR and Year-on-Year Growth
- 11.2.4 Incremental Revenue Opportunity
- 11.3 Forecast Assumptions and Scenario Analysis
- 11.3.1 Base-Case Forecast
- 11.3.2 Optimistic and Conservative Scenarios
- 11.3.3 Technology, Pricing and Policy Sensitivities
- 11.4 Market Attractiveness and Growth Outlook
Chapter 12 Global Oil and Gas Capex Market Segmentation and Outlook
- 12.1 Segmentation Summary and Market Shares, 2025
- 12.2 Largest and Fastest-Growing Segments
- 12.3 By Type - Market Size and Forecast, 2025-2035
- 12.3.1 Segment Definition and Scope
- 12.3.2 Historical Market Size, 2018-2025
- 12.3.3 Revenue Forecast, 2025-2035
- 12.3.4 Volume Forecast, 2025-2035
- 12.3.5 Base-Year Market Share, 2025
- 12.3.6 Segment CAGR and Growth Drivers
- 12.3.7 Subsegment Market Size and Forecast
- 12.3.7.1 Upstream
- 12.3.7.2 Midstream
- 12.3.7.3 Downstream
- 12.3.8 Subsegment Pricing and Adoption Trends
- 12.3.9 Leading Suppliers and Competition
- 12.3.10 Regional Demand and Opportunities
- 12.4 By Application - Market Size and Forecast, 2025-2035
- 12.4.1 Segment Definition and Scope
- 12.4.2 Historical Market Size, 2018-2025
- 12.4.3 Revenue Forecast, 2025-2035
- 12.4.4 Volume Forecast, 2025-2035
- 12.4.5 Base-Year Market Share, 2025
- 12.4.6 Segment CAGR and Growth Drivers
- 12.4.7 Subsegment Market Size and Forecast
- 12.4.7.1 Onshore
- 12.4.7.2 Offshore
- 12.4.8 Subsegment Pricing and Adoption Trends
- 12.4.9 Leading Suppliers and Competition
- 12.4.10 Regional Demand and Opportunities
- 12.5 By End User - Market Size and Forecast, 2025-2035
- 12.5.1 Segment Definition and Scope
- 12.5.2 Historical Market Size, 2018-2025
- 12.5.3 Revenue Forecast, 2025-2035
- 12.5.4 Volume Forecast, 2025-2035
- 12.5.5 Base-Year Market Share, 2025
- 12.5.6 Segment CAGR and Growth Drivers
- 12.5.7 Subsegment Market Size and Forecast
- 12.5.7.1 National Oil Companies
- 12.5.7.2 International Oil Companies
- 12.5.7.3 Independent E&P Companies
- 12.5.8 Subsegment Pricing and Adoption Trends
- 12.5.9 Leading Suppliers and Competition
- 12.5.10 Regional Demand and Opportunities
- 12.6 Segment Growth Comparison
- 12.7 Segment Attractiveness and Priority Matrix
Chapter 13 Global Oil and Gas Capex End-Use and Application Market Outlook
- 13.1 End-Use Industry and Customer Demand Structure
- 13.2 Leading Applications and Customer Groups
- 13.3 End-Use Market Size, Share and Forecast
- 13.4 Major End-Use Industry Deep Dives
- 13.4.1 Customer Requirements and Use Cases
- 13.4.2 Demand and Replacement Cycles
- 13.4.3 Technical and Regulatory Considerations
- 13.4.4 Purchasing and Procurement Models
- 13.4.5 Leading Vendors and Distribution Channels
- 13.4.6 Forecast and Commercial Opportunities
- 13.5 Emerging Applications and Cross-Segment Demand
- 13.6 End-Use Industry Investment Priorities
Chapter 14 Global Oil and Gas Capex Geographic Market Outlook, 2025-2035
- 14.1 Regional Market Size and Share, 2025
- 14.2 Regional Market Forecast, 2025-2035
- 14.3 Regional Pricing, Production and Demand Differences
- 14.4 North America
- 14.4.1 United States
- 14.4.2 Canada
- 14.4.3 Mexico
- 14.5 Europe
- 14.5.1 Germany
- 14.5.2 France
- 14.5.3 Italy
- 14.5.4 United Kingdom
- 14.5.5 Spain
- 14.5.6 Poland
- 14.5.7 Russia
- 14.5.8 Netherlands
- 14.5.9 Belgium
- 14.5.10 Sweden
- 14.5.11 Denmark
- 14.5.12 Norway
- 14.5.13 Rest of Europe
- 14.6 Asia Pacific
- 14.6.1 China
- 14.6.2 India
- 14.6.3 Japan
- 14.6.4 South Korea
- 14.6.5 Thailand
- 14.6.6 Indonesia
- 14.6.7 Vietnam
- 14.6.8 Malaysia
- 14.6.9 Australia
- 14.6.10 Rest of Asia Pacific
- 14.7 Latin America
- 14.7.1 Brazil
- 14.7.2 Argentina
- 14.7.3 Colombia
- 14.7.4 Chile
- 14.7.5 Rest of Latin America
- 14.8 Middle East
- 14.8.1 Saudi Arabia
- 14.8.2 United Arab Emirates
- 14.8.3 Turkey
- 14.8.4 Israel
- 14.8.5 Iran
- 14.8.6 Rest of the Middle East
- 14.9 Africa
- 14.9.1 South Africa
- 14.9.2 Egypt
- 14.9.3 Nigeria
- 14.9.4 Morocco
- 14.9.5 Rest of Africa
- 14.10 Regional Investment, Policy and Supply Chain Differences
- 14.11 Regional Competitive Landscape
- 14.12 Geographic Growth Hotspots
Chapter 15 Global Oil and Gas Capex Technology, Innovation and Sustainability Outlook
- 15.1 Technology Landscape and Maturity
- 15.2 Product, Process and Service Innovation
- 15.3 AI, Automation and Digital Tools in the Industry
- 15.4 Technology Adoption and Performance Benchmarking
- 15.5 Innovation Pipeline and R&D Investment
- 15.6 Patent and Intellectual Property Trends
- 15.7 Energy Efficiency and Resource Management
- 15.8 Sustainability, Recycling and Circularity
- 15.9 Technology Roadmap, 2025-2035
- 15.10 Risks of Obsolescence and Technology Substitution
Chapter 16 Global Oil and Gas Capex Market Key Strategic Imperatives
- 16.1 Growth and Market Entry Priorities
- 16.2 High-Return Products and Segments
- 16.3 Pricing, Profitability and Cost Optimization
- 16.4 Technology Investment and Product Differentiation
- 16.5 Supply Chain Localization and Resilience
- 16.6 Distribution and Customer Acquisition
- 16.7 Partnership, Acquisition and Capacity Strategy
- 16.8 Regional Expansion Priorities
- 16.9 Short-, Medium- and Long-Term Actions
Chapter 17 Competition Outlook
- 17.1 Industry Competition Characteristics
- 17.2 Market Structure and Concentration
- 17.3 Market Share and Competitive Positioning, 2025
- 17.4 Company-Wise Revenue and Product Benchmarking
- 17.5 Production and Service Capacity Benchmarking
- 17.6 Technology, Pricing and Differentiation
- 17.7 Regional Footprint and Distribution Strength
- 17.8 Mergers, Acquisitions and Strategic Alliances
- 17.9 New Entrants and Competitive Threats
- 17.10 Porter's Five Forces and Industry Attractiveness
- 17.11 Competitive Outlook, 2025-2035
Chapter 18 Company Profiles
- 18.1 Company Coverage and Selection Criteria
- 18.2 SLB
- 18.2.1 Business Description
- 18.2.2 Company Ownership and Geographic Presence
- 18.2.3 Product and Service Portfolio
- 18.2.4 Manufacturing and Operating Footprint
- 18.2.5 Production Capacity and Expansion Plans
- 18.2.6 Financial Performance and Investment
- 18.2.7 Market Share and Competitive Position
- 18.2.8 Technology and Innovation Capabilities
- 18.2.9 Strategic Alliances or Partnerships
- 18.2.10 Recent Developments
- 18.2.11 Growth Strategy and Outlook
- 18.3 Halliburton Company
- 18.4 Baker Hughes Company
- 18.5 TechnipFMC plc
- 18.6 Saipem S.p.A.
- 18.7 Technip Energies N.V.
- 18.8 Bechtel Corporation
- 18.9 Transocean Ltd.
- 18.10 Tenaris S.A.
- 18.11 NOV Inc.
- 18.12 Weatherford International plc
- 18.13 Other Relevant Market Participants
Note: Every listed company is profiled on the structure shown under the first company. The company list is preliminary and may change based on research findings, market developments, data availability and client requirements.
Chapter 19 Disclaimer
- 19.1 Research and Forecast Disclaimer
- 19.2 Data Source and Estimation Limitations
Note: The depth of individual sections depends on data availability for this market. Volume, capacity, trade and other unit-based metrics are included where applicable.