Market Overview:
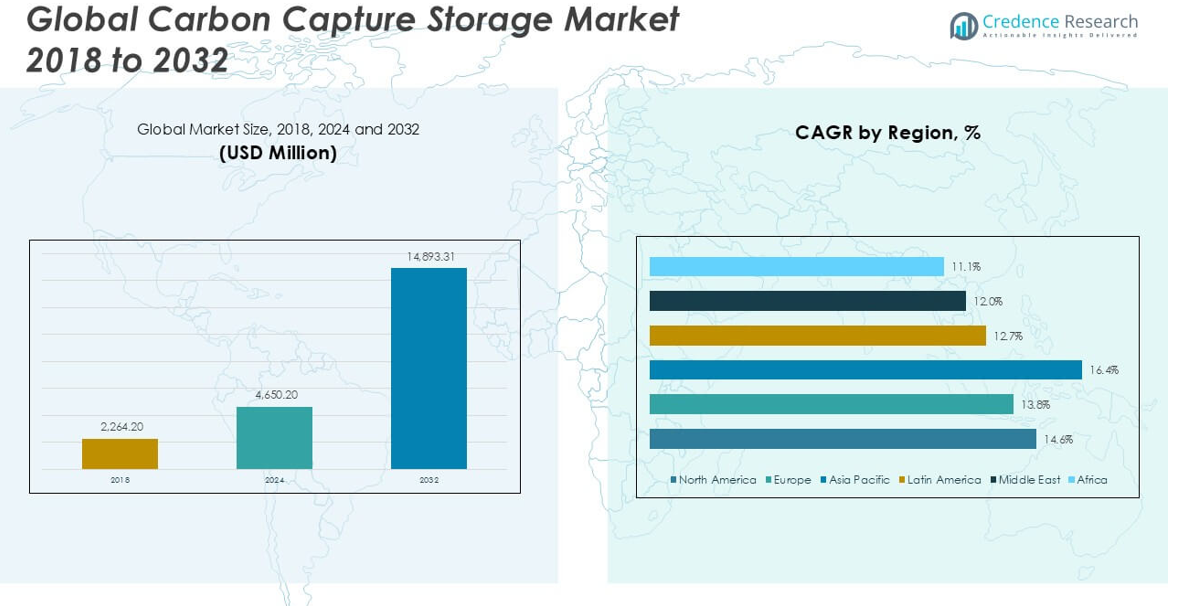
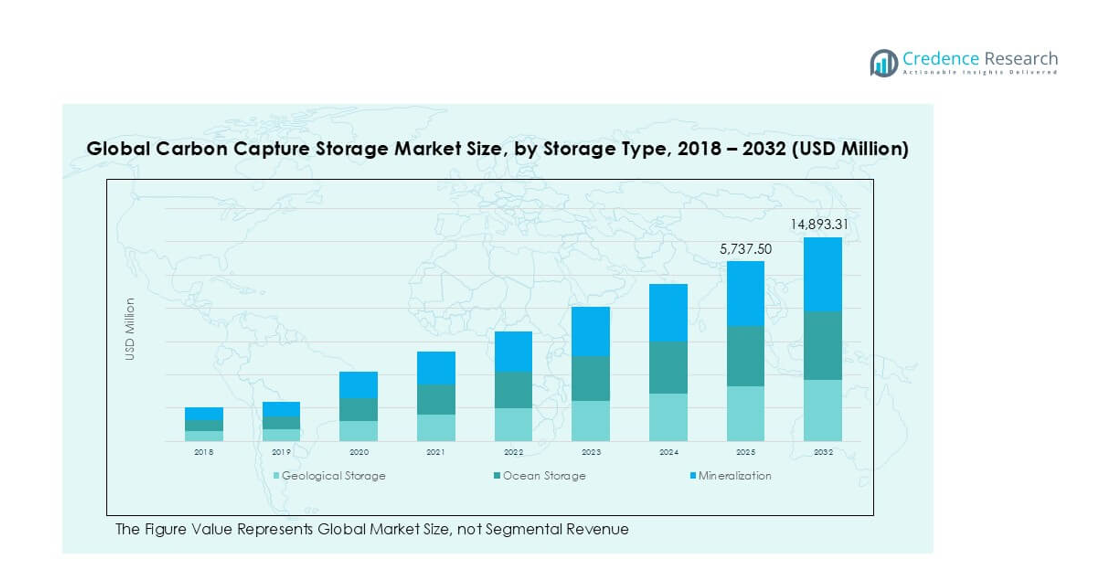
The Carbon Capture and Storage market size was valued at USD 2,264.20 million in 2018, increased to USD 4,650.20 million in 2024, and is anticipated to reach USD 14,893.31 million by 2032, at a CAGR of 14.60% during the forecast period.
| REPORT ATTRIBUTE |
DETAILS |
| Historical Period |
2020-2023 |
| Base Year |
2024 |
| Forecast Period |
2025-2032 |
| Carbon Capture and Storage Market Size 2024 |
USD 4,650.20 million |
| Carbon Capture and Storage Market, CAGR |
14.60% |
| Carbon Capture and Storage Market Size 2032 |
USD 14,893.31 million |
The Carbon Capture and Storage (CCS) market is led by prominent players such as Dakota Gasification Company, Equinor ASA, Fluor Corporation, Linde plc, Mitsubishi Heavy Industries Ltd., Royal Dutch Shell PLC, Siemens AG, Sulzer Ltd., Bayer AG, and BASF SE. These companies are at the forefront of CCS deployment, leveraging advanced technologies, large-scale infrastructure, and strategic partnerships to support decarbonization across energy-intensive industries. North America emerged as the leading region in 2024, accounting for approximately 38.2% of the global market share, driven by favorable government policies, tax incentives, and active project development in the U.S. and Canada. Europe closely follows, supported by strong climate commitments and industrial carbon reduction initiatives. The dominance of these regions reflects their technological readiness, regulatory frameworks, and ongoing investments in long-term storage infrastructure.
Market Insights
- The Carbon Capture and Storage market was valued at USD 4,650.20 million in 2024 and is projected to reach USD 14,893.31 million by 2032, growing at a CAGR of 14.60% during the forecast period.
- Market growth is driven by stringent emission regulations, rising industrial decarbonization efforts, and government incentives promoting carbon neutrality goals globally.
- Post-combustion carbon capture dominated the technology segment with over 45% share in 2024 due to its compatibility with existing industrial facilities; geological storage led the storage segment with more than 60% share owing to proven scalability and safety.
- North America held the largest regional market share at 38.2%, followed by Europe, supported by policy-driven investments and large-scale CCS infrastructure; Asia Pacific is expected to register the highest CAGR of 16.4% due to expanding industrial activity and regional climate targets.
- High capital costs, limited public acceptance, and inconsistent regulatory frameworks across regions remain key market restraints.
Access crucial information at unmatched prices!
Request your sample report today & start making informed decisions powered by Credence Research Inc.!
Download Sample
Market Segmentation Analysis:
By Storage Type
Geological storage dominated the Carbon Capture and Storage market in 2024, accounting for over 60% of the market share. This segment benefits from well-established infrastructure and proven efficacy in long-term carbon containment, especially in depleted oil and gas reservoirs and deep saline formations. Its scalability and compatibility with various capture technologies further boost its adoption. Ocean storage and mineralization hold smaller shares due to environmental concerns and higher costs. However, advancements in mineralization processes are gradually enhancing their feasibility, particularly for industrial clusters seeking permanent and safe carbon sequestration alternatives.
- For instance, Equinor’s Sleipner project in Norway has stored over 1 million tonnes of CO₂ annually in deep saline aquifers since 1996, demonstrating the long-term reliability of geological storage.
By Technology Segment:
Post-combustion carbon capture led the market in 2024, contributing more than 45% of the overall share. Its widespread adoption is driven by its adaptability to existing power plants and industrial facilities without requiring major infrastructure changes. The relatively lower initial investment and technical maturity make it a preferred choice, especially in the power generation sector. Pre-combustion and oxy-fuel combustion technologies are gaining traction in new plant installations due to higher efficiency and integration potential. Meanwhile, industrial process carbon capture is expanding steadily, driven by increasing emission regulations in the manufacturing sector.
- For instance, Petra Nova in Texas, operated by NRG Energy and JX Nippon, used post-combustion capture to process 1.4 million tonnes of CO₂ annually from a coal-fired power plant.
By End User Industry:
The power generation segment was the leading end user in 2024, holding approximately 50% of the Carbon Capture and Storage market share. This dominance stems from the sector’s substantial CO₂ emissions and regulatory pressure to reduce its carbon footprint. Utilities are actively retrofitting existing plants with capture systems to meet emission targets and secure carbon credits. The oil and gas industry follows closely, using CCS for enhanced oil recovery and emissions mitigation. Cement and steel manufacturing are emerging application areas, supported by decarbonization goals and sector-specific pilot projects. The chemical industry and other sectors also contribute moderately, with growing interest in integrated capture solutions.
Market Overview
Key Growth Drivers
Stringent Emission Regulations and Climate Goals
Governments worldwide are enforcing stringent carbon emission regulations and net-zero targets, significantly driving the growth of the Carbon Capture and Storage (CCS) market. Regulatory frameworks such as the U.S. Inflation Reduction Act and the EU Green Deal provide financial incentives and strict emission limits that compel industries to adopt CCS technologies. These policies aim to align industrial activities with the Paris Agreement targets, making CCS an essential tool for sectors like power generation, cement, and oil & gas to decarbonize operations while continuing production.
- For instance, under the UK’s Net Zero Strategy, the HyNet North West CCS project has secured government support to capture up to 10 million tonnes of CO₂ per year by 2030.
Expanding Industrial Applications Across Heavy Emission Sectors
The growing adoption of CCS in heavy emission sectors such as cement, steel, and chemical manufacturing is accelerating market expansion. These industries face limited alternatives for decarbonization due to process-related emissions. CCS offers a viable solution to mitigate these emissions without overhauling existing infrastructure. Government support for industrial decarbonization and ongoing pilot projects are creating a robust pathway for CCS integration across these sectors, helping companies maintain productivity while meeting sustainability standards and consumer demand for cleaner supply chains.
- For instance, Heidelberg Materials’ Brevik CCS project in Norway is set to capture 400,000 tonnes of CO₂ annually from its cement plant, making it the world’s first full-scale carbon capture facility in the cement industry
Technological Advancements and Infrastructure Development
Ongoing technological innovations and the development of CO₂ transport and storage infrastructure are making CCS more cost-effective and scalable. Advancements in capture efficiency, solvent materials, and monitoring technologies have reduced operational costs and enhanced system reliability. Simultaneously, investments in pipeline networks, storage hubs, and cross-border carbon transport corridors are improving the logistical feasibility of large-scale CCS deployment. These developments are encouraging broader participation from industries and fostering public-private partnerships, especially in regions like North America and Asia Pacific, where deployment rates are accelerating.
Key Trends & Opportunities
Regional Growth in Asia Pacific and North America
Asia Pacific is projected to grow at the highest CAGR of 16.4%, followed closely by North America at 14.6%. This trend is driven by increasing energy demand, policy support, and growing environmental awareness in economies like China, India, and the U.S. In North America, tax credits and federal funding are enabling rapid project deployments. Meanwhile, Asia Pacific benefits from strategic alliances and emerging government mandates. These regions represent prime opportunities for CCS technology providers and investors targeting high-growth, policy-driven carbon mitigation markets.
- For instance, Sinopec’s Qilu-Shengli CCS project in China is expected to capture and store 1 million tonnes of CO₂ per year, marking the largest full-chain CCS initiative in Asia.
Integration with Hydrogen and Bioenergy Projects
The convergence of CCS with low-carbon hydrogen and bioenergy with carbon capture and storage (BECCS) projects represents a growing opportunity. As global efforts to decarbonize intensify, CCS is being increasingly paired with hydrogen production and biomass energy to achieve negative emissions. Governments and corporations are funding large-scale hydrogen-CCS and BECCS projects to establish green energy hubs. These integrated solutions not only enhance sustainability credentials but also create additional revenue streams for captured CO₂, positioning CCS as a critical enabler of the broader clean energy transition.
Key Challenges
High Capital and Operational Costs
Despite technological advancements, the high capital investment and ongoing operational costs remain major barriers to CCS adoption. Building capture units, retrofitting facilities, and developing pipeline networks and storage infrastructure require substantial upfront funding. This financial burden is especially restrictive for small and mid-sized enterprises, limiting widespread deployment. Although government incentives are available in some regions, inconsistent funding mechanisms and long payback periods continue to challenge project viability and investor confidence.
- For instance, the Kemper Project in Mississippi was cancelled after more than USD 7.5 billion in investment, highlighting the financial risks associated with large-scale CCS implementation.
Public Opposition and Environmental Concerns
CCS projects often face public resistance due to concerns about long-term storage safety, potential leakage, and environmental risks. Communities living near geological storage sites may raise objections related to health hazards or ecosystem disruption. Additionally, skepticism persists around CCS being used to prolong fossil fuel dependency. Addressing these concerns requires transparent stakeholder engagement, rigorous environmental assessments, and demonstration of long-term monitoring and safety measures to build public trust and policy support.
Regulatory and Policy Uncertainties
Inconsistent and evolving regulatory frameworks across regions pose significant challenges to CCS deployment. While some countries offer robust incentives and clear compliance guidelines, others lack the policy clarity needed to support large-scale investments. This regulatory fragmentation affects cross-border CO₂ transport, permits, and carbon pricing mechanisms, thereby slowing down project implementation. Ensuring harmonized international policies and long-term government commitment is essential to create a stable environment for sustained CCS market growth.
Regional Analysis
North America
North America dominated the Carbon Capture and Storage (CCS) market in 2024, accounting for approximately 42.2% of the global market, with a valuation of USD 1,960.97 million, up from USD 965.07 million in 2018. The region is projected to reach USD 6,298.31 million by 2032, growing at a robust CAGR of 14.6%. Market growth is driven by strong regulatory support, tax incentives under the Inflation Reduction Act, and an increasing number of CCS projects in the U.S. and Canada. Major energy and industrial players are investing in long-term carbon storage infrastructure, contributing to the region’s continued leadership in CCS deployment.
- For instance, Occidental Petroleum’s development of the Permian Direct Air Capture plant aims to capture 1 million tonnes of CO₂ annually, positioning the U.S. as a leader in direct air capture and geological storage.
Europe
Europe held a 28.5% share of the global Carbon Capture and Storage market in 2024, with a market value of USD 1,325.32 million, rising from USD 668.46 million in 2018. The regional market is expected to grow to USD 4,006.34 million by 2032, registering a CAGR of 13.8%. Growth is fueled by the European Union’s climate neutrality goals, stringent carbon emission regulations, and funding initiatives for CCS pilot and commercial-scale projects. Countries like Norway, the UK, and the Netherlands are actively expanding CCS capacity, particularly in offshore geological storage, strengthening Europe’s position in the global market.
- For instance, the Northern Lights project in Norway, a joint venture between Equinor, Shell, and TotalEnergies, will initially store 1.5 million tonnes of CO₂ per year, with capacity expansion plans in place.
Asia Pacific
Asia Pacific is the fastest-growing region in the Carbon Capture and Storage market, with a projected CAGR of 16.4%. The market grew from USD 438.26 million in 2018 to USD 975.12 million in 2024, securing a 21.0% share of the global market. By 2032, the region is expected to reach USD 3,534.70 million. Rapid industrialization, growing energy demand, and increasing environmental regulations in China, India, and Southeast Asian countries are key drivers. Governments and private entities are investing in low-carbon technologies, including CCS, to meet emission targets and transition toward sustainable industrial operations.
Latin America
Latin America accounted for around 4.4% of the global CCS market in 2024, with a valuation of USD 202.95 million, up from USD 100.15 million in 2018. The market is forecasted to grow to USD 570.16 million by 2032 at a CAGR of 12.7%. The region’s growth is supported by emerging interest in industrial decarbonization, particularly in Brazil and Argentina. Government-led initiatives and collaboration with international climate agencies are enabling CCS pilot projects. However, the market remains nascent compared to other regions, with limited infrastructure and investment posing challenges to broader adoption.
Middle East
The Middle East held a 2.4% share of the global CCS market in 2024, valued at USD 110.78 million, up from USD 59.39 million in 2018. It is projected to reach USD 295.24 million by 2032, growing at a CAGR of 12.0%. Growth in the region is driven by national sustainability programs in countries like the UAE and Saudi Arabia, which are integrating CCS into oil and gas operations. The focus is primarily on carbon capture for enhanced oil recovery (EOR) and hydrogen production, with governments promoting the technology as part of broader energy transition goals.
Africa
Africa represented the smallest share of the global CCS market in 2024, at 1.6%, with a market size of USD 75.06 million, rising from USD 32.88 million in 2018. The market is expected to grow to USD 188.56 million by 2032 at a CAGR of 11.1%. Despite limited infrastructure, the continent is exploring CCS opportunities, particularly in South Africa and Egypt, to support cleaner energy production and reduce emissions from heavy industries. International partnerships and development funding are crucial to driving technology adoption, although financial constraints and regulatory gaps continue to challenge market expansion in the region.
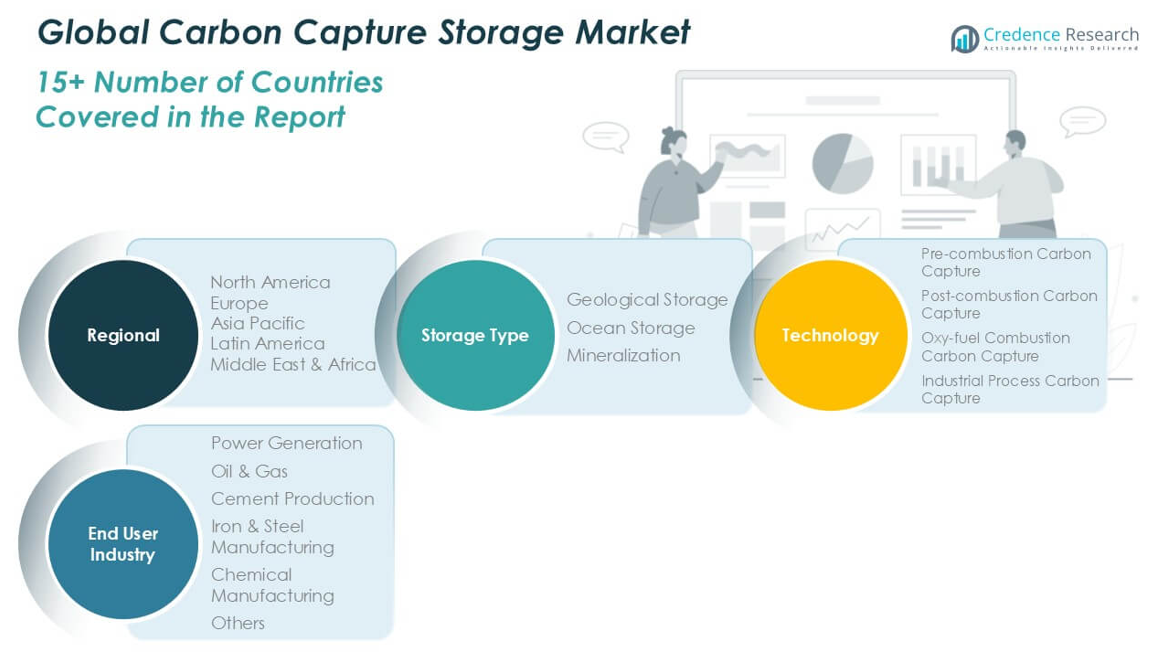
Market Segmentations:
By Storage Type:
- Geological Storage
- Ocean Storage
- Mineralization
By Technology Segment:
- Pre-combustion Carbon Capture
- Post-combustion Carbon Capture
- Oxy-fuel Combustion Carbon Capture
- Industrial Process Carbon Capture
By End User Industry:
- Power Generation
- Oil & Gas
- Cement Production
- Iron & Steel Manufacturing
- Chemical Manufacturing
- Others
By Geography:
- North America
- Europe
- Asia Pacific
- Latin America
- Middle East
- Africa
Competitive Landscape
The competitive landscape of the Carbon Capture and Storage (CCS) market is characterized by the presence of established multinational corporations and specialized technology providers actively advancing CCS deployment across various industries. Key players such as Dakota Gasification Company, Equinor ASA, Fluor Corporation, Linde plc, and Mitsubishi Heavy Industries Ltd. dominate the market through strategic investments, joint ventures, and proprietary technologies. These companies focus on enhancing capture efficiency, reducing operational costs, and expanding their project portfolios through collaboration with governments and industrial partners. Royal Dutch Shell PLC and Equinor ASA lead in large-scale CCS projects, particularly in Europe and North America, while companies like Siemens AG and Sulzer Ltd. contribute critical equipment and engineering services. Meanwhile, chemical giants such as BASF SE and Bayer AG are investing in advanced solvents and materials to support capture systems. Intense competition centers around innovation, regional expansion, and compliance with emission regulations, with firms leveraging R&D and policy incentives to strengthen market position.
- For instance, Mitsubishi Heavy Industries’ Kansai Mitsubishi Carbon Dioxide Recovery Process has been installed at over 14 commercial plants worldwide, with individual units capturing up to 500 tonnes of CO₂ per day.
Shape Your Report to Specific Countries or Regions & Enjoy 30% Off!
Key Player Analysis
- Dakota Gasification Company
- Equinor ASA
- Fluor Corporation
- Linde plc
- Maersk Oil
- Mitsubishi Heavy Industries Ltd.
- Royal Dutch Shell PLC
- Siemens AG
- Sulzer Ltd.
- Bayer AG
- BASF SE
Recent Developments
- In July 2025, Equinor deepened its digital collaboration to advance CCS operations and continues to lead the Northern Lights project, a cross-border CO₂ transport and storage facility, in partnership with Shell and TotalEnergies. The second phase of Northern Lights was approved in March 2025, with NOK7.5 billion in investments to expand storage capacity.
- In July 2025, Prometheus Fuels, a Maersk-backed company, announced it was commercially producing e-fuels from captured carbon dioxide, specifically for the shipping industry. This signifies a major step towards using carbon capture and storage (CCS)-derived products for maritime decarbonization. Prometheus’s technology uses direct air capture (DAC) and off-grid renewable energy to produce carbon-neutral synthetic fuels, eliminating the need for hydrogen, grid electricity, or subsidies.
- In June 2025, Linde signed a long-term deal to supply industrial gases to a low-carbon ammonia plant in Louisiana, which integrates CCS to cut emissions. Linde continues expanding CCS for blue hydrogen production, supporting the green transition across multiple projects.
- In May 2025, Equinor reported promising results from North Sea carbon storage test wells, progressing toward large-scale storage.
- In March 2025, the Dakota Gasification Company received an Excellence in Innovation Award for its Great Plains Synfuels Plant’s carbon capture project. The project aims to capture up to 2.25 million metric tons of CO₂ annually through geologic sequestration.
Market Concentration & Characteristics
The Carbon Capture and Storage Market exhibits a moderately concentrated structure, with a mix of established multinational corporations and emerging technology providers driving its growth. Major players such as Equinor ASA, Royal Dutch Shell PLC, Mitsubishi Heavy Industries Ltd., and Linde plc hold significant market shares due to their advanced infrastructure, project execution capabilities, and strong global presence. It remains capital intensive and highly technology driven, requiring substantial investment in capture units, transport systems, and long-term storage facilities. Companies compete on innovation, regulatory compliance, and scalability. Regional differences in policy frameworks, funding support, and industrial emissions profiles influence deployment intensity. It continues to expand across high-emission sectors such as power generation, oil and gas, cement, and steel. Technological maturity varies across segments, with post-combustion systems more prevalent due to ease of integration into existing plants. Partnerships between governments and private firms support deployment in key markets. While market entry barriers remain high, ongoing public and private sector collaboration is gradually creating more accessible pathways for new participants.
Report Coverage
The research report offers an in-depth analysis based on Storage Type, Technology Segment, End User Industry and Geography. It details leading market players, providing an overview of their business, product offerings, investments, revenue streams, and key applications. Additionally, the report includes insights into the competitive environment, SWOT analysis, current market trends, as well as the primary drivers and constraints. Furthermore, it discusses various factors that have driven market expansion in recent years. The report also explores market dynamics, regulatory scenarios, and technological advancements that are shaping the industry. It assesses the impact of external factors and global economic changes on market growth. Lastly, it provides strategic recommendations for new entrants and established companies to navigate the complexities of the market.
Future Outlook
- The Carbon Capture and Storage market will witness accelerated adoption due to global net-zero commitments and stricter emission regulations.
- Deployment will increase in industrial sectors such as cement, steel, and chemicals where alternative decarbonization options are limited.
- Post-combustion capture technologies will continue to dominate due to their compatibility with existing facilities.
- Government incentives and funding programs will play a critical role in supporting large-scale CCS infrastructure.
- North America and Asia Pacific will remain the most dynamic regions, with expanding project pipelines and policy backing.
- Integration of CCS with hydrogen production and bioenergy projects will create new revenue and growth opportunities.
- Investments in CO₂ transportation networks and storage hubs will enhance logistical feasibility and regional scalability.
- Public-private partnerships will intensify, driving innovation and reducing the cost burden of CCS deployment.
- Technological improvements will improve capture efficiency and reduce the operational cost of CCS systems.
- Regulatory harmonization and international cooperation will be essential to enable cross-border carbon transport and storage initiatives.


