
Market Overview:
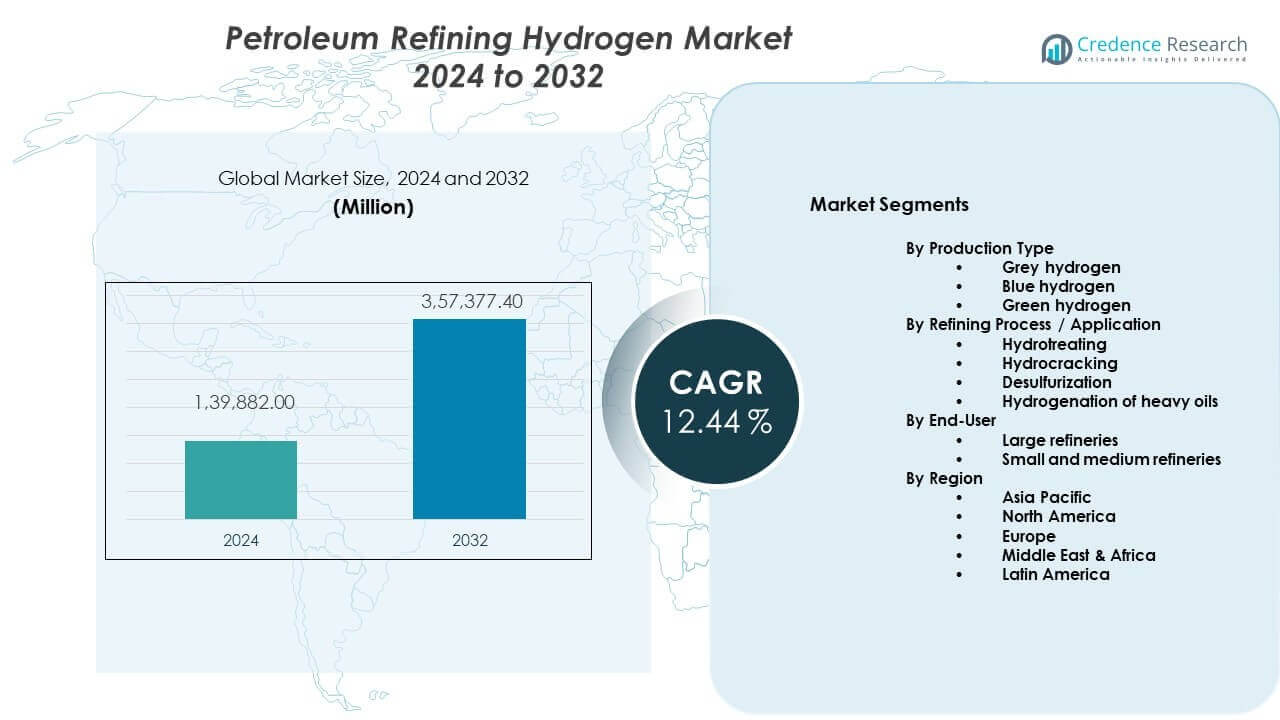
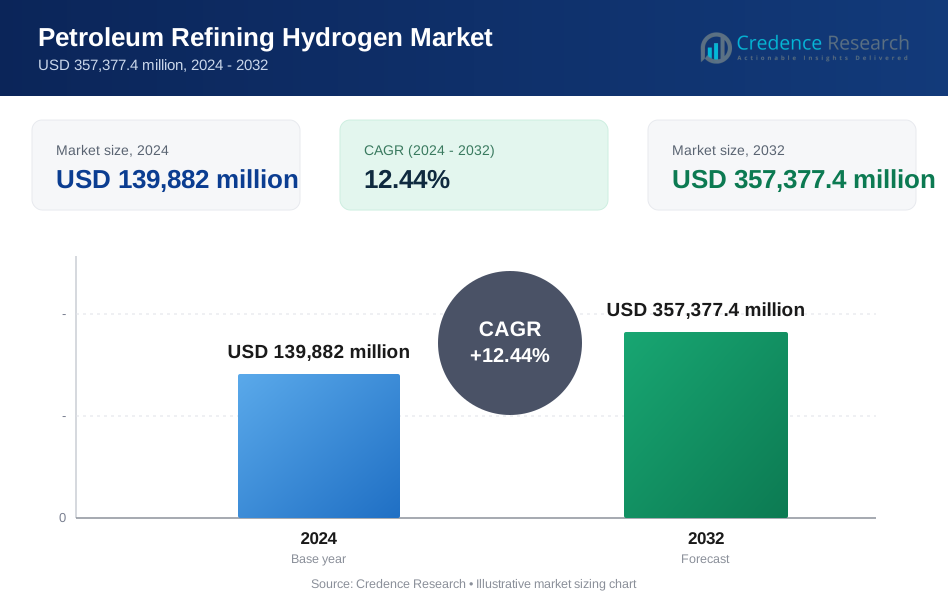
The Petroleum refining hydrogen market is projected to grow from USD 139,882 million in 2024 to USD 357,377.4 million by 2032. The market is expected to expand at a CAGR of 12.44% from 2024 to 2032.
| REPORT ATTRIBUTE | DETAILS |
|---|---|
| Historical Period | 2020-2023 |
| Base Year | 2024 |
| Forecast Period | 2025-2032 |
| Petroleum Refining Hydrogen Market Size 2024 | USD 139,882 million |
| Petroleum Refining Hydrogen Market, CAGR | 12.44% |
| Petroleum Refining Hydrogen Market Size 2032 | USD 357,377.4 million |
Market growth is driven by tighter sulfur regulations and higher demand for clean fuels. Refineries use more hydrogen to produce ultra-low sulfur diesel and gasoline. Rising heavy crude processing raises hydrogen consumption per barrel. Aging refinery assets require upgrades that favor hydrogen-based processing routes. Expansion of hydrocrackers and hydrotreaters supports steady demand growth. Integration of on-site hydrogen generation improves supply security and cost control. Refiners also adopt hydrogen recovery units to boost efficiency. These factors strengthen long-term hydrogen demand in refining operations.
North America and Europe lead due to strict environmental rules and advanced refining systems. The United States shows strong adoption across complex refineries with high upgrading intensity. Western Europe maintains demand through fuel quality mandates and refinery modernization. Asia-Pacific emerges as the fastest-expanding region due to rising fuel consumption. China and India invest in large refining capacity additions. Middle East refineries expand hydrogen use to process heavier crude grades. Latin America shows gradual growth supported by refinery upgrades and cleaner fuel programs.
Market Insights:
- The market reached USD 139,882 million in 2024 and is projected to hit USD 357,377.4 million by 2032, growing at a CAGR of 12.44%, driven by rising hydrogen intensity in refinery operations.
- Asia Pacific leads with about 45% share due to large refinery expansions in China and India, followed by Europe at 20% supported by strict fuel standards, and North America at 25% backed by advanced refinery complexity.
- North America is the fastest-growing region with nearly 25% share, driven by refinery upgrades, high hydrogen recovery adoption, and tightening emission regulations.
- By production type, grey hydrogen dominates with around 48% share due to cost efficiency and established steam methane reforming infrastructure across large refineries.
- By refining process, desulfurization holds about 50% share for ultra-low sulfur fuels, while hydrocracking accounts for nearly 35% due to heavy-to-light crude conversion demand.
Market Drivers:
Stricter Fuel Quality Standards And Refinery Compliance Requirements
The Petroleum refining hydrogen market gains strength from tighter fuel quality rules worldwide. Governments enforce low sulfur limits across transport fuels. Refineries depend on hydrogen for desulfurization and upgrading processes. Cleaner fuel mandates raise hydrogen use per barrel. Refiners expand hydrotreating capacity to meet compliance goals. Process reliability depends on stable hydrogen supply. Investment focus shifts toward hydrogen-intensive units. Regulatory pressure sustains long-term demand growth.
- For instance, ExxonMobil increased hydrogen consumption at its Baytown refinery after expanding hydrotreating capacity to meet U.S. Tier 3 sulfur limits of 10 ppm. Cleaner fuel mandates raise hydrogen use per barrel.
Rising Processing Of Heavy And Sour Crude Grades
Crude supply trends favor heavier and sour feedstocks. These grades contain higher sulfur and impurities. Refineries require more hydrogen to process such inputs. Hydrocrackers and reformers rely on steady hydrogen flow. Complex refinery configurations increase hydrogen intensity. Operators optimize yields through deeper conversion routes. The Petroleum refining hydrogen market benefits from crude quality shifts. Feedstock complexity directly raises hydrogen consumption levels.
- For instance, Saudi Aramco’s Jazan refinery processes heavy sour crude and operates large hydrocracking units supported by integrated hydrogen networks exceeding several hundred MMSCFD.
Expansion Of Refinery Upgrading And Conversion Projects
Refineries invest in unit upgrades to boost margins. Conversion units improve output of high-value fuels. Hydrogen supports cracking and saturation reactions. Modernization projects prioritize hydrogen availability and purity. On-site production gains preference over merchant supply. Capacity expansions increase baseline hydrogen demand. Refiners align upgrades with long-term fuel demand. These investments reinforce hydrogen dependence.
Growth In Global Transportation Fuel Demand
Transport fuel demand remains strong in emerging economies. Vehicle fleets expand across Asia and Africa. Refiners raise throughput to meet fuel needs. Higher volumes require more hydrogen for treatment. Quality standards apply even in high-growth markets. Hydrogen ensures consistent fuel specifications. The Petroleum refining hydrogen market links closely with fuel demand trends. Consumption growth supports sustained hydrogen use.
Market Trends:
Shift Toward On-Site Hydrogen Generation Systems
Refiners favor captive hydrogen production units. On-site systems improve supply reliability. Cost control becomes easier with internal generation. Steam methane reformers dominate installed capacity. Some refineries test autothermal reforming routes. Integration reduces logistics dependence on external suppliers. It supports stable refinery operations. This trend reshapes hydrogen sourcing strategies.
- For instance, Reliance Industries operates multiple captive SMR-based hydrogen units at the Jamnagar complex to support continuous hydrotreating and hydrocracking operations.
Adoption Of Advanced Hydrogen Recovery Technologies
Refineries focus on hydrogen reuse efficiency. Recovery units capture hydrogen from off-gases. Purification improves hydrogen utilization rates. This approach lowers fresh hydrogen demand. Process optimization reduces operational waste. Digital controls enhance recovery system performance. Plants target higher overall hydrogen efficiency. Technology upgrades drive this trend.
- For instance, Shell deployed pressure swing adsorption systems at its Pernis refinery, enabling recovery of high-purity hydrogen from refinery off-gas streams used in hydrotreating units.
Integration Of Digital Monitoring In Hydrogen Networks
Refinery operators deploy digital control systems. Sensors track hydrogen purity and flow. Real-time data improves process stability. Predictive tools reduce downtime risks. Automation enhances safety across hydrogen systems. Digital twins support optimization decisions. Data-driven operations gain importance. This trend improves operational control.
Early Adoption Of Low-Carbon Hydrogen Pathways
Some refineries explore low-carbon hydrogen options. Carbon capture integrates with reforming units. Pilot projects test blue hydrogen supply models. Corporate sustainability goals influence investment choices. Long-term planning includes emission reduction pathways. Policy signals support early trials. The Petroleum refining hydrogen market begins gradual decarbonization. Adoption remains selective but strategic.
Market Challenges Analysis:
High Capital Cost And Complex Infrastructure Requirements
Hydrogen production units demand high upfront investment. Equipment costs remain substantial for refineries. Installation requires skilled engineering expertise. Safety standards increase project complexity. Maintenance needs add to operating costs. Smaller refineries face adoption barriers. Financing constraints slow expansion plans. The Petroleum refining hydrogen market faces cost-related pressure.
Volatility In Feedstock Prices And Operational Risks
Natural gas price swings affect hydrogen costs. Input volatility disrupts cost planning. Refiners struggle with margin stability. Supply disruptions impact hydrogen availability. Process safety risks require strict management. Compliance increases operational burden. Skilled workforce shortages pose challenges. These factors limit operational flexibility.
Market Opportunities:
Expansion Of Refining Capacity In Emerging Economies
Emerging markets invest in new refinery projects. Capacity additions increase hydrogen demand. Governments support domestic fuel production. Modern refineries adopt hydrogen-intensive designs. Integration starts from early project stages. Regional fuel demand supports long-term growth. Infrastructure development creates supply opportunities. The Petroleum refining hydrogen market gains from expansion.
Integration With Energy Transition And Emission Reduction Goals
Refineries align strategies with climate objectives. Hydrogen supports cleaner fuel production. Carbon capture links with hydrogen units. Policy incentives encourage technology upgrades. Partnerships emerge across energy value chains. Innovation opens pathways for low-emission operations. Refiners seek competitive advantage through sustainability. These shifts create future growth avenues.
Market Segmentation Analysis:
By Production Type
The Petroleum refining hydrogen market shows clear differentiation by production type. Grey hydrogen dominates due to cost efficiency and proven integration with refinery systems. Refineries rely on this type for steady volumes and operational stability. Blue hydrogen gains relevance where emission targets tighten. Carbon capture improves environmental performance without major process change. Adoption depends on policy support and capital access. Green hydrogen remains limited in scale. High production cost and supply constraints restrict use. Refineries test green hydrogen mainly for long-term transition planning.
- For instance, Chevron uses grey hydrogen from natural gas reforming across its U.S. refineries to support large-scale desulfurization units. Blue hydrogen gains relevance where emission targets tighten.
By Refining Process / Application
Hydrotreating represents a core application due to strict fuel quality standards. Refineries depend on hydrogen to remove sulfur and nitrogen compounds. Hydrocracking follows with strong demand from heavy crude conversion needs. It supports higher yields of light fuels. Desulfurization holds a central role in ultra-low sulfur fuel production. Hydrogenation of heavy oils gains traction in complex refineries. This process improves viscosity and stability of residual streams. Application choice depends on crude slate and refinery configuration.
- For instance, BP’s Whiting refinery expanded hydrocracking capacity to process heavy Canadian crude, supported by high-pressure hydrogen systems for deeper conversion.
By End-User
Large refineries account for the majority of hydrogen demand. Complex operations require high and continuous hydrogen supply. Integrated facilities favor on-site production for cost control. Small and medium refineries show moderate demand growth. Limited scale restricts large investments in hydrogen units. These refineries often rely on merchant supply. End-user demand reflects refinery complexity and processing depth.
Segmentation:
By Production Type
- Grey hydrogen
- Blue hydrogen
- Green hydrogen
By Refining Process / Application
- Hydrotreating
- Hydrocracking
- Desulfurization
- Hydrogenation of heavy oils
By End-User
- Large refineries
- Small and medium refineries
By Region
- North America
- U.S.
- Canada
- Mexico
- Europe
- Germany
- France
- U.K.
- Italy
- Spain
- Rest of Europe
- Asia Pacific
- China
- Japan
- India
- South Korea
- South-east Asia
- Rest of Asia Pacific
- Latin America
- Brazil
- Argentina
- Rest of Latin America
- Middle East & Africa
- GCC Countries
- South Africa
- Rest of the Middle East and Africa
Regional Analysis:
Asia Pacific
Asia Pacific leads the Petroleum refining hydrogen market with about 45% market share. China and India drive demand through large-scale refinery expansions. Rising fuel consumption supports higher throughput levels. Refineries in the region process heavier crude grades. Hydrogen demand grows with stricter fuel quality norms. Government focus on energy security supports refinery investment. Strong capacity growth sustains regional leadership.
North America
North America holds nearly 25% market share and shows strong growth momentum. The United States leads due to advanced refinery complexity. Tight sulfur regulations raise hydrogen intensity per barrel. Refineries invest in upgrading and conversion units. On-site hydrogen production remains widely adopted. Stable infrastructure supports efficient hydrogen distribution. It benefits from early adoption of low-emission solutions.
Europe, Middle East & Africa, And Latin America
Europe accounts for around 20% market share due to strict environmental rules. Refineries focus on fuel quality compliance and modernization. The Middle East & Africa region holds close to 7% share. Large export-oriented refineries process heavy crude grades. Latin America represents about 3% share with gradual upgrades. National fuel programs support moderate hydrogen demand. Regional growth reflects refinery investment pace and regulation strength.
Key Player Analysis:
- Saudi Aramco
- ExxonMobil
- Chevron
- BP Plc
- Shell
- Indian Oil Corporation Ltd
- Air Products and Chemicals
- Linde plc
- Reliance Industries Ltd
- TotalEnergies
Competitive Analysis:
The Petroleum refining hydrogen market shows strong competition among integrated energy firms and industrial gas suppliers. Large oil companies control hydrogen demand through captive refinery systems. Industrial gas players focus on long-term supply contracts and on-site generation models. Scale, reliability, and cost efficiency define competitive strength. Companies invest in advanced reforming and purification technologies. Strategic partnerships support refinery upgrades and capacity expansion. It remains capital intensive with high entry barriers. Operational expertise and safety records influence customer preference.
Recent Developments:
- In November 2025, ExxonMobil formed a strategic collaboration with chemical industry leader BASF to advance methane pyrolysis technology, a next-generation approach to producing low-emission hydrogen and solid carbon. The two companies signed a joint development agreement to construct a demonstration plant at ExxonMobil's Baytown Complex in Texas, capable of producing up to 2,000 tons of low-carbon emission hydrogen and 6,000 tons of solid carbon product annually, targeting commercial readiness. This partnership complements ExxonMobil's broader hydrogen strategy and combines BASF's superior reactor concept, validated at its Ludwigshafen test plant over more than a decade, with ExxonMobil's industrial scale-up expertise.
- ExxonMobil's core hydrogen ambition remains anchored in its flagship Baytown project, designed to be one of the world's largest low-carbon hydrogen plants producing approximately one billion standard cubic feet per day. In September 2024, the company signed a Project Framework Agreement with Mitsubishi Corporation for participation in the Baytown facility, with a final investment decision expected in 2025 and anticipated startup in 2029. Notably, ExxonMobil has secured major validation of its commercial approach through a 35-percent equity stake from Abu Dhabi National Oil Company (ADNOC) and binding offtake agreements with Marubeni, establishing a U.S.-to-Japan ammonia supply chain that de-risks both the project's financial and market viability. To ensure long-term technological differentiation, the company is also piloting a Carbonate Fuel Cell system in Rotterdam designed to capture carbon while producing clean energy, advancing its portfolio of hydrogen production methodologies beyond conventional steam-methane reforming with carbon capture.
- In a landmark move for the petroleum refining hydrogen market, Saudi Aramco completed its 50-percent equity acquisition in the Blue Hydrogen Industrial Gases Company (BHIG) in March 2025, with Air Products Qudra retaining the remaining stake. BHIG targets the production of lower-carbon hydrogen from natural gas through carbon capture and storage technology, with commercial operations expected to commence in coordination with Aramco's carbon capture and storage activities in Jubail, reinforcing the company's pivot from planning to execution across its hydrogen portfolio. The acquisition represents a strategic milestone, transforming Aramco from a development partner into an operational owner of commercially producing blue hydrogen infrastructure.
- Additionally, Saudi Aramco's NEOM Green Hydrogen Project has reached 80 percent completion, with the $8.4 billion facility designed to produce 600 tons of green hydrogen daily, converting it into ammonia for export. The company also established the Yanbu Green Hydrogen Hub in partnership with ACWA Power and EnBW, targeting 400,000 tons of hydrogen annually for international markets, signaling a shift toward capturing global export opportunities. To further strengthen its technology pipeline, the company launched a direct air capture test unit with Siemens Energy, demonstrating continued investment in next-generation enabling technologies for hydrogen production and decarbonization.
Report Coverage:
The research report offers an in-depth analysis based on By Production Type, By Refining Process / Application, By End-User, and By Region. It details leading market players, providing an overview of their business, product offerings, investments, revenue streams, and key applications. Additionally, the report includes insights into the competitive environment, SWOT analysis, current market trends, as well as the primary drivers and constraints. Furthermore, it discusses various factors that have driven market expansion in recent years. The report also explores market dynamics, regulatory scenarios, and technological advancements that are shaping the industry. It assesses the impact of external factors and global economic changes on market growth. Lastly, it provides strategic recommendations for new entrants and established companies to navigate the complexities of the market.
Future Outlook:
- Refinery hydrogen demand will rise as fuel sulfur limits tighten across major regions.
- Heavy crude processing will increase hydrogen intensity per barrel in complex refineries.
- On-site hydrogen production will gain wider adoption to ensure supply reliability and cost control.
- Hydrogen recovery and reuse systems will improve overall refinery efficiency and reduce losses.
- Industrial gas partnerships will expand to support large-scale refinery upgrading projects.
- Asia Pacific will remain the main growth engine due to continuous capacity additions.
- Emission control goals will increasingly influence hydrogen sourcing and production choices.
- Digital control systems will enhance hydrogen network safety and operational reliability.
- Large and complex refineries will continue to dominate overall hydrogen consumption patterns.
- Ongoing technology upgrades will shape long-term competitiveness across refining operations.
Request a Free Sample
Fill in your details and we'll send you a free sample report.
- Sample data tables & charts
- Research methodology
Need a Custom Version of This Report?
Tailor the scope, geography, or segments to your exact requirements.
- Custom geography or segment scope
- Direct access to our analyst team
Frequently Asked Questions
What is the current market size for Petroleum refining hydrogen market, and what is its projected size in 2032?
At what Compound Annual Growth Rate is the Petroleum refining hydrogen market projected to grow between 2025 and 2032?
Which Petroleum refining hydrogen market segment held the largest share in 2024?
What are the primary factors fueling the growth of the Petroleum refining hydrogen market?
Who are the leading companies in the Petroleum refining hydrogen market?
Which region commanded the largest share of the Petroleum refining hydrogen market in 2024?
Table of Content
Chapter 1. Report Introduction
- 1.1 Report Description & Purpose
- 1.1.1 Report Title & Market Definition
- 1.1.2 Unique Selling Propositions (USP) & Key Differentiators
- 1.1.3 Value Proposition for Stakeholders
- 1.2 Research Objectives
- 1.2.1 Market Sizing Objectives (Volume & Revenue)
- 1.2.2 Segmentation Objectives
- 1.2.3 Competitive Intelligence Objectives
- 1.2.4 Forecast & Scenario Objectives
- 1.3 Report Scope
- 1.3.1 Petroleum Refining Hydrogen Scope – Types & Subtypes Covered
- 1.3.2 Geographic Scope – Regions & Countries Covered
- 1.3.3 Historical Period, Base Year & Forecast Period (2024; forecast to 2032)
- 1.3.4 Inclusions & Exclusions
- 1.4 HS Code & Classification Framework
- 1.5 Currency, Units & Pricing Basis
- 1.6 Target Stakeholders
- 1.7 Limitations & Assumptions
Chapter 2. Executive Summary
- 2.1 Global Petroleum Refining Hydrogen Market Snapshot
- 2.1.1 Market Size – Historical (2024) & Forecast (2024-2032) (2024: USD 139,882 million → 2032: USD 357,377.4 million)
- 2.1.2 Volume & Revenue – Global Totals
- 2.1.3 Key Market Highlights – Top Five Facts
- 2.2 Petroleum Refining Hydrogen Market Segmentation Snapshot
- 2.2.1 Market Split by Region – 2024 vs. 2032
- 2.3 Competitive Snapshot
- 2.3.1 Top 10 Players by Revenue Share – 2024
- 2.3.2 Top 10 Players by Volume Share – 2024
- 2.3.3 Recent Strategic Developments (18-Month Summary)
- 2.4 Key Investment Highlights & Strategic Conclusions
Chapter 3. Petroleum Refining Hydrogen Market Dynamics & Industry Analysis
- 3.1 Market Overview & Context
- 3.1.1 Petroleum Refining Hydrogen Market Position in the Broader Automotive Value Chain
- 3.1.2 OEM vs. Replacement Market Dynamics
- 3.1.3 Market Maturity & Development Stage by Region
- 3.2 Petroleum Refining Hydrogen Market Drivers
- 3.3 Petroleum Refining Hydrogen Market Restraints & Challenges
- 3.4 Petroleum Refining Hydrogen Market Opportunities
- 3.5 Porter's Five Forces Analysis
- 3.5.1 Threat of New Entrants
- 3.5.2 Bargaining Power of Suppliers
- 3.5.3 Bargaining Power of Buyers
- 3.5.4 Threat of Substitutes
- 3.5.5 Competitive Rivalry – Intensity Assessment
- 3.6 Petroleum Refining Hydrogen Value Chain Analysis
- 3.6.1 Upstream – Raw Material/Input Suppliers
- 3.6.1.1 Raw Material/Input 1
- 3.6.1.2 Raw Material/Input 2
- 3.6.1.3 Raw Material/Input 3
- 3.6.2 Midstream – Production/Manufacturing/Service Delivery
- 3.6.2.1 Production/Process Overview
- 3.6.2.2 Key Facility Locations & Capacity by Manufacturer
- 3.6.3 Downstream – Distribution & End Consumer
- 3.6.3.1 Primary Channel – B2B/OEM
- 3.6.3.2 Secondary Channels – Dealer, Retail, Online, Direct
- 3.6.4 Value Chain Profitability Analysis
- 3.6.1 Upstream – Raw Material/Input Suppliers
- 3.7 PESTEL Analysis
- 3.7.1 Political Factors
- 3.7.2 Economic Factors
- 3.7.3 Social Factors
- 3.7.4 Technological Factors
- 3.7.5 Environmental Factors
- 3.7.6 Legal Factors
- 3.8 Petroleum Refining Hydrogen Supply Chain Analysis
- 3.8.1 Raw Material/Input Supply Risk Assessment
- 3.8.2 Manufacturing Concentration Risk (Geographic Exposure)
- 3.8.3 Trade Disruption Impact Analysis
- 3.9 Regulatory & Policy Landscape
Note: The regulatory and policy landscape section covers regulations based on their applicability to the market, Petroleum Refining Hydrogen category, geography, and scope of the study. Only regulatory frameworks with a material impact on operations, compliance, trade, sustainability, or market access are analyzed in detail.
Chapter 4. Key Investment Pockets & Opportunity Analysis
- 4.1 Petroleum Refining Hydrogen Market Attractiveness Analysis
- 4.1.1 By Region – Investment Attractiveness Matrix (Volume × CAGR)
- 4.2 Absolute Revenue Growth Opportunity
- 4.2.1 By Region – Absolute USD Growth Through 2032
- 4.3 Incremental Volume Opportunity
- 4.3.1 By Region – Incremental Volume Through 2032
- 4.3.2 Segment – Incremental Volume
- 4.4 Emerging Submarket Opportunity Deep Dive (Subject to Applicability)
- 4.5 Emerging Market Opportunity Scorecards
- 4.5.1 United States
- 4.5.2 Europe
- 4.5.3 Asia
- 4.5.4 Middle East & Africa
Note: Emerging Market Opportunity Scorecards will be included based on relevance and strategic importance. Regions listed are indicative and may vary depending on data availability and market dynamics.
Chapter 5. Petroleum Refining Hydrogen Import-Export Analysis & Trade Flows
- 5.1 Global Trade Overview
- 5.1.1 Global Export Value by Country (2024)
- 5.1.2 Global Export Volume by Country (2024)
- 5.1.3 Global Import Value by Country (2024)
- 5.1.4 Global Import Volume by Country (2024)
- 5.1.5 Net Trade Balance by Country (2024)
- 5.2 Export Analysis – Segment
- 5.2.1 Type 1 (HS Code)
- 5.2.2 Type 2 (HS Code)
- 5.2.3 Type 3 (HS Code)
- 5.2.4 Type 4 (HS Code)
- 5.2.5 Type 5 (HS Code)
- 5.3 Import Analysis – Segment
- 5.3.1 Type 1 (HS Code)
- 5.3.2 Type 2 (HS Code)
- 5.3.3 Type 3 (HS Code)
- 5.3.4 Type 4 (HS Code)
- 5.3.5 Type 5 (HS Code)
- 5.4 Average Unit Trade Prices
- 5.4.1 Average Export Price – Segment & Country
- 5.4.2 Average Import Price – Segment & Source Country
- 5.4.3 Price Trends (2024)
- 5.5 Key Trade Route Analysis
- 5.5.1 Trade Route 1
- 5.5.2 Trade Route 2
- 5.5.3 Trade Route 3
- 5.5.4 Trade Route 4
- 5.5.5 Trade Route 5
- 5.6 Trade Policy Impact Assessment
- 5.6.1 US Anti-Dumping & Section 301 Tariffs
- 5.6.2 EU Customs Union Impact
- 5.6.3 Major Free Trade Agreements
- 5.6.4 USMCA Rules of Origin
Note: Trade policy analysis will be included only where relevant to the Petroleum Refining Hydrogen market.
Chapter 6. Competitive Landscape & Company Benchmarking
- 6.1 Petroleum Refining Hydrogen Market Concentration & Structure
- 6.1.1 Herfindahl-Hirschman Index (HHI) – vs. 2024
- 6.1.2 Tier 1, Tier 2 & Tier 3 Market Structure
- 6.1.3 Global, Regional & Local Player Dynamics
- 6.2 Petroleum Refining Hydrogen Market Share Analysis – 2024
- 6.2.1 Global Revenue Share by Company
- 6.2.2 Global Volume Share by Company
- 6.2.3 Regional Revenue Share
- 6.2.4 Market Share Evolution ( vs. 2024)
- 6.2.5 OEM Segment Share by Company
- 6.2.6 Replacement Segment Share by Company
- 6.3 Production/Delivery Capacity & Facility Analysis
- 6.3.1 Global Installed Capacity
- 6.3.2 Capacity Utilization Rates
- 6.3.3 Production/Output Volume
- 6.3.4 Facility Locations & Capacity Map
- 6.3.5 Planned Capacity Additions
- 6.4 Petroleum Refining Hydrogen Competitive Benchmarking Matrix
- 6.4.1 Revenue, Volume, CAGR & Profitability Comparison
- 6.4.2 Channel Revenue Mix
- 6.4.3 Geographic Revenue Exposure
- 6.4.4 R&D Intensity
- 6.4.5 Sustainability Maturity
- 6.5 Strategic Developments in Petroleum Refining Hydrogen (Last 24 Months)
- 6.5.1 Mergers, Acquisitions & Divestments
- 6.5.2 New Petroleum Refining Hydrogen Launches
- 6.5.3 Facility Expansions
- 6.5.4 Strategic Alliances, Joint Ventures & Partnerships
- 6.5.5 Distribution Expansion & Market Entry
- 6.5.6 Sustainability & ESG Initiatives
- 6.6 Competitive Strategy Mapping
- 6.6.1 Leader, Challenger, Follower & Niche Classification
- 6.6.2 Pricing Strategy Comparison
- 6.6.3 Channel Strategy Matrix
Note: Strategic developments are included based on their materiality and the availability of reliable information.
Chapter 7. Global Petroleum Refining Hydrogen Market – By Distribution Channel
- 7.1 Segment Overview
- 7.1.1 Volume & Revenue Split by Channel (2024 & 2032)
- 7.1.2 Channel Mix Evolution (2024-2032)
Chapter 8. Regional Market Analysis – Global Overview
- 8.1 Global Regional Overview
- 8.1.1 Regional Volume Share
- 8.1.2 Regional Revenue Share
- 8.1.3 Regional Volume by Region
- 8.1.4 Regional Revenue by Region
- 8.1.5 Regional Forecast Through 2032
- 8.2 Cross-Regional Segment Analysis
- 8.2.1 By Distribution Channel
- 8.2.2 By Brand/Price Tier
Chapter 9. North America Petroleum Refining Hydrogen Market
- 9.1 United States
- 9.2 Canada
- 9.3 Mexico
Chapter 10. Europe Petroleum Refining Hydrogen Market
- 10.1 Germany
- 10.2 France
- 10.3 Italy
- 10.4 United Kingdom
- 10.5 Spain
- 10.6 Poland
- 10.7 Russia
- 10.8 Netherlands
- 10.9 Belgium
- 10.10 Sweden
- 10.11 Denmark
- 10.12 Norway
- 10.13 Rest of Europe
Chapter 11. Asia Pacific Petroleum Refining Hydrogen Market
- 11.1 China
- 11.2 India
- 11.3 Japan
- 11.4 South Korea
- 11.5 Thailand
- 11.6 Indonesia
- 11.7 Vietnam
- 11.8 Malaysia
- 11.9 Australia
- 11.10 Rest of Asia Pacific
Chapter 12. Latin America Petroleum Refining Hydrogen Market
- 12.1 Brazil
- 12.2 Argentina
- 12.3 Colombia
- 12.4 Chile
- 12.5 Rest of Latin America
Chapter 13. Middle East Petroleum Refining Hydrogen Market
- 13.1 Saudi Arabia
- 13.2 United Arab Emirates
- 13.3 Turkey
- 13.4 Israel
- 13.5 Iran
- 13.6 Rest of the Middle East
Chapter 14. Africa Petroleum Refining Hydrogen Market
- 14.1 South Africa
- 14.2 Egypt
- 14.3 Nigeria
- 14.4 Morocco
- 14.5 Rest of Africa
Chapter 15. Petroleum Refining Hydrogen Company Profiles
- 15.1 [Company 01]
- 15.1.1 Company Overview
- 15.1.2 Key Management Personnel
- 15.1.3 Products & Services Portfolio
- 15.1.4 Financial Performance
- 15.1.5 Key Market Focus & Geographic Presence
- 15.1.6 Recent Developments & Strategic Initiatives
Note: The company profile list is preliminary and may change based on research findings, market developments, data availability, and client requirements.
Chapter 16. Appendices
- Appendix A – List of Abbreviations & Acronyms
- Appendix B – Industry Classification Code Reference – Full Series
- Appendix C – Production & Capacity Data Tables
- Appendix D – End-Use & Demand Base Tables
- Appendix E – Consumption & Replacement Rate Assumptions
- Appendix F – ASP Reference Tables
- Appendix G – Manufacturing & Facility Database
- Appendix H – Import-Export Data Tables
- Appendix I – Regulatory Summary Tables
- Appendix J – Primary Research Participant List (Anonymized)
- Appendix K – Primary Research Questionnaire Framework
- Appendix L – Data Sources & Bibliography
- Appendix M – Market Size Divergence & Source Comparison
Chapter 17. Research Methodology
- 17.1 Research Framework & Philosophy
- 17.2 Secondary Research – Sources, Hierarchy & Data Extraction
- 17.3 Data Modeling – Bottom-Up & Top-Down Market Sizing
- 17.4 Primary Research – Stakeholder Framework, LOI & Sample Sizes
- 17.5 Forecast Methodology – Regression, Scenario & Sensitivity Analysis
- 17.6 Quality Control – Four-Layer Validation Framework
- 17.7 Limitations & Standard Assumptions
- 17.8 Disclaimer
