
Market Overview
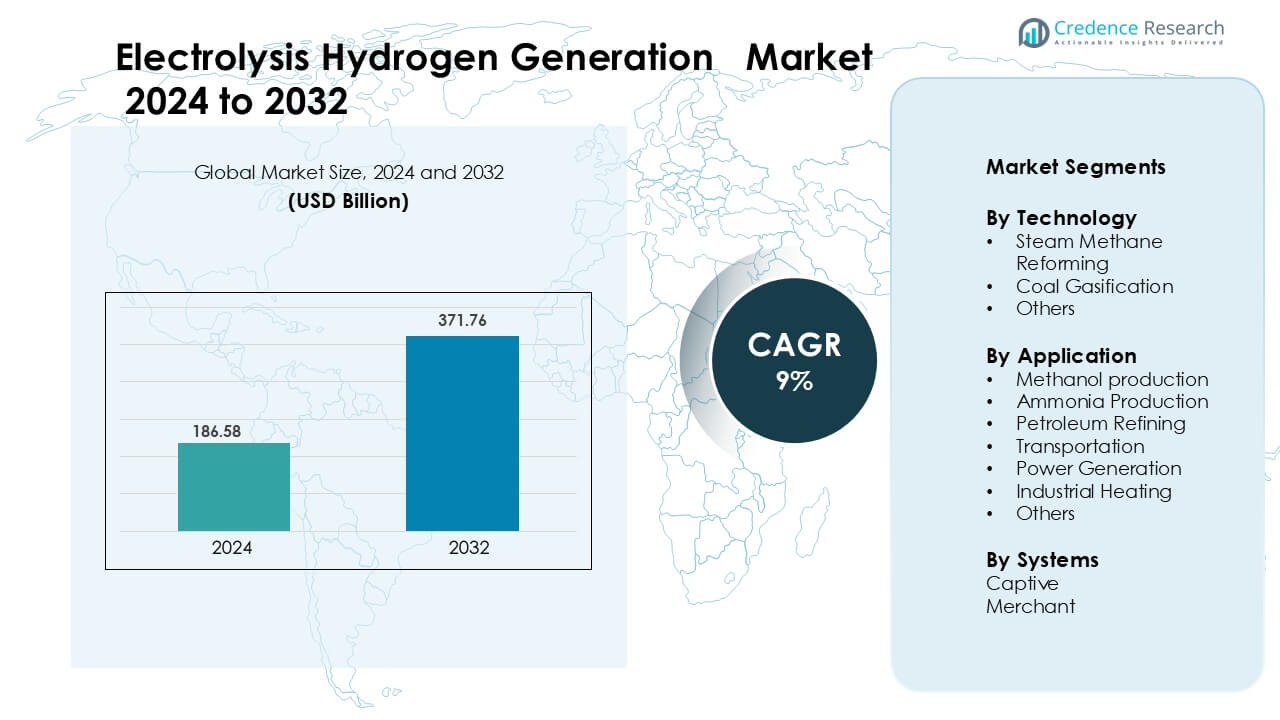
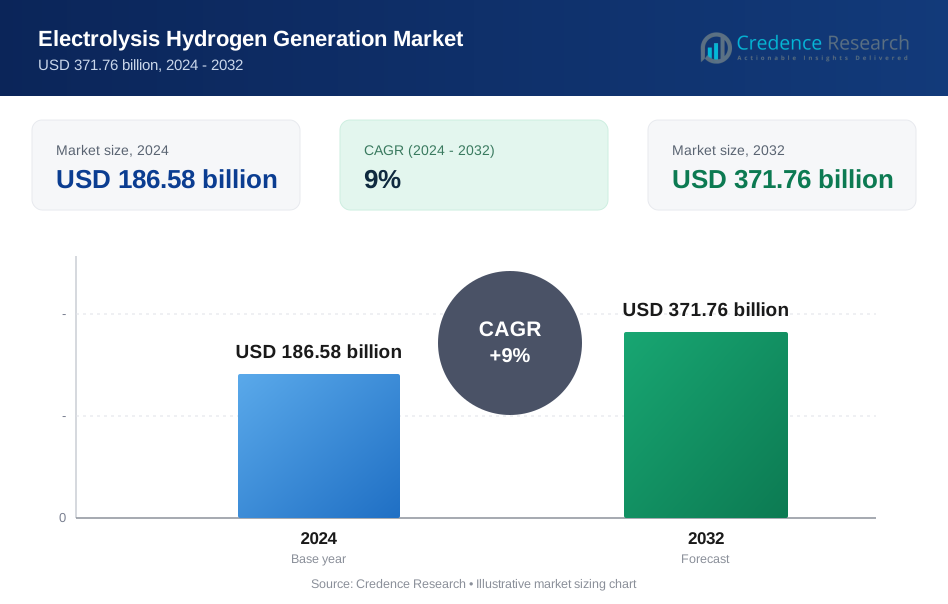
Electrolysis Hydrogen Generation Market was valued at USD 186.58 billion in 2024 and is anticipated to reach USD 371.76 billion by 2032, growing at a CAGR of 9% during the forecast period.
| REPORT ATTRIBUTE | DETAILS |
|---|---|
| Historical Period | 2020-2023 |
| Base Year | 2024 |
| Forecast Period | 2025-2032 |
| Electrolysis Hydrogen Generation Market Size 2024 | USD 186.58 Billion |
| Electrolysis Hydrogen Generation Market, CAGR | 9% |
| Electrolysis Hydrogen Generation Market Size 2032 | USD 371.76 Billion |
Key players in the Electrolysis Hydrogen Generation market include Air Liquide International S.A, Linde Plc, Messer, Air Products and Chemicals, Inc., Hydrogenics Corporation, INOX Air Products Ltd., Matheson Tri-Gas, Inc., SOL Group, Iwatani Corporation, and Tokyo Gas Chemicals Co., Ltd. These companies expand large-scale electrolyzer projects, secure renewable power supply contracts, and develop hydrogen fueling infrastructure for transport and industrial customers. Europe leads the global market with a 37% share, driven by strict decarbonization policies, hydrogen corridor development, and multi-country investments in green ammonia and large offshore wind-to-hydrogen plants.
Market Insights
- The Electrolysis Hydrogen Generation market was valued at USD 186.58 billion in 2024 and is projected to reach USD 371.76 billion by 2032, registering a CAGR of 9% during the forecast period.
- Growing industrial decarbonization and renewable energy expansion drive adoption, as refineries, fertilizer plants, and steel producers switch to clean hydrogen to meet emission rules and energy-transition targets.
- Alkaline electrolyzers hold the largest technology segment share of 58%, supported by lower capital cost and long operating life, while PEM systems grow fast due to higher efficiency and mobility integration.
- Competition involves major gas companies and electrolyzer developers such as Linde Plc, Air Liquide, Messer, Iwatani, and Hydrogenics, focusing on gigawatt-scale projects, stack efficiency improvements, and hydrogen fueling networks.
- Europe leads the market with 37% regional share, supported by hydrogen valleys, offshore wind-to-hydrogen projects, and cross-border pipelines, while Asia-Pacific grows rapidly driven by industrial usage and fuel-cell mobility expansion.
Market Segmentation Analysis
By Technology
Steam Methane Reforming holds the largest market share due to established infrastructure and lower production cost compared to other routes. Industrial users prefer this method for large-scale hydrogen output and high conversion efficiency. Coal gasification remains relevant in regions with abundant coal reserves, supporting cost-sensitive industries. However, cleaner routes such as electrolysis gain momentum with rising renewable energy integration and emission mandates. Governments promote green hydrogen incentives, which encourage industries to shift toward water electrolysis and hybrid renewable systems. Technology advancements and declining renewable power tariffs continue to reduce operational costs, making alternative routes more viable over time.
- For instance, Grasys has developed hydrogen generation units by steam methane reforming that produce up to 130,000 m³/hour of hydrogen with a purity of up to 99.999%.
By Application
Ammonia production dominates the application segment with the highest market share, driven by strong fertilizer demand and industrial feedstock usage. Refineries and petrochemical plants integrate hydrogen for desulfurization and fuel upgrading, supporting petroleum refining as another major segment. Methanol and transportation applications expand with cleaner fuel adoption and hydrogen-based mobility initiatives. Power generation and industrial heating gain traction as industries target lower emissions and energy security. Many countries invest in hydrogen-ready turbines, pipelines, and storage to support long-term decarbonization strategies. Government programs and corporate sustainability targets accelerate hydrogen adoption across new end-use sectors.
- For instance, thyssenkrupp Uhde offers modular green-ammonia plants in capacity classes ranging from 50 metric tons per day (tpd) up to 5000 tpd.
By Systems
Captive systems account for the dominant market share as large industrial facilities generate hydrogen on-site to ensure steady supply and lower logistics cost. These systems support ammonia producers, refineries, and chemical factories with continuous high-volume demand. Merchant systems grow at a faster pace due to rising distributed applications, urban fueling stations, and temporary industrial usage. Expanding hydrogen transport networks, liquid carriers, and tube trailers strengthen merchant business models. Growing investment in electrolyzer parks and green hydrogen hubs encourages partnerships between producers and utilities, expanding supply availability for diverse commercial customers.
Key Growth Drivers
Decarbonization Policies and Net-Zero Targets
Governments push strict emission rules across heavy industries. Many countries plan net-zero targets and promote green hydrogen. Electrolysis supports clean production because it uses water and renewable power. Steel, cement, and chemical plants adopt hydrogen to replace carbon-heavy fuels. Policy incentives reduce risk for new projects and lower adoption cost. Subsidies support electrolyzer purchases and renewable electricity use. Public funding accelerates pilot plants, fuel-cell mobility, and hydrogen hubs. Large buyers sign long-term contracts, which help investors. Strong climate commitments from multinational companies create stable demand. As a result, green hydrogen becomes a strategic pillar for long-term climate goals and industrial transformation.
- For instance, under India’s National Green Hydrogen Mission, contracts have been awarded for 3,000 MW per annum of electrolyser manufacturing capacity and for green hydrogen production capacity of 412,000 tons per annum.
Falling Renewable Energy Costs and Grid Expansion
Solar and wind prices decline due to large-scale manufacturing and strong installation growth. Lower electricity cost improves the economics of electrolysis. New high-voltage power lines help move clean energy from remote sites. Grid operators support flexible demand programs that suit hydrogen production. Large renewable farms build co-located hydrogen plants to avoid curtailment. Companies sign power purchase agreements to guarantee steady input power. These steps increase system efficiency and plant runtime. More nations expand charging, storage, and backup systems that support hydrogen clusters. As renewable energy becomes cheaper, green hydrogen moves closer to cost parity with fossil-based hydrogen.
- For instance, in India the utility-scale solar plant levelised cost of electricity (LCOE) reached US $0.038 per kWh in 2024.
Fuel-Cell Transportation and Industrial Applications
Hydrogen fuel-cell vehicles attract attention for long driving range and fast refueling. Heavy trucks, buses, trains, and ships benefit from hydrogen because batteries add weight. Countries invest in fueling stations and truck corridors. Aviation and shipping firms explore hydrogen-based fuels to cut emissions. Factories use hydrogen for high-temperature heat and power. Refineries adopt clean hydrogen for desulfurization. Long-duration energy storage becomes a new growth route. These uses create strong commercial demand. As adoption rises in transport and industry, scale improves supply chains and lowers cost, supporting faster market expansion.
Key Trend & Opportunity
High-Capacity Electrolyzers and Modular Plants
Manufacturers design large electrolyzers with higher efficiency and easier maintenance. Modular designs allow quick deployment in remote areas. New stacks improve durability and reduce water use. Developers build 100-megawatt and gigawatt plants linked to wind and solar farms. Many countries create hydrogen valleys that combine production, storage, and end-use. Standardization reduces project risk and speeds approvals. Partnerships between utilities and industrial buyers secure long-term revenue. These innovations lower cost per kilogram and make hydrogen more competitive. As plants get larger, supply becomes reliable and supports major industries such as steel and fertilizers.
- For instance, Accelera (a division of Cummins Inc.) will supply a 100 MW PEM electrolyzer system for bp plc’s Lingen green hydrogen project in Germany; the system is expected to produce up to 11,000 tons of green hydrogen per year.
Hydrogen Infrastructure and Export Trade
Nations invest in pipelines, storage caverns, port terminals, and liquefaction sites. Infrastructure growth improves supply flexibility and lowers transport cost. Europe, Japan, and South Korea plan large import contracts. Middle East and Australia develop mega-export hubs linked to renewable resources. Green ammonia becomes a common carrier for overseas shipping. Shipping firms test liquid hydrogen and compressed gas solutions. Standard safety codes help operators expand networks safely. Trade creates new business models and long-term price stability. Global demand encourages continuous investment, making hydrogen a global commodity.
- For instance, Plug Power Inc. delivered 44.5 metric tons of renewable hydrogen to the H2CAST salt-cavern storage project in Germany between April and August 2025.
Key Challenge
High Capital Cost and Limited Commercial Scale
Electrolyzers and renewable power systems need large upfront investment. Smaller plants face high unit costs and struggle to compete with fossil hydrogen. Long permitting cycles delay project timelines. Developers need strong financing and power purchase agreements. Some regions lack stable policies and risk long-term planning. Without scale, supply chains remain slow and expensive. Many companies wait for cost parity before switching. These issues slow market growth and limit adoption in cost-sensitive industries. Continuous subsidies, technology improvements, and larger production orders will ease this challenge.
- Infrastructure Gaps and Storage Complexity Hydrogen is light and requires compression, liquefaction, or conversion for transport. Pipelines and fueling stations remain limited in many regions. Storage tanks need advanced materials and strict safety rules. Distribution equipment adds cost for refineries, factories, and transport operators. Without broad networks, buyers cannot rely on steady supply. Fueling shortages discourage vehicle adoption. Long-term storage needs geological caverns or advanced systems that remain expensive. These hurdles delay commercial expansion. Coordinated planning, public investment, and clear standards will help solve infrastructure gaps and support reliable market growth.
Regional Analysis
North America
North America holds 24% of the electrolysis hydrogen generation market, supported by federal clean energy mandates, tax credits, and hydrogen hub funding. The United States leads regional deployment, with refineries, chemical plants, and utilities adopting green hydrogen for emission reduction. Multiple states approve incentives for electrolyzer procurement and renewable-powered hydrogen systems. Canada focuses on export-ready projects and leverages strong wind potential in coastal areas. Fuel-cell trucking corridors and pilot storage plants strengthen commercial demand. Collaboration between energy companies, automakers, and technology developers improves supply chain capacity. This policy-backed environment keeps North America a strong and expanding market.
Europe
Europe commands the largest market share at 37%, driven by strict decarbonization policies and national hydrogen strategies. The European Union invests in large “hydrogen valleys,” cross-border pipeline links, and long-term funding programs. Germany, France, Spain, and the Netherlands build gigawatt-scale electrolysis projects connected to offshore wind power. Fertilizer producers, steelmakers, and refineries switch to green hydrogen to comply with climate rules. Ports expand storage and export terminals for shipping and trucking fleets. Strong regulatory backing, technology leadership, and public-private partnerships keep Europe the global leader in clean hydrogen deployment.
Asia-Pacific
Asia-Pacific holds 28% of the market, driven by industrial fuel demand and large renewable capacity. China expands electrolyzer manufacturing and builds hydrogen clusters near solar and wind bases. Japan and South Korea lead fuel-cell vehicle adoption, hydrogen refueling stations, and maritime pilot projects. India’s national hydrogen mission supports clean production for steel, fertilizers, and refineries. Australia develops export hubs linked to ammonia shipping routes. Falling renewable power cost and strong government incentives accelerate scale. Asia-Pacific’s combination of technology investment and industrial usage positions the region as a major growth engine.
Middle East & Africa
Middle East & Africa hold 7% of the market, but growth is fast due to abundant solar resources and low electricity cost. Saudi Arabia, UAE, and Oman plan gigawatt-scale hydrogen and green ammonia plants aimed at exports to Europe and Asia. Large ports upgrade storage, liquefaction, and shipping infrastructure. South Africa tests hydrogen for mining transport and industrial heat. The region attracts foreign investment and technology partnerships because of favorable production economics. With long-term export contracts and renewable-backed electrolyzer parks, Middle East & Africa are emerging as a future hydrogen powerhouse.
Latin America
Latin America accounts for 4% of the market, supported by strong wind and solar potential. Chile develops coastal wind-to-hydrogen export projects and aims to become a global supplier of green ammonia. Brazil integrates hydrogen into refineries, steel plants, and heavy power users. Argentina expands renewable zones to support electrolysis hubs. Foreign partnerships bring financing, technology, and offtake agreements. Pilot facilities transition toward commercial scale as governments launch national hydrogen policies. Although still early-stage, Latin America’s low-cost renewable energy and export-focused strategies support steady market expansion.
Market Segmentations:
By Technology
- Steam Methane Reforming
- Coal Gasification
- Others
By Application
- Methanol production
- Ammonia Production
- Petroleum Refining
- Transportation
- Power Generation
- Industrial Heating
- Others
By Systems
- Captive
- Merchant
By Geography
- North America
- U.S.
- Canada
- Mexico
- Europe
- Germany
- France
- U.K.
- Italy
- Spain
- Rest of Europe
- Asia Pacific
- China
- Japan
- India
- South Korea
- South-east Asia
- Rest of Asia Pacific
- Latin America
- Brazil
- Argentina
- Rest of Latin America
- Middle East & Africa
- GCC Countries
- South Africa
- Rest of the Middle East and Africa
Competitive Landscape
The competitive landscape of the Electrolysis Hydrogen Generation market features a mix of global industrial gas suppliers, electrolyzer manufacturers, and technology developers focused on cost-efficient, renewable-powered hydrogen production. Companies such as Air Liquide, Linde Plc, and Messer expand large-scale electrolyzer plants and supply agreements with refineries, steel producers, and mobility providers. Air Products and Hydrogenics strengthen portfolios through advanced PEM and alkaline electrolyzer systems, improving efficiency and lowering maintenance needs. Iwatani Corporation and Tokyo Gas Chemicals invest in hydrogen fueling stations to support commercial vehicle adoption. INOX Air Products and SOL Group expand production capacity in emerging markets through partnerships and industrial offtake contracts. Many players form joint ventures with renewable power developers to secure long-term electricity supply, enabling competitive pricing. Continuous R&D, demonstration plants, and global export strategies shape competition, encouraging rapid scale-up, improved stack durability, and digital process control. Regulations and public funding further intensify investment and technology commercialization across the market.
Key Player Analysis
- Messer
- Iwatani Corporation
- Matheson Tri-Gas, Inc.
- SOL Group
- Air Liquide International S.A
- Tokyo Gas Chemicals Co., Ltd.
- Linde Plc
- INOX Air Products Ltd.
- Hydrogenics Corporation
- Air Products and Chemicals, Inc
Recent Developments
- In July 2024, Messer Group Announced a 10 MW green-hydrogen plant in Germany (Brainergy Park Jülich) with up to 180 kg H₂ per hour.
- In Jun 2023, Iwatani Corporation Announced a ¥178 billion (~US$1.25 billion) five-year investment in hydrogen-related projects, including electrolysis.
Report Coverage
The research report offers an in-depth analysis based on Technology, Application, Systems and Geography. It details leading market players, providing an overview of their business, product offerings, investments, revenue streams, and key applications. Additionally, the report includes insights into the competitive environment, SWOT analysis, current market trends, as well as the primary drivers and constraints. Furthermore, it discusses various factors that have driven market expansion in recent years. The report also explores market dynamics, regulatory scenarios, and technological advancements that are shaping the industry. It assesses the impact of external factors and global economic changes on market growth. Lastly, it provides strategic recommendations for new entrants and established companies to navigate the complexities of the market.
Future Outlook
- Green hydrogen will gain stronger momentum as decarbonization targets tighten across industries.
- Electrolyzer costs will fall due to mass manufacturing and improved stack design.
- Large offshore wind and solar projects will integrate dedicated hydrogen production units.
- Fuel-cell trucking, buses, and shipping will boost hydrogen demand in transport.
- Green ammonia and methanol production will expand for global energy trade.
- Industrial heat users will replace fossil fuels with hydrogen for high-temperature processes.
- Storage technologies and pipelines will scale to support reliable supply networks.
- Hydrogen hubs and corridors will connect producers, ports, and major buyers.
- Government incentives and private investments will accelerate gigawatt-scale plants.
- Digital monitoring and automation will improve efficiency and reduce operating costs.
Request a Free Sample
Fill in your details and we'll send you a free sample report.
- Sample data tables & charts
- Research methodology
Need a Custom Version of This Report?
Tailor the scope, geography, or segments to your exact requirements.
- Custom geography or segment scope
- Direct access to our analyst team
Frequently Asked Questions
What is the current market size for the Electrolysis Hydrogen Generation Market, and what is its projected size in 2032?
At what Compound Annual Growth Rate is the Electrolysis Hydrogen Generation Market projected to grow between 2025 and 2032?
Which Electrolysis Hydrogen Generation Market segment held the largest share in 2024?
What are the primary factors fueling the growth of the Electrolysis Hydrogen Generation Market?
Who are the leading companies in the Electrolysis Hydrogen Generation market?
Which region commanded the largest share of the Electrolysis Hydrogen Generation Market in 2024?
Table of Content
Chapter 1. Report Introduction
- 1.1 Report Description & Purpose
- 1.1.1 Report Title & Market Definition
- 1.1.2 Unique Selling Propositions (USP) & Key Differentiators
- 1.1.3 Value Proposition for Stakeholders
- 1.2 Research Objectives
- 1.2.1 Market Sizing Objectives (Volume & Revenue)
- 1.2.2 Segmentation Objectives
- 1.2.3 Competitive Intelligence Objectives
- 1.2.4 Forecast & Scenario Objectives
- 1.3 Report Scope
- 1.3.1 Electrolysis Hydrogen Generation Scope – Types & Subtypes Covered
- 1.3.2 Geographic Scope – Regions & Countries Covered
- 1.3.3 Historical Period, Base Year & Forecast Period (2024; forecast to 2032)
- 1.3.4 Inclusions & Exclusions
- 1.4 HS Code & Classification Framework
- 1.5 Currency, Units & Pricing Basis
- 1.6 Target Stakeholders
- 1.7 Limitations & Assumptions
Chapter 2. Executive Summary
- 2.1 Global Electrolysis Hydrogen Generation Market Snapshot
- 2.1.1 Market Size – Historical (2024) & Forecast (2024-2032) (2024: USD 186.58 billion → 2032: USD 371.76 billion)
- 2.1.2 Volume & Revenue – Global Totals
- 2.1.3 Key Market Highlights – Top Five Facts
- 2.2 Electrolysis Hydrogen Generation Market Segmentation Snapshot
- 2.2.1 Market Split by Region – 2024 vs. 2032
- 2.3 Competitive Snapshot
- 2.3.1 Top 10 Players by Revenue Share – 2024
- 2.3.2 Top 10 Players by Volume Share – 2024
- 2.3.3 Recent Strategic Developments (18-Month Summary)
- 2.4 Key Investment Highlights & Strategic Conclusions
Chapter 3. Electrolysis Hydrogen Generation Market Dynamics & Industry Analysis
- 3.1 Market Overview & Context
- 3.1.1 Electrolysis Hydrogen Generation Market Position in the Broader Automotive Value Chain
- 3.1.2 OEM vs. Replacement Market Dynamics
- 3.1.3 Market Maturity & Development Stage by Region
- 3.2 Electrolysis Hydrogen Generation Market Drivers
- 3.3 Electrolysis Hydrogen Generation Market Restraints & Challenges
- 3.4 Electrolysis Hydrogen Generation Market Opportunities
- 3.5 Porter's Five Forces Analysis
- 3.5.1 Threat of New Entrants
- 3.5.2 Bargaining Power of Suppliers
- 3.5.3 Bargaining Power of Buyers
- 3.5.4 Threat of Substitutes
- 3.5.5 Competitive Rivalry – Intensity Assessment
- 3.6 Electrolysis Hydrogen Generation Value Chain Analysis
- 3.6.1 Upstream – Raw Material/Input Suppliers
- 3.6.1.1 Raw Material/Input 1
- 3.6.1.2 Raw Material/Input 2
- 3.6.1.3 Raw Material/Input 3
- 3.6.2 Midstream – Production/Manufacturing/Service Delivery
- 3.6.2.1 Production/Process Overview
- 3.6.2.2 Key Facility Locations & Capacity by Manufacturer
- 3.6.3 Downstream – Distribution & End Consumer
- 3.6.3.1 Primary Channel – B2B/OEM
- 3.6.3.2 Secondary Channels – Dealer, Retail, Online, Direct
- 3.6.4 Value Chain Profitability Analysis
- 3.6.1 Upstream – Raw Material/Input Suppliers
- 3.7 PESTEL Analysis
- 3.7.1 Political Factors
- 3.7.2 Economic Factors
- 3.7.3 Social Factors
- 3.7.4 Technological Factors
- 3.7.5 Environmental Factors
- 3.7.6 Legal Factors
- 3.8 Electrolysis Hydrogen Generation Supply Chain Analysis
- 3.8.1 Raw Material/Input Supply Risk Assessment
- 3.8.2 Manufacturing Concentration Risk (Geographic Exposure)
- 3.8.3 Trade Disruption Impact Analysis
- 3.9 Regulatory & Policy Landscape
Note: The regulatory and policy landscape section covers regulations based on their applicability to the market, Electrolysis Hydrogen Generation category, geography, and scope of the study. Only regulatory frameworks with a material impact on operations, compliance, trade, sustainability, or market access are analyzed in detail.
Chapter 4. Key Investment Pockets & Opportunity Analysis
- 4.1 Electrolysis Hydrogen Generation Market Attractiveness Analysis
- 4.1.1 By Region – Investment Attractiveness Matrix (Volume × CAGR)
- 4.2 Absolute Revenue Growth Opportunity
- 4.2.1 By Region – Absolute USD Growth Through 2032
- 4.3 Incremental Volume Opportunity
- 4.3.1 By Region – Incremental Volume Through 2032
- 4.3.2 Segment – Incremental Volume
- 4.4 Emerging Submarket Opportunity Deep Dive (Subject to Applicability)
- 4.5 Emerging Market Opportunity Scorecards
- 4.5.1 United States
- 4.5.2 Europe
- 4.5.3 Asia
- 4.5.4 Middle East & Africa
Note: Emerging Market Opportunity Scorecards will be included based on relevance and strategic importance. Regions listed are indicative and may vary depending on data availability and market dynamics.
Chapter 5. Electrolysis Hydrogen Generation Import-Export Analysis & Trade Flows
- 5.1 Global Trade Overview
- 5.1.1 Global Export Value by Country (2024)
- 5.1.2 Global Export Volume by Country (2024)
- 5.1.3 Global Import Value by Country (2024)
- 5.1.4 Global Import Volume by Country (2024)
- 5.1.5 Net Trade Balance by Country (2024)
- 5.2 Export Analysis – Segment
- 5.2.1 Type 1 (HS Code)
- 5.2.2 Type 2 (HS Code)
- 5.2.3 Type 3 (HS Code)
- 5.2.4 Type 4 (HS Code)
- 5.2.5 Type 5 (HS Code)
- 5.3 Import Analysis – Segment
- 5.3.1 Type 1 (HS Code)
- 5.3.2 Type 2 (HS Code)
- 5.3.3 Type 3 (HS Code)
- 5.3.4 Type 4 (HS Code)
- 5.3.5 Type 5 (HS Code)
- 5.4 Average Unit Trade Prices
- 5.4.1 Average Export Price – Segment & Country
- 5.4.2 Average Import Price – Segment & Source Country
- 5.4.3 Price Trends (2024)
- 5.5 Key Trade Route Analysis
- 5.5.1 Trade Route 1
- 5.5.2 Trade Route 2
- 5.5.3 Trade Route 3
- 5.5.4 Trade Route 4
- 5.5.5 Trade Route 5
- 5.6 Trade Policy Impact Assessment
- 5.6.1 US Anti-Dumping & Section 301 Tariffs
- 5.6.2 EU Customs Union Impact
- 5.6.3 Major Free Trade Agreements
- 5.6.4 USMCA Rules of Origin
Note: Trade policy analysis will be included only where relevant to the Electrolysis Hydrogen Generation market.
Chapter 6. Competitive Landscape & Company Benchmarking
- 6.1 Electrolysis Hydrogen Generation Market Concentration & Structure
- 6.1.1 Herfindahl-Hirschman Index (HHI) – vs. 2024
- 6.1.2 Tier 1, Tier 2 & Tier 3 Market Structure
- 6.1.3 Global, Regional & Local Player Dynamics
- 6.2 Electrolysis Hydrogen Generation Market Share Analysis – 2024
- 6.2.1 Global Revenue Share by Company
- 6.2.2 Global Volume Share by Company
- 6.2.3 Regional Revenue Share
- 6.2.4 Market Share Evolution ( vs. 2024)
- 6.2.5 OEM Segment Share by Company
- 6.2.6 Replacement Segment Share by Company
- 6.3 Production/Delivery Capacity & Facility Analysis
- 6.3.1 Global Installed Capacity
- 6.3.2 Capacity Utilization Rates
- 6.3.3 Production/Output Volume
- 6.3.4 Facility Locations & Capacity Map
- 6.3.5 Planned Capacity Additions
- 6.4 Electrolysis Hydrogen Generation Competitive Benchmarking Matrix
- 6.4.1 Revenue, Volume, CAGR & Profitability Comparison
- 6.4.2 Channel Revenue Mix
- 6.4.3 Geographic Revenue Exposure
- 6.4.4 R&D Intensity
- 6.4.5 Sustainability Maturity
- 6.5 Strategic Developments in Electrolysis Hydrogen Generation (Last 24 Months)
- 6.5.1 Mergers, Acquisitions & Divestments
- 6.5.2 New Electrolysis Hydrogen Generation Launches
- 6.5.3 Facility Expansions
- 6.5.4 Strategic Alliances, Joint Ventures & Partnerships
- 6.5.5 Distribution Expansion & Market Entry
- 6.5.6 Sustainability & ESG Initiatives
- 6.6 Competitive Strategy Mapping
- 6.6.1 Leader, Challenger, Follower & Niche Classification
- 6.6.2 Pricing Strategy Comparison
- 6.6.3 Channel Strategy Matrix
Note: Strategic developments are included based on their materiality and the availability of reliable information.
Chapter 7. Global Electrolysis Hydrogen Generation Market – By Distribution Channel
- 7.1 Segment Overview
- 7.1.1 Volume & Revenue Split by Channel (2024 & 2032)
- 7.1.2 Channel Mix Evolution (2024-2032)
Chapter 8. Regional Market Analysis – Global Overview
- 8.1 Global Regional Overview
- 8.1.1 Regional Volume Share
- 8.1.2 Regional Revenue Share
- 8.1.3 Regional Volume by Region
- 8.1.4 Regional Revenue by Region
- 8.1.5 Regional Forecast Through 2032
- 8.2 Cross-Regional Segment Analysis
- 8.2.1 By Distribution Channel
- 8.2.2 By Brand/Price Tier
Chapter 9. North America Electrolysis Hydrogen Generation Market
- 9.1 United States
- 9.2 Canada
- 9.3 Mexico
Chapter 10. Europe Electrolysis Hydrogen Generation Market
- 10.1 Germany
- 10.2 France
- 10.3 Italy
- 10.4 United Kingdom
- 10.5 Spain
- 10.6 Poland
- 10.7 Russia
- 10.8 Netherlands
- 10.9 Belgium
- 10.10 Sweden
- 10.11 Denmark
- 10.12 Norway
- 10.13 Rest of Europe
Chapter 11. Asia Pacific Electrolysis Hydrogen Generation Market
- 11.1 China
- 11.2 India
- 11.3 Japan
- 11.4 South Korea
- 11.5 Thailand
- 11.6 Indonesia
- 11.7 Vietnam
- 11.8 Malaysia
- 11.9 Australia
- 11.10 Rest of Asia Pacific
Chapter 12. Latin America Electrolysis Hydrogen Generation Market
- 12.1 Brazil
- 12.2 Argentina
- 12.3 Colombia
- 12.4 Chile
- 12.5 Rest of Latin America
Chapter 13. Middle East Electrolysis Hydrogen Generation Market
- 13.1 Saudi Arabia
- 13.2 United Arab Emirates
- 13.3 Turkey
- 13.4 Israel
- 13.5 Iran
- 13.6 Rest of the Middle East
Chapter 14. Africa Electrolysis Hydrogen Generation Market
- 14.1 South Africa
- 14.2 Egypt
- 14.3 Nigeria
- 14.4 Morocco
- 14.5 Rest of Africa
Chapter 15. Electrolysis Hydrogen Generation Company Profiles
- 15.1 [Company 01]
- 15.1.1 Company Overview
- 15.1.2 Key Management Personnel
- 15.1.3 Products & Services Portfolio
- 15.1.4 Financial Performance
- 15.1.5 Key Market Focus & Geographic Presence
- 15.1.6 Recent Developments & Strategic Initiatives
Note: The company profile list is preliminary and may change based on research findings, market developments, data availability, and client requirements.
Chapter 16. Appendices
- Appendix A – List of Abbreviations & Acronyms
- Appendix B – Industry Classification Code Reference – Full Series
- Appendix C – Production & Capacity Data Tables
- Appendix D – End-Use & Demand Base Tables
- Appendix E – Consumption & Replacement Rate Assumptions
- Appendix F – ASP Reference Tables
- Appendix G – Manufacturing & Facility Database
- Appendix H – Import-Export Data Tables
- Appendix I – Regulatory Summary Tables
- Appendix J – Primary Research Participant List (Anonymized)
- Appendix K – Primary Research Questionnaire Framework
- Appendix L – Data Sources & Bibliography
- Appendix M – Market Size Divergence & Source Comparison
Chapter 17. Research Methodology
- 17.1 Research Framework & Philosophy
- 17.2 Secondary Research – Sources, Hierarchy & Data Extraction
- 17.3 Data Modeling – Bottom-Up & Top-Down Market Sizing
- 17.4 Primary Research – Stakeholder Framework, LOI & Sample Sizes
- 17.5 Forecast Methodology – Regression, Scenario & Sensitivity Analysis
- 17.6 Quality Control – Four-Layer Validation Framework
- 17.7 Limitations & Standard Assumptions
- 17.8 Disclaimer
