
Quick answer
A grease plant reacts a fatty acid with lithium or calcium hydroxide inside base oil to form a soap thickener, then mills, tests and packs the finished grease. A 10,000 tonne a year plant needs fixed CapEx of about USD 5–8.5 million at an Asian industrial park and an assumed USD 12–20 million at a U.S. or EU site. Gross margin runs about 18–28% at 2026 prices, and midpoint payback takes about 3–5 years.
Viable for producers that can run several thickener chemistries and sell into industrial maintenance channels; risky as a lithium-only commodity line exposed to base oil and lithium price swings.
Grease plant: key highlights
| Parameter | Indicative value | Note |
|---|---|---|
| Plant capacity | 10,000 TPA (about 33 TPD) | 300 working days, one contactor plus two open kettles for lithium, lithium complex and calcium greases |
| Total CapEx | USD 5–8.5 million | Asian industrial park; assumed USD 12–20 million at a U.S. or EU site; excludes working capital |
| Raw material share of operating cost | 68–74% | Base oil, fatty acid, lithium hydroxide and additives, with selling and freight in total cost |
| Gross margin | 18–28% | Assumed net price of USD 2,300–3,000 per tonne and assumed base oil of USD 1,250–1,600 per tonne |
| Payback period | 3–5 years | Midpoint margin at 80% utilization, on CapEx plus working capital margin; past 7 years near an 18% margin |
| IRR | Available in report | Post-tax, 10-year model |
| Break-even | Available in report | Capacity utilization basis |
Ranges assume a 10,000 TPA greenfield grease plant on 3 acres at an Asian industrial park, 2026 prices, 80% utilization, assumed base oil of USD 1,250–1,600 per tonne, assumed 12-hydroxystearic acid of USD 2,000–2,600 per tonne, assumed lithium hydroxide of USD 10,000–15,000 per tonne and assumed net prices of USD 2,300–3,000 per tonne. U.S. and EU costs are assumed multiples. The full report is customizable to any country.
What is grease?
Lubricating grease is a semi-solid lubricant made by dispersing a thickener in a lubricating oil, so it stays in place on bearings, gears and joints where a liquid oil would drain away. A typical formula holds about 80–90% base oil, 5–15% thickener and a few percent of additives for extreme pressure, oxidation and rust protection.
Greases are grouped by thickener and by consistency. Simple lithium and lithium complex soaps remain the most common thickeners, followed by calcium, calcium sulfonate, aluminum complex, polyurea and clay. The NLGI consistency scale runs from 000, almost fluid, to 6, nearly block-like, and NLGI 2 is the workhorse grade for wheel bearings, chassis points, electric motors and plant equipment. Base oils are mostly mineral, with esters, polyalphaolefins and silicones reserved for extreme temperatures and food-grade duty.
Tariff treatment depends on oil content. Greases containing 70% or more by weight of petroleum oil as the basic constituent fall under HS code 271019, which the U.S. schedule splits at 2710.19.35 and 2710.19.40 by fatty acid salt content. Greases with less petroleum oil move to HS 340319, and fully synthetic greases with none to HS 340399. Buyers include vehicle makers, steel mills, mines, cement and power plants, railways, farms and maintenance distributors.
Grease market overview and global demand
The Credence Research grease market report puts the global market at about USD 7.0 billion in 2025, based on Credence Research's USD 6.6 billion for 2024 and 4.8% CAGR, rising to about USD 9.7 billion by 2032. Value grows faster than tonnage because the mix keeps moving toward complex and synthetic greases.
The best physical gauge is the annual NLGI grease Production Survey. Reporting companies made about 2.5 billion pounds, or roughly 1.1 million tonnes, in 2022, and reported output fell in 2024 for a tenth straight year, according to Lubes'N'greases coverage of the survey in July 2025. The survey statistician estimates that respondents represent about half of the world's grease plants, so true output is higher. China is the largest producer by a wide margin, ahead of Europe and North America.
The thickener mix is shifting away from lithium. Conventional and complex lithium greases fell from just over 70% of surveyed output in 2020 to 57% in 2024, after lithium prices rose about tenfold between late 2020 and late 2022 as battery makers competed for supply. Polyurea rose to 9%, calcium sulfonate to 6%, and anhydrous calcium held about 10%. A new plant therefore needs vessels that can switch chemistries rather than a lithium-only line.
Demand follows heavy industry: steel, mining, cement, construction equipment, agriculture, wind turbines and automotive wheel bearings. Electric vehicles reduce engine oil demand but still need bearing, constant velocity joint and e-motor greases, often of the polyurea type, which makes up about 30% of Japan's grease output. Bulky drums and pails keep trade largely regional, and import-dependent markets such as Indonesia are now drawing local plants.
Grease manufacturing process
Most grease is made in batches, and the thickener is formed inside the oil rather than bought ready-made. That in-situ reaction, and the cooling path that follows, sets the soap fiber structure that decides consistency, shear stability and oil bleed.
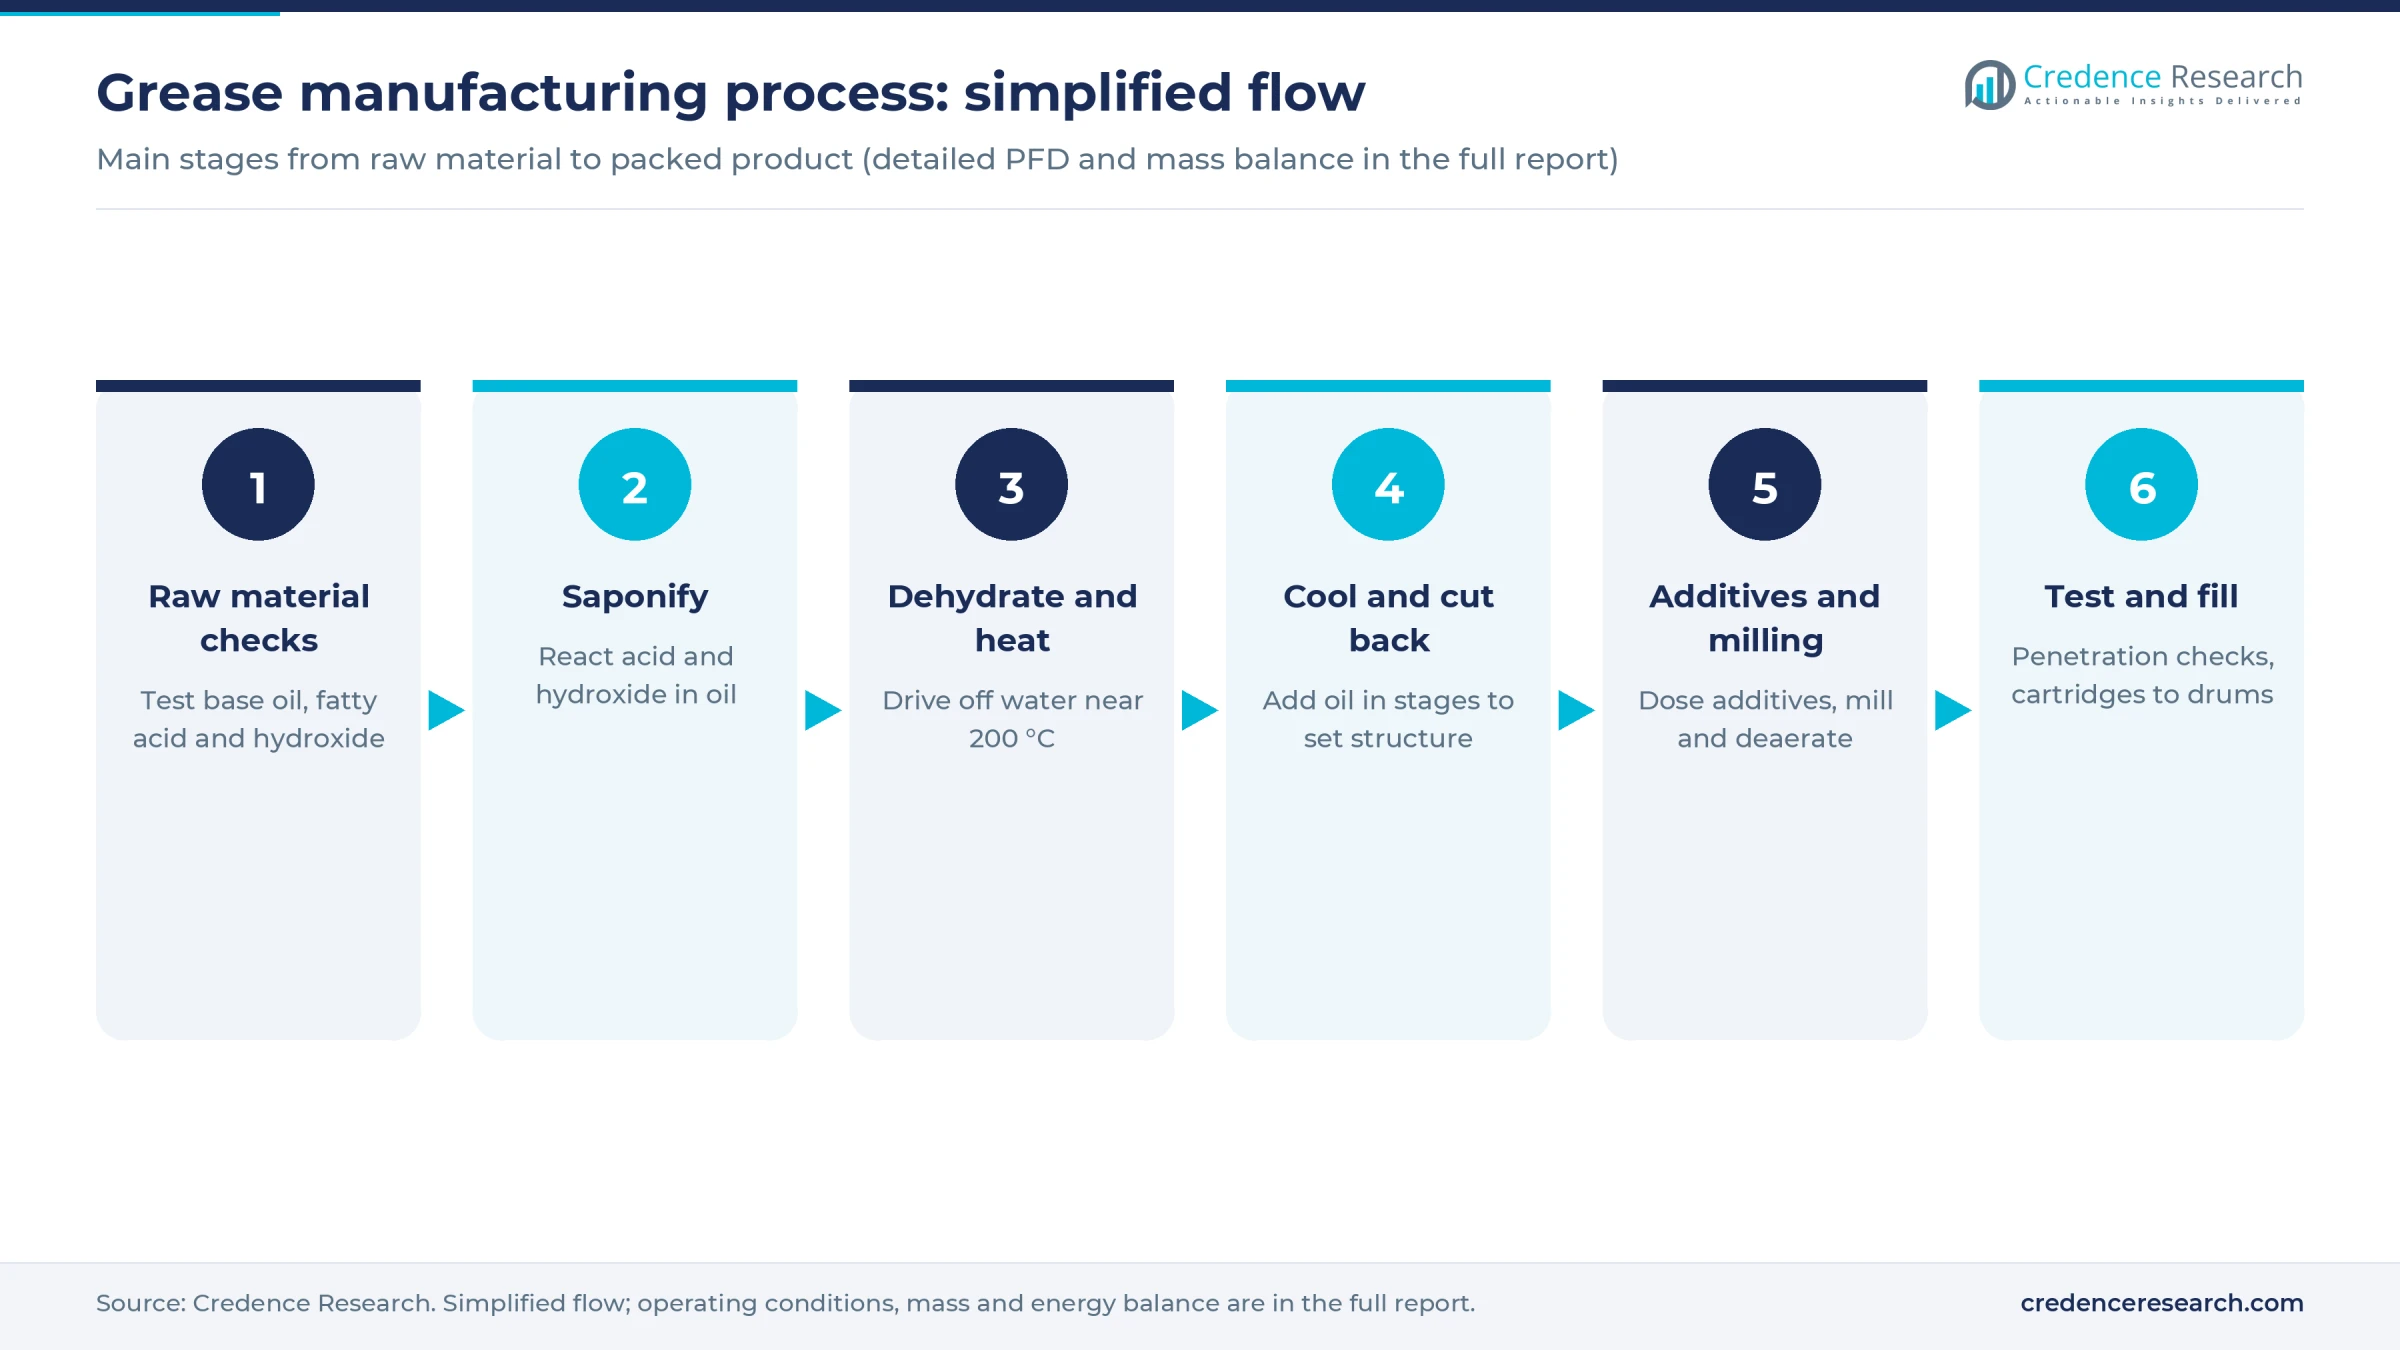
- Raw material checks. The lab tests base oil viscosity and water content, the acid value of 12-hydroxystearic acid and the assay of lithium hydroxide before anything is released to production.
- Saponification. Part of the base oil and the fatty acid are charged to a jacketed kettle or pressurized contactor and heated to about 80–95 degrees Celsius. A lithium hydroxide solution is added, and the acid and alkali react to form lithium soap. For lithium complex grease, a second acid such as azelaic or sebacic acid is reacted to build the complex.
- Dehydration and top temperature. The batch is heated to about 195–210 degrees Celsius, driving off water and melting the soap into the oil. Contactors shorten this step because they run under pressure with high heat transfer.
- Cooling and cut-back. The remaining base oil is added in controlled stages while the batch cools. Cooling rate governs soap crystallization, so a fast quench and a slow cool give different products from the same recipe.
- Additives and milling. Below about 100 degrees Celsius, extreme pressure, antioxidant, rust and tackiness additives go in. The grease then passes through a colloid mill or homogenizer, a deaerator and a strainer.
- Testing and filling. Cone penetration under ASTM D217, dropping point, water washout and four-ball tests confirm the grade. Approved batches are filled into 400 gram cartridges, tubes, pails, kegs and drums.
An open-kettle batch often runs a full shift or longer, while a contactor finishes much faster, so capacity planning starts with the soap reactor. Calcium sulfonate and polyurea greases follow other chemistry. The first converts overbased sulfonate with water and promoters, and the second reacts isocyanates with amines, which adds handling and safety steps.
Grease plant setup cost
The indicative build is a 10,000 tonne a year plant, about 33 tonnes a day over 300 days, with one contactor and two open kettles so it can make lithium, lithium complex and calcium-based greases. Fixed CapEx comes to about USD 5–8.5 million at an Asian industrial park and an assumed USD 12–20 million at a U.S. or EU site, where buildings, automation and permitting cost more. Working capital of about USD 3–4 million is excluded, and the full report can be recast for any country.
Disclosed grease projects anchor this estimated range. Vietnam's Top Solutions began work on a USD 5.5 million grease plant in Ninh Thuan province in March 2024, planned at about 9,500 tonnes a year over two phases, which scales to about USD 5.7 million at 10,000 tonnes using the six-tenths rule. A Sharjah plant built for AED 50 million, about USD 13.6 million, to make 50 million liters of lubricants and grease scales to about USD 5.5 million at grease-plant size, though that site also blends oils. At the top end, FUCHS invested EUR 25 million at Kaiserslautern, Germany, for a fully automated polyurea grease plant opened in 2021, which shows why European specialty builds land in the higher range.
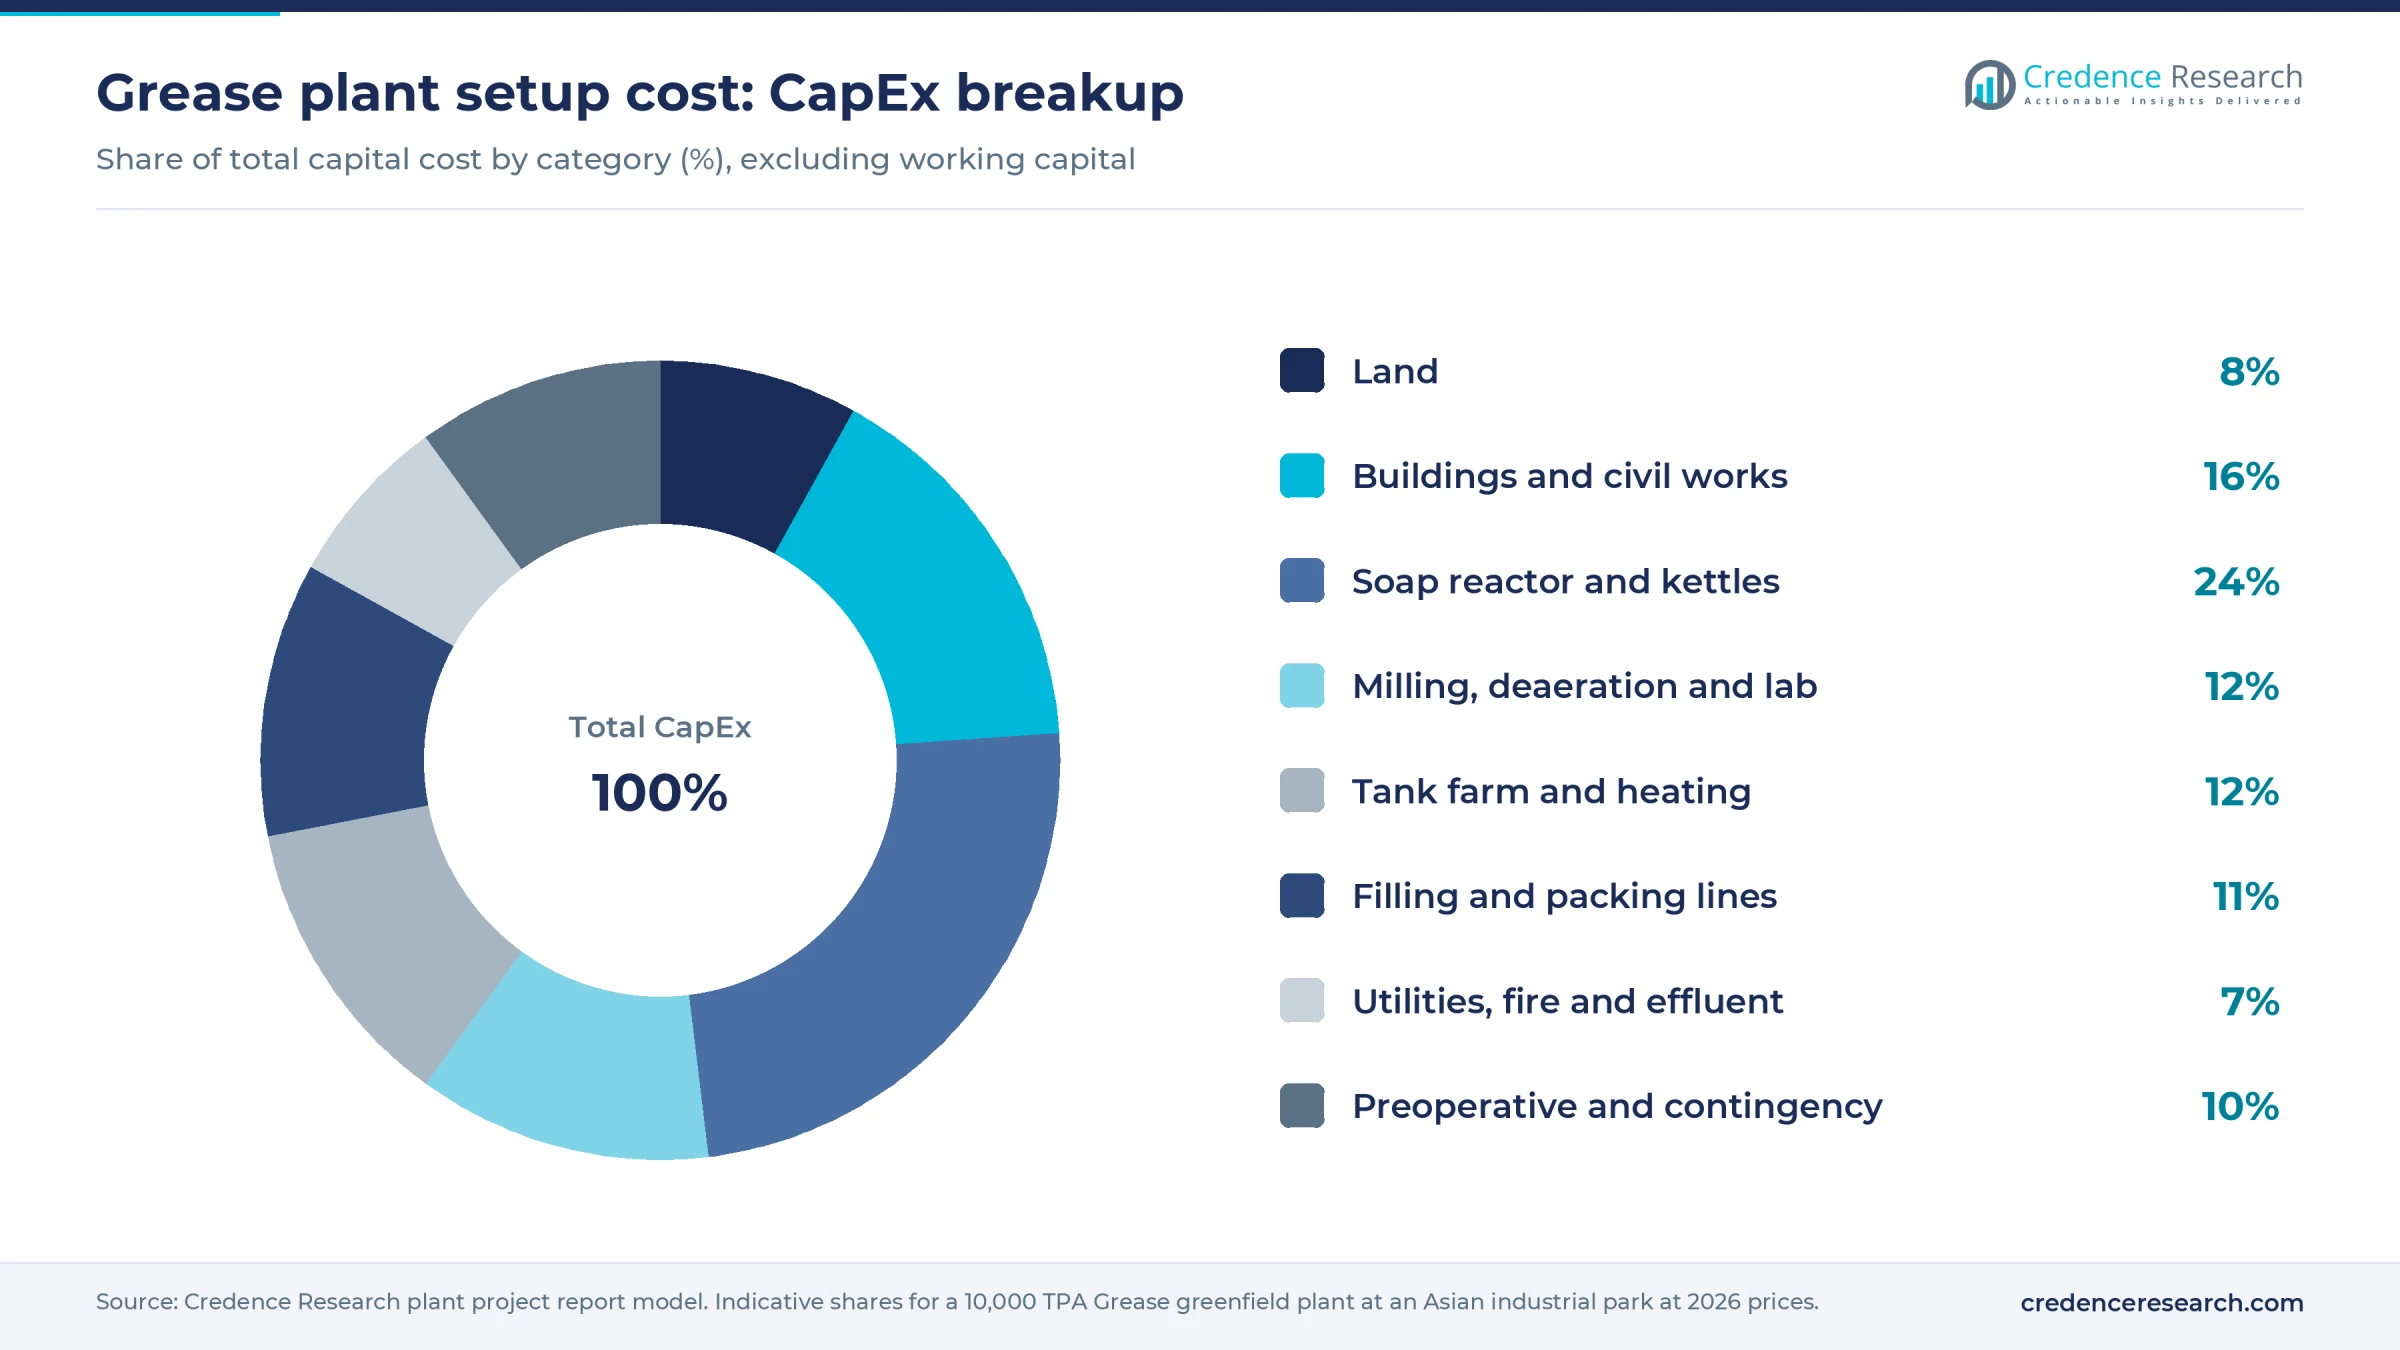
Land shows how each row was built. At an assumed USD 40–55 per square meter, a 12,000 square meter plot costs about USD 480,000–660,000, or about 8% of CapEx at the midpoint. The soap reactor and finishing kettles take the largest share, about 24%, followed by buildings at 16%. U.S. rural land can cost less, but construction and labor cost more, so shares swing by location.
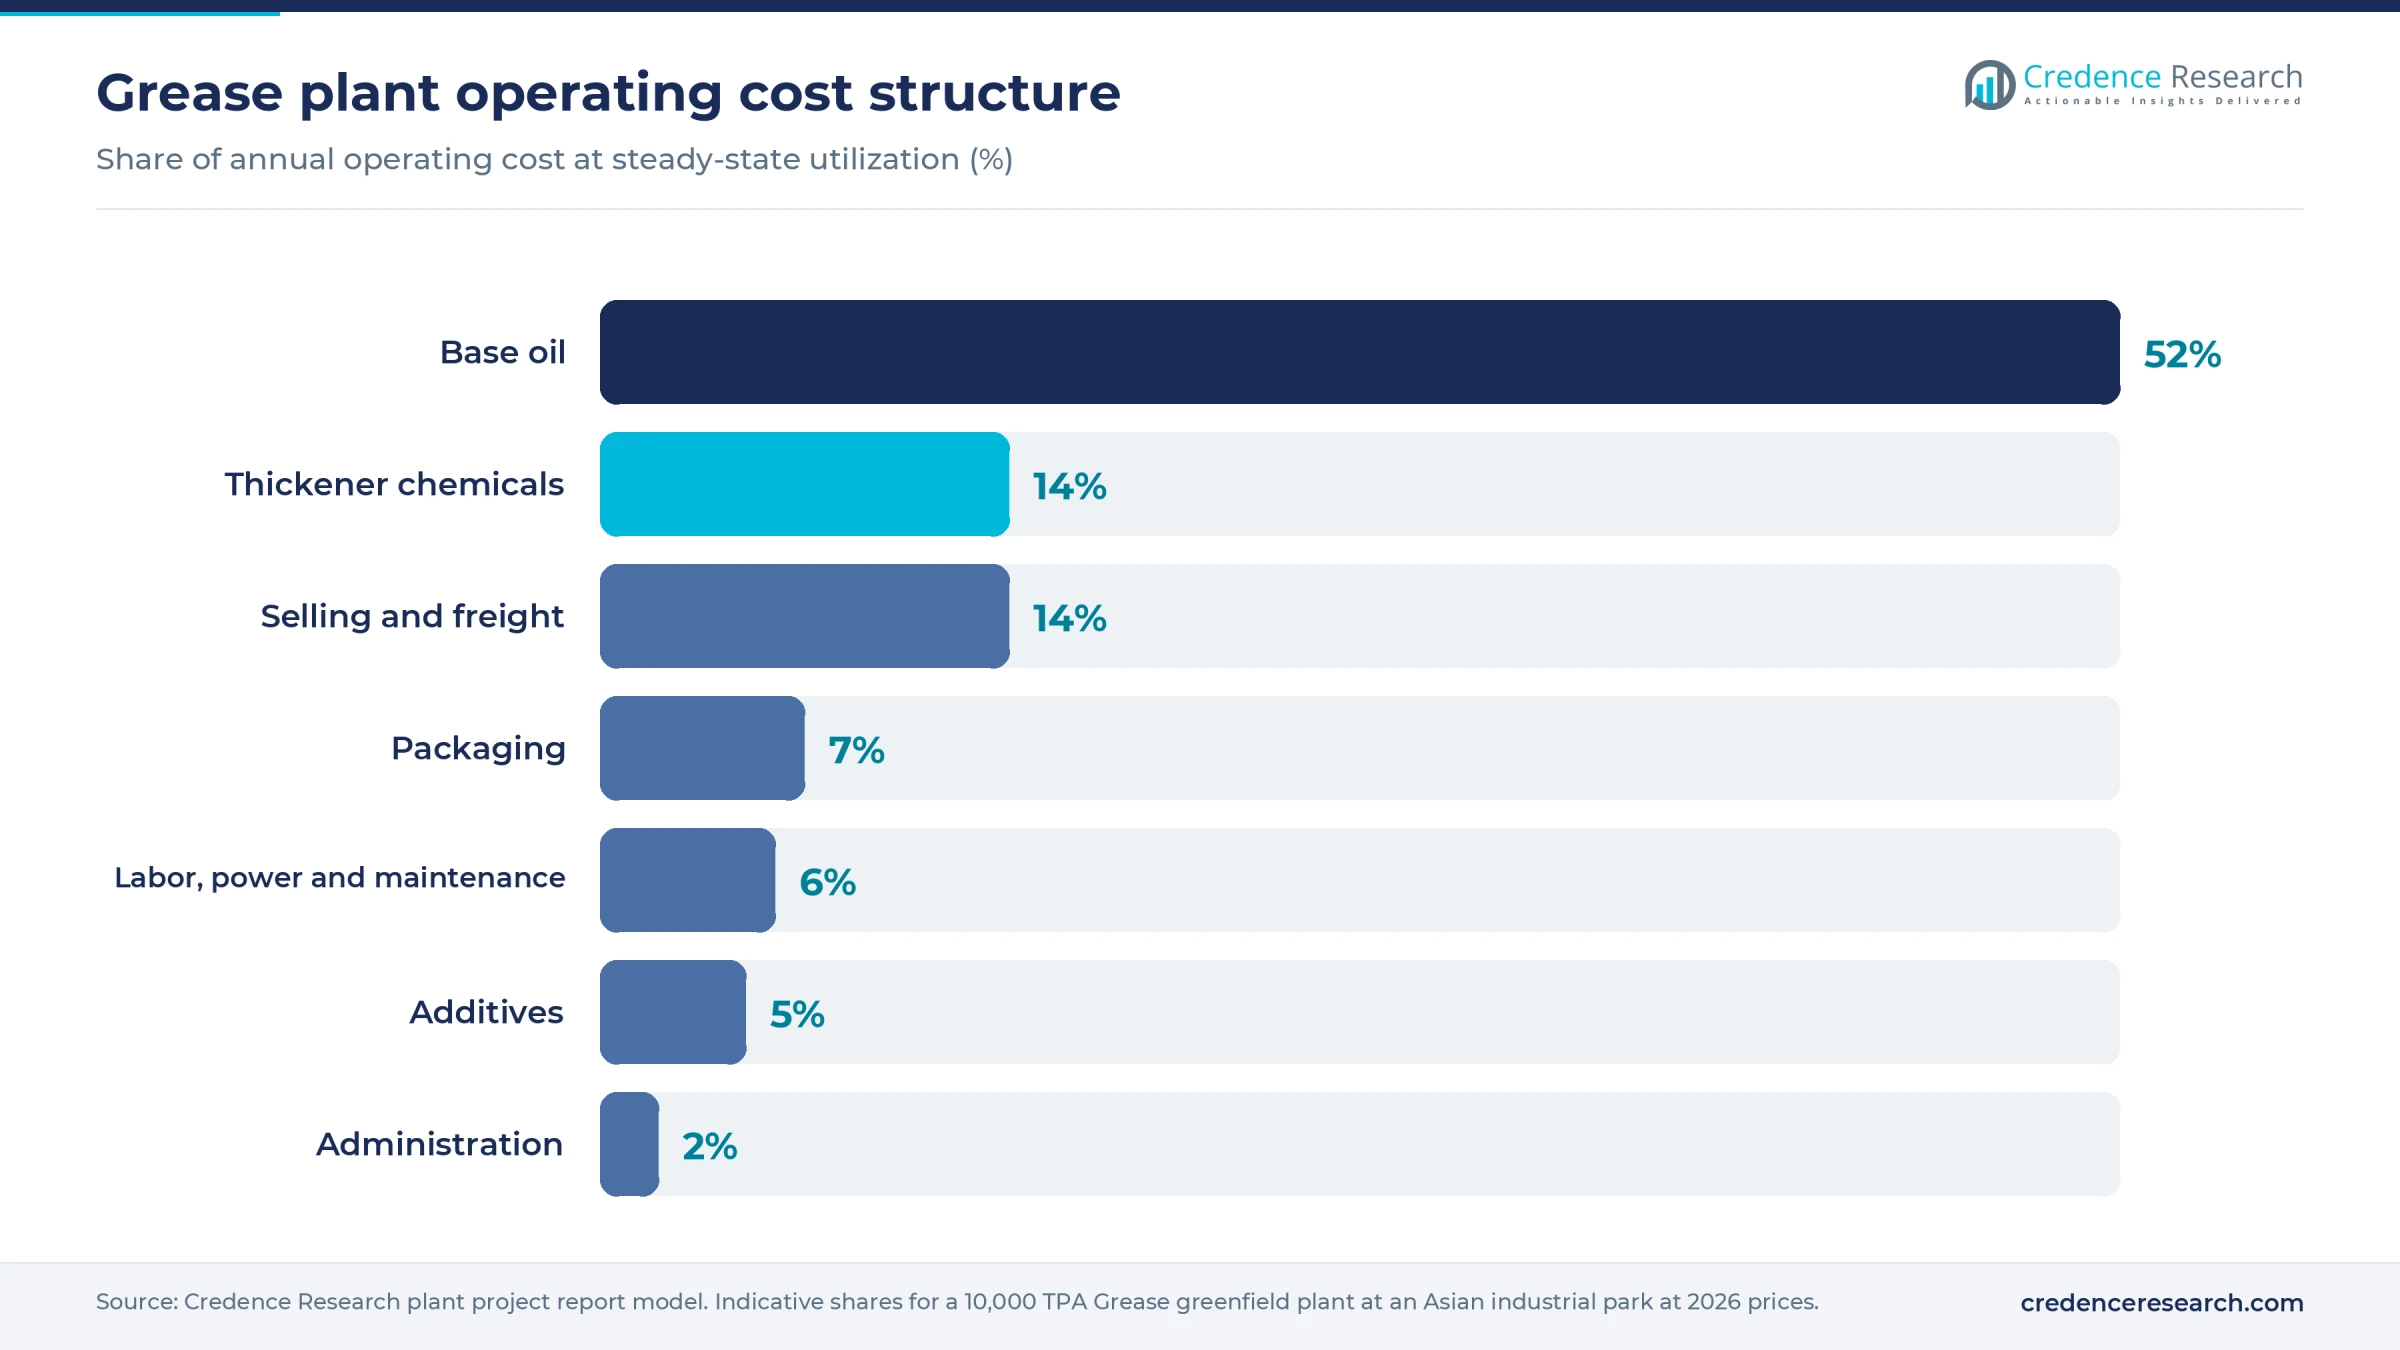
Base oil takes about half of total cash cost and thickener chemicals about 14%. Each USD 100 per tonne change in base oil moves cost by about USD 85 per tonne of grease, or roughly 3 margin points at the midpoint price.
Machinery and raw materials for a grease plant
The core equipment is a pressurized contactor reactor or jacketed open kettles with counter-rotating scraper agitators, finishing kettles, and a thermal oil heater able to run well above 200 degrees Celsius. Supporting units include a lithium hydroxide dissolving tank, a fatty acid melting tank, gear pumps, a colloid mill or high-pressure homogenizer, a vacuum deaerator, in-line strainers, base oil and finished product tanks, and a vent scrubber for odor. Filling lines cover cartridges, pails, kegs and drums. The lab needs a cone penetrometer, dropping point apparatus, roll stability tester, water washout tester and four-ball machine.
Heavy base oils such as SN500, bright stock and naphthenic grades come mainly from Group I refineries in Asia, the Middle East, Europe and the U.S., a supply pool that shrinks as older Group I units close. 12-hydroxystearic acid is made by hydrogenating castor oil, and India dominates castor supply, so a weak castor crop there can lift fatty acid prices worldwide. Lithium hydroxide is refined mostly in China from Australian spodumene and South American brine, which ties grease costs to the battery-driven lithium hydroxide market. Calcium hydroxide is available locally almost everywhere, while sulfonates, polyurea precursors and additive packages come from a small group of chemical makers in the U.S., Europe, Japan and China.
Grease business profit margin and ROI
Product mix matters more than volume. Commodity lithium EP2 grease in drums and pails competes on price, while lithium complex, calcium sulfonate, polyurea and food-grade greases earn higher prices for the same kettle time. The model uses an assumed net selling price of USD 2,300–3,000 per tonne for a mixed industrial and automotive range, with assumed base oil of USD 1,250–1,600 per tonne, assumed 12-hydroxystearic acid of USD 2,000–2,600 per tonne and assumed lithium hydroxide of USD 10,000–15,000 per tonne.
On that basis, gross margin runs about 18–28%, with about 26% at the midpoint of price and cost. Lithium hydroxide is only about 1–1.5% of the formula by weight, yet a tenfold spike like the one from 2020 to 2022 would erase most of that margin, which is why many plants now keep calcium-based recipes ready.
At 80% utilization and the midpoint margin, the plant generates about USD 2 million a year in post-tax cash profit after selling and overhead costs. On CapEx plus a working capital margin of about USD 0.9 million, payback falls at about 3–5 years. If margin slides toward 18%, payback stretches past 7 years.
| Financial metric | Status |
|---|---|
| IRR | Available in report |
| NPV | Available in report |
| ROI | Available in report |
| DSCR | Available in report |
How to start a grease business, licenses and approvals
Every grease plant needs business and tax registration, zoning and building permits, an environmental permit covering heater emissions, odor, oily wastewater and spills, fire and occupational safety approval for hot oil and caustic handling, and chemical inventory compliance for base oils, thickeners and additives. Each product needs a safety data sheet and hazard label, and export or import registration applies to traded grease. Food-grade and automotive greases add product certification, which many buyers treat as a condition of purchase.
| Market | Key approvals for grease |
|---|---|
| United States | EPA spill prevention, control and countermeasure plan under 40 CFR Part 112 for oil storage above the threshold; TSCA inventory compliance; OSHA Hazard Communication Standard, 29 CFR 1910.1200, for safety data sheets and labels; state air permit; voluntary NSF H1 registration for incidental food contact and NLGI certification for automotive greases |
| European Union | REACH registration for substances made or imported above one tonne a year and downstream user duties for formulators; CLP classification and labeling, including any harmonized classification of lithium salts; national environmental and building permits; optional EU Ecolabel for lubricants under Decision (EU) 2018/1702 for biodegradable greases |
| India | Processor license under the Lubricating Oils and greases (Processing, Supply and Distribution Regulation) Order, 1987; state pollution control board consent to establish and operate; authorization under the Hazardous and Other Wastes Rules, 2016, for oily waste and sludge; factory license; BIS standards such as IS 7623 for lithium-base grease as the usual quality reference |
Key grease manufacturers and recent developments
The global tier includes Shell, ExxonMobil, FUCHS, TotalEnergies, Chevron, Castrol and Klüber Lubrication, alongside Sinopec Great Wall and PetroChina Kunlun in China, Kyodo Yushi and Idemitsu in Japan, and Indian Oil's Servo brand. Specialist grease makers such as Axel Christiernsson, Lubrication Engineers and many regional independents compete in contract manufacturing and niche chemistries, including high-temperature greases for steel mills and kilns.
- May 2026. Lubes'N'greases reported that the European Chemicals Agency was developing a lithium classification proposal that could require hazard warnings on products above a 0.3% free lithium hydroxide threshold, a move European lubricant groups UEIL and ATIEL oppose.
- September 2026. Shell Indonesia inaugurated a 12,000 tonne a year grease plant at its Marunda lubricants complex in Bekasi, using a contact reactor to make Shell Gadus greases for mining, steel, power and other industries.
- October 2026. SKF added 125 milliliter formats of its lithium-free, calcium-based LGNL 2 grease for automatic lubricators, Kenya Engineer reported.
What's inside the Grease project report PDF
The report runs to 21 chapters. Open a chapter to see its sections.
1. Preface
2. Scope and Methodology
- 2.1 Objectives of the Study
- 2.2 Stakeholders
- 2.3 Research Methodology
- 2.4 Data Sources and Key Assumptions
3. Executive Summary
- 3.1 Market Snapshot
- 3.2 Project at a Glance (Capacity, CapEx, OpEx)
- 3.3 Key Financial Indicators (IRR, NPV, Payback, Break-even)
- 3.4 Feasibility Verdict
4. Product Overview
- 4.1 Grease Definition and Properties
- 4.2 Grades and Specifications (BIS / ISO / ASTM)
- 4.3 HS Code and Classification
- 4.4 Key Applications
- 4.5 Substitutes
5. Global Grease Market
- 5.1 Market Overview
- 5.2 Historical and Current Market Performance (Volume and Value)
- 5.3 Market Breakup by Grade / Type
- 5.4 Market Breakup by End-Use Industry
- 5.5 Market Breakup by Region
- 5.6 Market Drivers, Restraints and Trends
- 5.7 Value Chain Analysis
- 5.8 Market Forecast
6. Target Country Grease Market Analysis
- 6.1 Demand and Supply Analysis
- 6.2 Installed Capacity vs Demand Gap
- 6.3 Import Dependence
- 6.4 Demand Forecast by End-Use
7. Trade Analysis
- 7.1 Imports by Volume, Value and Country
- 7.2 Exports by Volume, Value and Country
- 7.3 Trade Balance and Opportunities
8. Price Analysis
- 8.1 Historical Grease Price Trends by Region
- 8.2 Raw Material / Feedstock Price Trends and Linkage
- 8.3 Price Forecast
- 8.4 Margins Across the Value Chain
9. Competitive Landscape
- 9.1 Market Structure
- 9.2 Key Players and Installed Capacities
- 9.3 Profiles of Key Players
- 9.4 Recent Developments (Expansions, M&A, New Plants)
10. Manufacturing Process and Technology
- 10.1 Comparison of Technology Routes
- 10.2 Selected Route and Process Flow Diagram
- 10.3 Unit Operations Involved
- 10.4 Chemical Reactions Involved
- 10.5 Mass Balance and Raw Material Requirements
- 10.6 Energy Balance
- 10.7 Quality Assurance Criteria and Technical Tests
- 10.8 By-products and Waste Handling
- 10.9 Technology Licensors / Providers
11. Project Details, Requirements and Costs
- 11.1 Land, Location and Site Development
- 11.1.1 Site Selection Criteria
- 11.1.2 Location Analysis
- 11.1.3 Land Requirement and Costs
- 11.1.4 Site Development Costs
- 11.2 Plant Layout
- 11.2.1 Layout Principles
- 11.2.2 Proposed Layout
- 11.2.3 Factors Influencing Layout
- 11.3 Civil Works and Buildings
- 11.4 Plant Machinery
- 11.4.1 Machinery Requirements and Specifications
- 11.4.2 Machinery Costs
- 11.4.3 Machinery Suppliers
- 11.5 Raw Materials
- 11.5.1 Requirements per Tonne of Output
- 11.5.2 Procurement and Sourcing
- 11.5.3 Costs
- 11.5.4 Suppliers
- 11.6 Packaging
- 11.6.1 Packaging Requirements
- 11.6.2 Packaging Costs
- 11.6.3 Packaging Suppliers
- 11.7 Storage and Material Handling
- 11.8 Transportation Requirements and Costs
- 11.9 Utilities
- 11.9.1 Power Requirements and Costs
- 11.9.2 Water Requirements and Costs
- 11.9.3 Steam, Fuel and Other Utilities
- 11.10 Manpower Requirements and Wages
12. Environment, Health, Safety and Sustainability
- 12.1 Effluent and Emissions Management
- 12.2 Hazard Classification and Safety Measures
- 12.3 Carbon Footprint
- 12.4 Green / Low-Carbon Process Options
13. Regulatory Procedures, Approvals and Certifications
- 13.1 Licences and Registrations
- 13.2 Environmental Clearances
- 13.3 Product Certifications (BIS, REACH, etc.)
- 13.4 Approval Timeline
14. Project Implementation Schedule
15. Project Economics
- 15.1 Capital Cost of the Project
- 15.2 Techno-Economic Parameters
- 15.3 Capacity Utilization and Ramp-up
- 15.4 Product Pricing and Margins
- 15.5 Income Projections
- 15.6 Expenditure Projections
- 15.7 Working Capital Requirement
- 15.8 Taxation
- 15.9 Depreciation
16. Financial Analysis
- 16.1 Projected Profit and Loss Account
- 16.2 Projected Cash Flow Statement
- 16.3 Projected Balance Sheet
- 16.4 Liquidity Analysis
- 16.5 Profitability Analysis (Payback, NPV, IRR, ROI)
- 16.6 Break-even Analysis
- 16.7 Debt Service Coverage Ratio (DSCR)
- 16.8 Sensitivity Analysis
- 16.9 Scenario and Uncertainty Analysis
17. Funding and Incentives
- 17.1 Means of Finance and Debt-Equity Structure
- 17.2 Loans and Financial Assistance
- 17.3 Government Schemes and Subsidies (PLI, State Policies)
18. Risk Assessment
- 18.1 Key Success Factors
- 18.2 Key Risk Factors
- 18.3 Risk Mitigation
19. Strategic Recommendations
20. Case Study of a Successful Venture
21. Appendix
- 21.1 Detailed Assumptions
- 21.2 Abbreviations
- 21.3 List of Tables and Figures
- 21.4 Sources
This page vs. the full report
| Data point | On this page (free) | In the full report |
|---|---|---|
| Total CapEx | One rounded range at one capacity | Exact figure at three capacities with a line-item breakup |
| CapEx breakup | Category shares (%) only | Cost, quantity and supplier for every machine |
| Operating cost | Share of raw materials, utilities and labor | Per-unit cost sheet with each input price and consumption |
| Profitability | Gross margin range and payback band | Exact IRR, NPV, ROI, break-even and DSCR |
| Financial statements | List of what is included | 10-year P&L, cash flow, balance sheet and Excel model |
| Sensitivity | One directional line | Full sensitivity and scenario tables |
| Process | Simplified flow diagram | Detailed process flow, mass and energy balance, operating conditions |
| Machinery | Names of the main machines | Specifications, capacity, cost and supplier list |
| Market | Headline size, growth and global demand | Segment, region, trade and price forecast tables |
| Suppliers and buyers | Supplier types and sourcing hubs | Named suppliers and buyers |
Grease project report: FAQs
How much does it cost to set up a grease plant?
What raw materials are used to make grease?
What is the profit margin in grease manufacturing?
How long does a grease plant take to pay back?
Why are grease makers moving away from lithium?
Which HS code covers lubricating grease?
What licenses does a grease plant need?

About the analyst
Nisha Gupta, Senior Research Analyst
Nisha Gupta is a Senior Research Analyst at Credence Research Inc. who works across industry domains, including packaging, automotive parts and machinery. Her focus is the modelling engine behind each study: she builds quantitative market databases and econometric forecasting frameworks, and developed automated Excel-based market modelling templates that cut client turnaround time by 30%.
Related market research
- Grease Market Size, Growth, Share and Forecast 2032
- Polyurea Grease Market Size, Growth, Trends and Forecast 2032
- High-Temperature Grease and Lubricants Market Size and Share 2032
- Lithium Hydroxide Market Size, Share, Growth and Forecast 2032
- Naphthenic Base Oil Market Size, Growth & Forecast to 2032
- Marine Grease Market Size, Growth, Share and Forecast 2032
More plant project reports
- Recycled Plastic Manufacturing Plant Project Report (DPR) 2026
- Glycerin Manufacturing Plant Project Report (DPR) 2026
- Naphthalene Balls Manufacturing Plant Project Report (DPR) 2026
- Formaldehyde Manufacturing Plant Project Report (DPR) 2026
- Sulfuric Acid Manufacturing Plant Project Report (DPR) 2026
- Engine Oil Manufacturing Plant Project Report (DPR) 2026