
Quick answer
A recycled plastic plant sorts, grinds and washes post-consumer bottles into rPET flake and rHDPE pellets by mechanical recycling. A greenfield unit processing about 30,000 metric tons a year of mixed PET and HDPE bottle bales needs an estimated USD 18–36 million of CapEx. Baled feedstock is roughly half of operating cost, and gross margin is estimated at 18–30%. Payback is about 7–14 years at mid-range CapEx, shorter with contracted bales and a low-cost site.
Viable where bale supply is contracted and recycled-content mandates secure offtake, but exposed to cheap virgin resin; merchant plants without feedstock control carry high risk.
Recycled Plastic plant: key highlights
| Parameter | Indicative value | Note |
|---|---|---|
| Plant capacity | About 30,000 metric tons of bales per year | 70% PET and 30% HDPE bottle bales, about 22,000 metric tons of output |
| Total CapEx | USD 18–36 million | Greenfield; low end reflects Asian parks, top end U.S. or EU sites |
| Raw material share of operating cost | 45–60% | Baled post-consumer bottles; varies widely by region |
| Gross margin | 18–30% | Price minus bales and direct conversion cost |
| Payback period | 7–14 years | 85% utilization, mid-range CapEx; shorter with contracted feedstock |
| IRR | Available in report | Post-tax, 10-year model |
| Break-even | Available in report | Capacity utilization basis |
Ranges assume a greenfield mechanical recycling plant taking about 30,000 metric tons a year of post-consumer bottle bales (70% PET, 30% HDPE), Asian to U.S. or EU sites, 2026 prices, 85% utilization, assumed bale costs of USD 150–450 per metric ton and assumed product prices of USD 650–1,150; CapEx scaled from disclosed plants at USD 1 = AED 3.6725, EUR 1 = USD 1.08 and GBP 1 = USD 1.30–1.34. Customizable to any country.
What is recycled plastic?
Recycled plastic, in the sense used here, is resin recovered by mechanical recycling: used packaging is sorted, ground, washed and either sold as clean flake or melted into pellets, without breaking the polymer down chemically. The three workhorse grades are rPET from bottles and trays, rHDPE from milk, detergent and shampoo bottles, and rPP from caps, tubs and crates. This page models one representative feedstock mix, baled post-consumer bottles at about 70% PET and 30% HDPE, the stream collection systems deliver in the largest volume.
Output quality decides who buys: hot-washed rPET flake goes into polyester fiber, strapping and sheet, or through a decontamination step into food-contact bottles. Colored rHDPE pellets end up in pipe, crates, pallets and non-food bottles, while natural rHDPE earns a premium in household packaging.
HS heading 3915 covers plastic waste and scrap, with subheading 3915.10 for polyethylene and 3915.90 for other plastics, including PET; washed flake is usually declared there, though some customs authorities treat high-purity flake differently. Pellets made from recycled resin are polymers in primary forms and take the polymer's own Chapter 39 code, such as 3901.20 for HDPE or 3907.61 and 3907.69 for PET, so trade statistics never isolate recycled pellets from virgin resin.
Recycled plastic market overview and global demand
The global recycled plastics market is worth about USD 61.1 billion in 2025, based on Credence Research's estimate of USD 55.6 billion for 2024 and a 9.94% CAGR through 2032. The narrower recycled granules segment is about USD 28.9 billion in 2025, derived from USD 26.6 billion for 2024 and an 8.65% CAGR.
Physical volumes show how much headroom remains. Industry association Plastics Europe reported world plastics production of 430.9 million metric tons in 2024 and 41.2 million metric tons of mechanically recycled post-consumer plastics, under a tenth of output. In the European Union, recycled post-consumer plastics reached about 7.7 million metric tons, roughly 14% of production.
Scrap trade is a fraction of what it was before China closed its border to plastic waste imports in 2018. UN Comtrade data for HS 3915 show 2024 exports of about USD 3.0 billion among reporting countries, led by Germany at USD 316 million, Japan at USD 301 million, the United States at USD 264 million and the Netherlands at USD 235 million. Malaysia, Turkey and Indonesia rank among the largest buyers of polyethylene scrap.
Demand is largely policy-led: brand owners buy recycled resin to meet recycled-content targets in the EU, India and several U.S. states, yet cheap virgin resin in 2025 and 2026 pulled recycled prices down and shut plants. A Bureau of International Recycling report in early 2026 cited about 1 million metric tons of European recycling capacity lost over three years. The gap between mandate-driven demand and spot economics is the main risk for a new entrant.
Recycled plastic manufacturing process
A bottle-bale plant runs two linked lines after a shared front end. PET and HDPE are split early because they need different wash conditions, and in this model only the polyolefin stream is pelletized.
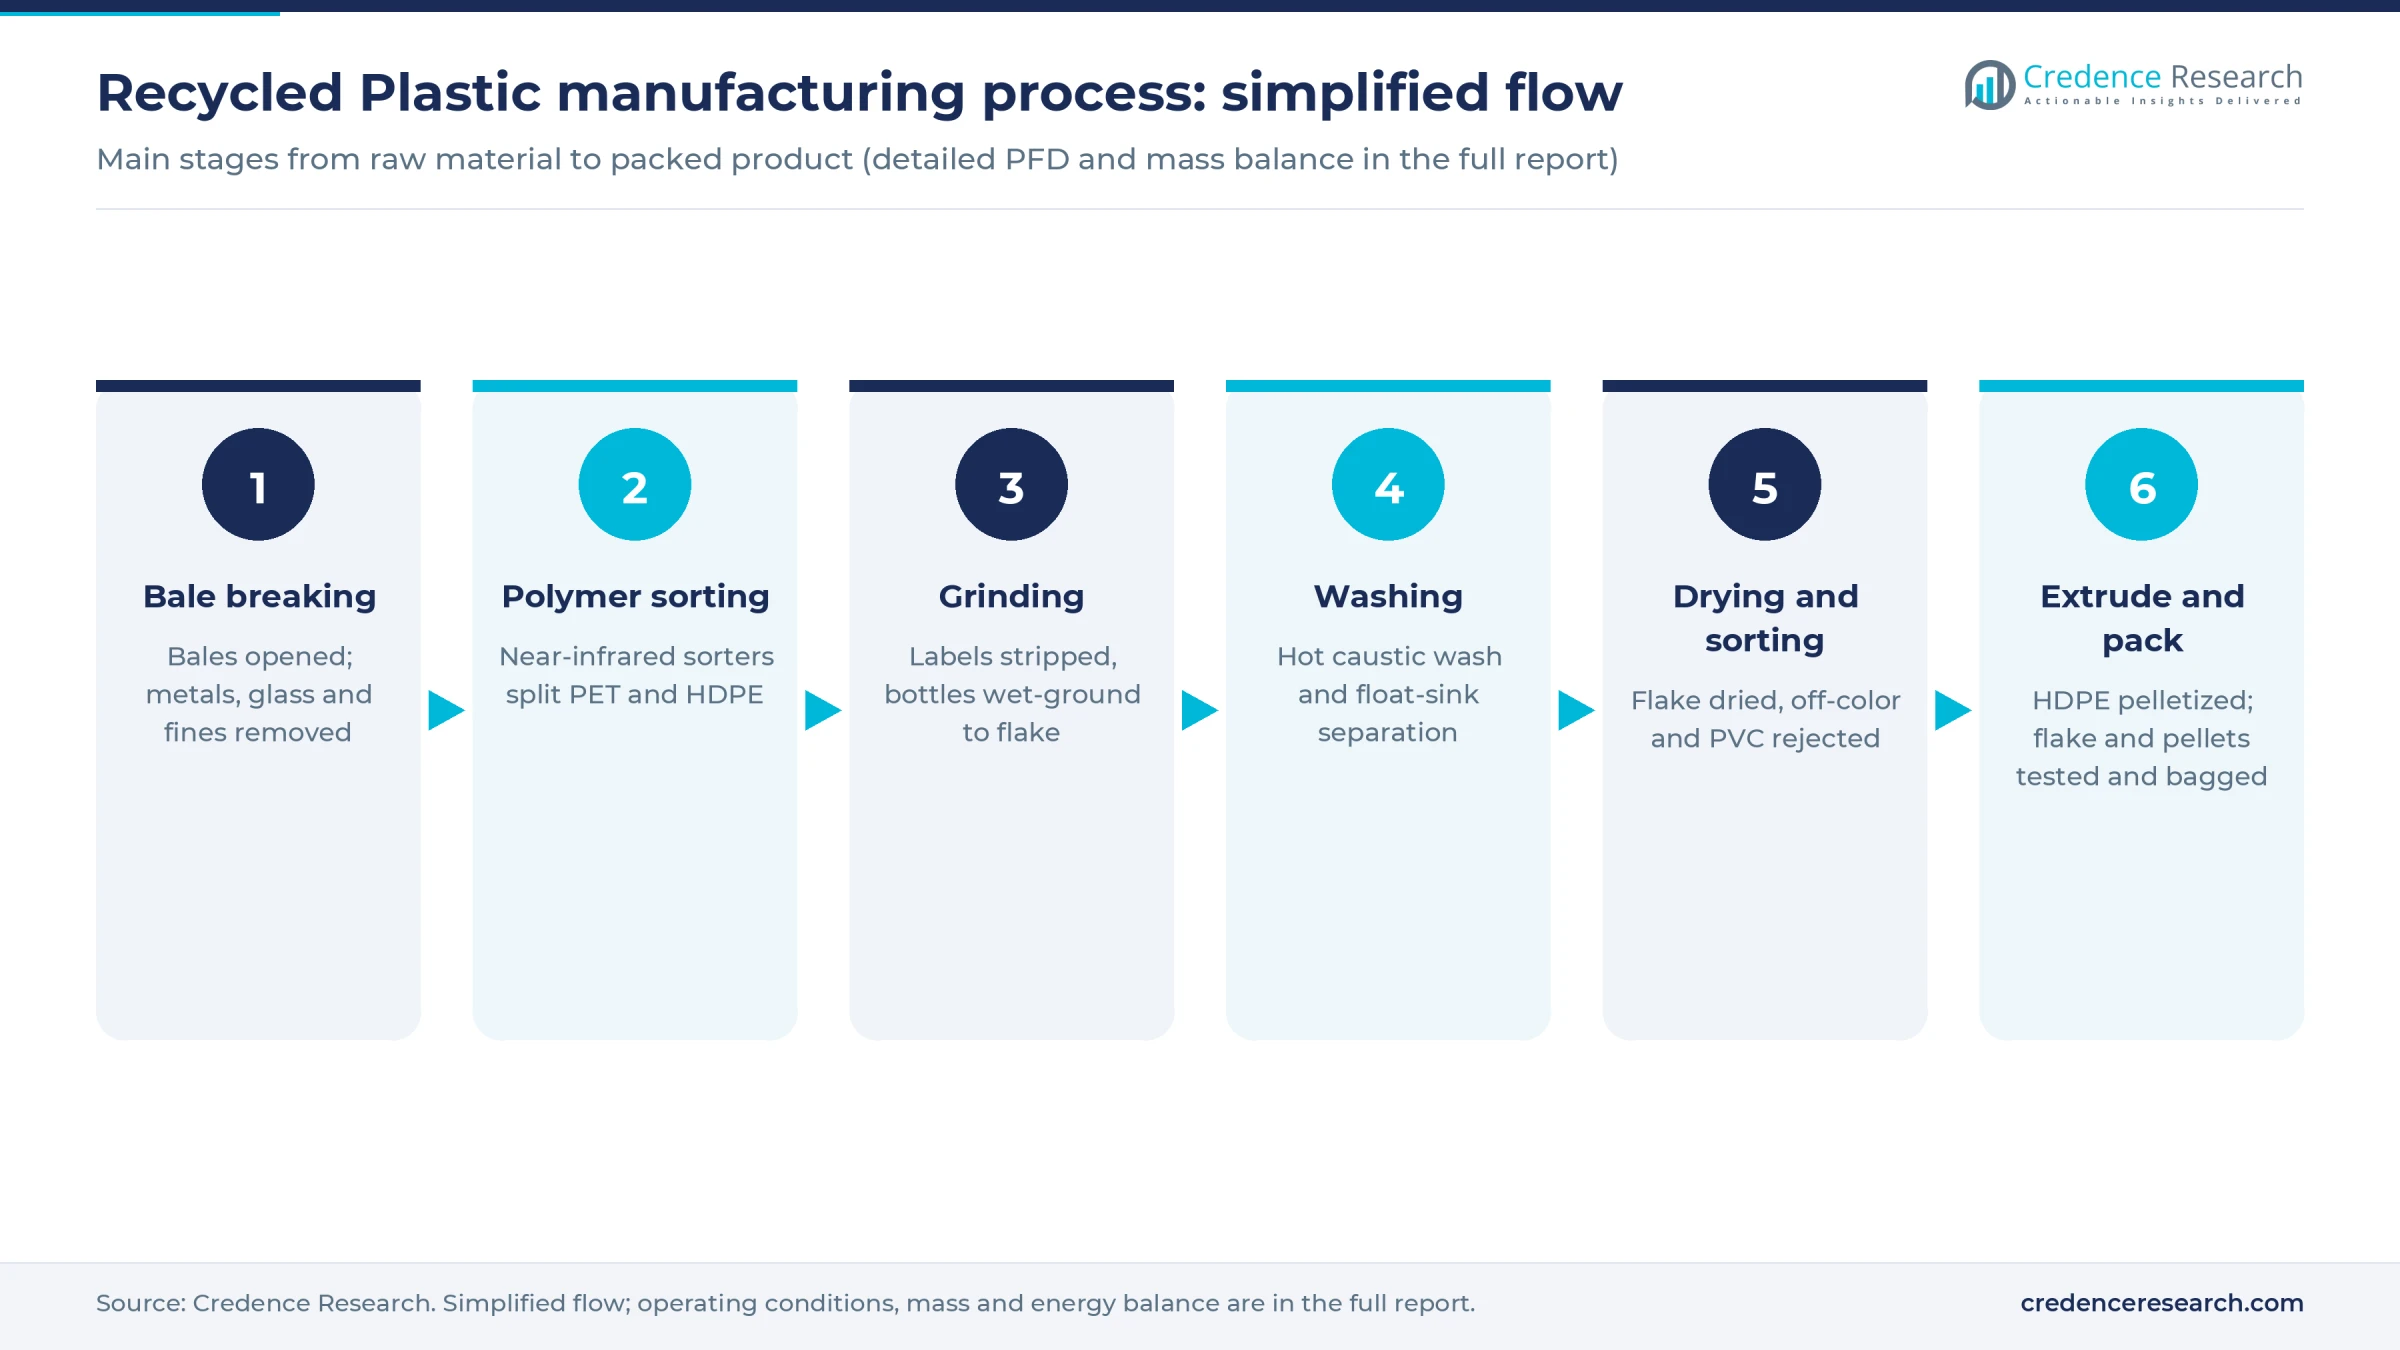
- Bale breaking and presorting. Bales are opened, then trommels remove fines and glass, magnets and eddy-current separators pull out metals, and near-infrared sorters divide PET from HDPE, PVC and other polymers.
- Label removal and grinding. PET bottles pass through a delabeler that strips shrink sleeves, then wet granulators cut them into flakes of about 10–14 mm.
- Washing and density separation. PET flake goes through a hot caustic wash at about 80–90 degrees Celsius to remove glue, food residue and odor, followed by friction washers and rinsing. In float-sink tanks PET sinks, while polyolefin caps and labels float off for separate sale. HDPE gets a cold or warm friction wash.
- Drying and flake sorting. Mechanical and thermal dryers bring moisture down, then flake sorters reject off-color, metal and PVC particles, the contaminant that buyers test for most closely.
- Extrusion and pelletizing. HDPE flake is melted in a recycling extruder with continuous melt filtration and vacuum degassing, cut into pellets under water and dried. Some plants also pelletize PET or add solid-state decontamination for food contact.
- Testing and bagging. The lab checks intrinsic viscosity, melt flow, moisture, color and contamination levels before product leaves in big bags or bulk trucks.
Yield is the number to watch. A PET bottle bale typically returns about 70–75% as clean flake and an HDPE bale about 75–80% as pellets; the rest is caps, labels, dirt, moisture and sludge. Each point of yield lost drops straight off margin, which is why bale specifications and supplier audits matter as much as machine choice.
Recycled plastic plant setup cost
The reference plant processes about 30,000 metric tons a year of baled post-consumer bottles, 70% PET and 30% HDPE, over about 7,500 operating hours, or 4 metric tons an hour. At typical yields it produces about 15,000 metric tons of hot-washed rPET flake and 7,000 metric tons of rHDPE pellets. Total CapEx is estimated at USD 18–36 million, covering land, buildings, sorting, washing and extrusion lines, water treatment, preoperative costs and a working capital margin.
The range is scaled from disclosed projects. An investment profile from the UAE Ministry of Industry and Advanced Technology puts a 22,000 metric ton a year PET-to-pellet facility at AED 101 million, about USD 27.5 million. Biffa's Seaham bottle plant in England, sized for 57,000 metric tons of PET a year, cost GBP 27.5 million, and ALPLA put about EUR 60 million into a food-grade rPET plant in South Africa that opened in October 2024. Scaled to 30,000 metric tons with a 0.6 exponent, they imply about USD 24–43 million for food-grade plants. A non-food flake line costs less, and Vietnam's DPEC spent USD 6.2 million on a 20,000 metric ton first phase in 2026, a marker for low-cost Asian builds.
For the land row, bale storage, the process hall, water treatment and truck access need about 25,000 square meters. At an assumed USD 20–120 per square meter, land costs USD 0.5–3.0 million, close to 6% of CapEx at the midpoint; Asian industrial parks sit at the low end and U.S. or EU sites at the top.
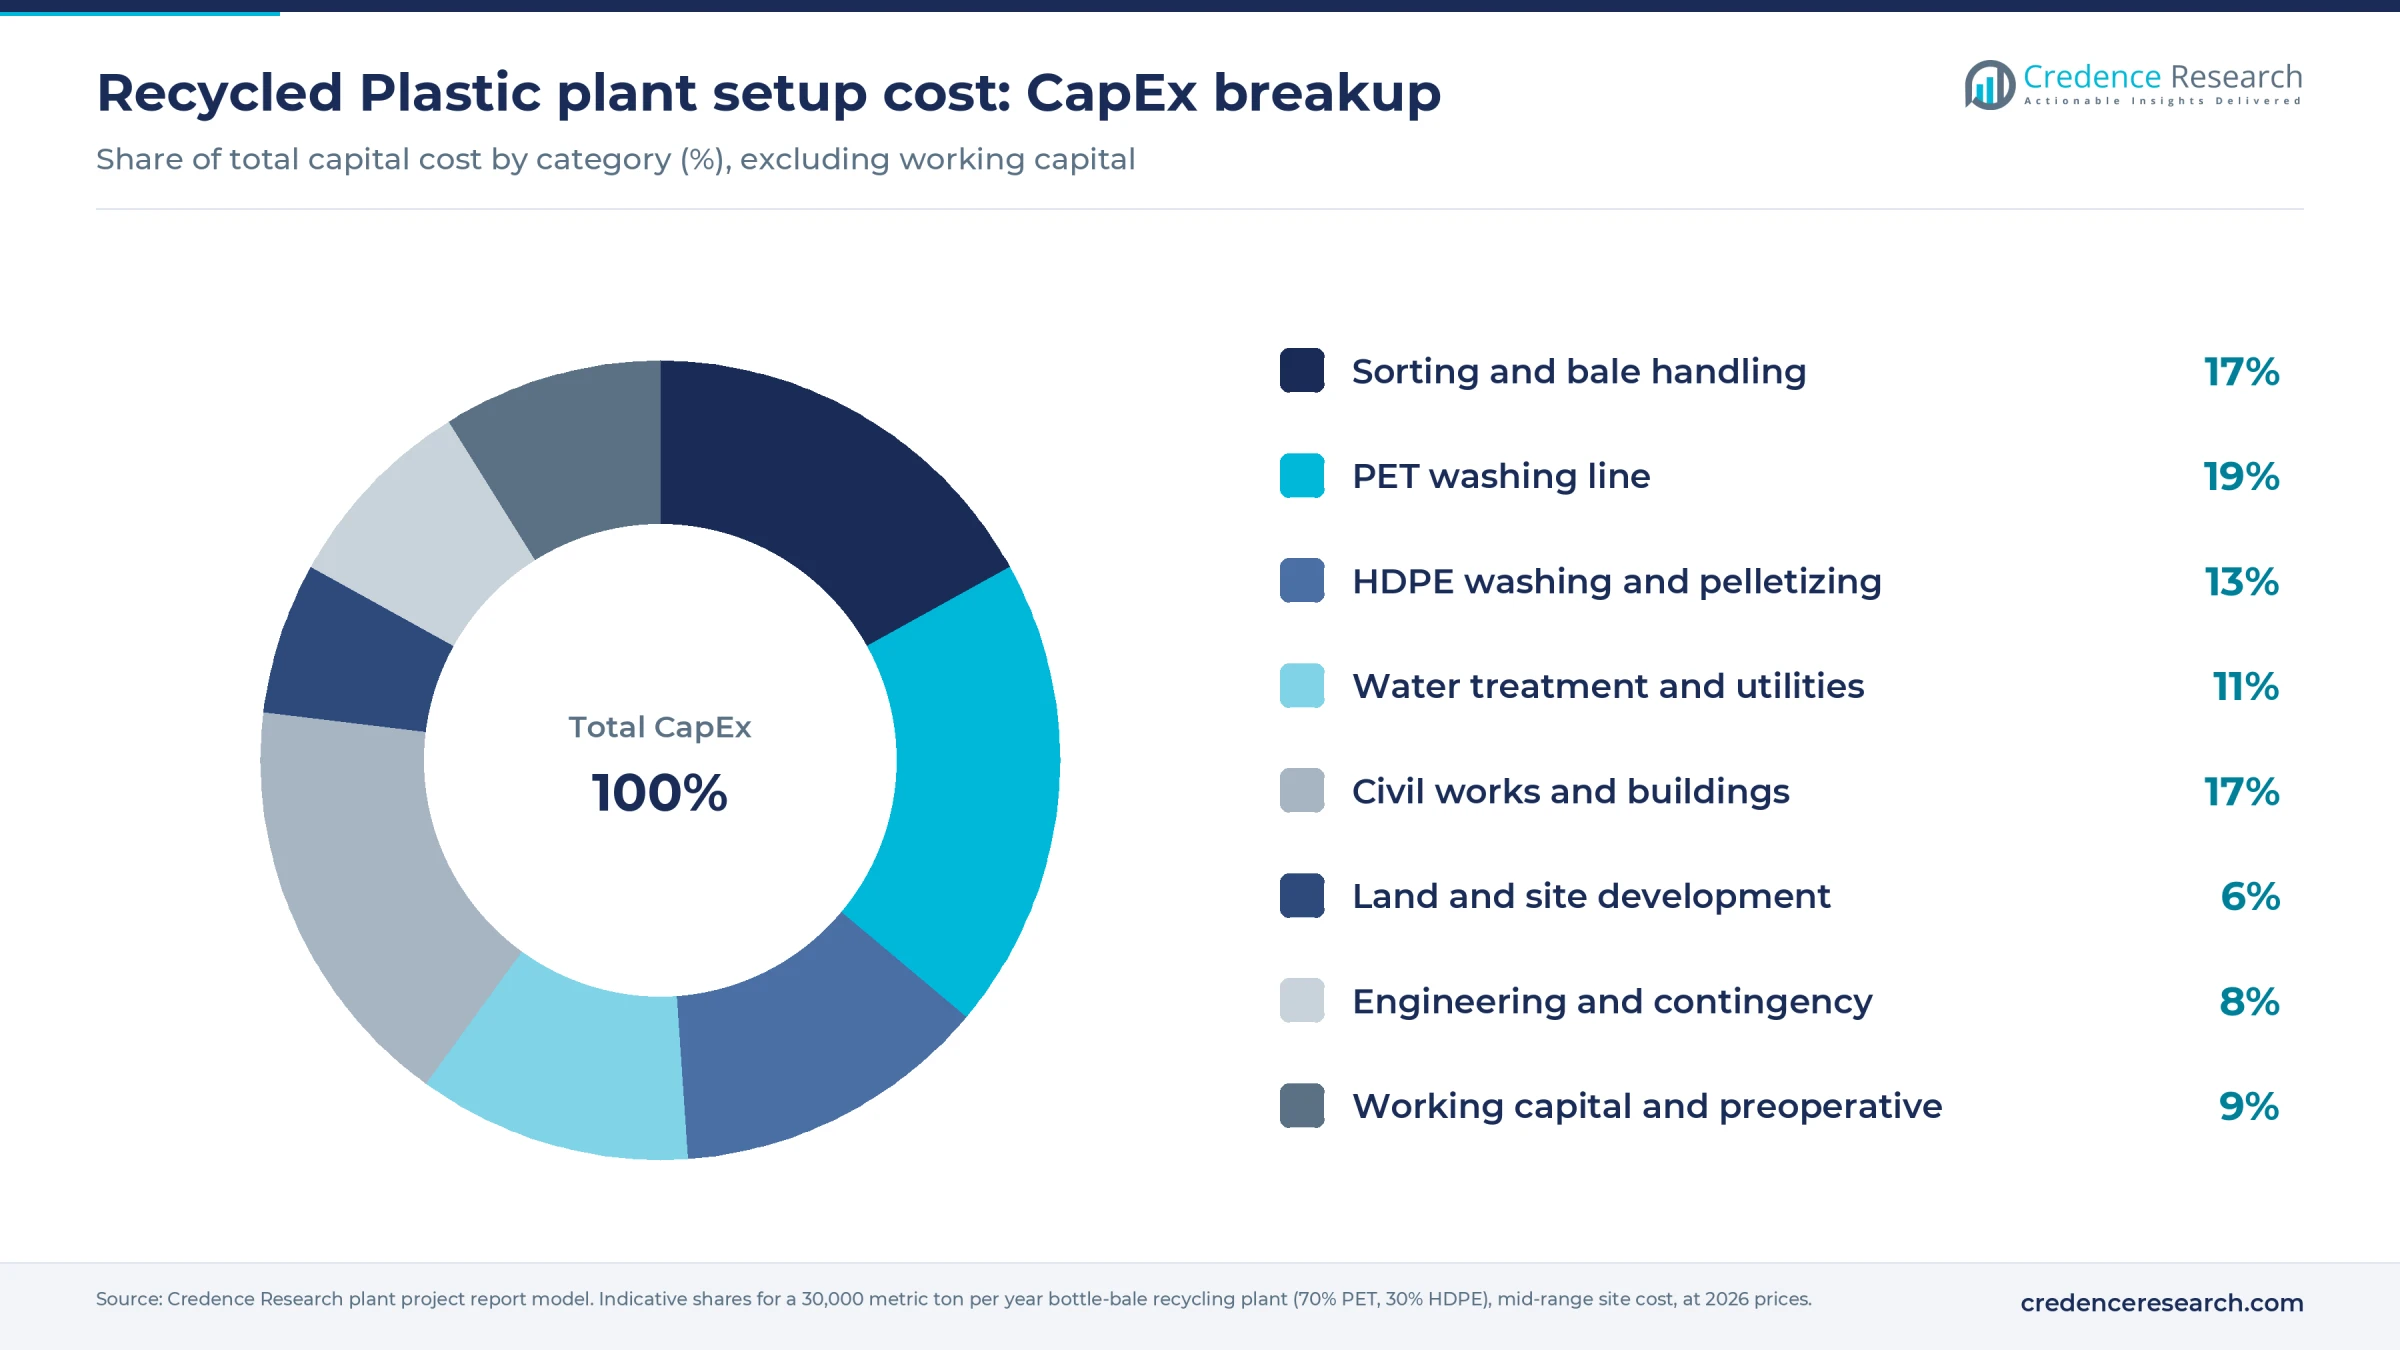
Sorting, washing and extrusion equipment, with water treatment and utilities, take about 60% of CapEx. On the operating side, baled feedstock makes up about 53% of running cost, followed by labor, power and steam.
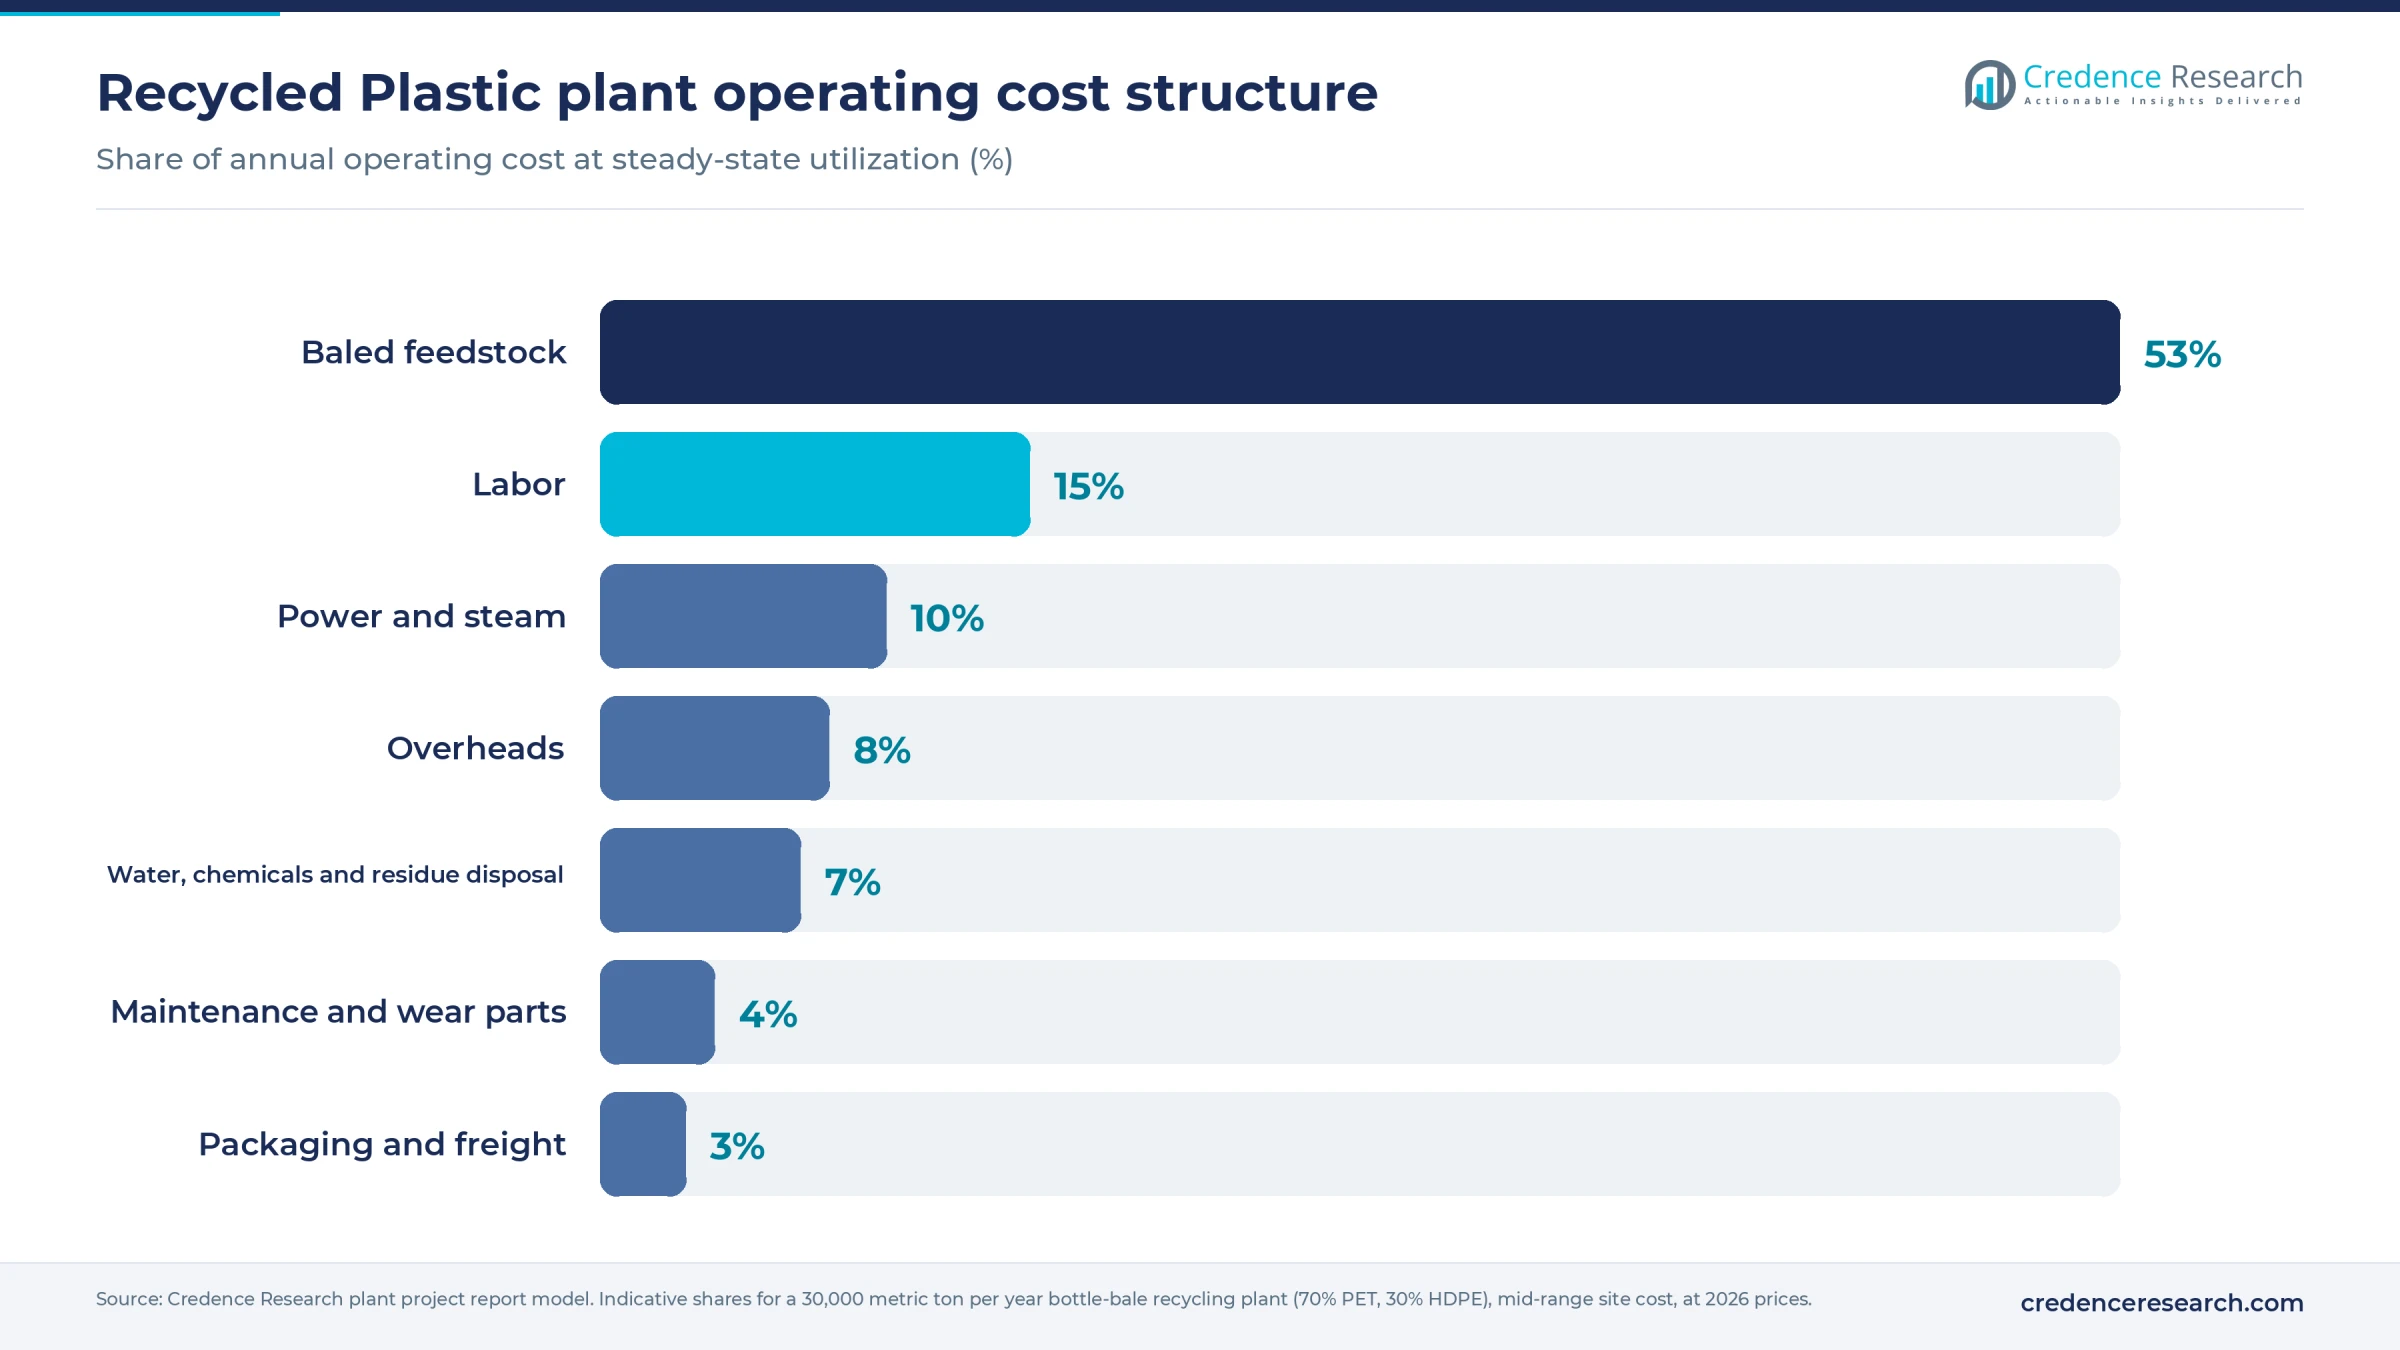
Every line item in the full report can be re-based to a chosen country, site and feedstock mix.
Machinery and raw materials for a recycled plastic plant
Main equipment groups are listed below; the plastic recycling machinery market covers supplier trends.
- Bale breaker, infeed conveyors, trommel screen and ballistic separator
- Near-infrared optical sorters, magnets and eddy-current separators
- Label remover, wet granulators and prewash units
- Hot caustic wash reactors, friction washers and float-sink tanks
- Centrifugal and thermal dryers, plus flake color and polymer sorters
- Recycling extruder with melt filter, vacuum degassing and underwater pelletizer
- Wash water treatment with dissolved air flotation, filter press and recirculation
- Steam boiler, compressors, silos, big-bag stations and a quality lab
Feedstock is local by nature, because bales are bulky and low in value. The cleanest bottle supply comes from deposit return systems, which run in Germany, the Nordic countries, the Baltic states and several U.S. states and are spreading under the EU target to collect 90% of beverage bottles separately by 2029. Curbside bales from material recovery facilities in North America, Europe, Japan and Australia carry more contamination. Germany, Japan, the United States, the Netherlands and the United Kingdom are the largest scrap exporters, while Southeast Asia and Turkey are the main import hubs. Informal collectors keep bale prices low but quality uneven in many developing markets.
Process chemicals are few: caustic soda, detergents, defoamers and flocculants, all widely traded. The reference plant needs about 2,500 metric tons of bales a month at nameplate, so multiyear supply agreements with municipalities, deposit operators or waste companies are usually a condition for financing.
Recycled plastic business profit margin and ROI
Gross margin for the reference plant is estimated at 18–30%, measured as selling price minus feedstock and direct conversion cost. The build uses assumed ex-works prices of USD 650–900 per metric ton for hot-washed rPET flake and USD 850–1,150 for colored rHDPE pellets. They are benchmarked against 2025 export unit values for virgin resin in UN Comtrade data, about USD 790–990 per metric ton for PET bottle resin from China, Thailand and Turkey and USD 930–1,230 for HDPE from Canada, Saudi Arabia and the United States, since non-food recycled grades seldom sell above virgin. Feedstock is assumed at USD 150–350 per metric ton for PET bales and USD 200–450 for mixed HDPE bales. Regional swings are large: U.S. curbside PET bales averaged under 2 cents a pound in March 2026, while natural HDPE bales held near 50 cents in early 2026.
At 85% utilization, revenue is near USD 16 million and annual cash profit after overheads is about USD 1.9–3.8 million, which puts payback at about 7–14 years at mid-range CapEx of USD 27 million. A low-cost Asian build with contracted feedstock can approach five years.
A USD 50 per metric ton move in PET bale price shifts annual cost by about USD 0.9 million, roughly a third of mid-case cash profit, so feedstock contracts and yield matter more than the selling price.
| Metric | Value |
|---|---|
| Gross margin | 18–30% |
| Payback period | 7–14 years |
| IRR (post-tax) | Available in report |
| NPV | Available in report |
| Return on investment | Available in report |
| DSCR | Available in report |
| Break-even utilization | Available in report |
How to start a recycled plastic business, licenses and approvals
The approval path follows a similar pattern in most countries: company and tax registration, industrial land use and building permits, a waste treatment or recycling facility permit that sets storage limits, fire controls and residue disposal, an environmental consent for air emissions and wash water discharge, occupational safety approvals, registration under the local extended producer responsibility system and, for food-contact output, approval of the recycling process itself. Buying bales across borders also needs waste shipment consent from both countries.
| Market | Key approvals for a recycled plastic plant |
|---|---|
| United States | State solid waste or recycling facility registration where the state requires it, state air permit, industrial wastewater pretreatment permit from the local sewer authority under the Clean Water Act, OSHA workplace rules; a voluntary FDA no-objection letter for a post-consumer recycling process that supplies food-contact resin |
| European Union | Waste treatment permit from the national authority under Waste Framework Directive 2008/98/EC; registration of food-contact rPET recycling under Regulation (EU) 2022/1616; shipment consent under Waste Shipment Regulation (EU) 2024/1157 |
| India | Consent to establish and operate from the state pollution control board; registration as a plastic waste processor on the CPCB centralized EPR portal under the Plastic Waste Management Rules; FSSAI guidelines for food-contact recycled PET; solid plastic waste imports are prohibited |
The EU ban on plastic waste exports to non-OECD countries from Nov. 21, 2026 keeps more bales inside Europe, which helps EU recyclers, while India's recycled-content quotas for rigid packaging, 30% in 2025-26 rising to 60% from 2028-29, create domestic offtake.
Key recycled plastic manufacturers and recent developments
Large mechanical recyclers include Indorama Ventures, which runs PET recycling sites across Asia, Europe and the Americas; ALPLA, with bottle-to-bottle plants in Europe, Mexico, Thailand and South Africa; Veolia; Biffa in the United Kingdom; Far Eastern New Century in Taiwan; KW Plastics, a major U.S. processor of rHDPE and rPP; and Ganesha Ecosphere in India.
- February 2026: Alpek filed notice to close its post-consumer PET recycling plant in Reading, Pennsylvania, laying off about 100 workers from mid-March, its second U.S. PET recycling plant closure.
- April 2026: Reconomy announced a GBP 20 million plant in Corby, England, to turn up to 38,000 metric tons of plastic a year into pellets under its Eurokey brand, due to run fully in the second half of 2026.
- July 2026: Vietnam's DPEC commissioned a 20,000 metric ton a year first phase in Ninh Binh province for USD 6.2 million, with a second phase planned for 2027 to lift capacity above 50,000 metric tons.
The pattern, consolidation in high-cost markets and new low-cost capacity in Asia, favors entrants that secure feedstock and a buyer before they build.
What's inside the Recycled Plastic project report PDF
The report runs to 21 chapters. Open a chapter to see its sections.
1. Preface
2. Scope and Methodology
- 2.1 Objectives of the Study
- 2.2 Stakeholders
- 2.3 Research Methodology
- 2.4 Data Sources and Key Assumptions
3. Executive Summary
- 3.1 Market Snapshot
- 3.2 Project at a Glance (Capacity, CapEx, OpEx)
- 3.3 Key Financial Indicators (IRR, NPV, Payback, Break-even)
- 3.4 Feasibility Verdict
4. Product Overview
- 4.1 Recycled Plastic Definition and Properties
- 4.2 Grades and Specifications (BIS / ISO / ASTM)
- 4.3 HS Code and Classification
- 4.4 Key Applications
- 4.5 Substitutes
5. Global Recycled Plastic Market
- 5.1 Market Overview
- 5.2 Historical and Current Market Performance (Volume and Value)
- 5.3 Market Breakup by Grade / Type
- 5.4 Market Breakup by End-Use Industry
- 5.5 Market Breakup by Region
- 5.6 Market Drivers, Restraints and Trends
- 5.7 Value Chain Analysis
- 5.8 Market Forecast
6. Target Country Recycled Plastic Market Analysis
- 6.1 Demand and Supply Analysis
- 6.2 Installed Capacity vs Demand Gap
- 6.3 Import Dependence
- 6.4 Demand Forecast by End-Use
7. Trade Analysis
- 7.1 Imports by Volume, Value and Country
- 7.2 Exports by Volume, Value and Country
- 7.3 Trade Balance and Opportunities
8. Price Analysis
- 8.1 Historical Recycled Plastic Price Trends by Region
- 8.2 Raw Material / Feedstock Price Trends and Linkage
- 8.3 Price Forecast
- 8.4 Margins Across the Value Chain
9. Competitive Landscape
- 9.1 Market Structure
- 9.2 Key Players and Installed Capacities
- 9.3 Profiles of Key Players
- 9.4 Recent Developments (Expansions, M&A, New Plants)
10. Manufacturing Process and Technology
- 10.1 Comparison of Technology Routes
- 10.2 Selected Route and Process Flow Diagram
- 10.3 Unit Operations Involved
- 10.4 Chemical Reactions Involved
- 10.5 Mass Balance and Raw Material Requirements
- 10.6 Energy Balance
- 10.7 Quality Assurance Criteria and Technical Tests
- 10.8 By-products and Waste Handling
- 10.9 Technology Licensors / Providers
11. Project Details, Requirements and Costs
- 11.1 Land, Location and Site Development
- 11.1.1 Site Selection Criteria
- 11.1.2 Location Analysis
- 11.1.3 Land Requirement and Costs
- 11.1.4 Site Development Costs
- 11.2 Plant Layout
- 11.2.1 Layout Principles
- 11.2.2 Proposed Layout
- 11.2.3 Factors Influencing Layout
- 11.3 Civil Works and Buildings
- 11.4 Plant Machinery
- 11.4.1 Machinery Requirements and Specifications
- 11.4.2 Machinery Costs
- 11.4.3 Machinery Suppliers
- 11.5 Raw Materials
- 11.5.1 Requirements per Tonne of Output
- 11.5.2 Procurement and Sourcing
- 11.5.3 Costs
- 11.5.4 Suppliers
- 11.6 Packaging
- 11.6.1 Packaging Requirements
- 11.6.2 Packaging Costs
- 11.6.3 Packaging Suppliers
- 11.7 Storage and Material Handling
- 11.8 Transportation Requirements and Costs
- 11.9 Utilities
- 11.9.1 Power Requirements and Costs
- 11.9.2 Water Requirements and Costs
- 11.9.3 Steam, Fuel and Other Utilities
- 11.10 Manpower Requirements and Wages
12. Environment, Health, Safety and Sustainability
- 12.1 Effluent and Emissions Management
- 12.2 Hazard Classification and Safety Measures
- 12.3 Carbon Footprint
- 12.4 Green / Low-Carbon Process Options
13. Regulatory Procedures, Approvals and Certifications
- 13.1 Licences and Registrations
- 13.2 Environmental Clearances
- 13.3 Product Certifications (BIS, REACH, etc.)
- 13.4 Approval Timeline
14. Project Implementation Schedule
15. Project Economics
- 15.1 Capital Cost of the Project
- 15.2 Techno-Economic Parameters
- 15.3 Capacity Utilization and Ramp-up
- 15.4 Product Pricing and Margins
- 15.5 Income Projections
- 15.6 Expenditure Projections
- 15.7 Working Capital Requirement
- 15.8 Taxation
- 15.9 Depreciation
16. Financial Analysis
- 16.1 Projected Profit and Loss Account
- 16.2 Projected Cash Flow Statement
- 16.3 Projected Balance Sheet
- 16.4 Liquidity Analysis
- 16.5 Profitability Analysis (Payback, NPV, IRR, ROI)
- 16.6 Break-even Analysis
- 16.7 Debt Service Coverage Ratio (DSCR)
- 16.8 Sensitivity Analysis
- 16.9 Scenario and Uncertainty Analysis
17. Funding and Incentives
- 17.1 Means of Finance and Debt-Equity Structure
- 17.2 Loans and Financial Assistance
- 17.3 Government Schemes and Subsidies (PLI, State Policies)
18. Risk Assessment
- 18.1 Key Success Factors
- 18.2 Key Risk Factors
- 18.3 Risk Mitigation
19. Strategic Recommendations
20. Case Study of a Successful Venture
21. Appendix
- 21.1 Detailed Assumptions
- 21.2 Abbreviations
- 21.3 List of Tables and Figures
- 21.4 Sources
This page vs. the full report
| Data point | On this page (free) | In the full report |
|---|---|---|
| Total CapEx | One rounded range at one capacity | Exact figure at three capacities with a line-item breakup |
| CapEx breakup | Category shares (%) only | Cost, quantity and supplier for every machine |
| Operating cost | Share of raw materials, utilities and labor | Per-unit cost sheet with each input price and consumption |
| Profitability | Gross margin range and payback band | Exact IRR, NPV, ROI, break-even and DSCR |
| Financial statements | List of what is included | 10-year P&L, cash flow, balance sheet and Excel model |
| Sensitivity | One directional line | Full sensitivity and scenario tables |
| Process | Simplified flow diagram | Detailed process flow, mass and energy balance, operating conditions |
| Machinery | Names of the main machines | Specifications, capacity, cost and supplier list |
| Market | Headline size, growth and global demand | Segment, region, trade and price forecast tables |
| Suppliers and buyers | Supplier types and sourcing hubs | Named suppliers and buyers |
Recycled Plastic project report: FAQs
How much does it cost to set up a recycled plastic plant?
What does a recycled plastic plant produce?
What is the profit margin in plastic recycling?
What is the payback period for a recycled plastic plant?
Which licenses does a plastic recycling plant need?
Where does a plastic recycling plant source its feedstock?
How is recycled plastic classified for trade?

About the analyst
Nisha Gupta, Senior Research Analyst
Nisha Gupta is a Senior Research Analyst at Credence Research Inc. who works across industry domains, including packaging, automotive parts and machinery. Her focus is the modelling engine behind each study: she builds quantitative market databases and econometric forecasting frameworks, and developed automated Excel-based market modelling templates that cut client turnaround time by 30%.
Related market research
- Recycled Plastics Market Size, Trends, Growth and Forecast 2032
- Recycled Plastic Granules Market Size, Growth and Forecast 2032
- rPET Flakes Market Size, Growth, Share, Trend and Forecast 2032
- Plastic Recycling Machine Market Size, Growth and Forecast 2032
- Recycled Plastic Packaging Market Size, Share and Forecast 2032
- Plastic Recycling Market Size, Share, Growth and Forecast 2032
More plant project reports
- Grease Manufacturing Plant Project Report (DPR) 2026
- Glycerin Manufacturing Plant Project Report (DPR) 2026
- Naphthalene Balls Manufacturing Plant Project Report (DPR) 2026
- Formaldehyde Manufacturing Plant Project Report (DPR) 2026
- Sulfuric Acid Manufacturing Plant Project Report (DPR) 2026
- Engine Oil Manufacturing Plant Project Report (DPR) 2026