
Quick answer
Glycerin plants usually refine crude glycerin, a biodiesel and oleochemical by-product of about 80% purity, into USP-grade product of 99.5–99.7%. A greenfield refinery of 30,000 metric tons a year needs an estimated USD 20–45 million of CapEx, depending on location. Gross margin is about 11–37%, set mainly by the regional spread between crude and refined prices, and simple payback is about 3–10 years at 90% utilization.
Viable where crude glycerin is cheap relative to refined prices, as in the U.S. Midwest, or where the refinery is tied to a biodiesel or fat-splitting plant; thin for a merchant refiner buying imported crude in Asia.
Glycerin plant: key highlights
| Parameter | Indicative value | Note |
|---|---|---|
| Plant capacity | 30,000 metric tons per year | USP-grade refined glycerin from 80% crude, vacuum distillation route |
| Total CapEx | USD 20–45 million | Low end an Asian industrial park, top end a standalone U.S. or EU site |
| Raw material share of operating cost | 75–87% | Purchased crude glycerin at about 1.3 tons per ton of product |
| Gross margin | 11–37% | Asian merchant refiner at the low end, U.S. Midwest spread at the high end |
| Payback period | 3–10 years | 90% utilization, simple pre-tax basis, region-matched CapEx |
| IRR | Available in report | Post-tax, 10-year model |
| Break-even | Available in report | Capacity utilization basis |
Ranges assume a 30,000-metric-ton-a-year refinery turning 80% crude glycerin into USP grade by vacuum distillation, Asian to U.S. or EU sites, October 2025 to 2026 prices and 90% utilization. Crude use of 1.3 tons per ton, conversion and fixed costs are assumed. CapEx is scaled from two disclosed U.S. refineries with assumed escalation, standalone and location factors. Customizable to any country or region.
What is glycerin?
Glycerin, also called glycerol or glycerine (C3H8O3, CAS 56-81-5), is a clear, odorless, sweet-tasting and strongly hygroscopic liquid carrying three hydroxyl groups. Nearly all supply today is natural. It is released whenever fats and oils are split into fatty acids, saponified into soap or converted into biodiesel, and only a small share is still made synthetically from propylene.
For an investor, a glycerin plant usually means refining the molecule rather than making it. Crude glycerin from biodiesel holds about 80% glycerol plus water, methanol, salts and fatty matter, and it sells at a deep discount to refined material of 99.5–99.7% purity that meets USP, European Pharmacopoeia or food-additive specifications. Kosher, vegetable-origin and technical grades also trade separately.
Customs treat the two forms differently. Crude glycerol, glycerol waters and glycerol lyes fall under Harmonized System subheading 1520.00, in the fats and oils chapter, while refined glycerol is classified under subheading 2905.45 among the acyclic alcohols.
Refined grades go into toothpaste, skin care, cough syrups and other drug excipients, food humectants listed as E 422, e-liquids, alkyd resins and polyether polyols, and chemical routes to propylene glycol and epichlorohydrin. Crude also goes to animal feed and digesters.
Glycerin market overview and global demand
Credence Research does not publish a standalone valuation for this product, so the overview relies on physical trade data. Glycerin sits inside the wider oleochemicals industry, which Credence Research valued at USD 26.06 billion in 2024, and its supply is tied to the global biodiesel business, valued at USD 49 billion in 2024.
Trade flows show where the molecule moves. UN Comtrade records for 2024 show about USD 1.75 billion of reported refined glycerol exports under HS 2905.45 and about USD 821 million of crude glycerol exports under HS 1520.00, the crude flow covering roughly 2.3 million metric tons. Indonesia led both codes, with about USD 505 million of refined and USD 289 million of crude shipments. Germany, Malaysia and the Netherlands followed in refined product, and Brazil was the second-largest crude exporter at about 598,000 tons.
China is the main destination for both grades, and its 2024 imports were about 1.58 million tons of crude glycerol and 710,000 tons of refined glycerol, feeding local refiners, epichlorohydrin units and personal care makers. Chinese buying therefore acts as a swing factor for crude prices worldwide.
Supply grows with fuel mandates rather than with demand for the product itself. Each 10 tons of biodiesel yields roughly 1 ton of glycerol, so policy decisions in Indonesia, Brazil, the United States and the EU decide feedstock availability. Renewable diesel made by hydrotreating yields no glycerin, so growth in that fuel adds no supply. On the demand side, Louis Dreyfus Company has projected refined glycerin demand growth of about 2.5% a year from 2023 to 2040, a steady pace tied to personal care, pharmaceuticals and food.
Glycerin manufacturing process
The reference plant buys crude glycerin of about 80% purity and refines it to USP grade by vacuum distillation, the dominant commercial route. Ion exchange and membrane routes struggle with the high salt load of biodiesel crude.
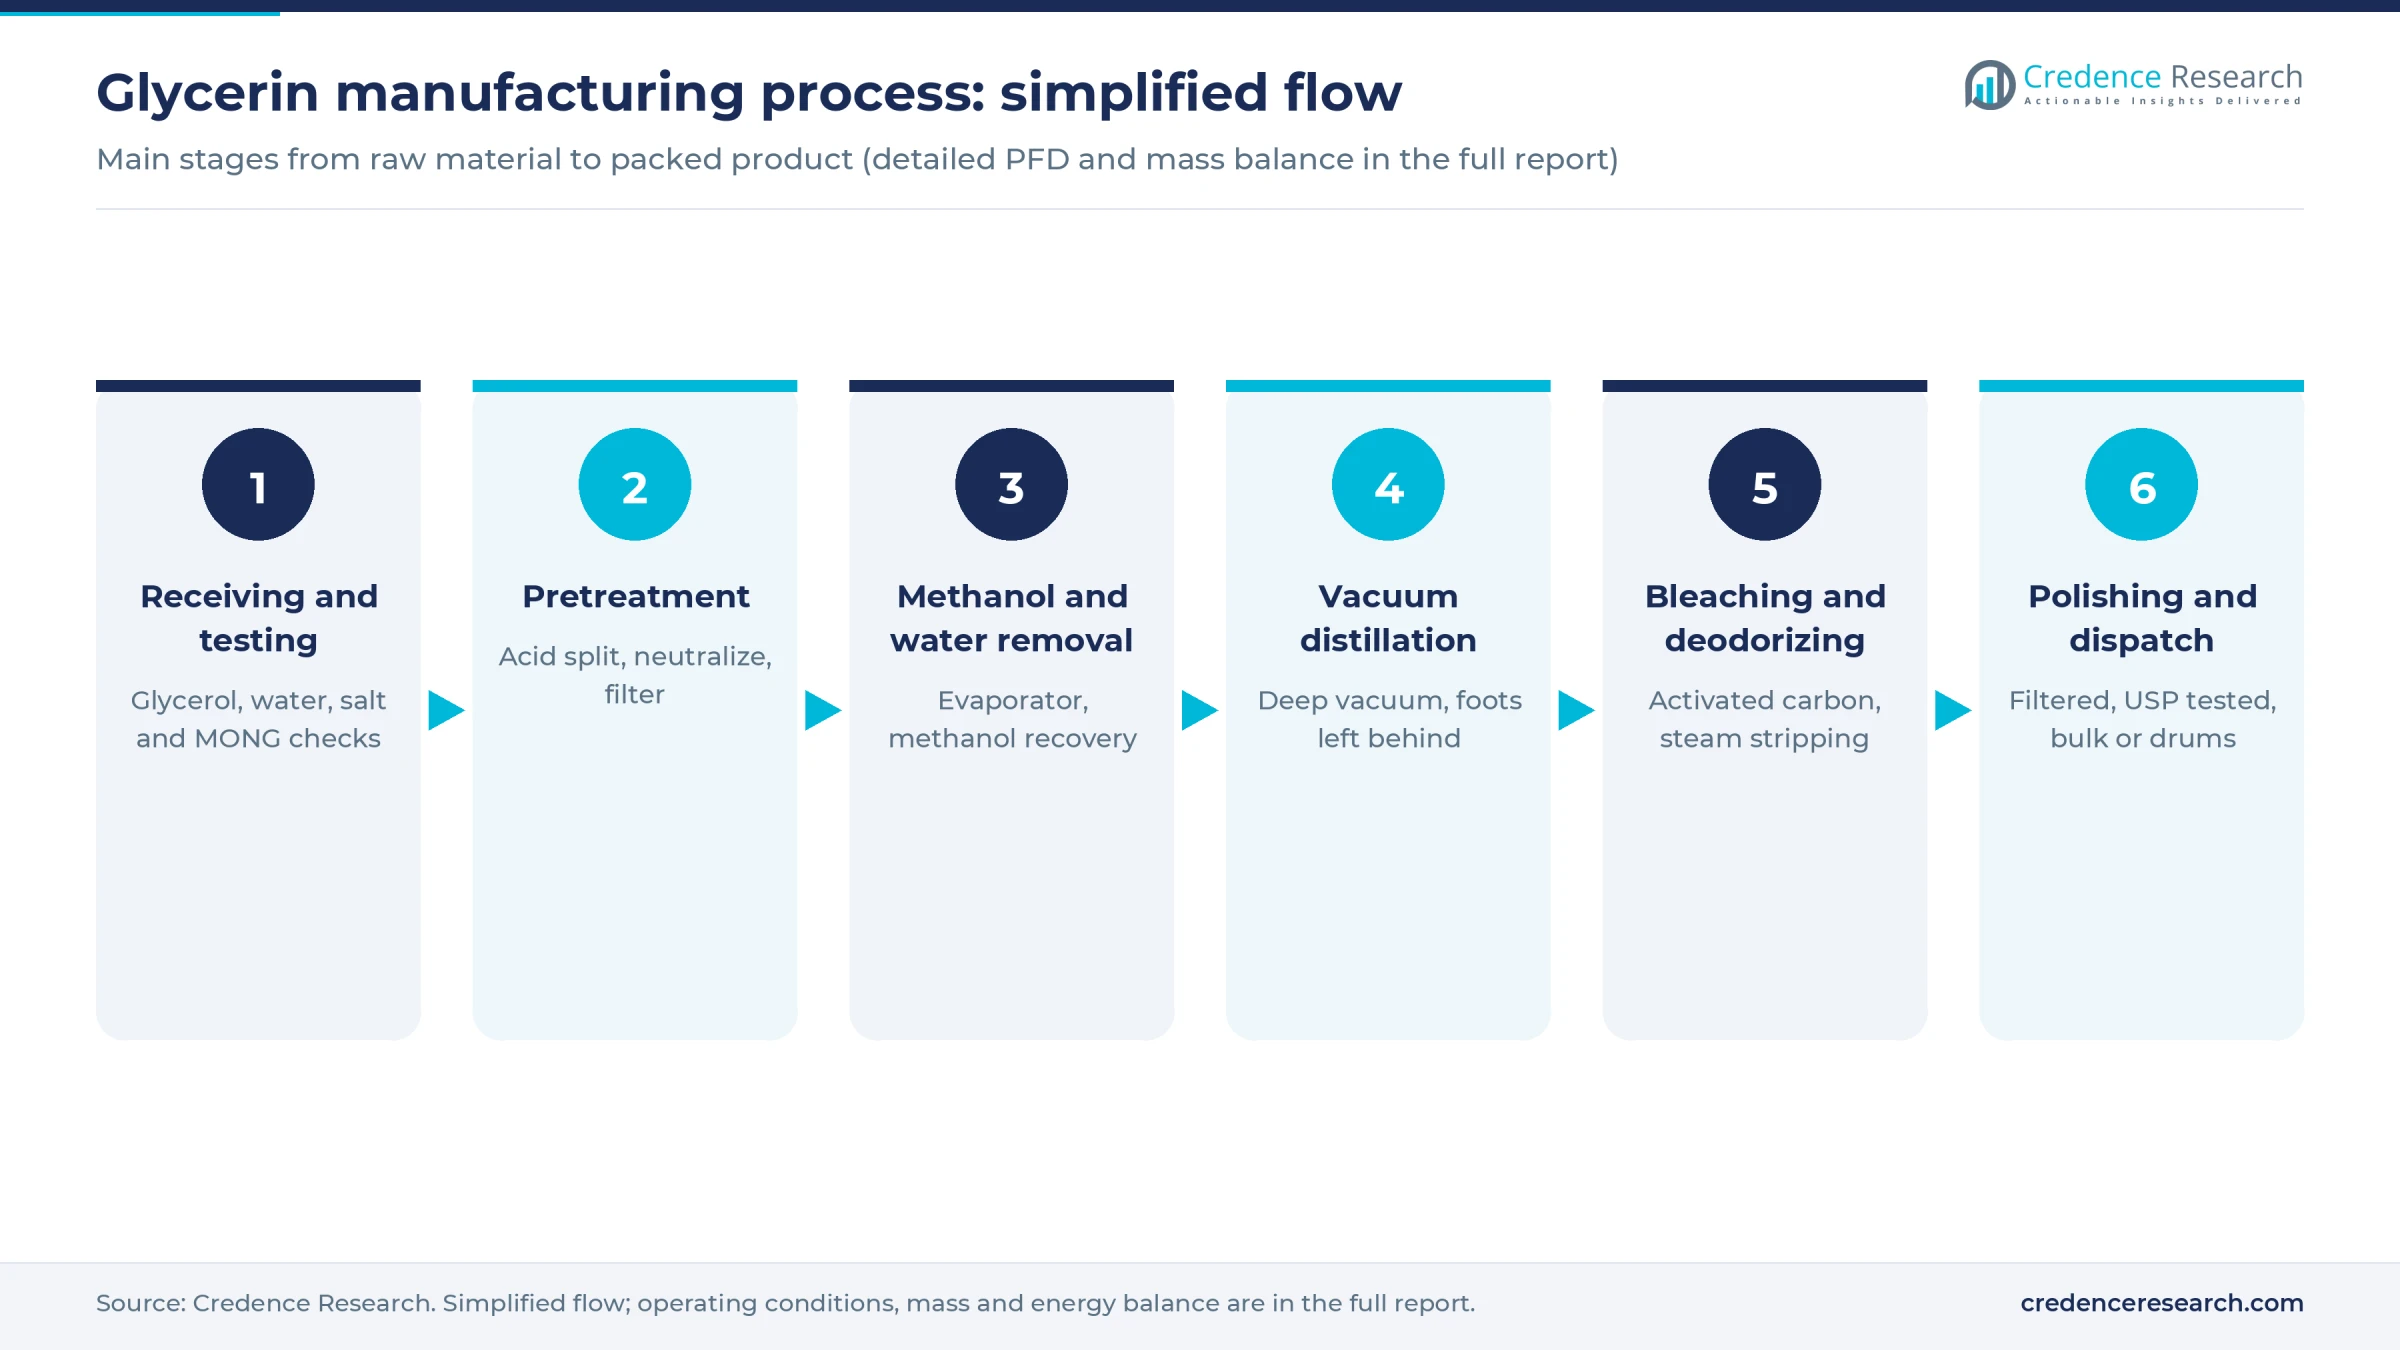
- Receiving and testing. Each lot is checked for glycerol, water, methanol, ash and MONG, or matter organic non-glycerol, because feed quality drives yield. Tallow, palm, soy and used cooking oil crudes are often stored apart.
- Pretreatment. Mineral acid splits residual soaps into free fatty acids, which separate and are skimmed off. The liquid is then neutralized with caustic, and a filter press removes precipitated solids.
- Methanol and water removal. A falling-film or thin-film evaporator strips methanol, which is recovered for sale or return to a biodiesel unit, and drives off most of the water.
- Vacuum distillation. Glycerol is distilled under deep vacuum at roughly 160–180 degrees Celsius to avoid thermal breakdown into acrolein and polyglycerols. Salts and heavy organics stay behind as a residue known as glycerin foots.
- Bleaching and deodorizing. Activated carbon removes color and odor bodies, and steam stripping removes light volatiles that affect taste and smell.
- Polishing and dispatch. Fine filters remove carbon fines. Each batch is tested against the pharmacopoeia monograph, including the diethylene glycol and ethylene glycol limit, then stored in stainless tanks and shipped in bulk, IBCs or drums.
Yield is the main technical lever. With crude at 80% glycerol and about 95% recovery, the plant needs about 1.3 tons of crude per ton of refined product, an assumed ratio, and every lost point of recovery cuts margin. Foots, salt and wastewater streams need disposal routes before a site is chosen. Plants that run tallow and vegetable crude on one line also need cleaning and segregation procedures to protect kosher and vegetable-origin claims.
Glycerin plant setup cost
The reference plant refines 30,000 metric tons a year of USP glycerin. Total CapEx is estimated at USD 20–45 million, covering land, crude receiving tanks, pretreatment, evaporation and distillation trains, bleaching, product storage, boilers and vacuum systems, effluent treatment, buildings, preoperative costs and a working capital margin. An Asian industrial park sits near USD 20–30 million, and a standalone U.S. or EU site near USD 32–45 million.
Two disclosed U.S. projects anchor the estimate. Louis Dreyfus spent about USD 22 million on its 80-million-pound-a-year refinery at Claypool, Indiana, which started up in late 2015 beside a biodiesel plant, or about USD 600 per annual ton. Owensboro Grain in Kentucky put its 40-million-pound refinery, about 18,000 tons, at USD 15–20 million in 2012. Scaled to 30,000 tons by the six-tenths rule and lifted by assumed cost escalation of 1.37–1.40x, both point to about USD 27–37 million at a host site. An assumed 1.15–1.25x standalone factor for land, utilities and storage gives the U.S. or EU range, and an assumed 0.65–0.75x location factor gives the Asian one.
For the land row, the plant needs about 25,000 square meters including tank separation distances, an assumed figure. At an assumed USD 20–60 per square meter, land costs USD 500,000–1.5 million, or about 2–5% of CapEx. Prime U.S. or EU chemical parks can exceed that range.
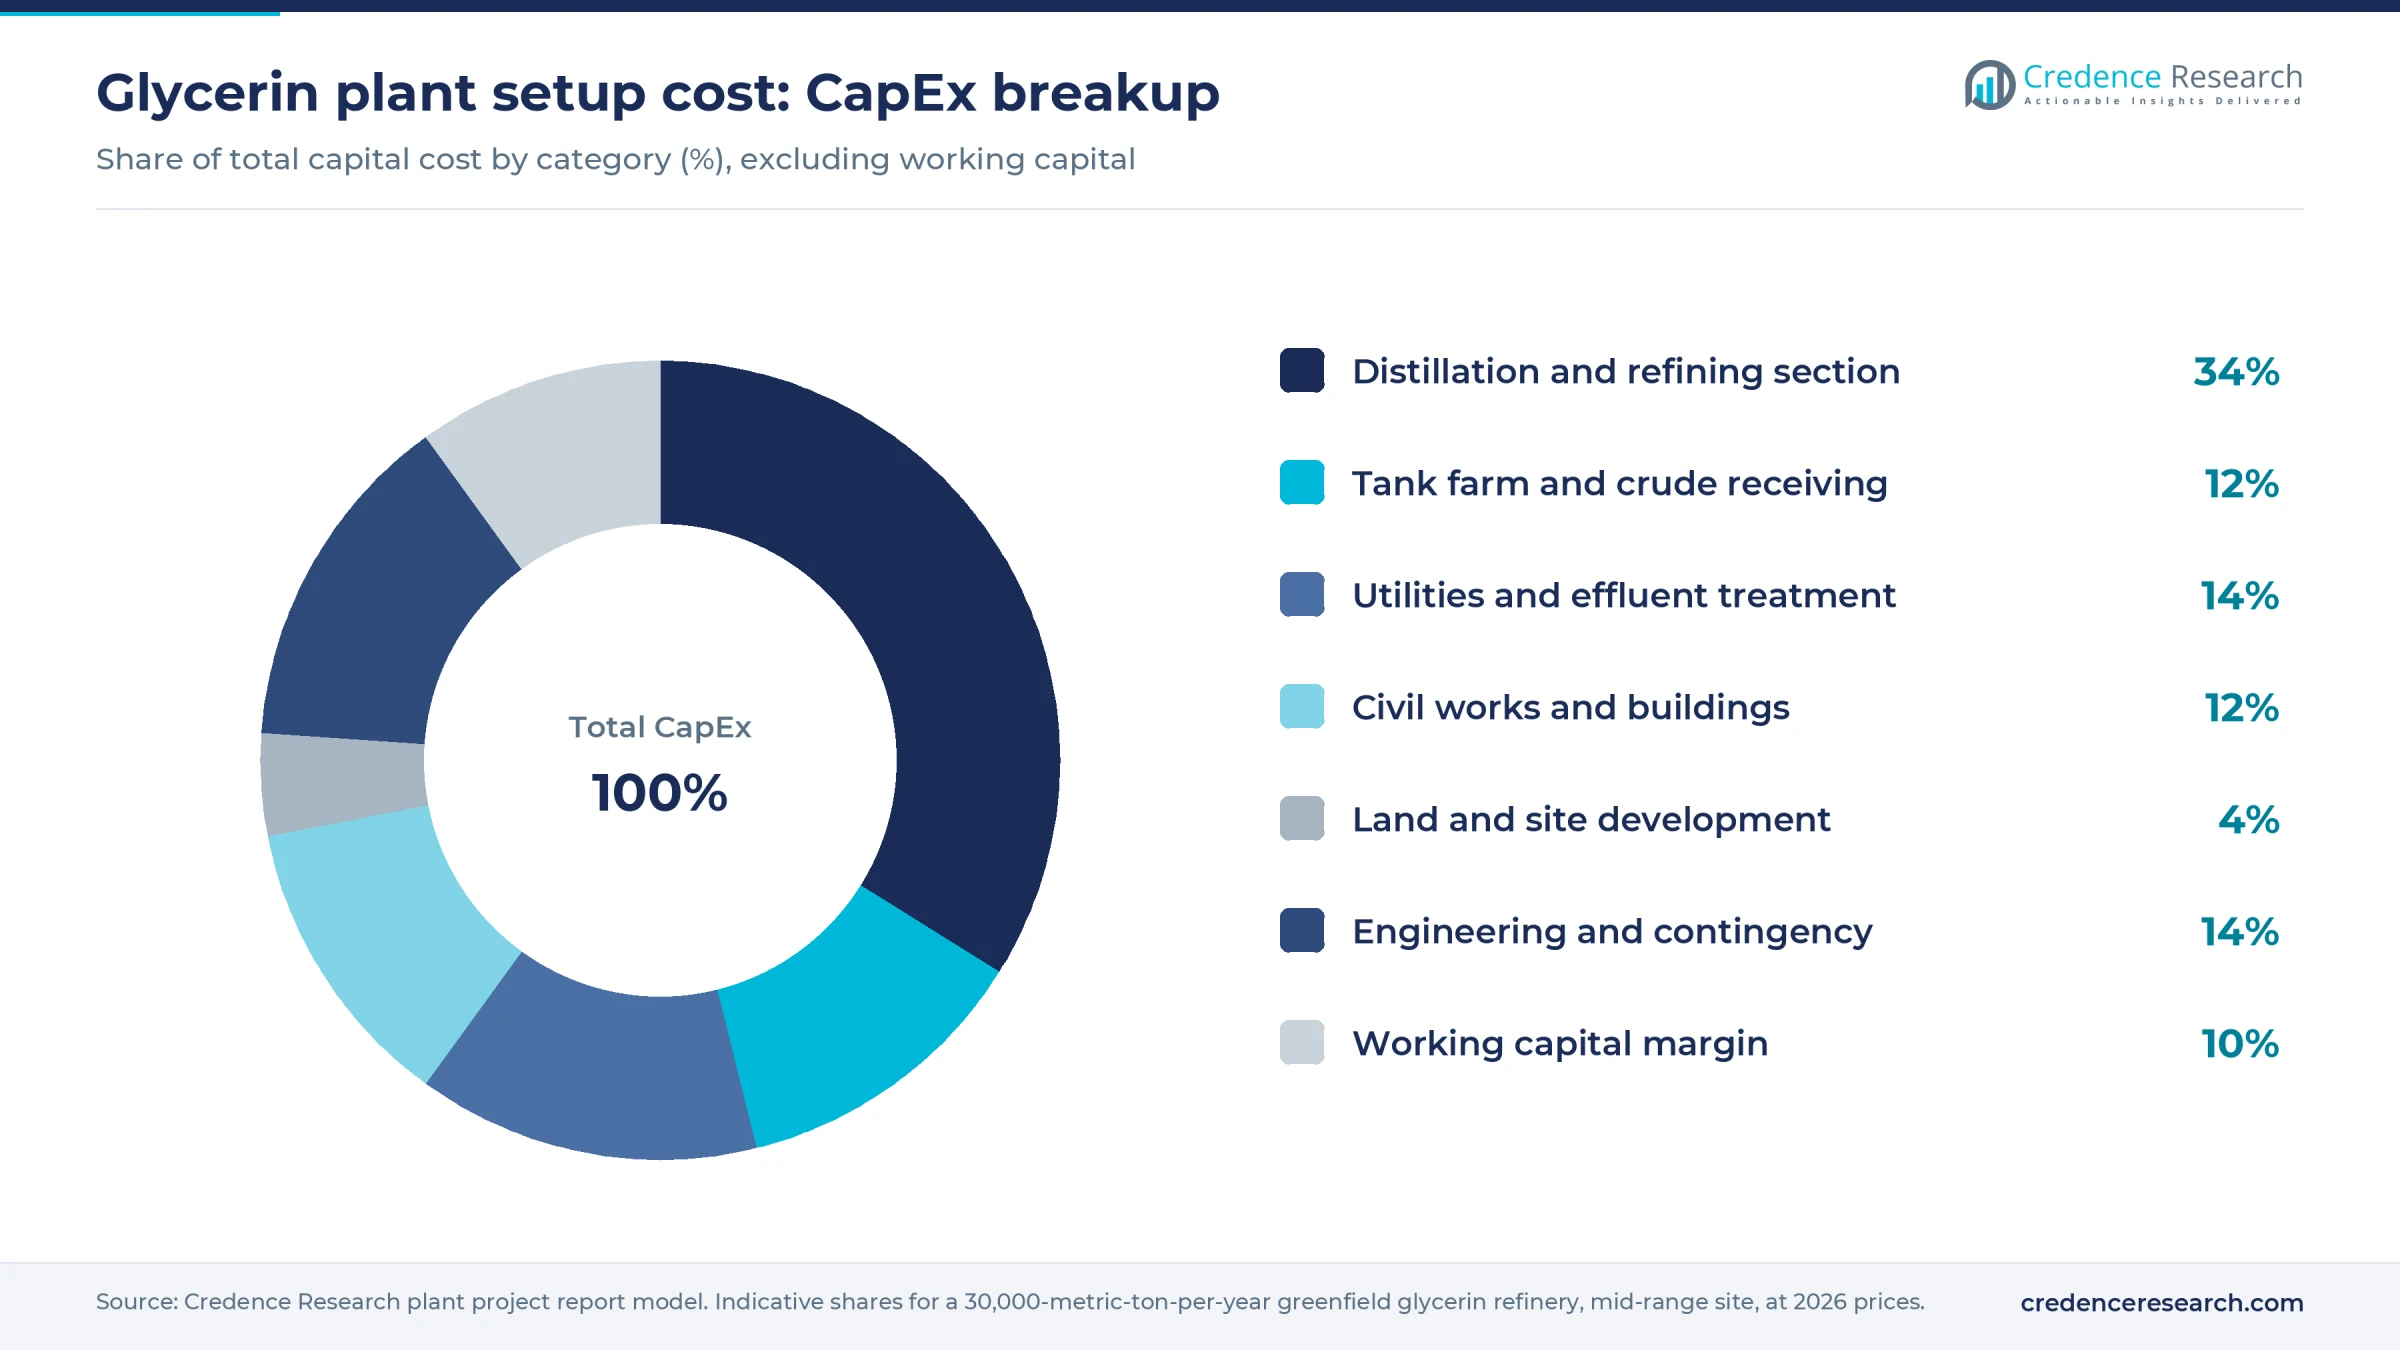
The distillation section takes about a third of the investment, and tankage is large because crude, intermediate and finished product need separate storage. Operating cost is far more concentrated.
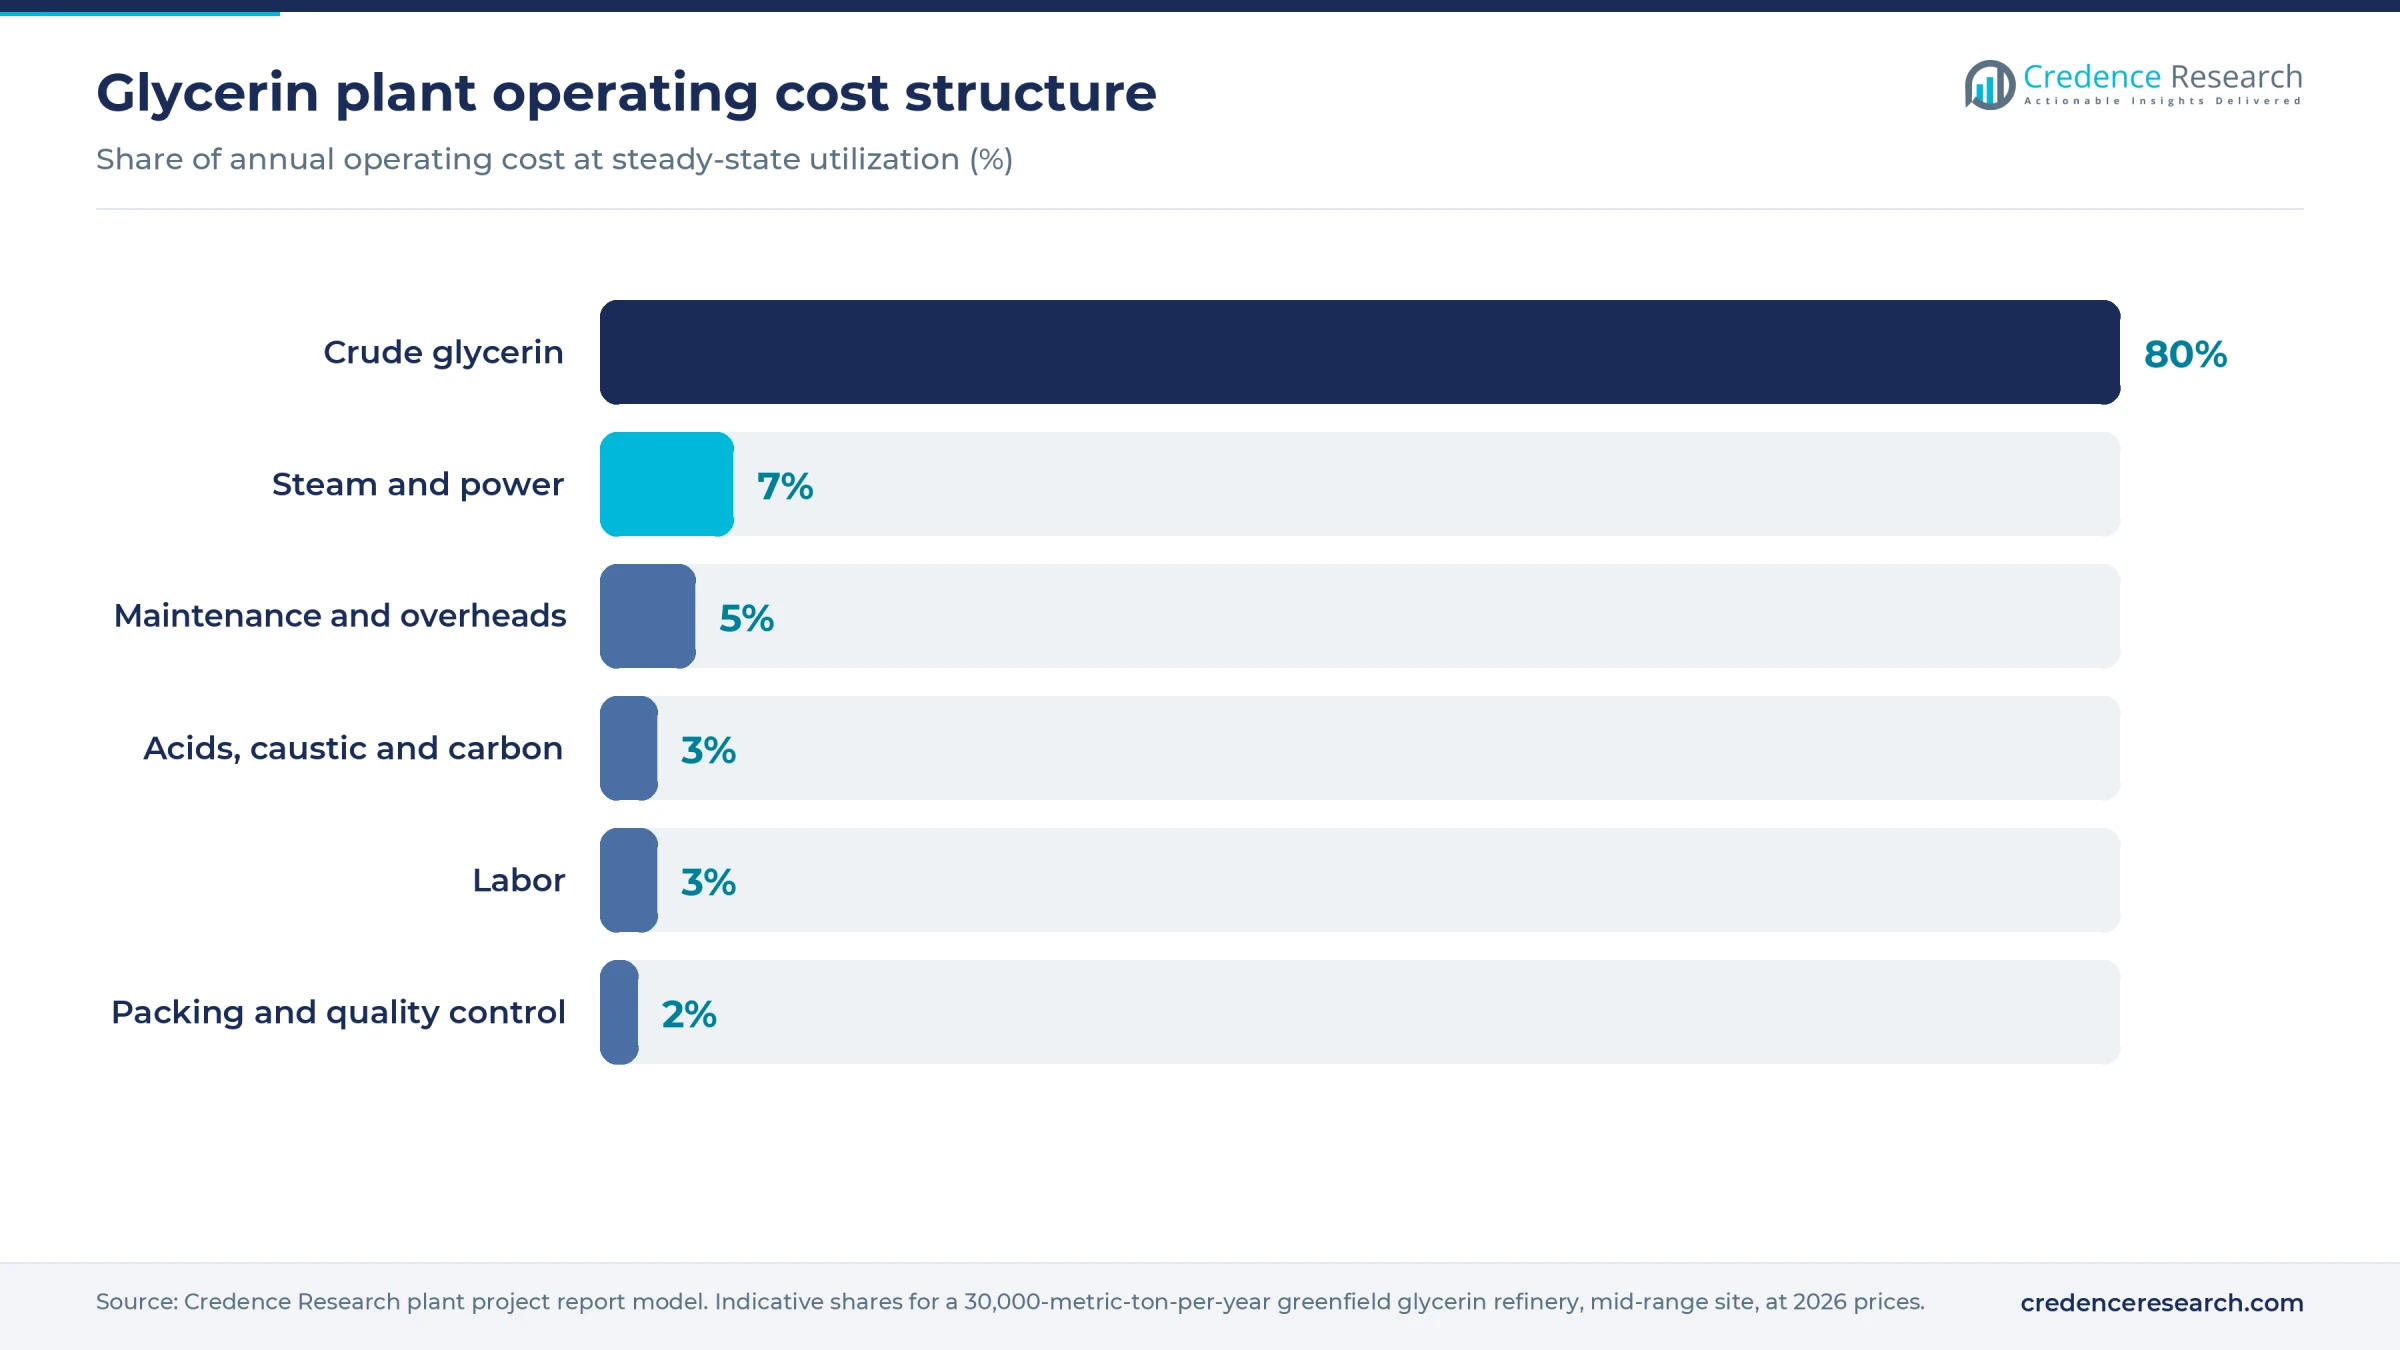
Purchased crude accounts for about four-fifths of running cost, so supply contracts and grade selection matter more than equipment choices. The full report can be customized to any country or region.
Machinery and raw materials for a glycerin plant
Main equipment groups are listed below; ratings, makes and the full schedule are in the report.
- Heated crude receiving tanks, unloading pumps and a feed laboratory
- Acidulation and neutralization reactors, decanters and filter presses
- Falling-film or thin-film evaporators with a methanol recovery column
- High-vacuum distillation column or wiped-film still, reboiler and steam ejector or vacuum pump set
- Activated carbon bleaching vessels, deodorizer and polishing filters
- Stainless product tanks with nitrogen blanketing and bulk, IBC and drum filling
- Thermal fluid heater or boiler, cooling tower, effluent treatment and residue handling
- Quality lab with gas chromatography for diethylene glycol and ethylene glycol testing
At 90% utilization the plant buys about 35,000 tons of crude a year. The largest exporting sources are palm-based biodiesel and oleochemical hubs in Indonesia and Malaysia, soy-based biodiesel in Brazil, Argentina and the U.S. Midwest, and rapeseed and waste-oil biodiesel in Germany, the Netherlands and other EU states. Secondary inputs, including sulfuric or hydrochloric acid, caustic soda and activated carbon, are widely available.
Regional price gaps for crude are wide, so a site near a biodiesel cluster or a deep-water port pays off. Crude of 80% grade was assessed at about USD 463–529 per ton in the U.S. Midwest and USD 740–800 per ton delivered to China in October 2025.
Glycerin business profit margin and ROI
Gross margin is estimated at 11–37%, measured as selling price minus crude feed and direct conversion cost. The range is wide because the spread between crude and refined prices differs sharply by region, and that spread sets profit far more than plant efficiency does.
Published spot assessments for Oct. 1, 2025, show the gap, with American Midwest USP vegetable glycerin at 60–66 cents per pound, about USD 1,323–1,455 per ton, against crude at 21–24 cents, about USD 463–529. In Asia, kosher refined product traded at USD 1,200–1,290 per ton delivered to India, while crude delivered to China cost USD 740–800.
In the stronger case, a U.S. plant sells at USD 1,323, buys crude at USD 529 and spends an assumed USD 150 on conversion, for direct cost near USD 840 per ton and a 37% margin. In the weaker case, an Asian merchant refiner sells at an assumed USD 1,250, buys imported crude at USD 770 and spends an assumed USD 110, for direct cost near USD 1,110 and an 11% margin.
At 27,000 tons of sales, annual cash profit is about USD 2.5–11.1 million after assumed fixed costs of USD 1.2–2.0 million. Simple pre-tax payback is about 3–10 years, using USD 38 million of CapEx for the U.S. case and USD 25 million for the Asian case. Each USD 50 per ton change in the crude-to-refined spread moves cash profit by about USD 1.35 million.
| Metric | Value |
|---|---|
| Gross margin | 11–37% |
| Payback period | 3–10 years |
| IRR (post-tax) | Available in report |
| NPV | Available in report |
| Return on investment | Available in report |
| DSCR | Available in report |
| Break-even utilization | Available in report |
How to start a glycerin business, licenses and approvals
Approval steps follow a common path: company and tax registration, industrial zoning and building permits, an environmental permit covering boiler emissions, wastewater and residue disposal, occupational safety and fire clearances for methanol-bearing crude and fuel storage, product quality certification and import or export registration. Glycerin itself is not classed as hazardous, so most regulatory weight falls on the grades sold. Food grade needs food facility registration, and pharmacopoeia grade sold to drug makers brings excipient good manufacturing practice, supplier audits and, in some markets, a drug manufacturing license.
| Market | Key approvals for a glycerin refinery |
|---|---|
| United States | State Clean Air Act permit for boilers and thermal heaters, NPDES or local pretreatment permit for wastewater, OSHA standards, TSCA inventory compliance, FDA food facility registration and preventive controls for food grade (glycerin is GRAS under 21 CFR 182.1320), and excipient quality systems that support drug makers testing every lot for diethylene glycol and ethylene glycol under FDA's 2023 guidance |
| European Union | Environmental permit from the national or regional authority, REACH registration or a documented exemption check, food additive E 422 purity criteria under Regulation (EU) No 231/2012 with food business registration, and an EDQM certificate of suitability to the Ph. Eur. monograph for pharmaceutical customers |
| India | State pollution control board consent to establish and operate under the Water and Air Acts, a check of whether prior environmental clearance under the EIA Notification, 2006, applies, factory license, FSSAI license for food grade, and a manufacturing license from the state drug licensing authority under the Drugs and Cosmetics Rules, 1945, for IP grade |
Key glycerin manufacturers and recent developments
Leading producers are integrated palm, oilseed and oleochemical groups. Wilmar International, Musim Mas, KLK OLEO and IOI Oleochemical anchor Southeast Asian supply, and Musim Mas also owns a refinery at Delfzijl, Netherlands, with more than 200,000 tons of capacity. ADM, Cargill and Louis Dreyfus Company refine biodiesel crude in the Americas, while Emery Oleochemicals, Oleon and Godrej Industries serve personal care and chemical buyers. Makers of glycerol monostearate and propylene glycol are notable customers. Louis Dreyfus opened a 55,000-ton USP refinery in Lampung, Indonesia, in May 2025, a sign of crushers moving downstream.
- June 2026: JJ-Lurgi Malaysia said it secured its first project in Colombia, a 160-ton-a-day glycerin refining plant, with the client not named.
- March 2026: The U.S. EPA finalized Renewable Fuel Standard volumes for 2026 and 2027, with biomass-based diesel totals of 9.07 billion and 9.20 billion RINs. Record mandates support U.S. crude glycerin output, though part of the volume is renewable diesel that yields none.
- July 2026: Indonesia, which said in January it would keep B40, launched mandatory B50 on July 1 and targeted full distribution by Oct. 1. Officials projected 2026 biodiesel demand of up to 17.6 million kiloliters, implying roughly 1.5 million tons of glycerol at an assumed 10% yield by weight.
What's inside the Glycerin project report PDF
The report runs to 21 chapters. Open a chapter to see its sections.
1. Preface
2. Scope and Methodology
- 2.1 Objectives of the Study
- 2.2 Stakeholders
- 2.3 Research Methodology
- 2.4 Data Sources and Key Assumptions
3. Executive Summary
- 3.1 Market Snapshot
- 3.2 Project at a Glance (Capacity, CapEx, OpEx)
- 3.3 Key Financial Indicators (IRR, NPV, Payback, Break-even)
- 3.4 Feasibility Verdict
4. Product Overview
- 4.1 Glycerin Definition and Properties
- 4.2 Grades and Specifications (BIS / ISO / ASTM)
- 4.3 HS Code and Classification
- 4.4 Key Applications
- 4.5 Substitutes
5. Global Glycerin Market
- 5.1 Market Overview
- 5.2 Historical and Current Market Performance (Volume and Value)
- 5.3 Market Breakup by Grade / Type
- 5.4 Market Breakup by End-Use Industry
- 5.5 Market Breakup by Region
- 5.6 Market Drivers, Restraints and Trends
- 5.7 Value Chain Analysis
- 5.8 Market Forecast
6. Target Country Glycerin Market Analysis
- 6.1 Demand and Supply Analysis
- 6.2 Installed Capacity vs Demand Gap
- 6.3 Import Dependence
- 6.4 Demand Forecast by End-Use
7. Trade Analysis
- 7.1 Imports by Volume, Value and Country
- 7.2 Exports by Volume, Value and Country
- 7.3 Trade Balance and Opportunities
8. Price Analysis
- 8.1 Historical Glycerin Price Trends by Region
- 8.2 Raw Material / Feedstock Price Trends and Linkage
- 8.3 Price Forecast
- 8.4 Margins Across the Value Chain
9. Competitive Landscape
- 9.1 Market Structure
- 9.2 Key Players and Installed Capacities
- 9.3 Profiles of Key Players
- 9.4 Recent Developments (Expansions, M&A, New Plants)
10. Manufacturing Process and Technology
- 10.1 Comparison of Technology Routes
- 10.2 Selected Route and Process Flow Diagram
- 10.3 Unit Operations Involved
- 10.4 Chemical Reactions Involved
- 10.5 Mass Balance and Raw Material Requirements
- 10.6 Energy Balance
- 10.7 Quality Assurance Criteria and Technical Tests
- 10.8 By-products and Waste Handling
- 10.9 Technology Licensors / Providers
11. Project Details, Requirements and Costs
- 11.1 Land, Location and Site Development
- 11.1.1 Site Selection Criteria
- 11.1.2 Location Analysis
- 11.1.3 Land Requirement and Costs
- 11.1.4 Site Development Costs
- 11.2 Plant Layout
- 11.2.1 Layout Principles
- 11.2.2 Proposed Layout
- 11.2.3 Factors Influencing Layout
- 11.3 Civil Works and Buildings
- 11.4 Plant Machinery
- 11.4.1 Machinery Requirements and Specifications
- 11.4.2 Machinery Costs
- 11.4.3 Machinery Suppliers
- 11.5 Raw Materials
- 11.5.1 Requirements per Tonne of Output
- 11.5.2 Procurement and Sourcing
- 11.5.3 Costs
- 11.5.4 Suppliers
- 11.6 Packaging
- 11.6.1 Packaging Requirements
- 11.6.2 Packaging Costs
- 11.6.3 Packaging Suppliers
- 11.7 Storage and Material Handling
- 11.8 Transportation Requirements and Costs
- 11.9 Utilities
- 11.9.1 Power Requirements and Costs
- 11.9.2 Water Requirements and Costs
- 11.9.3 Steam, Fuel and Other Utilities
- 11.10 Manpower Requirements and Wages
12. Environment, Health, Safety and Sustainability
- 12.1 Effluent and Emissions Management
- 12.2 Hazard Classification and Safety Measures
- 12.3 Carbon Footprint
- 12.4 Green / Low-Carbon Process Options
13. Regulatory Procedures, Approvals and Certifications
- 13.1 Licences and Registrations
- 13.2 Environmental Clearances
- 13.3 Product Certifications (BIS, REACH, etc.)
- 13.4 Approval Timeline
14. Project Implementation Schedule
15. Project Economics
- 15.1 Capital Cost of the Project
- 15.2 Techno-Economic Parameters
- 15.3 Capacity Utilization and Ramp-up
- 15.4 Product Pricing and Margins
- 15.5 Income Projections
- 15.6 Expenditure Projections
- 15.7 Working Capital Requirement
- 15.8 Taxation
- 15.9 Depreciation
16. Financial Analysis
- 16.1 Projected Profit and Loss Account
- 16.2 Projected Cash Flow Statement
- 16.3 Projected Balance Sheet
- 16.4 Liquidity Analysis
- 16.5 Profitability Analysis (Payback, NPV, IRR, ROI)
- 16.6 Break-even Analysis
- 16.7 Debt Service Coverage Ratio (DSCR)
- 16.8 Sensitivity Analysis
- 16.9 Scenario and Uncertainty Analysis
17. Funding and Incentives
- 17.1 Means of Finance and Debt-Equity Structure
- 17.2 Loans and Financial Assistance
- 17.3 Government Schemes and Subsidies (PLI, State Policies)
18. Risk Assessment
- 18.1 Key Success Factors
- 18.2 Key Risk Factors
- 18.3 Risk Mitigation
19. Strategic Recommendations
20. Case Study of a Successful Venture
21. Appendix
- 21.1 Detailed Assumptions
- 21.2 Abbreviations
- 21.3 List of Tables and Figures
- 21.4 Sources
This page vs. the full report
| Data point | On this page (free) | In the full report |
|---|---|---|
| Total CapEx | One rounded range at one capacity | Exact figure at three capacities with a line-item breakup |
| CapEx breakup | Category shares (%) only | Cost, quantity and supplier for every machine |
| Operating cost | Share of raw materials, utilities and labor | Per-unit cost sheet with each input price and consumption |
| Profitability | Gross margin range and payback band | Exact IRR, NPV, ROI, break-even and DSCR |
| Financial statements | List of what is included | 10-year P&L, cash flow, balance sheet and Excel model |
| Sensitivity | One directional line | Full sensitivity and scenario tables |
| Process | Simplified flow diagram | Detailed process flow, mass and energy balance, operating conditions |
| Machinery | Names of the main machines | Specifications, capacity, cost and supplier list |
| Market | Headline size, growth and global demand | Segment, region, trade and price forecast tables |
| Suppliers and buyers | Supplier types and sourcing hubs | Named suppliers and buyers |
Glycerin project report: FAQs
How much does it cost to set up a glycerin plant?
Is glycerin made or refined?
What is the HS code for glycerin?
What is the profit margin in glycerin refining?
What is the payback period for a glycerin plant?
Which approvals does a glycerin refinery need?
How do biodiesel mandates affect glycerin prices?

About the analyst
Nisha Gupta, Senior Research Analyst
Nisha Gupta is a Senior Research Analyst at Credence Research Inc. who works across industry domains, including packaging, automotive parts and machinery. Her focus is the modelling engine behind each study: she builds quantitative market databases and econometric forecasting frameworks, and developed automated Excel-based market modelling templates that cut client turnaround time by 30%.
Related market research
- Oleochemicals Market Size, Growth, Share and Forecast 2032
- Biodiesel Market Size, Trends, Share, Growth and Forecast 2032
- Propylene Glycol Market Size, Share, Trends and Forecast 2032
- Glycerol Monostearate Market Size, Trends, Share & Forecast 2032
- Polyglycerol Raw Materials Market Size, Growth & Trend 2032
- Oleochemicals in Cosmetics Market Size & Growth 2032
More plant project reports
- Recycled Plastic Manufacturing Plant Project Report (DPR) 2026
- Grease Manufacturing Plant Project Report (DPR) 2026
- Naphthalene Balls Manufacturing Plant Project Report (DPR) 2026
- Formaldehyde Manufacturing Plant Project Report (DPR) 2026
- Sulfuric Acid Manufacturing Plant Project Report (DPR) 2026
- Engine Oil Manufacturing Plant Project Report (DPR) 2026