Shippers now buy temperature control as a contracted service
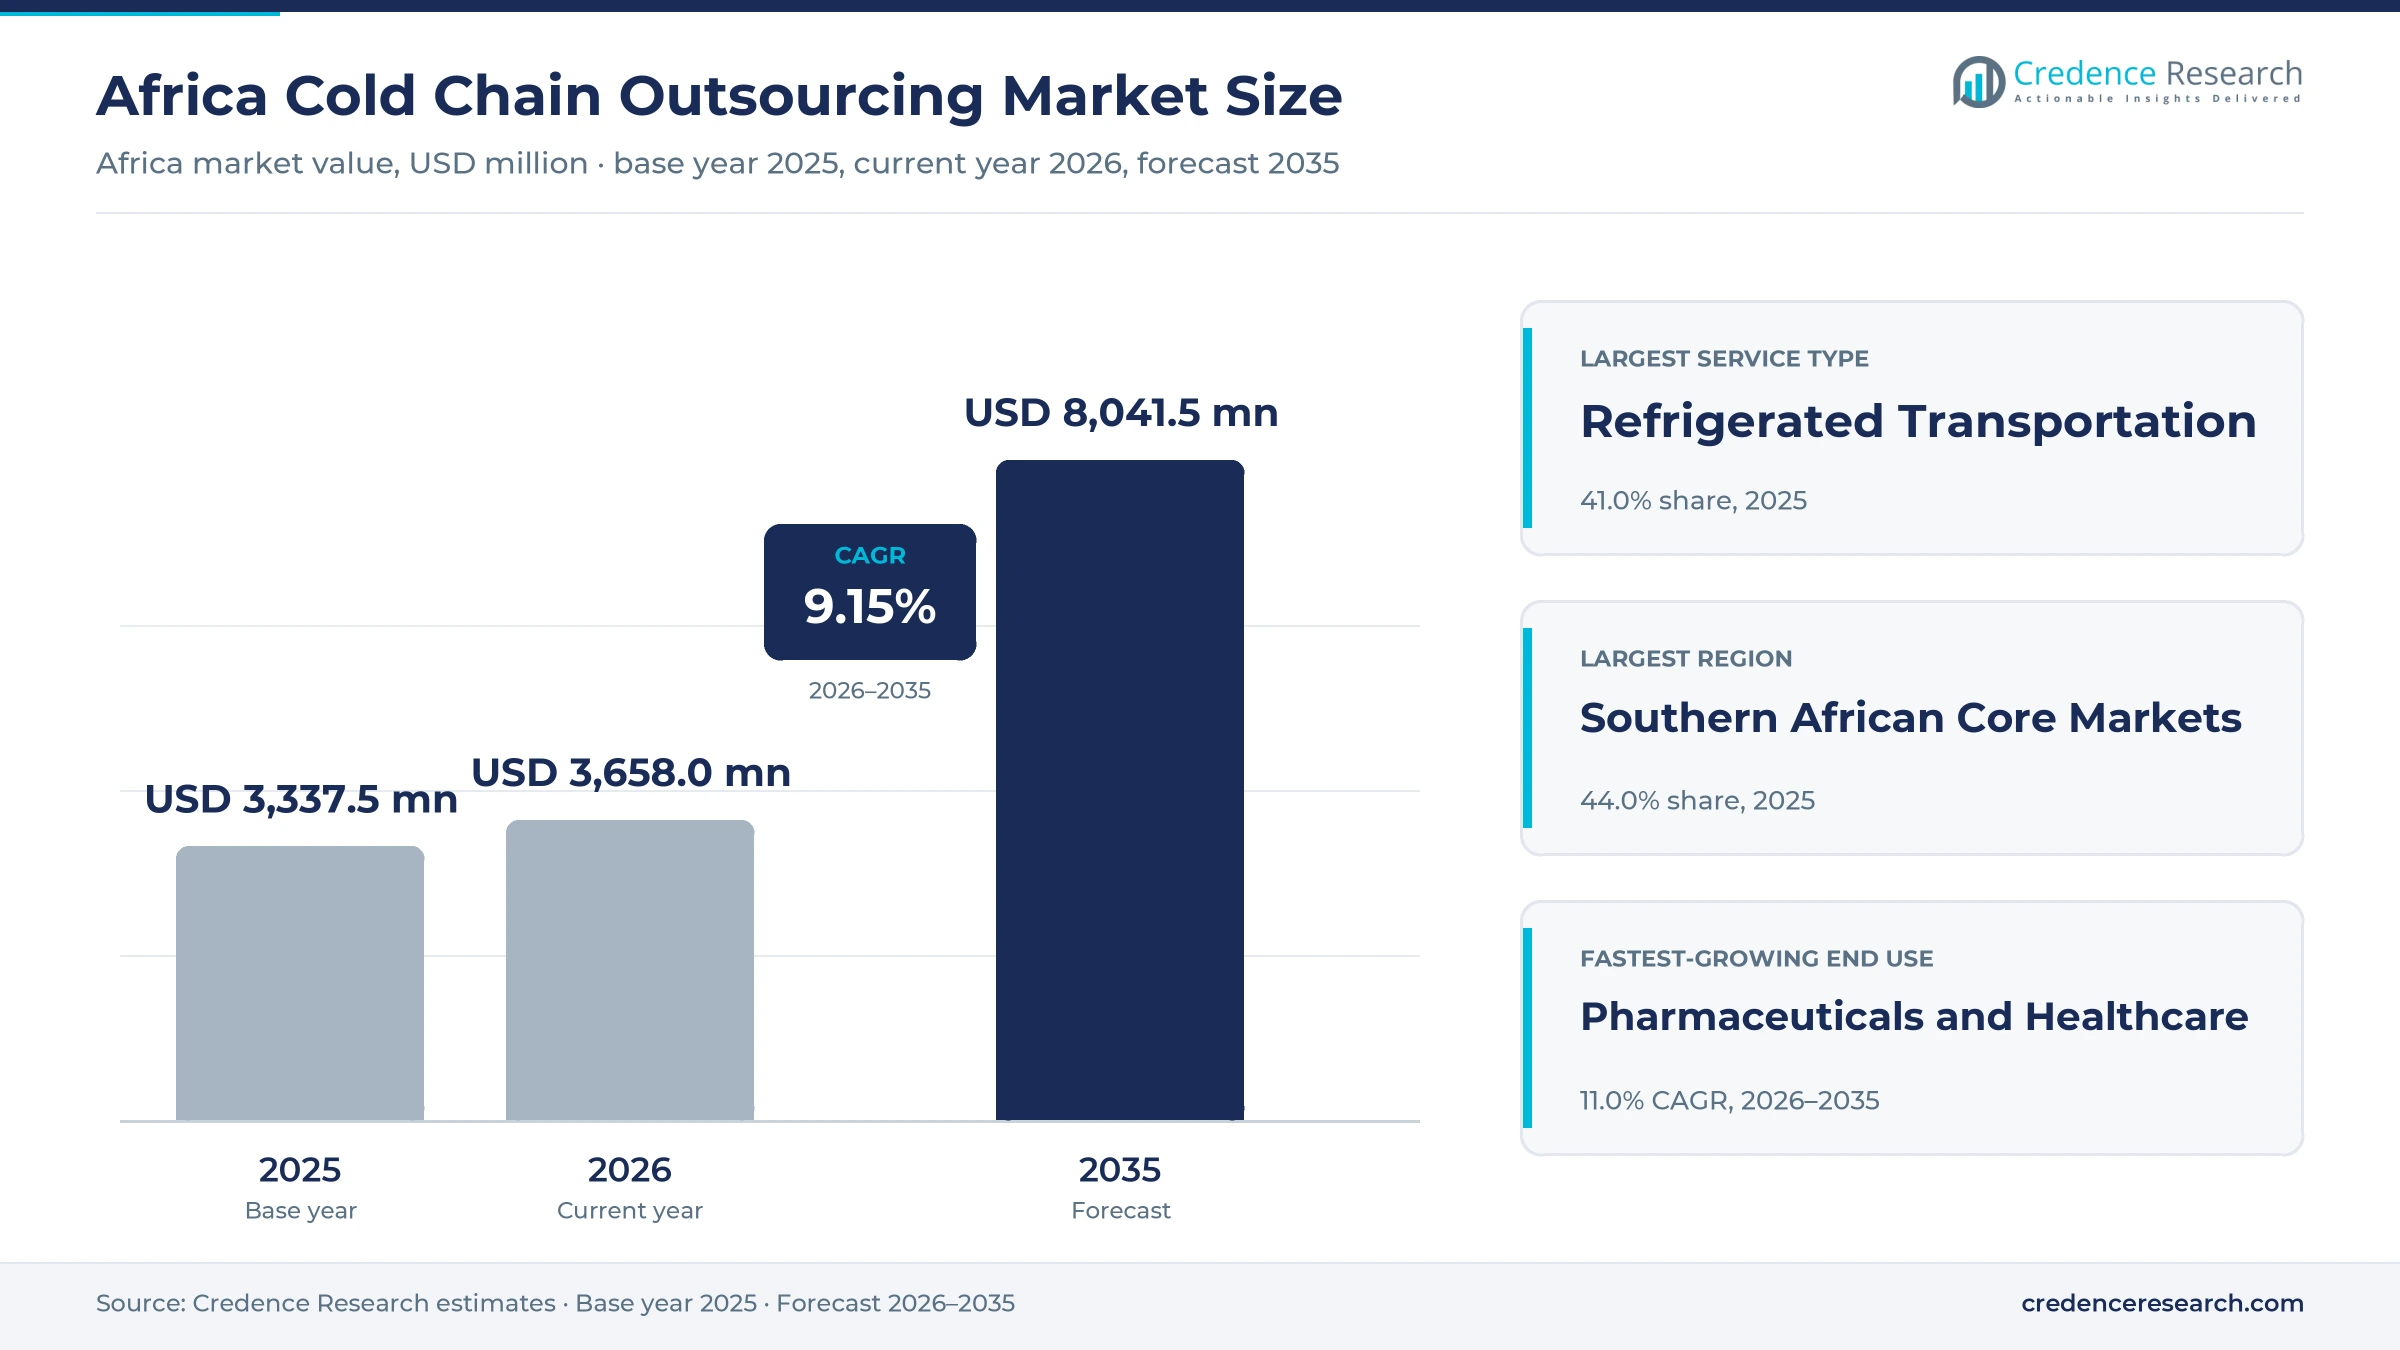
The Africa cold chain outsourcing market was valued at USD 3.34 billion in 2025 and is projected to increase from USD 3.66 billion in 2026 to USD 8.04 billion by 2035, registering a CAGR of 9.15% during 2026–2035. Demand comes from fruit, flower and seafood exporters, food retailers and drug distributors that pay specialist operators to move and hold goods at controlled temperatures instead of running their own refrigerated fleets and stores. Southern African Core Markets held the largest regional share, 44.0% in 2025, because South Africa's citrus and grape export system relies on port-side cold stores run by third parties. East and West African Core Markets is the fastest-growing region at 10.4% a year, as Kenyan flower freight and new West African vaccine capacity add demand. A major commercial change came on Oct. 28, 2025, when Maersk inaugurated its Belcon cold store in Cape Town and completed a R1.72 billion South African cold-store program. Shipping lines now compete directly with local cold-store owners for export pallets.
Third-party transport, storage and handling fees define the scope
The market counts fees paid to third parties for refrigerated road, air, sea and rail-linked transport, cold storage, value-added handling such as precooling, cold treatment, labeling and picking, and specialist healthcare distribution. Buyers sign dedicated multi-year contracts, book shared space by the pallet or pay per crate, kilogram or day, and many accounts combine storage and transport under one operator.
The count excludes refrigerated fleets and cold rooms that producers, retailers and hospitals own and run themselves, as well as sales of reefer equipment, packaging and monitoring hardware. Value passes from equipment makers and landlords to cold-store operators, forwarders and carriers, which then sell controlled-temperature capacity to exporters, distributors and healthcare buyers.
Africa Cold Chain Outsourcing Market Insights
- The market rises from USD 3.34 billion in 2025 to USD 8.04 billion by 2035, a 9.15% CAGR as exporters, retailers and drug distributors hand temperature control to specialist operators.
- Southern African Core Markets held 44.0% of 2025 value because South Africa has the largest base of third-party port-side cold stores on the continent.
- Refrigerated Transportation led with 41.0% of 2025 value, as inland farms and packhouses move nearly every export pallet by reefer truck or container.
- Maersk inaugurated its Belcon cold store in Cape Town on Oct. 28, 2025, completing a R1.72 billion program that put a shipping line into direct cold-store competition.
- An AIIM-led group bought 70% of Port Elizabeth Cold Storage in November 2025, showing how infrastructure funds are consolidating fragmented private cold stores into networks.
Reefer trucking and fresh food anchor contract value
Reefer transport leads as healthcare services grow fastest
Based on service type, the market is categorized into refrigerated transportation, cold storage, value-added services and specialist healthcare and last-mile services. Refrigerated Transportation led with 41.0% of 2025 value because South Africa exports about 61% of its fruit output, roughly 3.7 million tons, according to Creamer Media, and nearly all of it moves by reefer truck and container. Specialist Healthcare and Last-Mile Services grow fastest at 10.9% a year as Kuehne+Nagel opened an airside healthcare facility at OR Tambo International Airport in December 2022 for drug importers and manufacturers. Specialists increasingly attach temperature-controlled last-mile delivery to those pharmacy and hospital accounts.
Road links dominate while sea-linked flows gain ground
Based on mode of transport, the market is categorized into road-linked services, air-linked services, sea-linked services and rail-linked services. Road-Linked Services led with 58.0% of 2025 value because farms and packhouses sit far inland, and only 20 Standard Gauge Railway wagons in Kenya are fitted for refrigerated cargo, according to the Fresh Produce Exporters Association of Kenya. Sea-Linked Services grow fastest at 10.2% a year as Kenyan avocado shipments, which mostly travel by reefer container, keep rising. Air still matters for flowers, since Network Airline Management flew 3,100 tons of Kenyan flowers to Liège before Valentine's Day 2026.
Fresh food leads as vaccine plants lift healthcare demand
Based on end-use industry, the market is categorized into fresh food and beverages, pharmaceuticals and healthcare, floriculture and horticulture, and processed food and temperature-sensitive retail goods. Fresh Food and Beverages led with 46.0% of 2025 value because Egypt alone shipped a record 9.5 million tons of agricultural exports in 2025, according to its Ministry of Agriculture and Land Reclamation. Pharmaceuticals and Healthcare grows fastest at 11.0% a year as new plants need validated pharmaceutical logistics from their first batch, including the Dakar facility that IFC financed in December 2024 for up to 300 million doses a year. Flower growers remain a premium but seasonal account group for air-linked operators.
Dedicated contracts lead while pay-per-use cooling scales
Based on business model, the market is categorized into dedicated contract logistics, shared-user logistics and pay-per-use logistics. Dedicated Contract Logistics led with 49.0% of 2025 value because food brands hand whole distribution networks to one operator, a model Vector Logistics ran for 18 years inside RCL Foods before AP Moller Capital completed its purchase of the business in August 2023. Pay-Per-Use Logistics grows fastest at 11.1% a year as solar cold rooms run by ColdHubs in Nigeria extended produce shelf life from two days to 21, according to Creamer Media in August 2024. Shared-user stores, such as the 4,000-pallet Beemsterboer site opened in Nairobi in October 2023, sit between the two models.
| Segment Group | Leading Sub-segment | Share, 2025 | Fastest-growing Sub-segment | CAGR, 2026–2035 |
|---|---|---|---|---|
| By Service Type | Refrigerated Transportation | 41.0% | Specialist Healthcare and Last-Mile Services | 10.9% |
| By Mode of Transport | Road-Linked Services | 58.0% | Sea-Linked Services | 10.2% |
| By End-Use Industry | Fresh Food and Beverages | 46.0% | Pharmaceuticals and Healthcare | 11.0% |
| By Business Model | Dedicated Contract Logistics | 49.0% | Pay-Per-Use Logistics | 11.1% |
Freight and storage fees follow weight, distance and time
Pricing in the market follows three meters, weight for air, distance for road and time for storage, and each responds to a different cost. Kenyan exporters pay about USD 2.5 to USD 2.8 per kilogram for air freight, while Asia to U.S. routes earn airlines up to USD 8, which explains why carriers move capacity away from Nairobi. Road haulage costs USD 5 to USD 8 per kilometer per TEU in Africa, against USD 1 to USD 2 in Asia, according to the Shippers Council of Eastern Africa. Storage fees are small per unit, so operators earn margin through occupancy and handling charges. Buyers gain most by consolidating volume with fewer providers on longer contract terms.
| Offer or segment | Typical price or fee | Basis |
|---|---|---|
| Air-linked perishables freight, Kenya to Europe | USD 2.5–2.8 per kg | Floral Daily, November 2024 |
| Containerized road haulage, Africa | USD 5–8 per km per TEU | Shippers Council of Eastern Africa via FreshPlaza, March 2025 |
| Pay-per-use solar cold room, Nigeria | About USD 0.50 (NGN 100) per crate per day | ColdHubs via IFPRI |
| First-mile cold storage, Kenya | KSh 1 per kg or piece | SokoFresh via EnergyBase, September 2020 |
Request a Free Sample
Fill in your details and we'll send you a free sample report.
- Sample data tables & charts
- Research methodology
Vaccine plants and port-side stores lift outsourced volume
Commercial vaccine manufacturing needs validated cold capacity
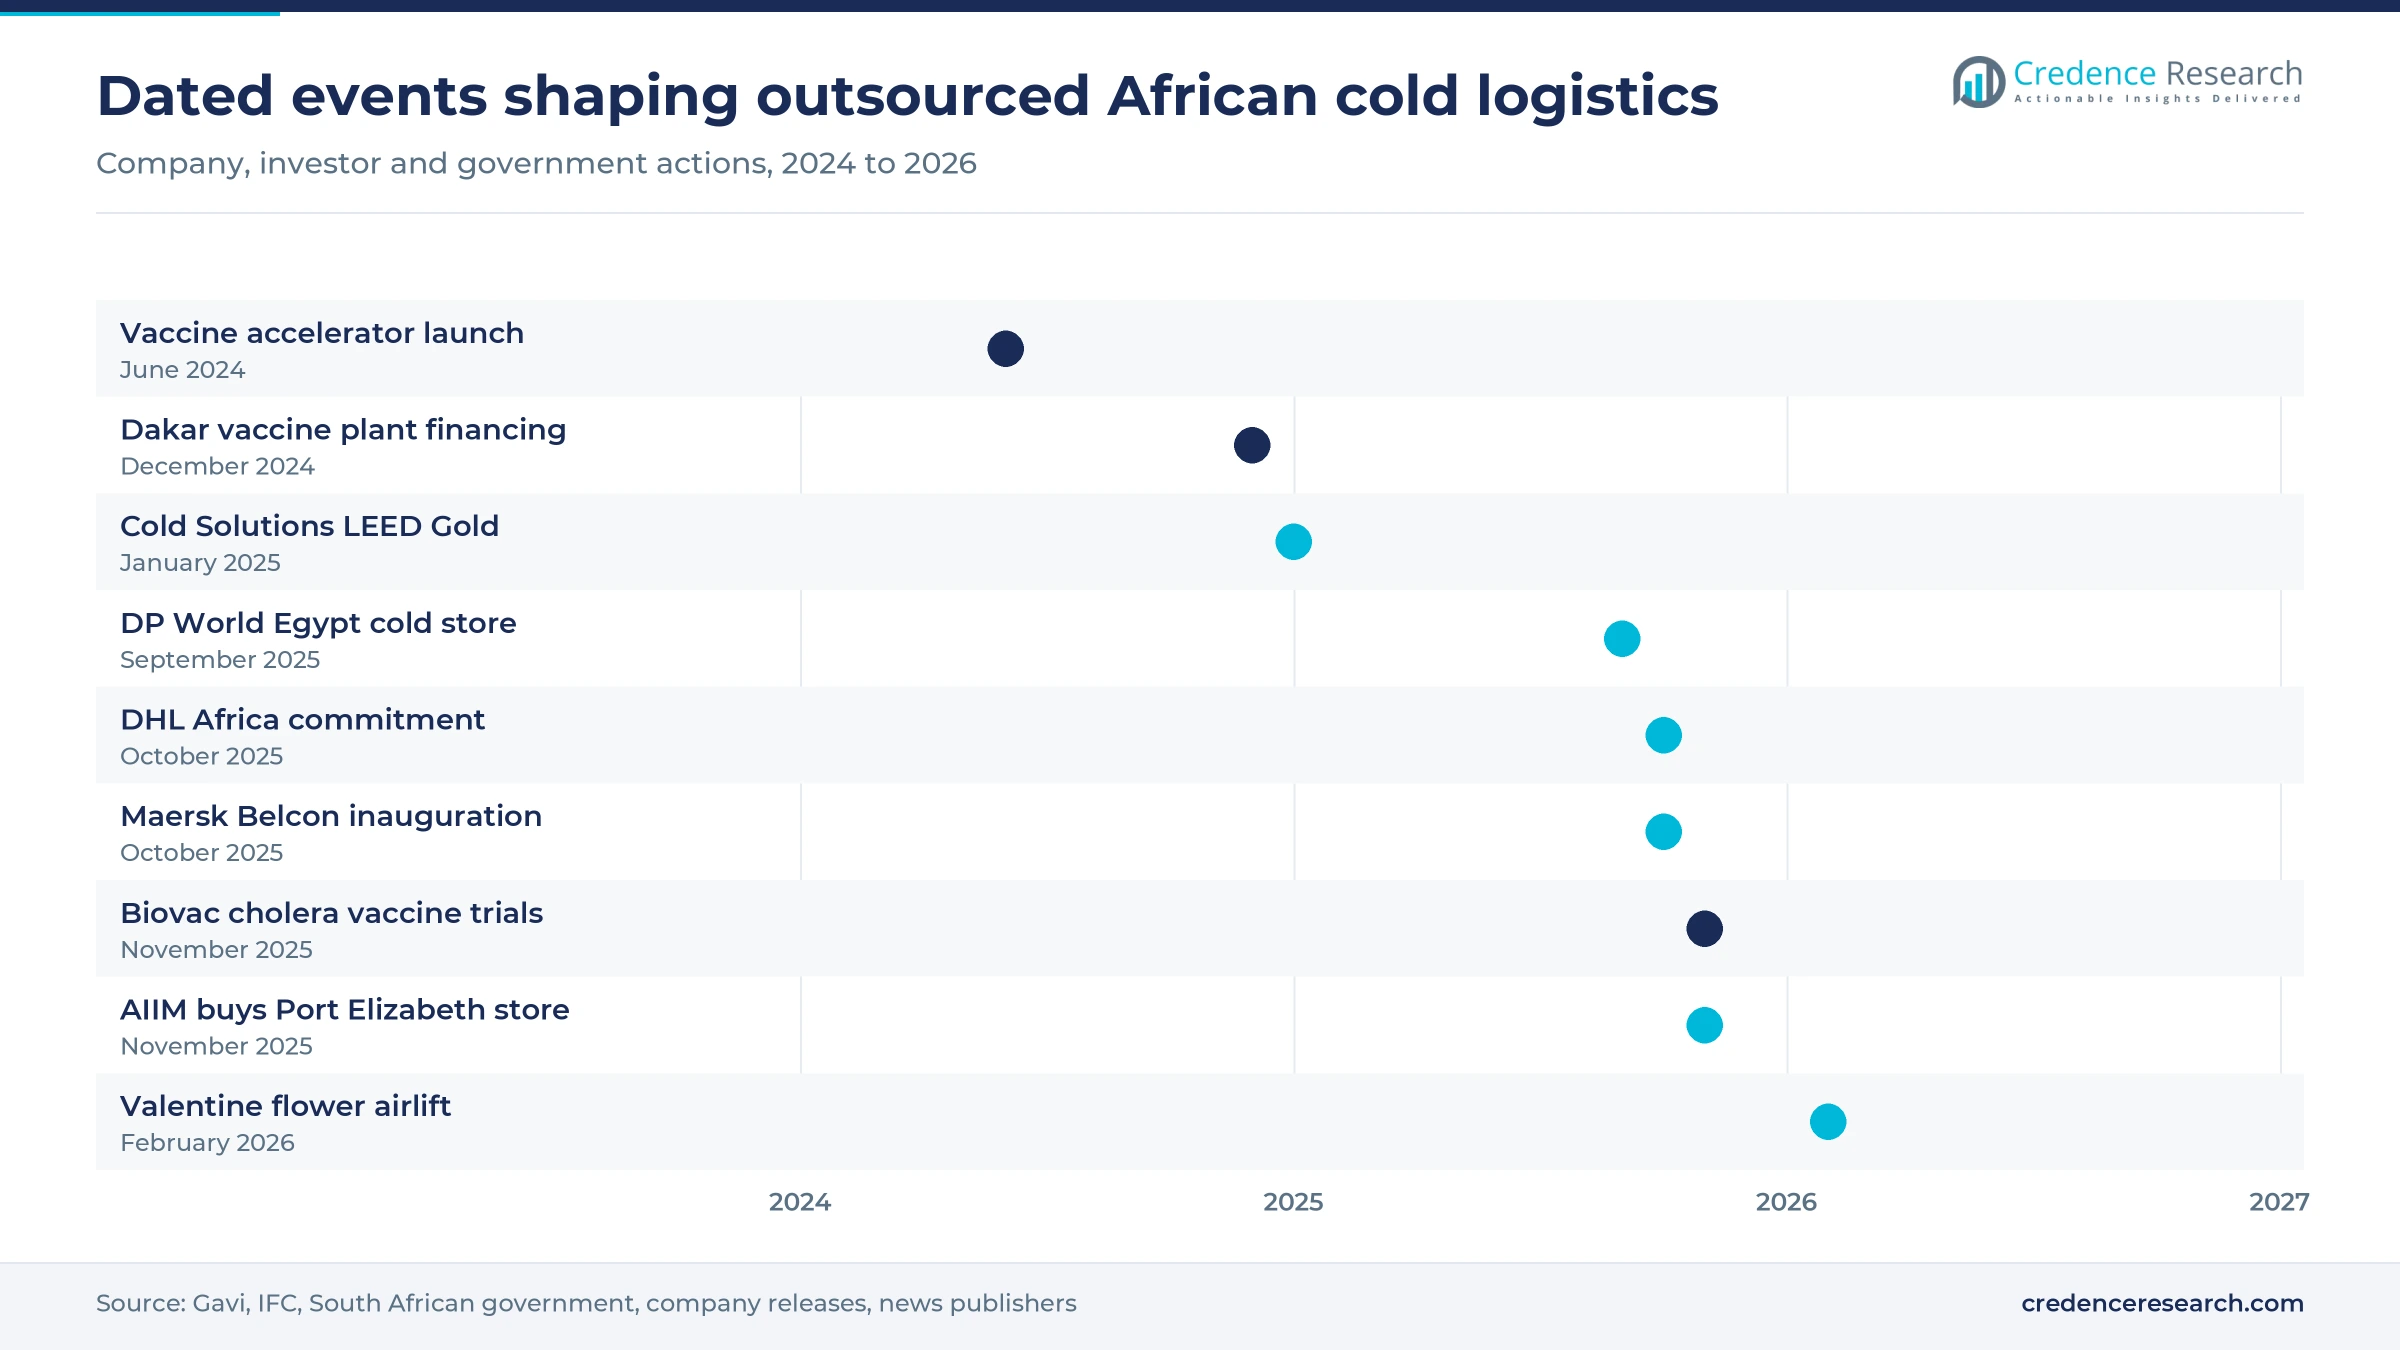
Commercial vaccine manufacturing lifts outsourced demand because new African plants must ship finished doses under validated conditions from the first batch, and few own refrigerated fleets. Gavi said the African Vaccine Manufacturing Accelerator launched in June 2024 and has attracted USD 1.2 billion in pledges, while African producers supply only about 0.1% of world vaccine output. Biovac received SAHPRA clearance for oral cholera vaccine trials, and the South African government said on Nov. 11, 2025 that approval could follow in 2028. BioNTech is also building a modular mRNA plant in Kigali for clinical and commercial supply. DHL Group committed more than EUR 300 million to sub-Saharan Africa on Oct. 15, 2025, including temperature-sensitive healthcare capacity. Each plant that reaches commercial output needs a validated outbound lane from day one, and few manufacturers will build their own.
Perishable export infrastructure moves to port-side operators
Perishable export infrastructure is moving to third-party operators because exporters need precooling and inspection space beside the quay rather than on distant farms. Maersk's Belcon store, the final step in the Cape Town program noted above, has 10,088 pallet positions, 240 reefer plug points and six Steri chambers, and it received its first pallets in May 2025, according to Creamer Media. DP World is investing about USD 29 million in a 25,000-pallet store in Egypt's Elsewedy Industrial Park, FreightWaves reported in September 2025. South African packers shipped 164.5 million citrus cartons in 2024, and the Citrus Growers Association targets 260 million cartons by 2032. Each extra carton needs several refrigerated moves between packhouse, store and quay, so export growth lifts trucking and storage revenue together.
Institutional cold-storage consolidation builds networks
Institutional cold-storage consolidation lifts outsourcing because investors are buying fragmented private stores and selling the space as a network to large shippers. Commercial Cold Holdings began in October 2022 when an AIIM-led group agreed to invest up to USD 150 million, starting with CCS Logistics and its roughly 100,000 pallets across Johannesburg, Cape Town and Walvis Bay. In November 2025 AIIM bought 70% of Port Elizabeth Cold Storage, adding about 15,000 pallet positions and widening the platform's footprint by 10%, according to Engineering News. In Kenya, Cold Solutions holds up to 18,000 pallets at Tatu City and earned LEED Gold certification in January 2025. Such platforms offer one contract across several ports, which suits exporters that ship through more than one terminal.
Post-harvest losses push growers toward paid cooling
Post-harvest losses push growers and traders toward paid cooling because each spoiled crate is an immediate cash cost that storage fees can undercut. The FAO estimates losses of 40% to 50% for roots, tubers, fruit and vegetables in sub-Saharan Africa, against 25% to 30% for animal products. The Global Cold Chain Alliance noted in June 2025 that South Africa has only about 13 cubic meters of cold storage per 1,000 residents, even though it is the best-served market on the continent. SokoFresh cut post-harvest losses for its Kenyan customers to about 2% and serves more than 7,500 smallholders, according to Creamer Media. Results like these let operators charge per crate and still leave growers better off than with spoiled produce.
Sea freight and pharma compliance reshape service demand
Sea-linked perishable flows rise as air capacity tightens
Sea freight is rising as a share of perishable movements because reefer containers cost less per kilogram than aircraft holds and offer steadier bookings. Floral Daily reported in November 2024 that about 5% of cut roses shipped to Europe now go by sea, a share that could reach 19% by 2030 if Red Sea routes stabilize. In South Africa, the 2026 citrus crop was expected at 205 million to 210 million cartons, most of it shipped in reefer containers. The Kenya Ports Authority also plans to lift Mombasa to 2.4 million TEUs from 2 million in 2024. Operators with reefer plugs and precooling near the quay capture the volume that moves from air to sea.
Pharma-grade compliance is emerging as the entry ticket
Healthcare buyers are making documented compliance a condition of award, and that shift moves drug distribution toward specialist operators with audited sites. DSV says its Johannesburg and Cape Town pharmaceutical warehouses are SAHPRA approved and fully compliant with good distribution practice, with ISO 9001 and ISO 13485 certification. Bidvest International Logistics wrote in January 2026 that it follows WHO and SAHPRA guidelines, using refrigerated vehicles, qualified packaging and calibrated data loggers on every temperature-sensitive shipment. AGL tripled its temperature-controlled area at the Abidjan Aerohub to 1,800 square meters in June 2023 for pharmaceutical, retail and catering clients. Local truckers without validated equipment and trained pharmacists are likely to lose healthcare tenders to these networks, while compliant operators can price their audit costs into longer contracts.
Opportunity in pay-per-use cooling at the first mile
First-mile cooling offers an opening because smallholders cannot fund cold rooms, yet they will pay a small fee for each kilogram stored. SokoFresh designs its Kenyan service around buyer-paid and farmer-paid fees per kilogram, adds a success fee on market sales and assumes about 10 months of use a year, according to EnergyBase. The Kigali Amendment commits 152 states to phasing down HFC refrigerants, which favors operators that can finance efficient new systems. Energy Partners reported that a cooling-as-a-service contract for a large South African dairy avoids 6,000 tons of emissions a year. Operators that pool these small contracts can turn rural cold rooms into feeder sites for packhouses and port stores.
Opportunity in intra-African cross-border cold freight
Cross-border cold freight inside Africa is an opening because most current capacity faces Europe, while regional trade in perishables is still small. The Global Cold Chain Alliance reported in June 2025 that cold chain-related products make up about 5% of African trade by value, and that intra-African trade accounts for only 10% to 15% of that value. The European Union takes more than 40% of import values and 35% of export values in these products. The African Continental Free Trade Area is projected to raise intra-African trade by 45% and agri-food output by 60% by 2045. Operators with bonded cold stores at border corridors can therefore sell regional distribution to dairy, meat and frozen food brands that now rely on imports.
Port delays, reefer gaps and weak power raise costs
Port congestion erodes shelf life and raises landed cost
Port congestion erodes the value of refrigerated capacity, because reefer cargo loses shelf life while ships wait at anchor. The World Bank port performance index for 2024, released Sept. 22, 2025, covered 403 ports, and The Citizen reported that Durban ranked last while Cape Town placed 400th. Mombasa ranked 375th of the 403 ports, according to The Eastleigh Voice in Kenya. Exporters respond by booking more buffer storage, which raises landed cost. Operators controlling precooling near the quays gain pricing power from this weakness.
Reefer container shortages leave peak demand unmet
Equipment imbalance leaves exporters short of refrigerated boxes in peak weeks, because imports from Asia arrive in dry containers while perishable exports need reefers. FreshPlaza reported in April 2026 that up to 55% of peak reefer demand went unmet at Durban in 2024, with a deficit of about 30% at Mombasa. Carriers now reposition non-operating reefers loaded with dry cargo to close the gap. Inland exporters still pay extra to move empty units, which squeezes margins for fruit packers.
Weak grid access raises the cost of running cold rooms
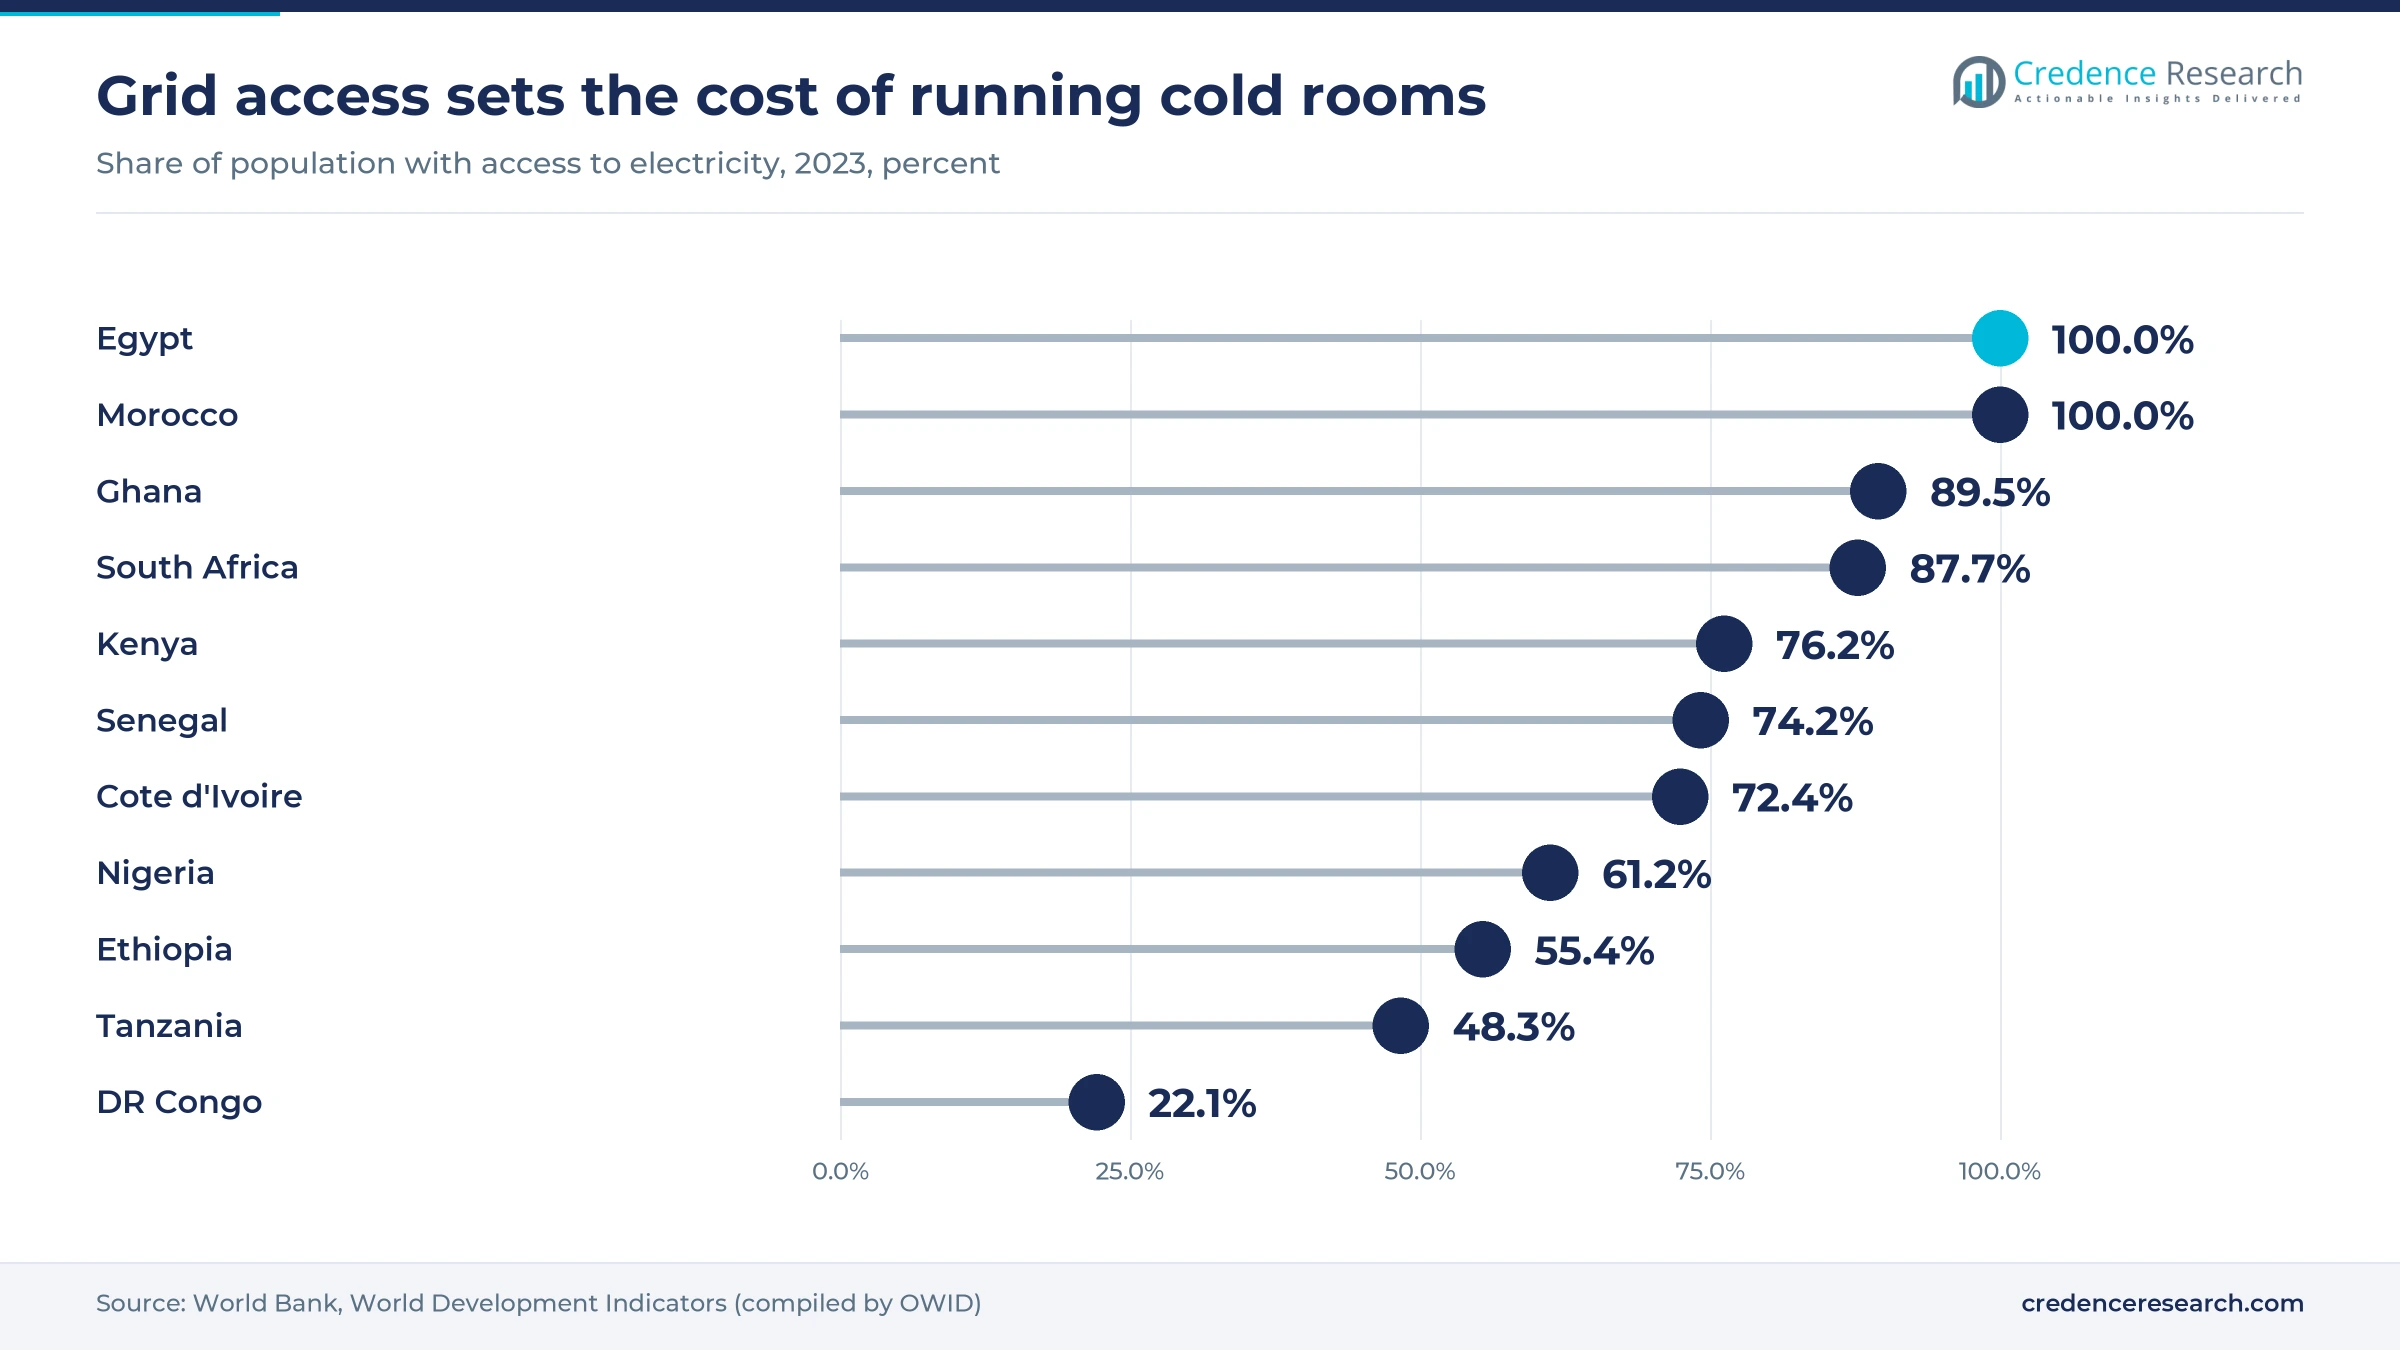
Weak grid access raises the cost of cold rooms outside the main cities, since operators must add generators, batteries or solar arrays. World Bank development indicators show electricity access of 48.3% in Tanzania, 55.4% in Ethiopia and 22.1% in the Democratic Republic of the Congo in 2023, against 100% in Egypt and Morocco. Inland sites in those countries carry higher energy and backup capital costs. Operators therefore concentrate capacity near ports, leaving rural first-mile demand underserved.
Broken handovers still destroy perishable value
Broken handovers between farm, truck, store and ship still destroy value, because each transfer risks a temperature excursion. South Africa's table grape industry was estimated to lose up to R1.5 billion a year from delays and broken cold chains, according to Creamer Media in October 2025. The Global Cold Chain Alliance also cites skills shortages in cold storage management and refrigerated transport. Buyers are likely to demand end-to-end temperature records and penalties, which favors operators that control several links.
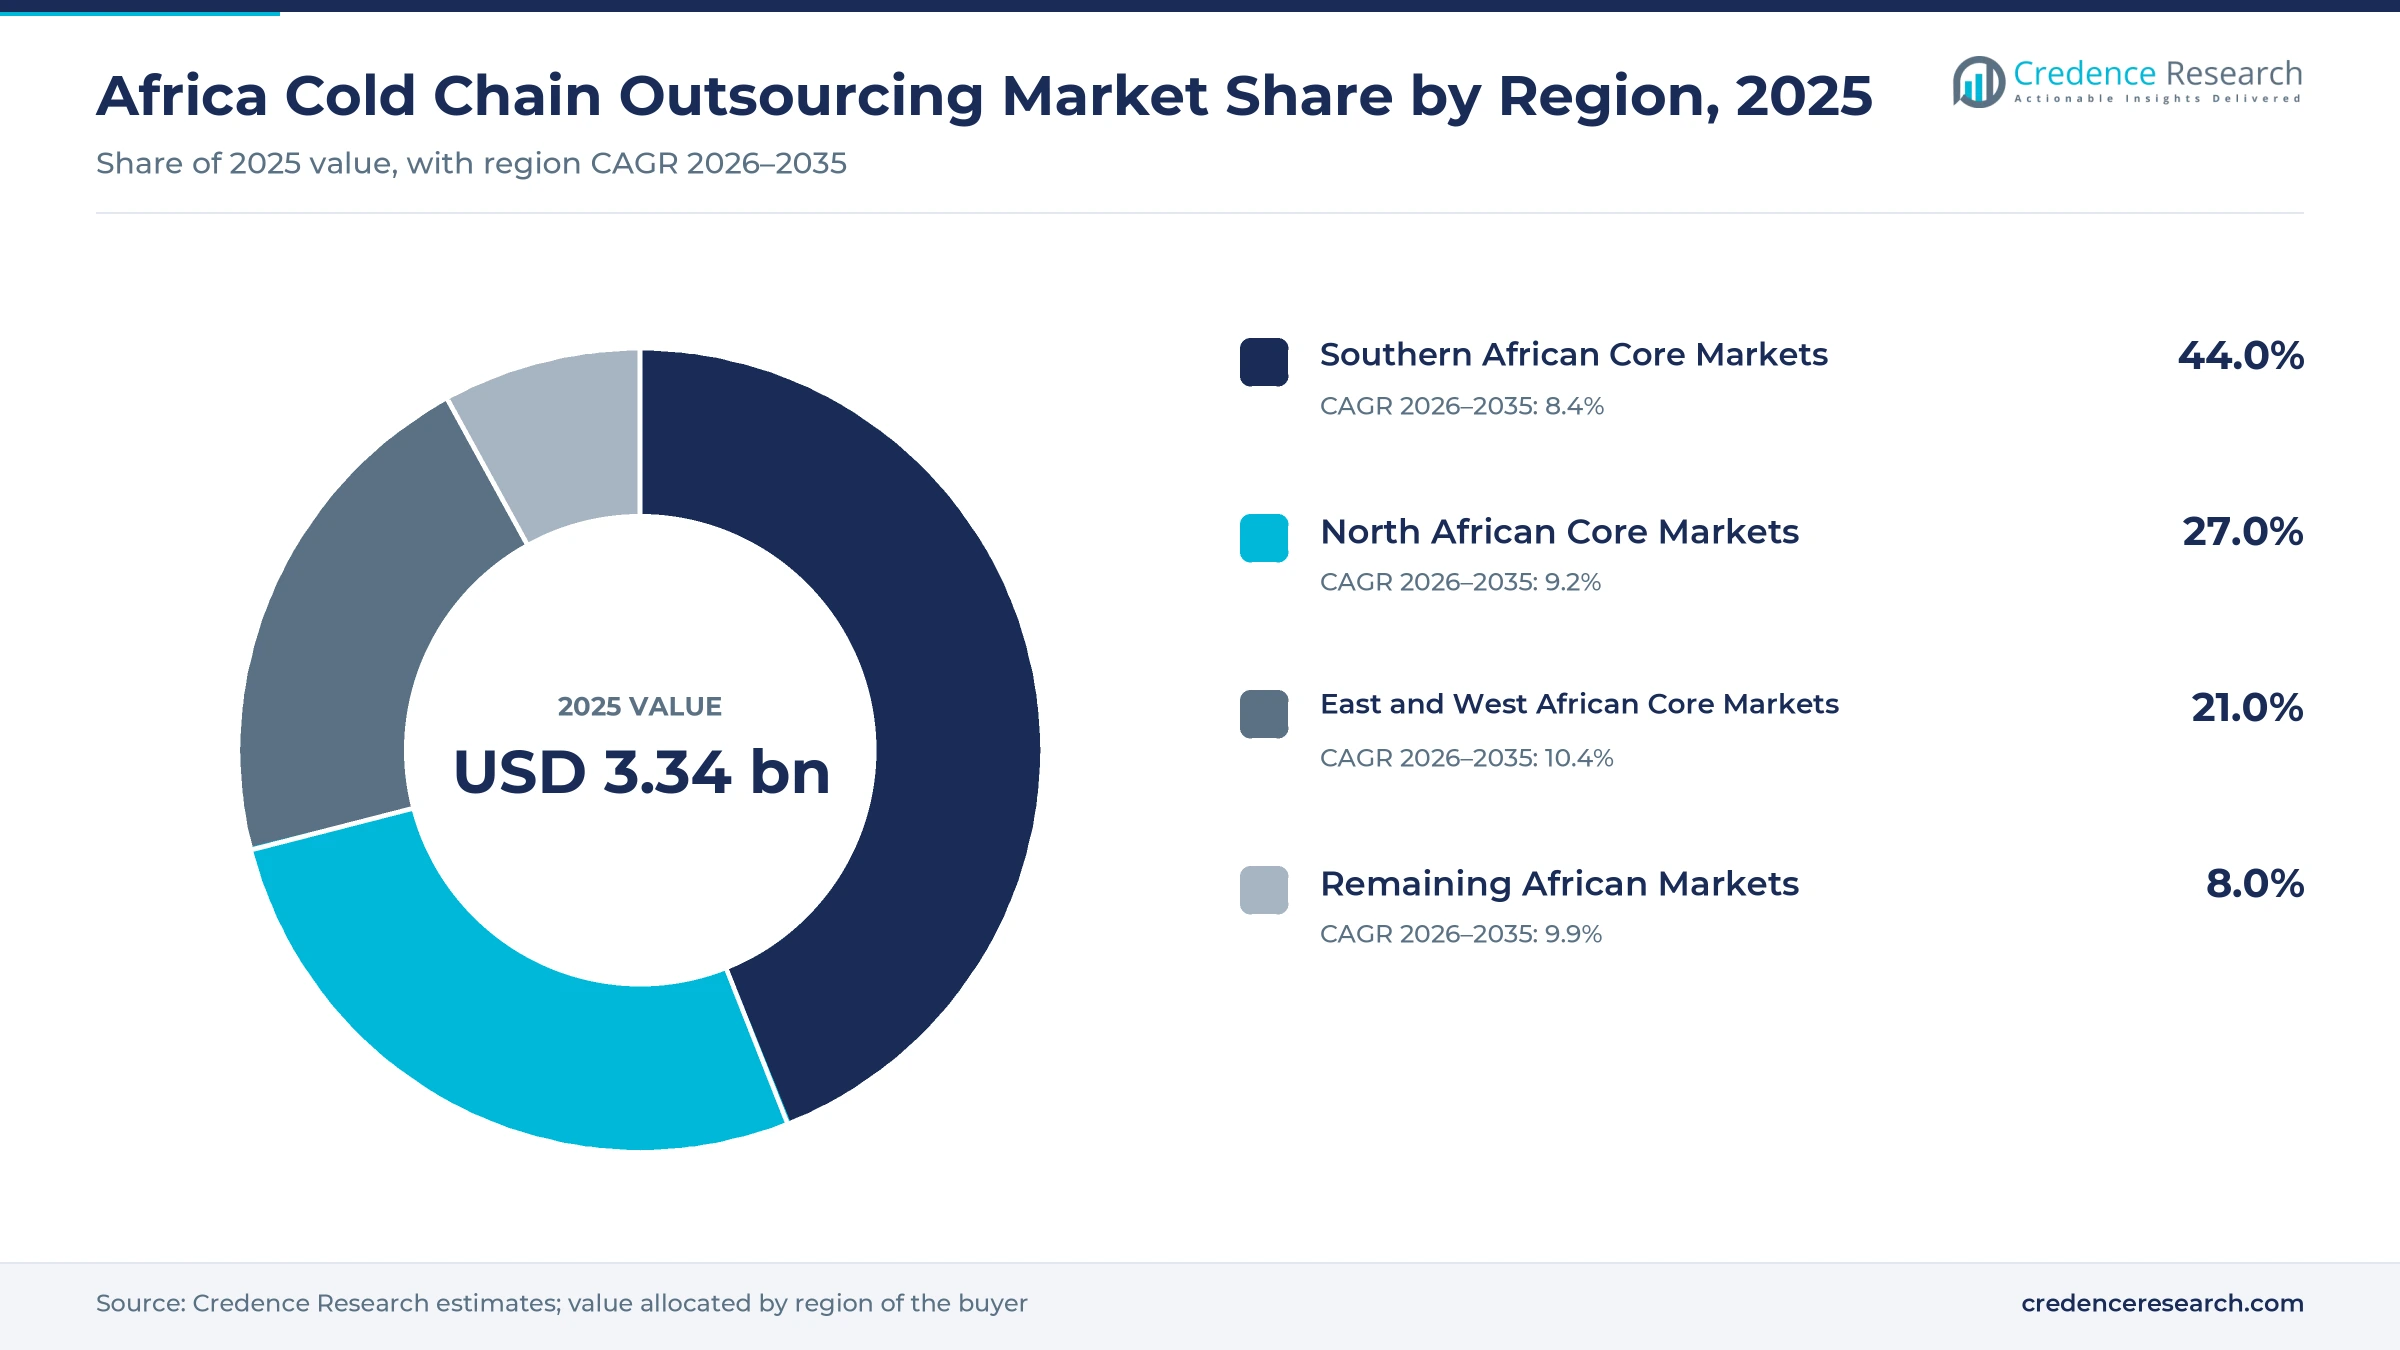
Southern hubs lead as East and West Africa grow fastest
| Region | Value, 2025 (USD billion) | Share, 2025 | CAGR, 2026–2035 |
|---|---|---|---|
| Southern African Core Markets | 1.47 | 44.0% | 8.4% |
| North African Core Markets | 0.90 | 27.0% | 9.2% |
| East and West African Core Markets | 0.70 | 21.0% | 10.4% |
| Remaining African Markets | 0.27 | 8.0% | 9.9% |
Southern African Core Markets lead on port-side cold stores
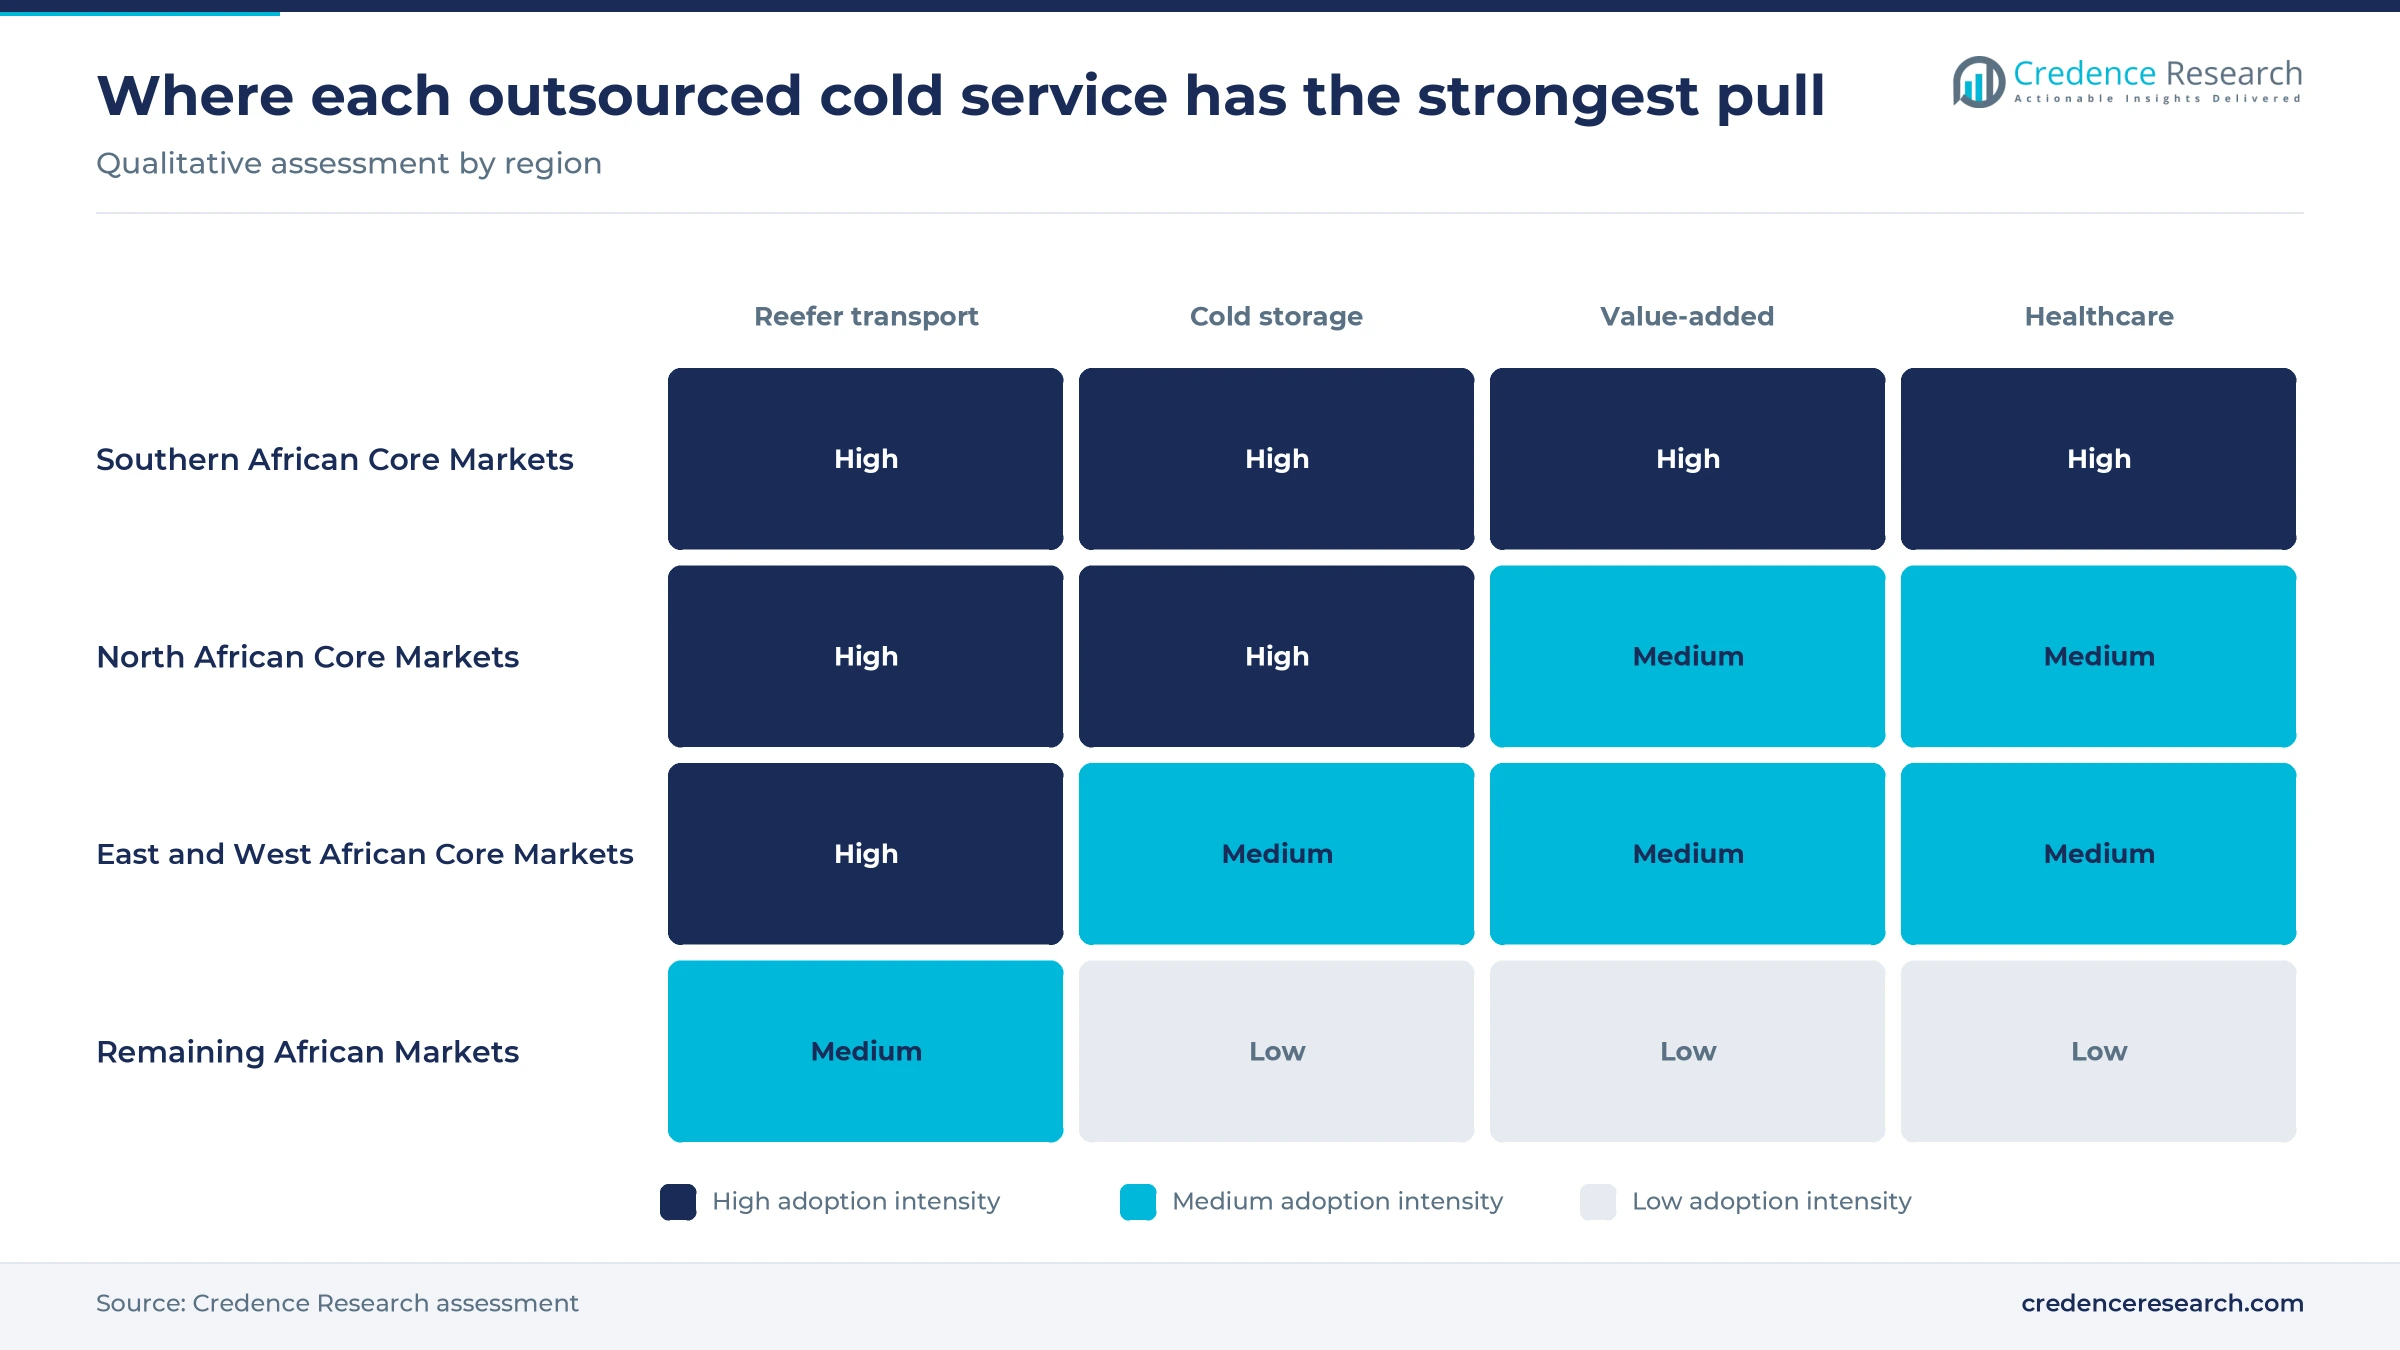
Southern African Core Markets held 44.0% of 2025 value and grow at 8.4% a year because South Africa combines the deepest third-party cold-store base with large fruit exports. Port Elizabeth Cold Storage alone handles more than 200,000 pallets of citrus a year, about 8% of national citrus exports. Maersk's three stores and the Commercial Cold Holdings platform add capacity at the same ports, so new space competes for existing fruit volume rather than opening new corridors. Regional demand grows more slowly than in the other three regions because the installed base is already large and port performance caps volume gains.
North African Core Markets grow on Egyptian exports
North African Core Markets held 27.0% of 2025 value and grow at 9.2% a year, led by Egypt and Morocco. Egypt's fresh food exports rose from USD 10.6 billion in 2024 to USD 11.5 billion in 2025, with citrus near 2 million tons, according to Business Today Egypt. The Citizen reported that Port Said and Tanger Med ranked among the 20 best ports in the 2024 World Bank index. DP World's 25,000-pallet Elsewedy store, noted above, is the first large third-party addition aimed at that export flow.
East and West African Core Markets grow fastest on flowers
East and West African Core Markets held 21.0% of 2025 value and are the fastest region at 10.4% a year. Kenya's floriculture exports reached about USD 835 million in 2024, and the Kenya Flower Council expected about KSh 110 billion in 2025, according to Capital FM. The World Bank listed Dakar among developing-country ports with noteworthy score improvements between 2020 and 2024, which eases sea-linked access for Senegalese exporters and importers. In Nigeria, off-grid solar cold rooms such as ColdHubs, noted above, fill gaps that grid-tied stores cannot reach.
Remaining African Markets build from small flower and port bases
Remaining African Markets held 8.0% of 2025 value and grow at 9.9% a year from a small base. Rwanda had 6,162 cubic meters of cold storage in 2019, and 58% of it served export flowers, according to the Global Cold Chain Alliance. Namibia's Walvis Bay hosts one of the CCS Logistics cold stores that serve fish and food traders. The alliance describes Zambia's cold chain as underdeveloped, with poor roads that worsen in the rainy season, which limits contract scale.
Funds, carriers and vaccine makers moved first in 2024–2026
| Development | Status and market relevance |
|---|---|
| In December 2024, IFC and partners arranged USD 45 million for Institut Pasteur de Dakar's planned MADIBA vaccine plant near Dakar. | Planned, and the plant will need validated outbound distribution for West African vaccine supply. |
| In September 2025, DP World committed about USD 29 million to a 25,000-pallet temperature-controlled warehouse in Egypt's Elsewedy Industrial Park. | Under development, adding port-linked capacity for Egyptian food exporters and importers. |
| In October 2025, Maersk inaugurated its Belcon cold store in Cape Town, its third South African cold store. | Operating, and it links rail and truck access to the Port of Cape Town for fruit exporters. |
| In November 2025, AIIM acquired 70% of Port Elizabeth Cold Storage in the Coega Port Zone for Commercial Cold Holdings. | Completed, consolidating Eastern Cape citrus storage into a national cold-store platform. |
| In February 2026, Network Airline Management ran 31 freighter rotations between Nairobi and Liège for the Valentine's flower peak. | Completed, and it shows how air-linked operators add charters to meet seasonal flower demand. |
Solar rooms, data loggers and cold treatment change service
- Solar-powered cold rooms let operators such as ColdHubs and SokoFresh store produce at farm gates without grid power, priced per crate or kilogram.
- Calibrated data loggers record temperatures throughout each pharmaceutical shipment, which Bidvest International Logistics treats as standard under SAHPRA guidance.
- Steri chambers for cold treatment hold fruit at set temperatures to meet importing-country pest protocols, and Maersk installed them at its Cape Town store.
- Energy-efficient warehouse design cuts power costs, and Cold Solutions became the only African temperature-controlled warehouse with LEED Gold status.
Need a Custom Version of This Report?
Tailor the scope, geography, or segments to your exact requirements.
- Custom geography or segment scope
- Direct access to our analyst team
Shipping lines and funds now control scarce capacity
Competition in Africa cold chain outsourcing splits between global integrators and local platforms, and each group is moving onto the other's ground. Maersk and DP World use shipping and port positions to sell storage next to the quay, while DHL Supply Chain, Kuehne+Nagel, DSV and Bidvest International Logistics compete for pharmaceutical accounts with audited sites. Commercial Cold Holdings, backed by an AIIM-led investor group, is buying established private stores, and Vector Logistics serves food brands through multi-temperature distribution under AP Moller Capital ownership. Africa Global Logistics serves West African pharmaceutical and catering clients from its Abidjan Aerohub, and Cold Solutions competes in Kenya with large modern capacity. Buyers compare temperature records, port access and geographic reach before awarding contracts. Large exporters increasingly reward operators that combine precooling, cold treatment and container booking, because one contract reduces the number of handovers where cargo can warm.
Capacity is concentrated at ports and thin inland
Supply is organized in three tiers that differ in capital, reach and customers. Global carriers and forwarders such as Maersk, DP World, DHL, Kuehne+Nagel and DSV own port-side stores and healthcare hubs, while infrastructure funds such as Commercial Cold Holdings buy local stores and run them as networks. Local specialists, including Vector Logistics, Cold Solutions and solar cooling start-ups, serve retail distribution and the first mile. Concentration is highest in South African port storage and lowest in inland trucking. Capital is the main barrier, since the Belcon store alone cost R800 million, and margins sit mostly in storage occupancy and value-added handling.
Companies profiled and their roles in this market
| Company | Type | Role in the market |
|---|---|---|
| Maersk | Shipping line and logistics provider | Runs three South African cold stores, including Belcon in Cape Town opened in October 2025 |
| DP World | Port operator and logistics provider | Developing a 25,000-pallet temperature-controlled warehouse in Egypt |
| Commercial Cold Holdings | Cold-store platform | AIIM-backed owner of CCS Logistics and Port Elizabeth Cold Storage |
| Vector Logistics | Food logistics provider | Multi-temperature warehousing and distribution in Southern Africa, owned by AP Moller Capital |
| DHL Supply Chain Africa | Contract logistics provider | Adding temperature-sensitive healthcare capacity under a multi-year sub-Saharan investment |
| Kuehne+Nagel Africa | Forwarder and contract logistics provider | Operates an airside healthcare facility at OR Tambo International Airport |
| DSV Africa | Forwarder and contract logistics provider | Runs SAHPRA-approved pharmaceutical warehouses in Johannesburg and Cape Town |
| Bidvest International Logistics | Healthcare logistics provider | Handles temperature-sensitive pharmaceuticals under WHO and SAHPRA guidelines |
| Africa Global Logistics | Port and contract logistics provider | Expanded temperature-controlled space at its Abidjan Aerohub for pharmaceutical and retail clients |
| Cold Solutions East Africa | Cold-store operator | Runs an 18,000-pallet LEED Gold facility at Tatu City in Kenya |
Port-side capacity matters more than truck count
Credence Research's view is that control of port-side capacity will decide who captures value in African cold chain outsourcing. Maersk, DP World and Commercial Cold Holdings are buying or building stores next to the quays, while port congestion makes that space more valuable every peak season. Healthcare adds a second, higher-margin layer, provided the planned vaccine plants reach commercial output. The most assumption-heavy estimate is the regional split, because few African states publish third-party cold-store capacity. Buyers should test operators on temperature records and port access in their own corridor, not on total pallet counts.
Model values rest on trade, capacity and price evidence
The report uses 2025 as the base year and 2026 to 2035 as the forecast period. Market values come from the Credence Research model, and regional, segment and business-model splits are Credence Research estimates informed by public data. Sources include World Bank and FAO publications, national ministry statistics, company releases, trade association statements and regional news publishers. No interviews or surveys were used to prepare this edition of the report. The cold chain outsourcing scope counts third-party service fees only and excludes captive fleets, owned cold rooms and equipment sales, as described in the market definition above.
Healthcare and sea freight widen the base to 2035
Credence Research expects the market to reach USD 8.04 billion by 2035 as exporters, retailers and healthcare buyers keep moving temperature control to cold chain outsourcing specialists. East and West African Core Markets should keep the fastest pace, while Southern African Core Markets remains the largest source of contract value. The service mix will move toward healthcare distribution, sea-linked perishable handling and pay-per-use cooling, and that shift favors operators with audited sites and port access. Port reform is the main swing factor, since faster terminals would release reefer capacity and cut buffer storage costs. Weak inland power and air capacity cuts remain the main risks to this outlook.
Port reform and vaccine uptake set the range to 2035
The range of outcomes depends mainly on port performance and on whether the planned African vaccine plants reach commercial output. Faster terminal reform would release reefer capacity and reduce buffer storage costs for exporters. Commercial approval of locally made vaccines would add steady healthcare volume that pays higher fees than produce. Weak power supply and new air capacity cuts are the main downside risks, and in that case annual demand growth would run 1.6 points below the base case.
| Scenario | CAGR, 2026–2035 | Value, 2035 | What has to hold |
|---|---|---|---|
| Downside | 7.6% | USD 7.04 billion | Port delays persist, reefer shortages deepen and African vaccine plants slip beyond 2030 |
| Base | 9.15% | USD 8.04 billion | Port performance improves slowly and planned cold stores and vaccine plants open close to schedule |
| Upside | 10.6% | USD 9.02 billion | Terminal reform succeeds, sea freight replaces air for flowers and vaccine output scales quickly |
Frequently Asked Questions
How big is the Africa cold chain outsourcing market?
Which region leads outsourced temperature-controlled logistics in Africa?
Which region is growing fastest?
Which service type holds the largest share?
Why does vaccine manufacturing matter for this market?
What is holding the market back?
How do operators charge for these services?
Who are the main companies in this market?
Table of Content
Chapter 1 Market Segmentation
- 1.1 Segmentation Framework
- 1.1.1 Product and Service Classification
- 1.1.2 Application and End-Use Classification
- 1.1.3 Technology and Solution Classification
- 1.1.4 Customer and Distribution Channel Classification
- 1.1.5 Geographic Segmentation
- 1.1.6 Market Segment Definitions and Boundaries
- 1.2 By Service Type
- 1.2.1 Refrigerated Transportation
- 1.2.2 Cold Storage
- 1.2.3 Value-Added Services
- 1.2.4 Specialist Healthcare and Last-Mile Services
- 1.3 By Mode of Transport
- 1.3.1 Road-Linked Services
- 1.3.2 Air-Linked Services
- 1.3.3 Sea-Linked Services
- 1.3.4 Rail-Linked Services
- 1.4 By End-Use Industry
- 1.4.1 Fresh Food and Beverages
- 1.4.2 Pharmaceuticals and Healthcare
- 1.4.3 Floriculture and Horticulture
- 1.4.4 Processed Food and Temperature-Sensitive Retail Goods
- 1.5 By Business Model
- 1.5.1 Dedicated Contract Logistics
- 1.5.2 Shared-User Logistics
- 1.5.3 Pay-Per-Use Logistics
Chapter 2 Introduction
- 2.1 Report Objectives and Scope
- 2.2 Product Definition and Industry Terminology
- 2.3 Market Inclusions and Exclusions
- 2.4 Research Process
- 2.4.1 Primary Research and Expert Interviews
- 2.4.2 Secondary Research and Source Review
- 2.4.3 Top-Down and Bottom-Up Estimation
- 2.4.4 Data Triangulation and Verification
- 2.5 Market Size Measurement Basis
- 2.5.1 2025: USD 3.34 billion → 2035: USD 8.04 billion
- 2.6 Historical and Forecast Reference Periods
- 2.6.1 Historical Period: 2018-2025
- 2.6.2 Base Year: 2025
- 2.6.3 Forecast Period: 2025-2035
- 2.7 Research Assumptions and Limitations
Chapter 3 Executive Summary
- 3.1 Market Snapshot and Key Findings
- 3.2 Base-Year Market Size, 2025
- 3.3 Forecast Market Size, 2035
- 3.4 Revenue and Volume Growth Outlook
- 3.5 Key Demand and Supply Indicators
- 3.6 Leading Market Segments
- 3.7 Fastest-Growing Market Opportunities
- 3.8 Regional Performance Highlights
- 3.9 Technology and Industry Transformation
- 3.10 Competitive Landscape Summary
- 3.11 Analyst View and Strategic Implications
Chapter 4 Africa Cold Chain Outsourcing Market Trends and Developments
- 4.1 Historical Industry Development, 2018-2025
- 4.2 Recent Market Trends and Developments
- 4.3 Demand and Customer Behavior Trends
- 4.4 Technology and Product Innovation
- 4.5 Artificial Intelligence, Automation and Digitalization
- 4.6 Local Manufacturing and Supply Chain Realignment
- 4.7 Industry Partnerships, Mergers and Acquisitions
- 4.8 Sustainability and Circular Economy Developments
- 4.9 Government and Private Sector Investment Trends
- 4.10 Emerging Business Models and Commercialization
- 4.11 Industry Developments and Announcements
Chapter 5 Africa Cold Chain Outsourcing Market Supply and Demand Analysis
- 5.1 Demand Trend and Consumption Analysis, 2018-2025
- 5.2 Demand Forecast, 2025-2035
- 5.3 Supply Chain Structure and Procurement Trends
- 5.4 Supply-Demand Gap and Bottlenecks
- 5.5 Import Dependence and Sourcing Structure
- 5.6 Regional Supply and Demand Concentration
Chapter 6 Africa Cold Chain Outsourcing Market Pricing Analysis
- 6.1 Pricing Structure and Measurement
- 6.2 Historical Pricing Trends, 2018-2025
- 6.3 Pricing Outlook, 2025-2035
- 6.4 Pricing by Product and Market Segment
- 6.5 Geographic Pricing Differences
- 6.6 Key Input, Energy, Labor and Logistics Costs
- 6.7 Contract Pricing and Purchasing Models
- 6.8 Pricing Sensitivity and Competitive Positioning
- 6.9 Price, Margin and Profitability Implications
Chapter 7 Africa Cold Chain Outsourcing Market Dynamics
- 7.1 Market Growth Drivers
- 7.1.1 Demand-Side Drivers
- 7.1.2 Technology and Innovation Drivers
- 7.1.3 Infrastructure and Investment Drivers
- 7.1.4 Regulatory and Policy Drivers
- 7.2 Market Restraints
- 7.2.1 Cost and Affordability Constraints
- 7.2.2 Technology and Adoption Barriers
- 7.2.3 Supply Chain and Operational Constraints
- 7.3 Market Challenges
- 7.3.1 Competitive Pressure and Margin Erosion
- 7.3.2 Skills, Infrastructure and Implementation Gaps
- 7.4 Emerging Market Opportunities
- 7.5 Market Dynamics Impact and Time-Horizon Assessment
Chapter 8 Africa Cold Chain Outsourcing Value Chain Analysis
- 8.1 Industry Value Chain Overview
- 8.2 Upstream Suppliers and Critical Inputs
- 8.3 Technology and Component Providers
- 8.4 Manufacturing or Service Delivery
- 8.5 Distribution, Channel Partners and Integrators
- 8.6 Downstream Applications and End Users
- 8.7 Value Addition and Profit Pools
- 8.8 Vertical Integration and Outsourcing
- 8.9 Supplier Concentration and Risk
- 8.10 Supply Chain Localization and Resilience
Chapter 9 Africa Cold Chain Outsourcing Market Regulations and Policies
- 9.1 Relevant Laws, Standards and Compliance Frameworks
- 9.2 Product, Service, Safety and Quality Requirements
- 9.3 Government Policies, Incentives and Subsidies
- 9.4 Imports, Exports and Trade Barriers
- 9.5 Public Procurement and Local Content Requirements
- 9.6 Data Protection, AI and Cybersecurity Compliance
- 9.7 Upcoming Policy Changes and Market Implications
Chapter 10 Africa Cold Chain Outsourcing Market Hotspots and Opportunities
- 10.1 Market Opportunity Mapping and Growth Hotspots
- 10.2 High-Growth Applications and Customer Groups
- 10.3 Underserved Markets and White-Space Opportunities
- 10.4 Emerging Technology and Product Opportunities
- 10.5 New Capacity and Investment Hotspots
- 10.6 Market Entry and Expansion Opportunities
- 10.7 Distribution and Partnership Opportunities
- 10.8 Near-Term and Long-Term Commercial Potential
- 10.9 Opportunity Attractiveness and Execution Risks
Chapter 11 Africa Cold Chain Outsourcing Market Outlook, 2025-2035
- 11.1 Market Size and Analysis
- 11.1.1 Revenue (Market Measurement: 2025: USD 3.34 billion → 2035: USD 8.04 billion)
- 11.1.2 Historical Market Size, 2018-2025
- 11.1.3 Base-Year Market Size, 2025
- 11.2 Market Forecast, 2025-2035
- 11.2.1 Revenue Forecast to 2035
- 11.2.2 CAGR and Year-on-Year Growth
- 11.2.3 Incremental Revenue Opportunity
- 11.3 Forecast Assumptions and Scenario Analysis
- 11.3.1 Base-Case Forecast
- 11.3.2 Optimistic and Conservative Scenarios
- 11.3.3 Technology, Pricing and Policy Sensitivities
- 11.4 Market Attractiveness and Growth Outlook
Chapter 12 Africa Cold Chain Outsourcing Market Segmentation and Outlook
- 12.1 Segmentation Summary and Market Shares, 2025
- 12.2 Largest and Fastest-Growing Segments
- 12.3 By Service Type - Market Size and Forecast, 2025-2035
- 12.3.1 Segment Definition and Scope
- 12.3.2 Historical Market Size, 2018-2025
- 12.3.3 Revenue Forecast, 2025-2035
- 12.3.4 Base-Year Market Share, 2025
- 12.3.5 Segment CAGR and Growth Drivers
- 12.3.6 Subsegment Market Size and Forecast
- 12.3.6.1 Refrigerated Transportation
- 12.3.6.2 Cold Storage
- 12.3.6.3 Value-Added Services
- 12.3.6.4 Specialist Healthcare and Last-Mile Services
- 12.3.7 Subsegment Pricing and Adoption Trends
- 12.3.8 Leading Suppliers and Competition
- 12.3.9 Regional Demand and Opportunities
- 12.4 By Mode of Transport - Market Size and Forecast, 2025-2035
- 12.4.1 Segment Definition and Scope
- 12.4.2 Historical Market Size, 2018-2025
- 12.4.3 Revenue Forecast, 2025-2035
- 12.4.4 Base-Year Market Share, 2025
- 12.4.5 Segment CAGR and Growth Drivers
- 12.4.6 Subsegment Market Size and Forecast
- 12.4.6.1 Road-Linked Services
- 12.4.6.2 Air-Linked Services
- 12.4.6.3 Sea-Linked Services
- 12.4.6.4 Rail-Linked Services
- 12.4.7 Subsegment Pricing and Adoption Trends
- 12.4.8 Leading Suppliers and Competition
- 12.4.9 Regional Demand and Opportunities
- 12.5 By End-Use Industry - Market Size and Forecast, 2025-2035
- 12.5.1 Segment Definition and Scope
- 12.5.2 Historical Market Size, 2018-2025
- 12.5.3 Revenue Forecast, 2025-2035
- 12.5.4 Base-Year Market Share, 2025
- 12.5.5 Segment CAGR and Growth Drivers
- 12.5.6 Subsegment Market Size and Forecast
- 12.5.6.1 Fresh Food and Beverages
- 12.5.6.2 Pharmaceuticals and Healthcare
- 12.5.6.3 Floriculture and Horticulture
- 12.5.6.4 Processed Food and Temperature-Sensitive Retail Goods
- 12.5.7 Subsegment Pricing and Adoption Trends
- 12.5.8 Leading Suppliers and Competition
- 12.5.9 Regional Demand and Opportunities
- 12.6 By Business Model - Market Size and Forecast, 2025-2035
- 12.6.1 Segment Definition and Scope
- 12.6.2 Historical Market Size, 2018-2025
- 12.6.3 Revenue Forecast, 2025-2035
- 12.6.4 Base-Year Market Share, 2025
- 12.6.5 Segment CAGR and Growth Drivers
- 12.6.6 Subsegment Market Size and Forecast
- 12.6.6.1 Dedicated Contract Logistics
- 12.6.6.2 Shared-User Logistics
- 12.6.6.3 Pay-Per-Use Logistics
- 12.6.7 Subsegment Pricing and Adoption Trends
- 12.6.8 Leading Suppliers and Competition
- 12.6.9 Regional Demand and Opportunities
- 12.7 Segment Growth Comparison
- 12.8 Segment Attractiveness and Priority Matrix
Chapter 13 Africa Cold Chain Outsourcing End-Use and Application Market Outlook
- 13.1 End-Use Industry and Customer Demand Structure
- 13.2 Leading Applications and Customer Groups
- 13.3 End-Use Market Size, Share and Forecast
- 13.4 Major End-Use Industry Deep Dives
- 13.4.1 Customer Requirements and Use Cases
- 13.4.2 Demand and Replacement Cycles
- 13.4.3 Technical and Regulatory Considerations
- 13.4.4 Purchasing and Procurement Models
- 13.4.5 Leading Vendors and Distribution Channels
- 13.4.6 Forecast and Commercial Opportunities
- 13.5 Emerging Applications and Cross-Segment Demand
- 13.6 End-Use Industry Investment Priorities
Chapter 14 Africa Cold Chain Outsourcing Geographic Market Outlook, 2025-2035
- 14.1 Regional Market Size and Country-Level Shares, 2025
- 14.2 Country Market Size Comparison, 2025
- 14.3 Country Market Forecasts, 2025-2035
- 14.4 Subregional Industrial and Demand Clusters
- 14.5 Intra-Regional Pricing and Cost Differences
- 14.6 Cross-Border Trade and Supply Networks
- 14.7 Regional Supply and Demand Balances
- 14.8 Country Opportunity Comparison and Prioritization
Note: Every listed country is covered on the structure shown under the first country.
Chapter 15 Africa Cold Chain Outsourcing Technology, Innovation and Sustainability Outlook
- 15.1 Technology Landscape and Maturity
- 15.2 Product, Process and Service Innovation
- 15.3 AI, Automation and Digital Tools in the Industry
- 15.4 Technology Adoption and Performance Benchmarking
- 15.5 Innovation Pipeline and R&D Investment
- 15.6 Energy Efficiency and Resource Management
- 15.7 Sustainability, Recycling and Circularity
- 15.8 Technology Roadmap, 2025-2035
- 15.9 Risks of Obsolescence and Technology Substitution
Chapter 16 Africa Cold Chain Outsourcing Market Key Strategic Imperatives
- 16.1 Growth and Market Entry Priorities
- 16.2 High-Return Products and Segments
- 16.3 Pricing, Profitability and Cost Optimization
- 16.4 Technology Investment and Product Differentiation
- 16.5 Supply Chain Localization and Resilience
- 16.6 Distribution and Customer Acquisition
- 16.7 Partnership, Acquisition and Capacity Strategy
- 16.8 Regional Expansion Priorities
- 16.9 Short-, Medium- and Long-Term Actions
Chapter 17 Competition Outlook
- 17.1 Industry Competition Characteristics
- 17.2 Market Structure and Concentration
- 17.3 Market Share and Competitive Positioning, 2025
- 17.4 Company-Wise Revenue and Product Benchmarking
- 17.5 Production and Service Capacity Benchmarking
- 17.6 Technology, Pricing and Differentiation
- 17.7 Regional Footprint and Distribution Strength
- 17.8 Mergers, Acquisitions and Strategic Alliances
- 17.9 New Entrants and Competitive Threats
- 17.10 Porter's Five Forces and Industry Attractiveness
- 17.11 Competitive Outlook, 2025-2035
Chapter 18 Company Profiles
- 18.1 Company Coverage and Selection Criteria
- 18.2 Vector Logistics
- 18.2.1 Business Description
- 18.2.2 Company Ownership and Geographic Presence
- 18.2.3 Product and Service Portfolio
- 18.2.4 Manufacturing and Operating Footprint
- 18.2.5 Financial Performance and Investment
- 18.2.6 Market Share and Competitive Position
- 18.2.7 Technology and Innovation Capabilities
- 18.2.8 Strategic Alliances or Partnerships
- 18.2.9 Recent Developments
- 18.2.10 Growth Strategy and Outlook
- 18.3 DP World
- 18.4 DHL Supply Chain Africa
- 18.5 Kuehne+Nagel Africa
- 18.6 Commercial Cold Holdings
- 18.7 Africa Global Logistics
- 18.8 Bidvest International Logistics
- 18.9 DSV Africa
- 18.10 Maersk
- 18.11 Cold Solutions East Africa
- 18.12 Other Relevant Market Participants
Note: Every listed company is profiled on the structure shown under the first company. The company list is preliminary and may change based on research findings, market developments, data availability and client requirements.
Chapter 19 Disclaimer
- 19.1 Research and Forecast Disclaimer
- 19.2 Data Source and Estimation Limitations
Note: The depth of individual sections depends on data availability for this market. Volume, capacity, trade and other unit-based metrics are included where applicable.