Record vehicle output keeps resin demand on a steep path
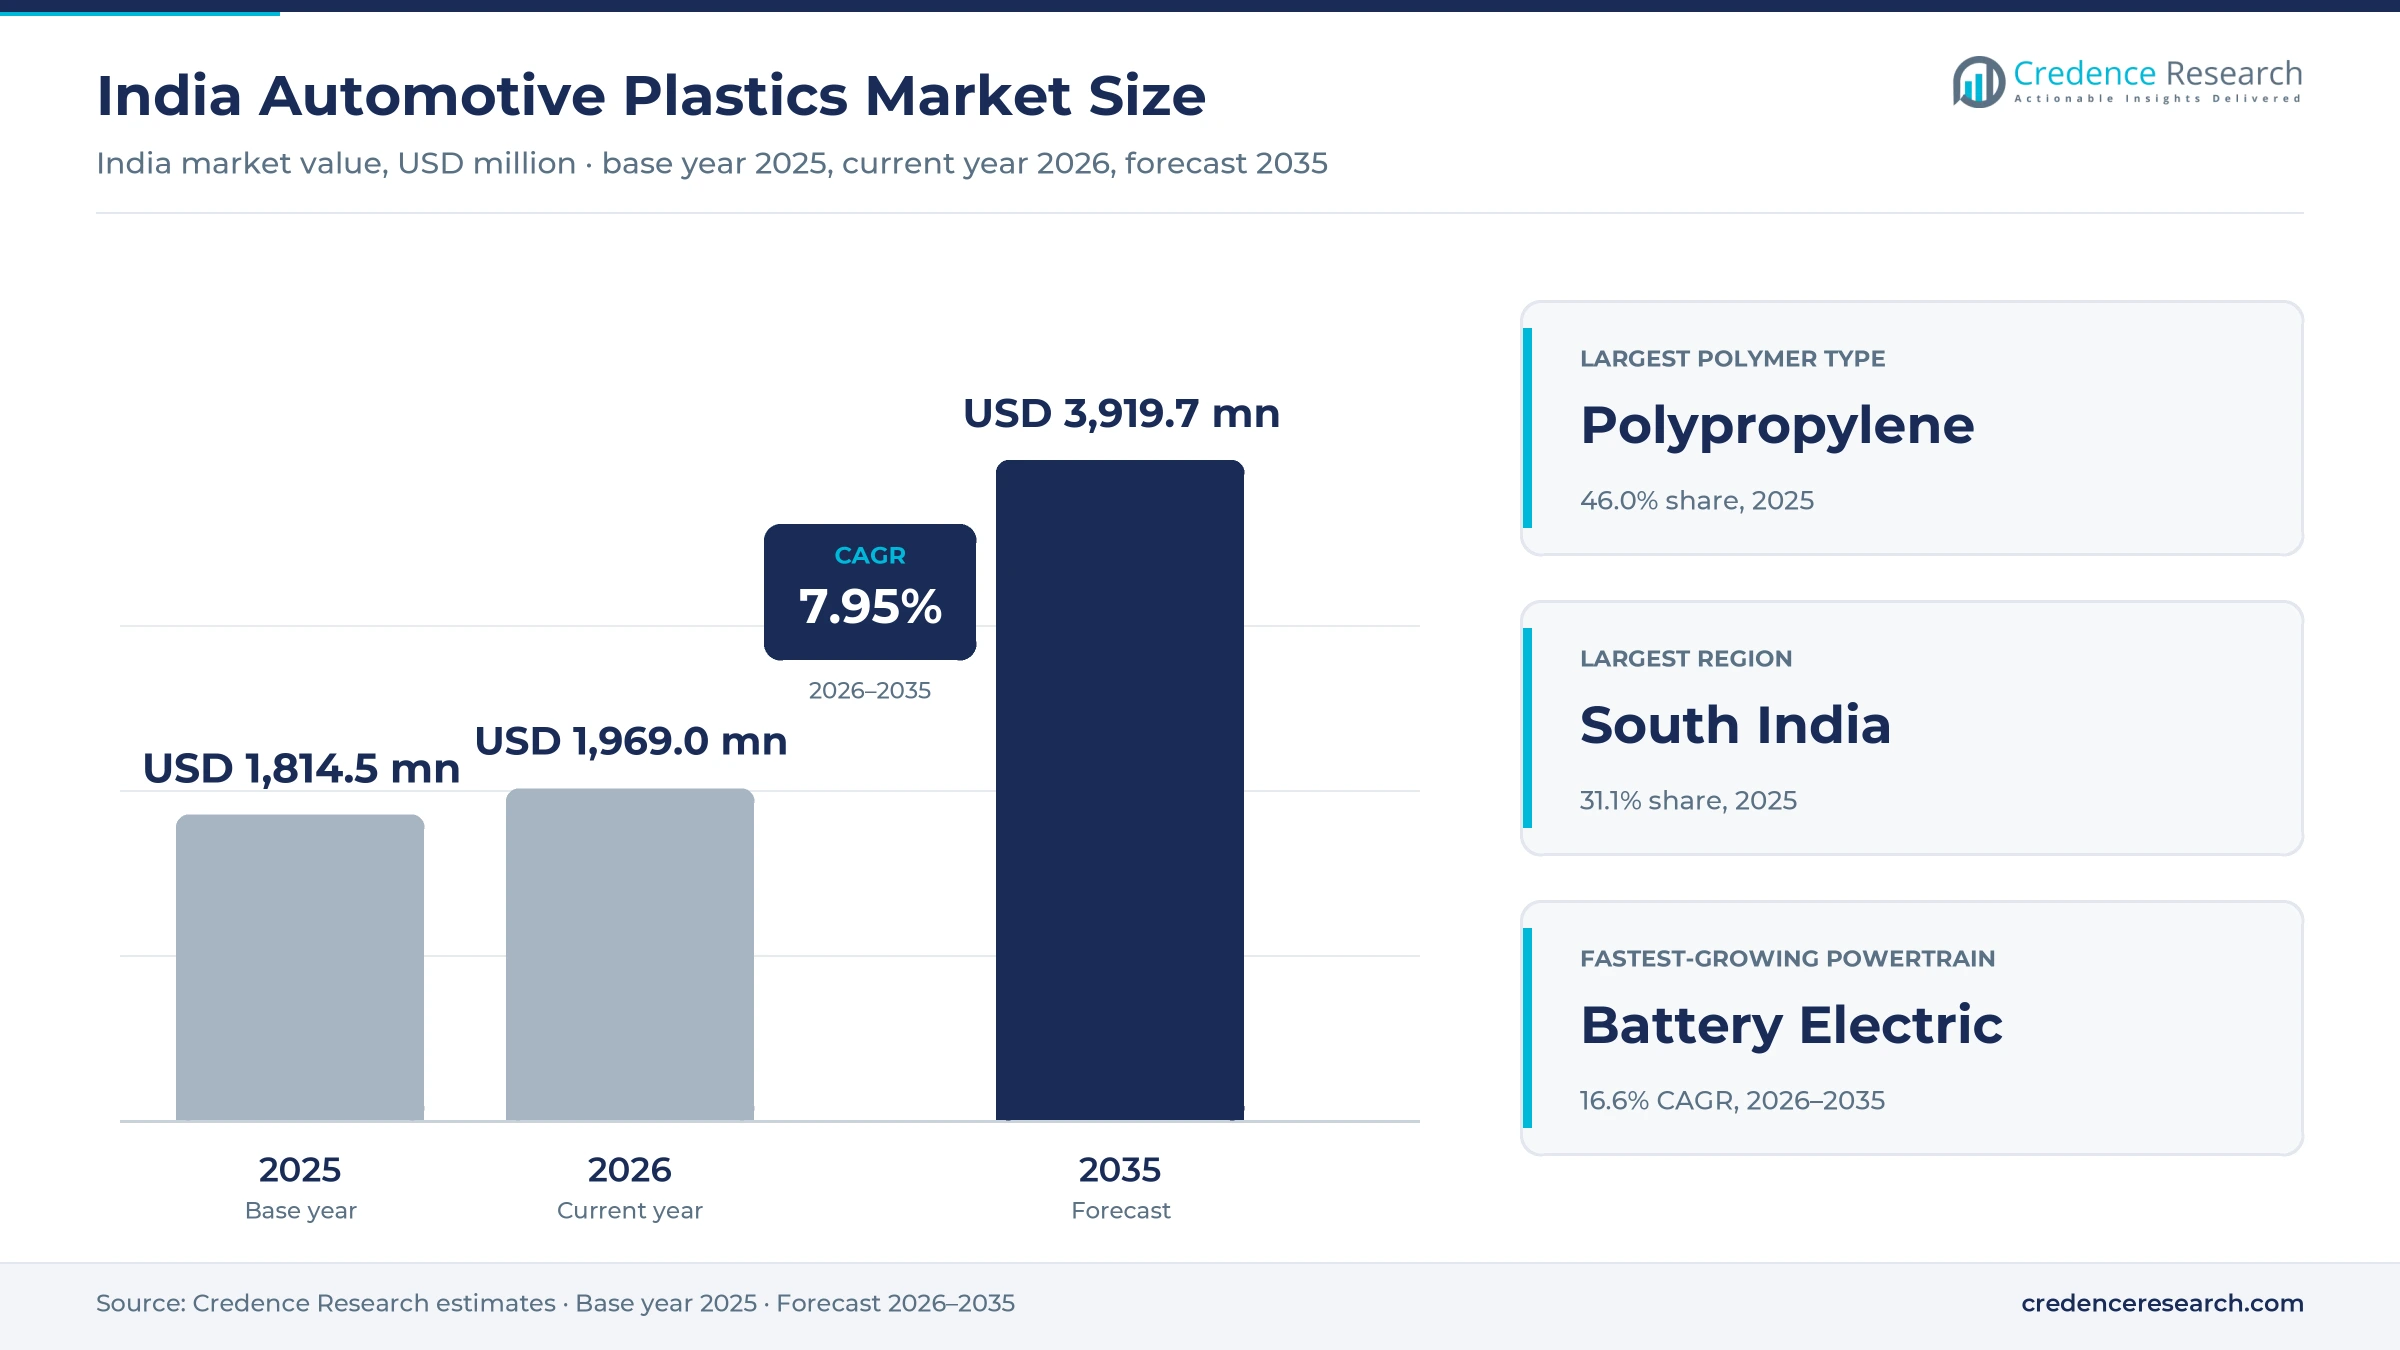
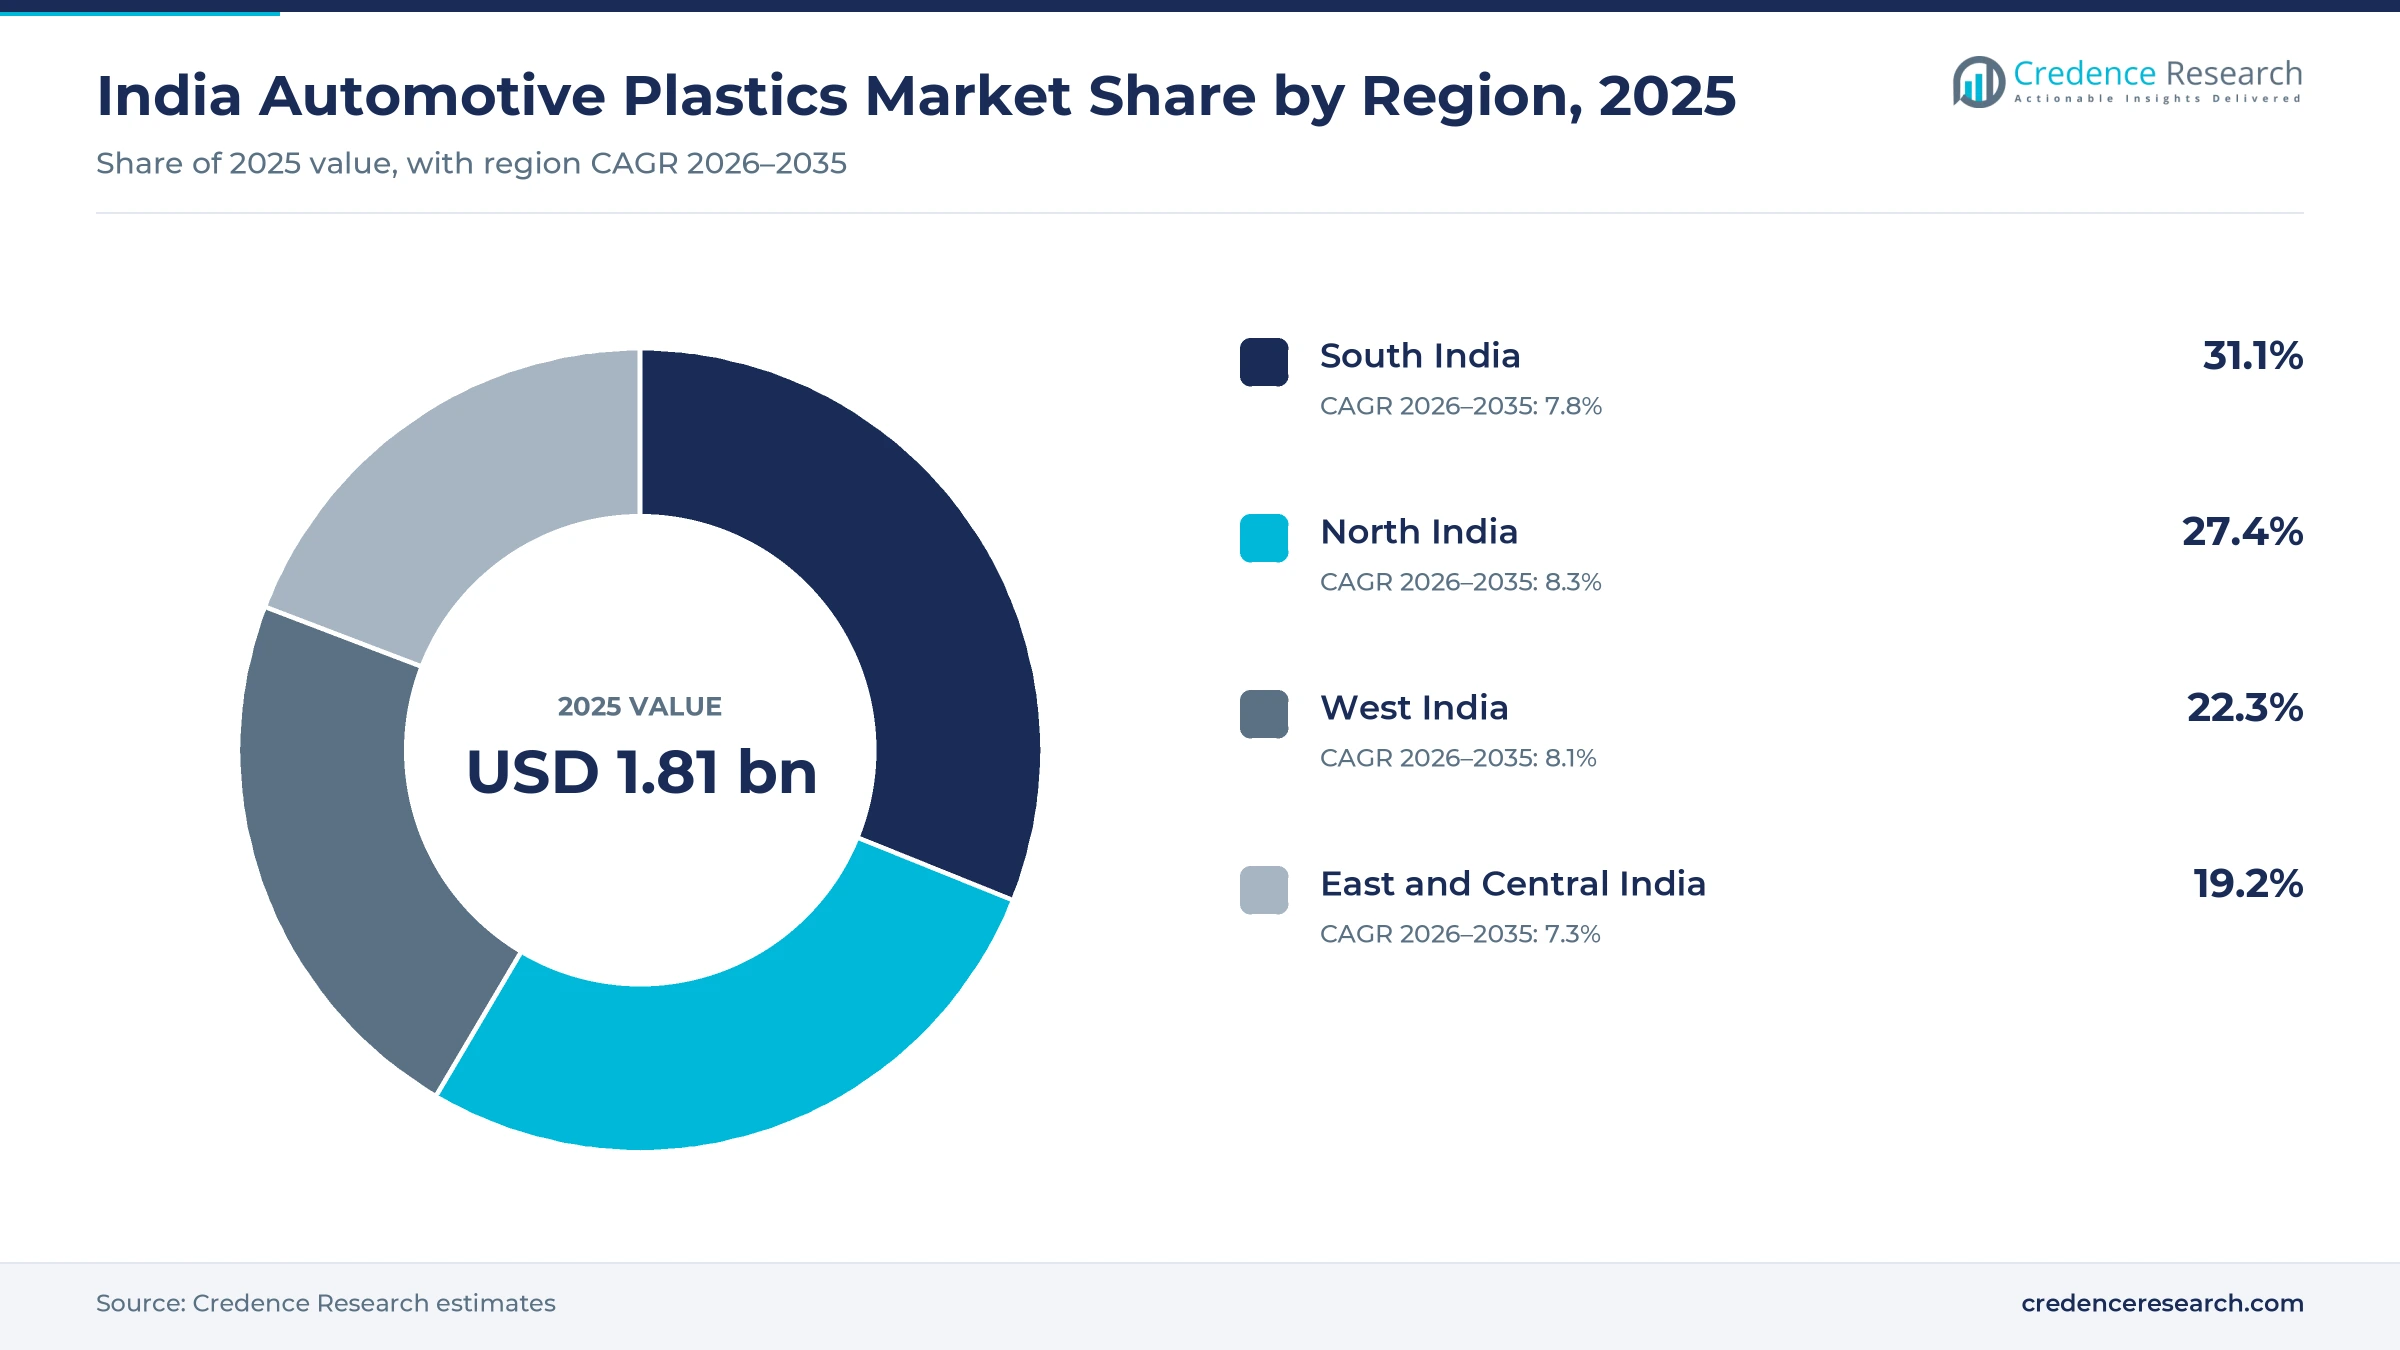
The India automotive plastics market was valued at USD 1.81 billion in 2025 and is projected to increase from USD 1.97 billion in 2026 to USD 3.92 billion by 2035, registering a CAGR of 7.95% during 2026–2035. Demand comes from record vehicle output, heavier SUV-led model mixes, and fuel-efficiency rules that reward lighter parts. South India held the largest regional share, 31.1% in 2025, because the Chennai, Hosur and Bengaluru belts build a large part of the country's two-wheelers, cars and components. North India grows fastest at 8.3% a year, as new car capacity in Haryana pulls molders and compounders closer to assembly lines. Electric two-wheelers and cars also add battery housings, connectors and charging parts that use more heat-resistant and flame-retardant grades.
Resin and compounds in molded vehicle parts set the scope
The estimate measures the value of plastics consumed in vehicles built and serviced in India, including polypropylene, polyurethane, ABS and engineering thermoplastics such as polyamide, polycarbonate and PBT. It covers resin and compounds used in dashboards, door trims, bumpers, fenders, under-hood parts, lighting, connectors and battery housings for passenger vehicles, two-wheelers, commercial vehicles and three-wheelers.
The estimate excludes tires, rubber hoses, paints, adhesives and fibers used in seat fabrics, as well as the value added by molders when they sell finished parts. The value chain runs from refiners and resin importers through compounders and distributors to injection molders, Tier-1 module makers and vehicle assembly plants.
India Automotive Plastics Market Insights
- The India automotive plastics market was valued at USD 1.81 billion in 2025 and is projected to reach USD 3.92 billion by 2035, registering a CAGR of 7.95% during 2026–2035.
- South India held 31.1% of 2025 value, because the Chennai, Hosur and Bengaluru belts host large two-wheeler, car and component plants.
- Polypropylene led with 46.0% of 2025 value, because bumpers, trims, battery cases and instrument panels in high-volume models use it widely.
- The Ministry of Power notified CAFE III norms in September 2026 that tighten fuel-use targets from April 2027 and reward lighter parts.
- Battery electric vehicles grow fastest by powertrain at 16.6% a year during 2026–2035, as electric two-wheelers and cars use more heat-resistant and flame-retardant grades.
Polypropylene and passenger cars carry most resin value
Talc-filled polypropylene dominates bumpers and trims
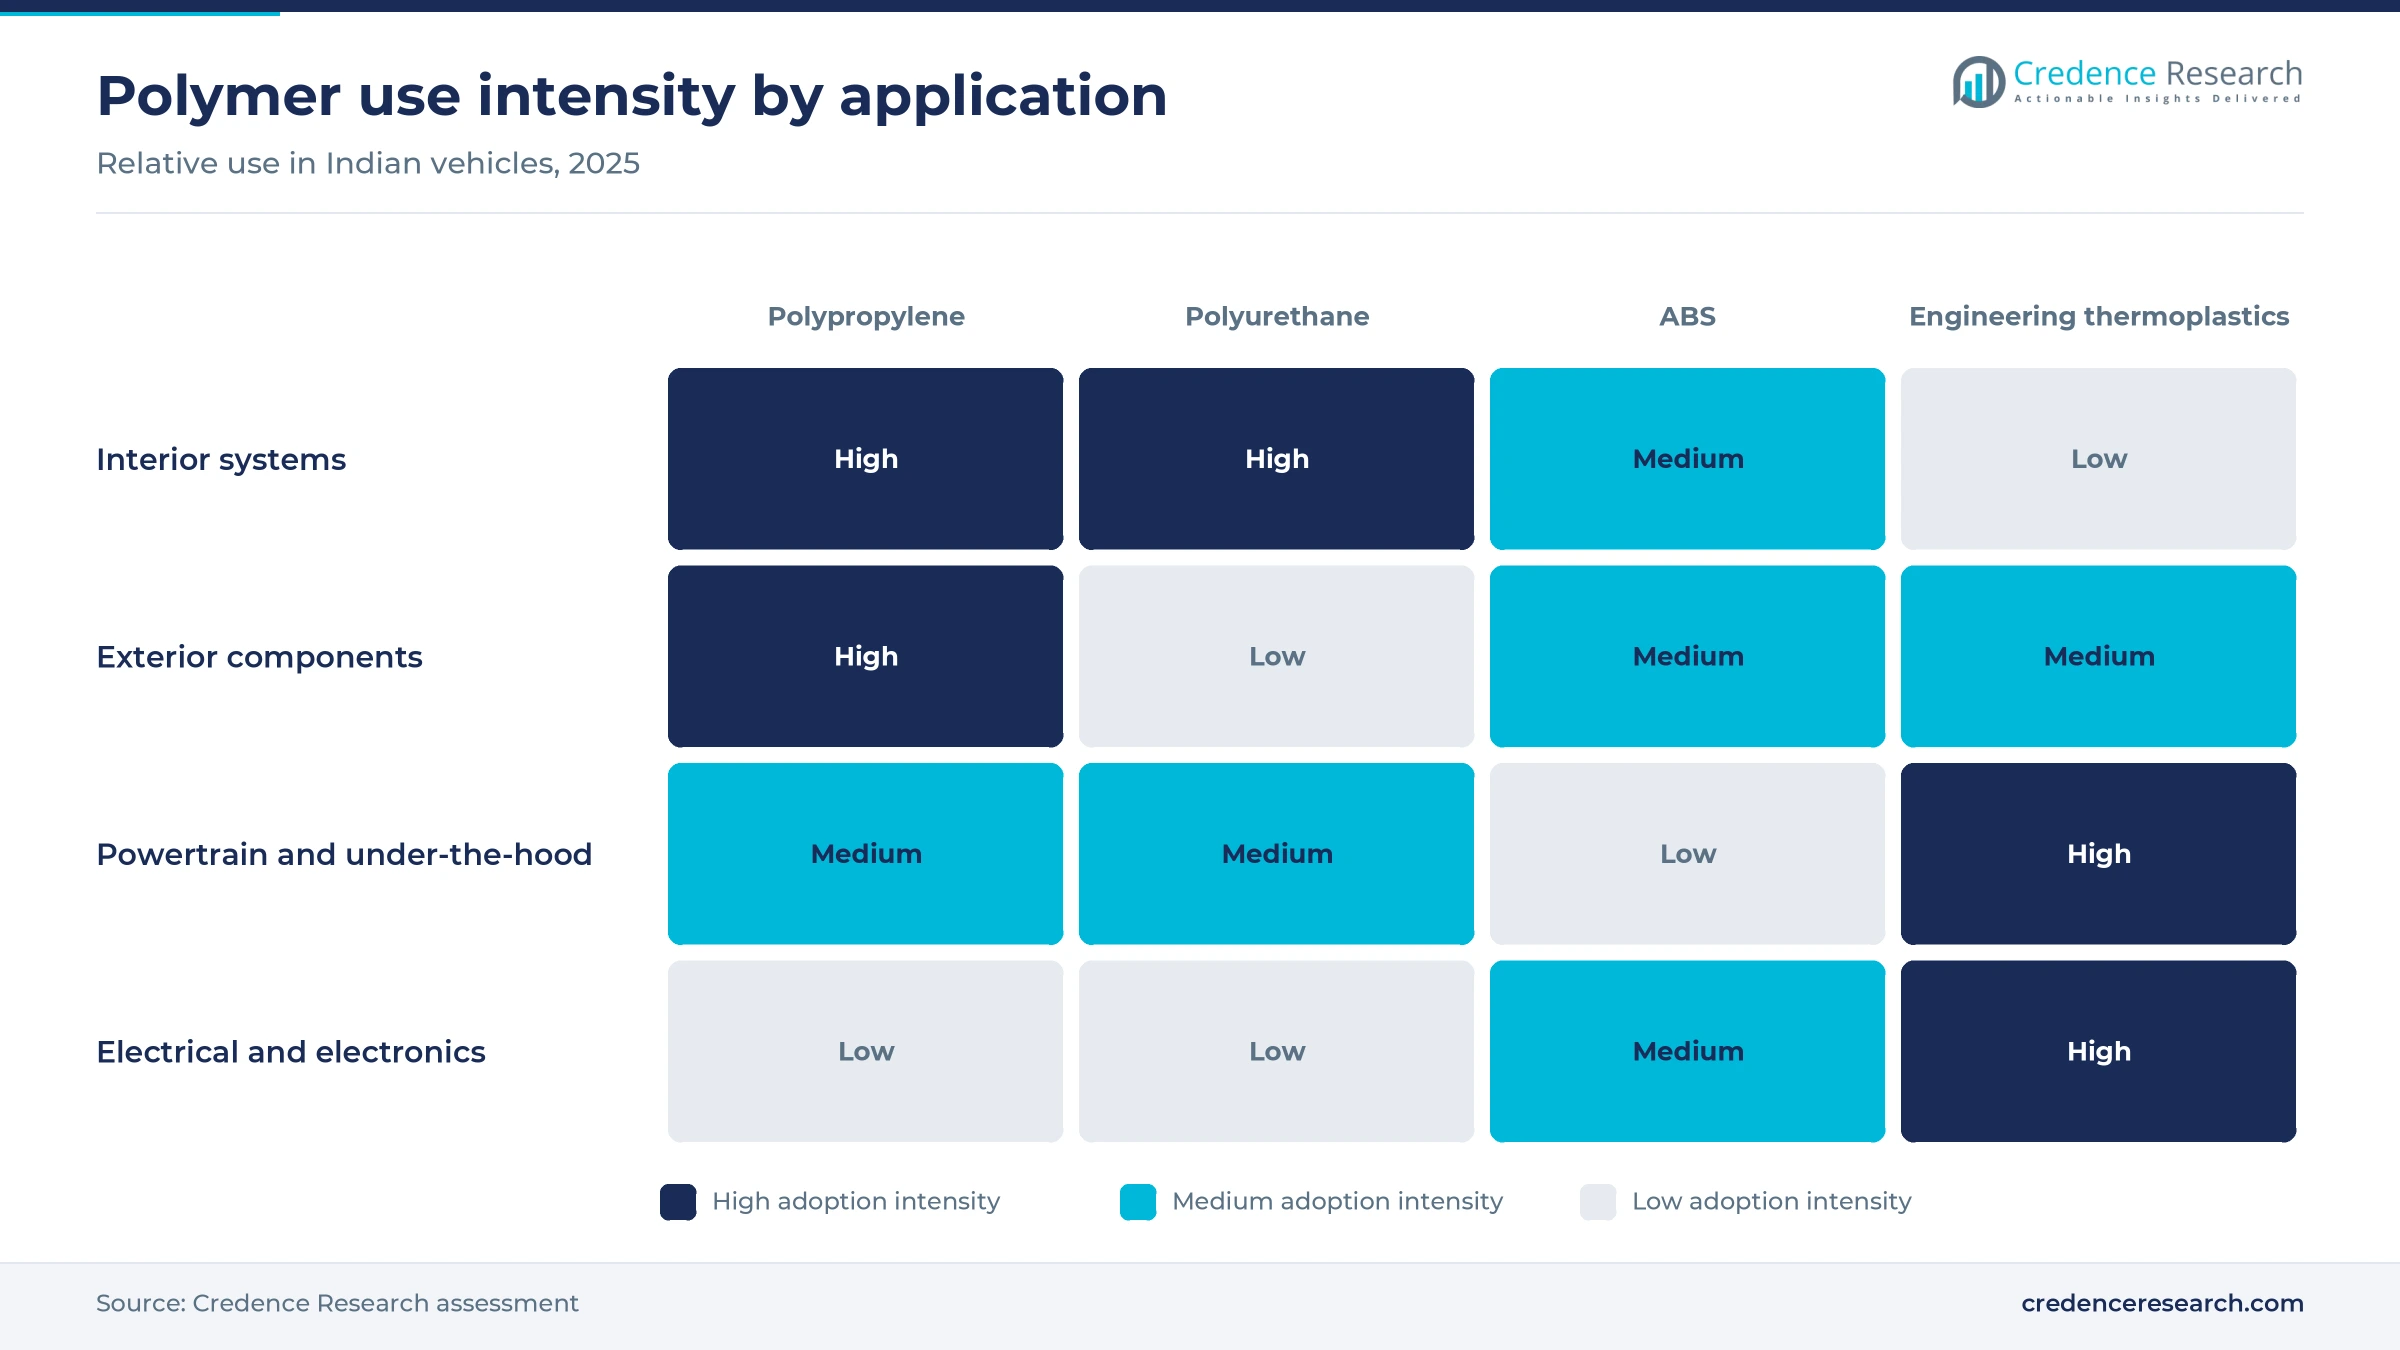
Based on polymer type, the market is categorized into polypropylene, polyurethane, acrylonitrile butadiene styrene and engineering thermoplastics. Polypropylene led with 46.0% of 2025 value, because bumpers, door trims and instrument panels in high-volume hatchbacks and SUVs use talc-filled and impact grades. APPL Industries alone runs 125,000 to 135,000 metric tons a year of compounding capacity around Pune and Dahej, according to Plastemart in January 2026. Engineering thermoplastics grow fastest at 9.1% a year, as BASF India began supplying locally made Ultradur PBT grades for EV connectors and electronics on Nov. 13, 2025.
Cabins carry the most plastic in each vehicle
Based on application, the market is categorized into interior systems, exterior components, powertrain and under-the-hood, and electrical and electronics. Interior Systems led with 38.0% of 2025 value, because dashboards, door panels, consoles and seat foams carry the most plastic per vehicle. Utility vehicles drove record passenger vehicle sales in 2025-26, according to SIAM, and they carry larger cabins and more trim. Electrical and electronics parts grow fastest at 9.6% a year, as EV components already reach 4.6% of domestic OEM component supplies, according to ACMA.
Cars lead on value although scooters lead on units
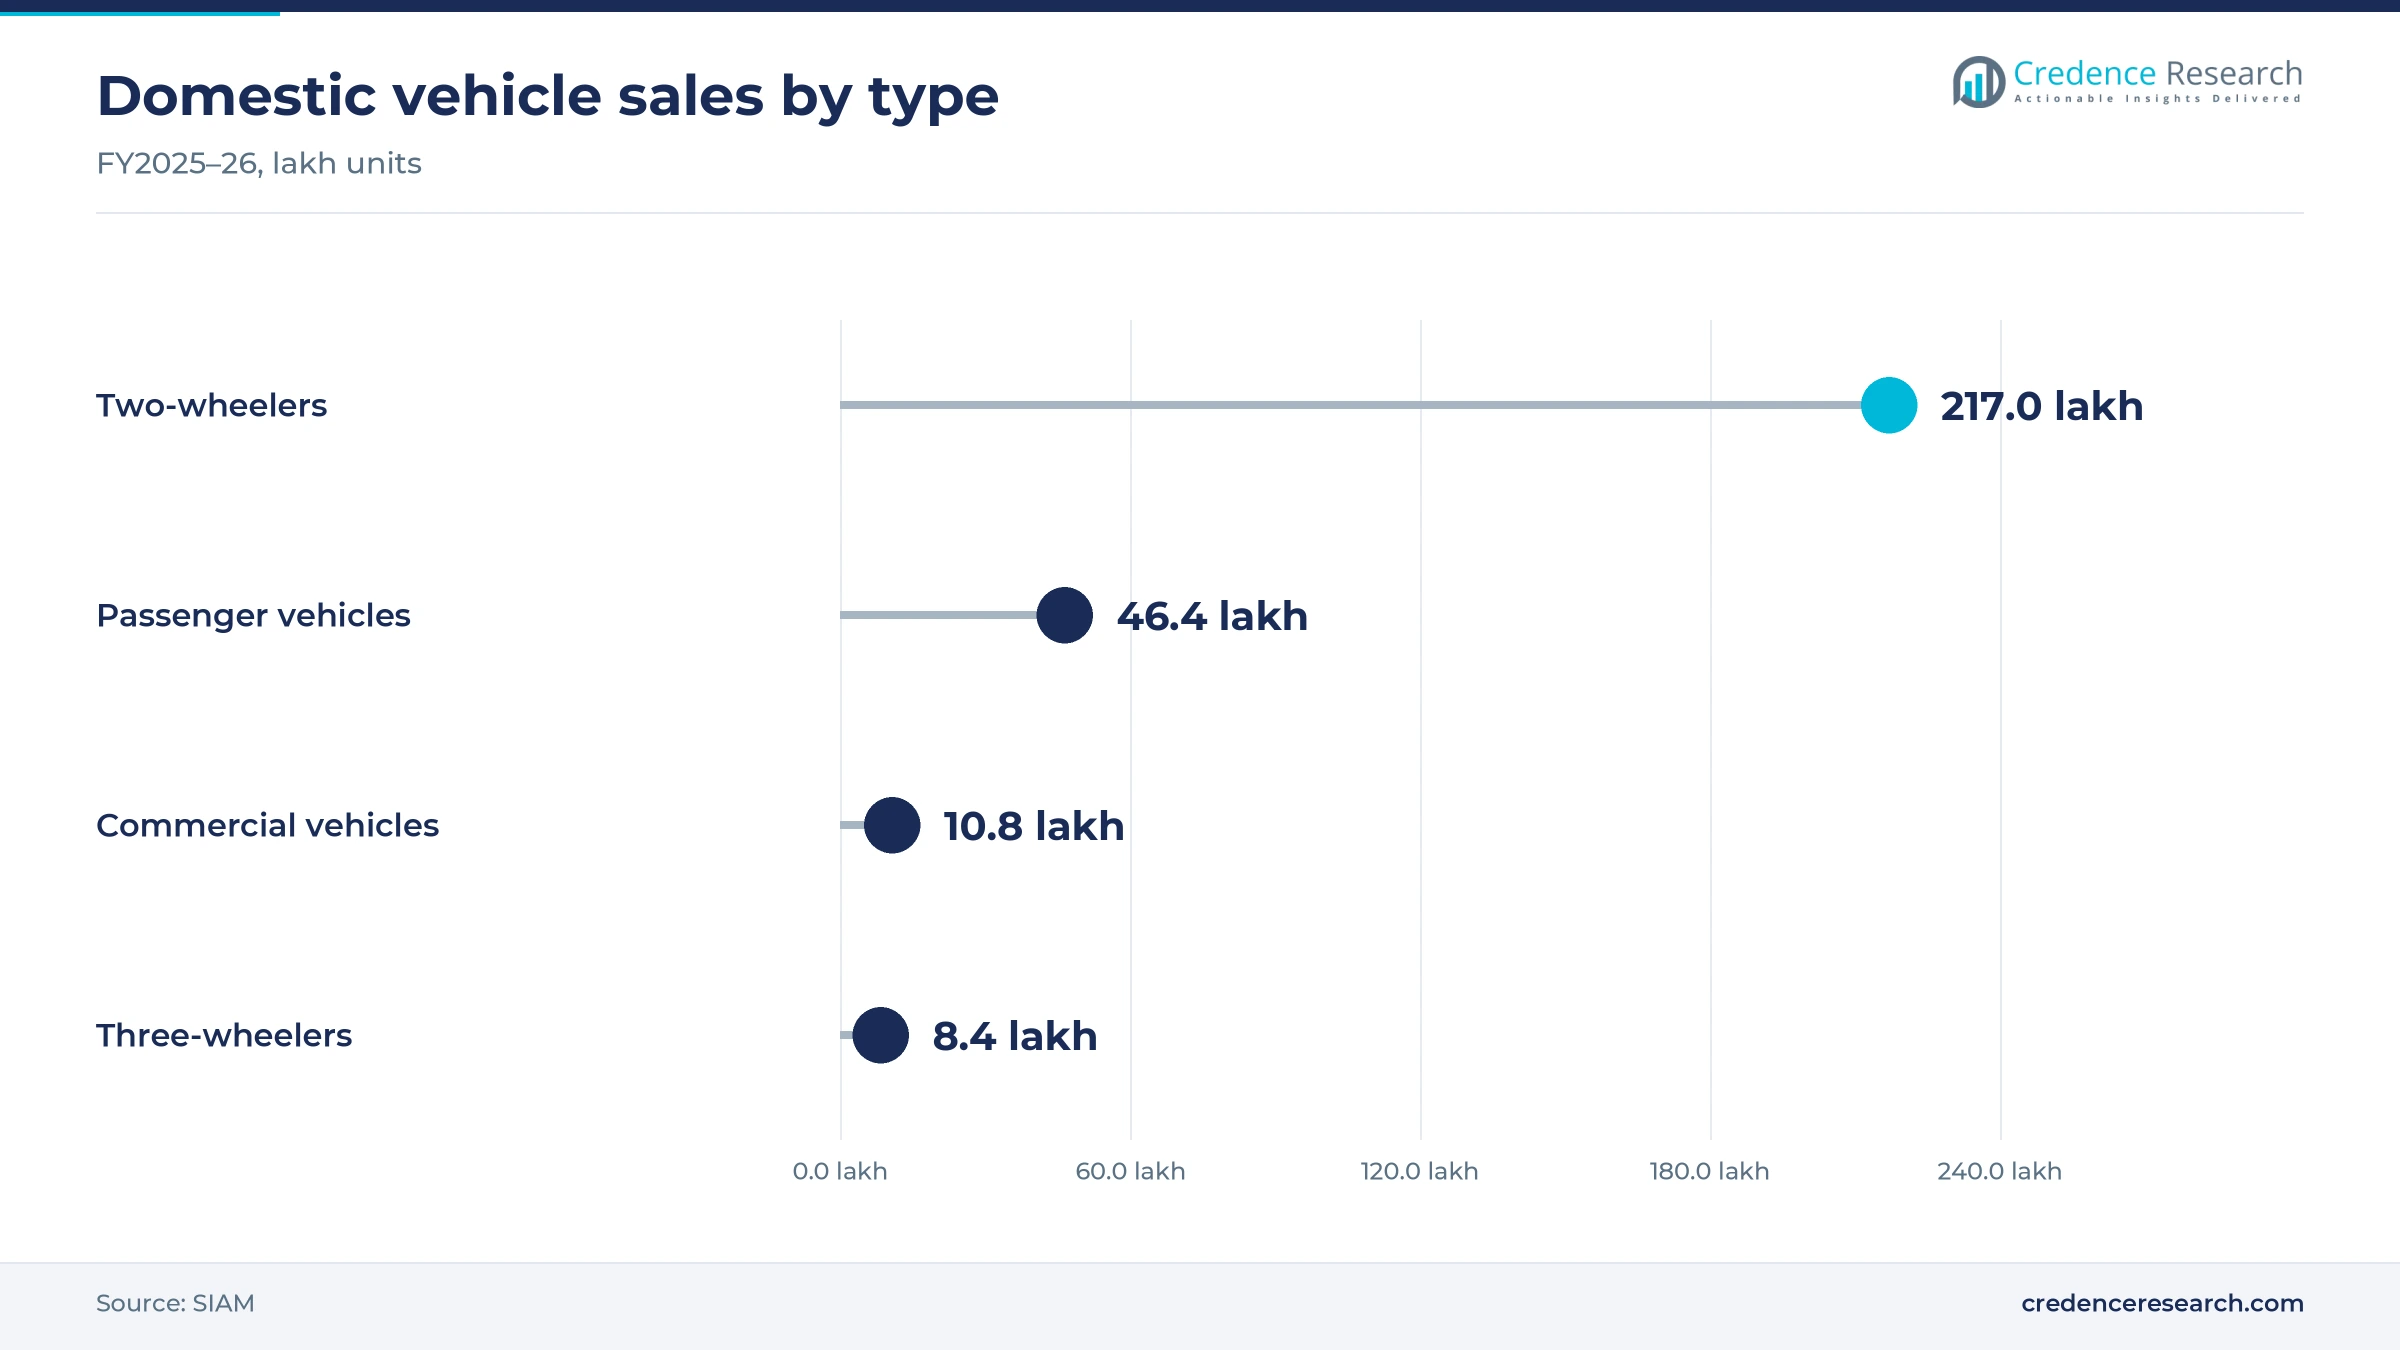
Based on vehicle type, the market is categorized into passenger vehicles, two-wheelers, commercial vehicles and three-wheelers and quadricycles. Passenger vehicles led with 58.0% of 2025 value, because a car uses several times more plastic than a scooter and India sold a record 46.43 lakh passenger vehicles in 2025-26, according to SIAM. Two-wheelers still form the largest unit base, with plastic body panels on most scooters. Three-wheelers and quadricycles grow fastest at 8.9% a year, as about 8 lakh electric three-wheelers were sold in 2025, according to Vahan data.
Combustion models still absorb most plastic demand
Based on powertrain, the market is categorized into internal combustion engine, battery electric, hybrid electric and CNG and LPG vehicles. Internal combustion engine vehicles led with 88.5% of 2025 value, because non-electric models still made up about 92% of new registrations in 2025, when electric vehicles reached about 8% of the total. Battery electric vehicles grow fastest at 16.6% a year, as the PLI auto scheme had supported output of more than 13.6 lakh electric vehicles by December 2025, and each battery pack needs plastic housings, trays and connectors.
| Segment Group | Leading Sub-segment | Share, 2025 | Fastest-growing Sub-segment | CAGR, 2026–2035 |
|---|---|---|---|---|
| By Polymer Type | Polypropylene | 46.0% | Engineering Thermoplastics | 9.1% |
| By Application | Interior Systems | 38.0% | Electrical and Electronics | 9.6% |
| By Vehicle Type | Passenger Vehicles | 58.0% | Three-Wheelers and Quadricycles | 8.9% |
| By Powertrain | Internal Combustion Engine | 88.5% | Battery Electric | 16.6% |
Resin lists set part prices, and compounds add a premium
Part prices start from published resin lists, which refiners revise often and sometimes several times a month, and then add compounding, molding and tooling costs. Commodity polypropylene sat near Rs 99 to 131 per kg on producer lists in early 2026, while ABS traded near Rs 175 per kg. Glass-filled and flame-retardant compounds cost much more, because fillers, additives and carmaker approvals add value. Price moves of Rs 10 to 20 per kg within one quarter are common, so molders that win index-linked contracts protect margins best. Buyers in turn choose engineering grades only where weight or heat needs justify the premium.
| Material or grade | Typical price or fee | Basis |
|---|---|---|
| Polypropylene, producer list (basic, ex-works) | Rs 98,900 to 130,800 per metric ton | HMEL price circular, March 3, 2026 |
| ABS natural grade, Delhi ex-works | Rs 173 to 175 per kg | OfBusiness listing, November 2026 |
| Domestic polypropylene list revisions | Up to +Rs 23 per kg in March, then -Rs 12.5 per kg on July 2 | Producer revisions reported in March and July 2026 |
| Glass-filled PP and polyamide compounds | About Rs 180 to 320 per kg | Credence Research estimate from resin lists plus compounding cost |
Request a Free Sample
Fill in your details and we'll send you a free sample report.
- Sample data tables & charts
- Research methodology
Production, CAFE III and EV wiring lift polymer content
Record output across every vehicle class lifts volumes
Record vehicle output is the main driver of resin demand, because every assembled vehicle pulls compounds and molded parts through the supply chain. India produced about 6.49 million vehicles in 2025, according to OICA, while Japan produced 8.41 million. Domestic sales reached 2.83 crore units in 2025-26, up 10.4%, according to SIAM figures reported in April 2026. Exports also rose in two-wheelers and passenger vehicles, the two classes that use the most resin. For suppliers, this means volume growth arrives across all vehicle classes at once, so compounders with plants near several assembly belts gain the most.
CAFE III gives every kilogram saved a cost value
Fuel-efficiency compliance pushes carmakers to replace metal with plastics, because every kilogram saved helps fleets meet tighter targets. The Ministry of Power notified CAFE III norms in September 2026, effective April 1, 2027, with the fuel-use benchmark tightening every year. The final rules use a weight-sensitive curve, with reference weight rising from 1,082 kg to 1,229 kg. The final norms run to March 31, 2032, with the fuel-use target falling to 3.3273 liters per 100 km in 2031-32. This gives lighter tailgates, front-end carriers and fuel-system parts a direct cost value for carmakers, which favors glass-filled polypropylene and polyamide suppliers.
Battery packs and chargers add heat-resistant grades
Electrification adds new plastic parts, because battery packs, motor controllers and charging hardware need insulating, heat-resistant and flame-retardant housings. About 23 lakh electric vehicles were sold in 2025, equal to 8% of new registrations, with two-wheelers making up about 12.8 lakh. The PM E-DRIVE scheme was extended to March 31, 2028, with its outlay raised to Rs 11,900 crore in August 2026. Electrical and electronics parts therefore grow fastest by application at 9.6% a year. Suppliers of PBT, polyamide and polycarbonate grades gain most, because these resins command higher prices per kilogram than standard polypropylene.
Tier-1 suppliers bring molding of imported parts home
A fast-growing component base pulls resin demand into India, because Tier-1 suppliers now mold parts locally that were once imported. Auto component turnover reached INR 7.6 lakh crore in 2025-26, with OEM supplies up 16.3%, according to ACMA figures released in July 2026. The component imports noted below leave room for local substitution by domestic molders. Maruti Suzuki also started a second 250,000-unit plant at Kharkhoda, Haryana, in May 2026, which brings new molded-part orders to the northern belt. Compounders that win approval on new platforms early can lock in volumes for a model's full life cycle.
Local compounding, recycled grades and EV parts gain pace
Compounding capacity shifts next to assembly belts
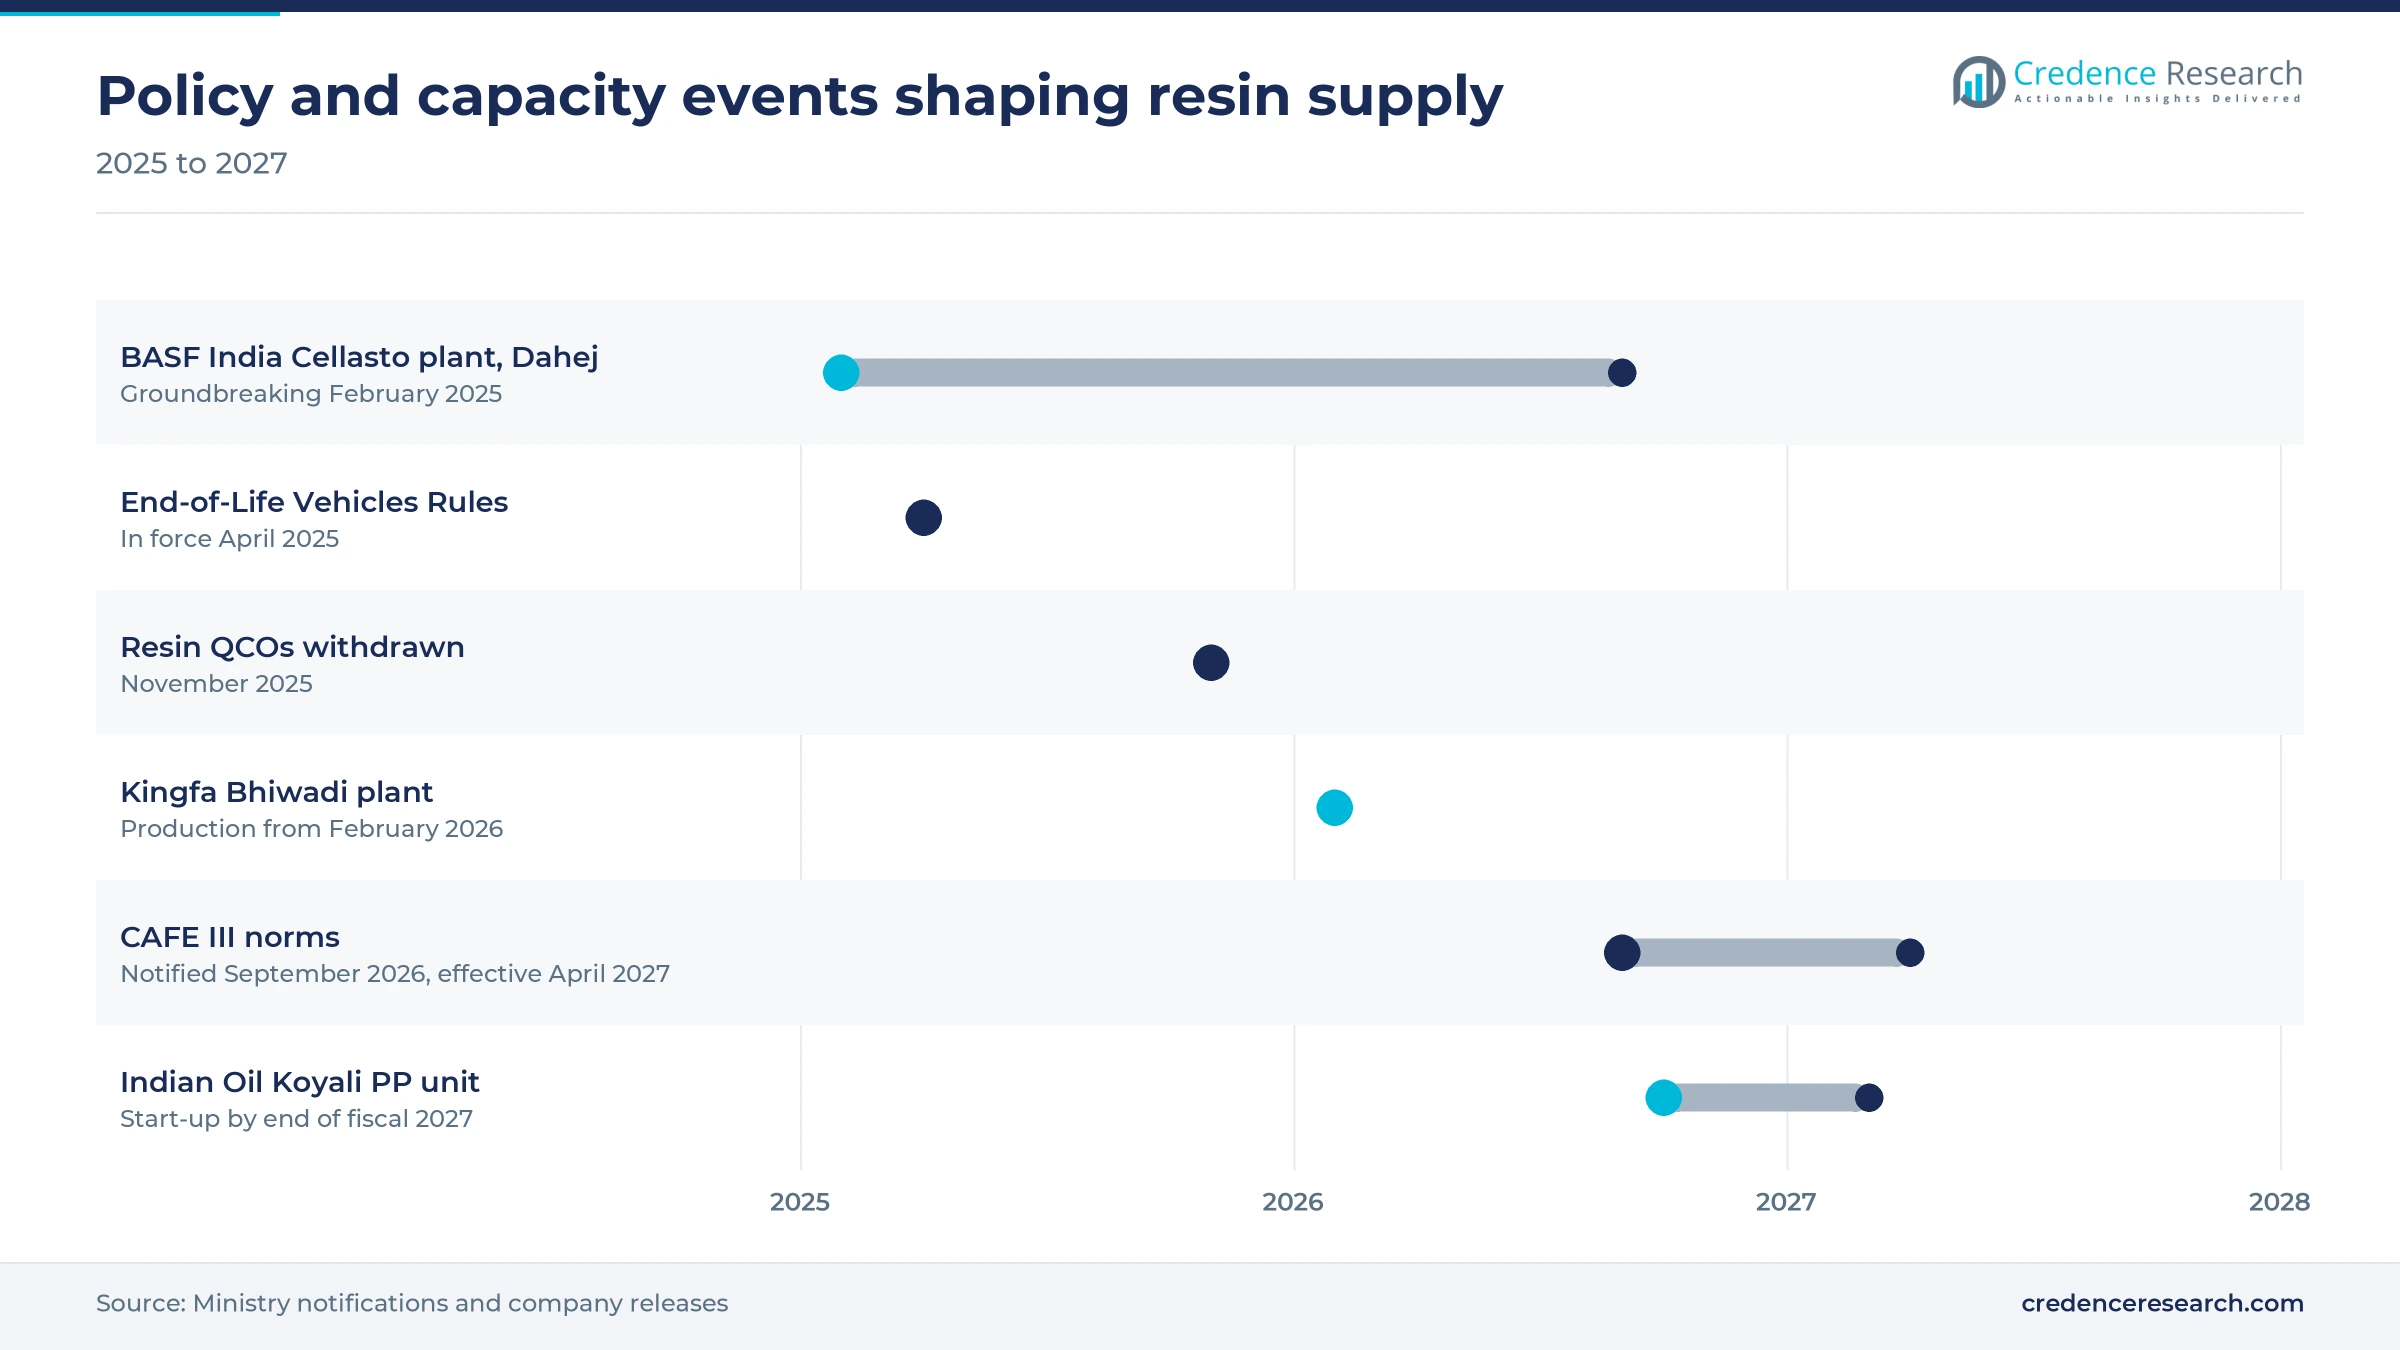
Carmakers want short lead times and approved local grades, so compounders now build plants near their assembly lines. Kingfa Science & Technology (India) began commercial production at a new plant in Bhiwadi, Rajasthan, on Feb. 22, 2026, adding to its sites at Manesar, Chakan and Puducherry. BASF India broke ground on a Cellasto polyurethane plant at Dahej on Feb. 24, 2025, for noise and vibration parts, with start-up set for the second half of 2026. Renolit also extended its joint venture with APPL Industries for 15 years in December 2025, while Syensqo plans to double its compounding capacity at Panoli by the first quarter of 2028. Imported finished compounds are losing ground, and buyers gain more local sources for specialty grades.
Mass-balanced and recycled grades are emerging
Global carmakers want lower-carbon materials in parts built in India, which is opening a market for recycled and renewable-attributed grades. Covestro's Greater Noida polycarbonate compounding site earned ISCC PLUS certification on May 5, 2025, which lets it supply mass-balanced grades for automotive and electronics customers. The End-of-Life Vehicles Rules took effect on April 1, 2025, setting producer responsibility for scrapping old vehicles. Covestro also launched polycarbonate grades with 50% recycled content from old headlamps in April 2025, a benchmark that global carmakers will ask local suppliers to match. Over time, scrapping targets should raise the supply of recovered polypropylene, so compounders that build sorting and recycling links gain a cost and compliance edge.
Electric scooter bodies and battery cases open new volume
Electric two-wheelers offer a clear opening, because their bodies are almost entirely molded plastic and their battery packs need flame-retardant cases. Tamil Nadu rolls out nearly 60% of India's electric two-wheelers, according to the state investment agency, which concentrates this demand around Hosur and Chennai. Under PM E-DRIVE, the subsidy for electric two-wheelers is Rs 2,500 per kWh, capped at Rs 5,000 per vehicle, for units registered until March 2028. Scooter sales also rose 18.5% in 2025-26, faster than motorcycles. Suppliers of ABS, polycarbonate blends and flame-retardant grades for electric scooters can therefore win long model programs.
Export programs open room for premium grades
Vehicles built for Europe and Japan must meet stricter material, emission and recycling rules, which opens room for premium grades. Maruti Suzuki began building the e Vitara at Hansalpur, Gujarat, in August 2025, for export to more than 100 countries, according to All India Radio. The adjoining Toshiba, Denso and Suzuki battery plant also started local production of hybrid battery electrodes at the same time. Two-wheeler exports reached a record 51.8 lakh units in 2025-26. Compounders that hold global approvals for low-emission interior grades and paint-free exterior resins can win export platforms, while polypropylene compounds with lower odor gain cabin applications.
Resin price swings and thin molder margins test suppliers
Molders absorb list-price jumps until carmakers reprice
Resin price swings squeeze molders, because most part contracts reset prices quarterly while resin lists change weekly. Domestic polypropylene lists rose by as much as Rs 23 per kg in the first 11 days of March 2026, according to Business Today, as West Asia tensions disrupted supply. Producers then cut lists by Rs 12.5 per kg on July 2, 2026 once supply eased, which shows how far costs can swing within one quarter. Small molders carry the gap until carmakers approve revisions, so many now seek indexed contracts linked to published resin lists.
Imported specialty grades add supply and currency risk
India makes limited polyamide, polycarbonate and PBT, so most specialty grades arrive from abroad with currency and shipping exposure. Component imports reached USD 25.4 billion in 2025-26, with China, Japan and Germany the largest sources, according to ACMA. The government withdrew quality control orders on PP, PE, ABS and polycarbonate on Nov. 13, 2025, which eased imports but also opened local producers to cheaper competition. Buyers respond by qualifying two or more suppliers for each critical grade.
Domestic polypropylene supply still trails demand
Indian Oil expects polypropylene imports to continue, according to Hydrocarbon Processing in October 2026, even after its new 500,000-metric-ton unit at Koyali, Gujarat, starts by the end of fiscal 2027. Local polypropylene supply thus trails demand, and compounders plan around imported cargoes and long lead times. Until the new capacity arrives, they hold larger inventories, which ties up working capital. Producers also raised domestic polypropylene lists by INR 2,000 per metric ton on Nov. 1, 2026, according to Plastemart, which keeps input costs moving through the year.
Thin waste streams hold back local recycled grades
Recycling gaps limit circular grades, because India lacks enough sorted, consistent automotive plastic waste to make approved recycled compounds. The End-of-Life Vehicles Rules, notified on Jan. 6, 2025, set scrapping targets for steel but give no plastic recovery target, according to a Mondaq legal review. Most recycled content therefore still comes from imports or non-automotive waste. Carmakers that want local recycled grades must fund collection and testing with recyclers.
South India leads as northern car plants add capacity
| Region | Value, 2025 (USD billion) | Share, 2025 | CAGR, 2026–2035 |
|---|---|---|---|
| South India | 0.56 | 31.1% | 7.8% |
| North India | 0.50 | 27.4% | 8.3% |
| West India | 0.40 | 22.3% | 8.1% |
| East and Central India | 0.35 | 19.2% | 7.3% |
Two-wheeler and EV clusters keep the south ahead
South India held 31.1% of 2025 value and grows at 7.8% a year, because Tamil Nadu, Karnataka and Telangana host dense two-wheeler, car and component plants. Tamil Nadu alone accounts for about 36% of India's two-wheeler production and about 35% of auto component output, according to the state investment agency. Kingfa's Puducherry plant and EV scooter makers around Hosur add steady demand for ABS, polypropylene and flame-retardant grades.
Haryana car plants make the north the fastest-growing zone
North India held 27.4% of 2025 value and grows fastest at 8.3% a year, because the Gurugram, Manesar and Kharkhoda belt is adding car capacity. Maruti Suzuki started its first 250,000-unit Kharkhoda plant in February 2025, and the site is planned to reach 1 million units a year. Kingfa's new Bhiwadi plant and its Manesar site, plus Covestro's Greater Noida compounding unit, serve these assembly lines with local grades.
Pune and Gujarat make the west a compounding base
West India held 22.3% of 2025 value and grows at 8.1% a year, because Pune, Chakan and Gujarat combine car plants with major resin and compounding sites. Indian Oil is adding the Koyali polypropylene unit noted above in Gujarat, and BASF India is building its Cellasto plant at Dahej. Suzuki's Hansalpur plant in Gujarat now builds the e Vitara for export, which adds demand for battery and cabin plastics close to these resin sources.
Truck and transmission plants anchor East and Central India
East and Central India held 19.2% of 2025 value and grows at 7.3% a year, because truck, engine and transmission plants in Jharkhand and Madhya Pradesh lead demand there. Tata Motors builds all Prima and Signa trucks at Jamshedpur and upgraded the site to modular lines in January 2026. VE Commercial Vehicles plans a Rs 544 crore transmission plant near Ujjain, which adds under-hood demand alongside sheet-metal stamping suppliers in the zone.
Plant openings, QCO repeal and CAFE III reset the market
| Development | Status and market relevance |
|---|---|
| In February 2025, BASF India broke ground on a Cellasto polyurethane plant at Dahej for noise and vibration parts. | Start-up planned for the second half of 2026 |
| In November 2025, the Ministry of Chemicals and Fertilizers withdrew quality control orders on PP, PE, PVC, ABS and polycarbonate. | Eases resin imports for compounders and molders |
| In February 2026, Kingfa Science & Technology (India) began commercial production at its new Bhiwadi, Rajasthan, plant. | Adds compounding capacity near northern car plants |
| In September 2026, the Ministry of Power notified CAFE III fuel-efficiency norms for passenger vehicles from April 2027. | Rewards lighter parts through a weight-sensitive target curve |
| In October 2026, Indian Oil said its 500,000-metric-ton Koyali polypropylene unit should start production by the end of fiscal 2027. | Adds western resin supply for compounders |
Long-glass PP, foams and heat-resistant resins gain ground
- Long-glass-fiber polypropylene replaces steel in front-end carriers, tailgates and seat structures, which cuts weight without the cost of aluminum.
- Microcellular polyurethane absorbs noise and vibration in suspension parts, which matters more as quieter electric drivetrains expose road noise.
- Flame-retardant PBT and polyamide protect battery connectors, chargers and high-voltage parts, which lets electric vehicles meet heat and safety tests.
- Large-tonnage injection molding machines make full bumpers and instrument panels in one shot, which reduces assembly steps and part counts.
Need a Custom Version of This Report?
Tailor the scope, geography, or segments to your exact requirements.
- Custom geography or segment scope
- Direct access to our analyst team
Refiners supply resin while compounders win approvals
Competition splits between resin producers that compete on price and supply security and compounders that compete on approved grades and technical service. Reliance Industries and Indian Oil, along with HPCL-Mittal Energy, publish the domestic polypropylene lists that set resin costs, and revise them as feedstock costs and import offers move. Kingfa Science & Technology (India) runs compounding plants at Manesar, Chakan and Puducherry. APPL Industries, based in Pune, supplies reinforced polypropylene and polyamide compounds to OEMs and Tier-1 suppliers. BASF India supplies local PBT grades and is building a polyurethane plant at Dahej. Covestro compounds polycarbonate at Greater Noida, while LyondellBasell markets polypropylene compounds for mobility. In India automotive plastics, suppliers win business through early design-in on new platforms, plant proximity to assembly belts and the ability to meet carmaker material standards.
Refiners, compounders and molders split the margin
The supply side has three layers that compete for different margins. Refiners such as Reliance Industries, Indian Oil and HPCL-Mittal Energy supply commodity polypropylene and polyethylene, and price on published lists. Compounders, including Kingfa, APPL, BASF India and Covestro, turn base resin into filled, reinforced and flame-retardant grades, and earn the highest margins once a carmaker approves a grade. A long tail of injection molders and Tier-1 module makers converts these grades into parts. Entry is easy at molding scale but hard in compounding, because carmakers require long validation of each grade on every new platform.
Companies profiled and their roles in this market
| Company | Type | Role in the market |
|---|---|---|
| Reliance Industries Limited | Domestic refiner and resin producer | Polypropylene and PVC supply; list price revisions |
| Indian Oil Corporation Limited | State-owned refiner and resin producer | Polypropylene supply; 500,000-metric-ton Koyali unit planned |
| Kingfa Science & Technology (India) Limited | Compounder (Kingfa group unit) | Reinforced PP and engineering compounds; Bhiwadi plant opened 2026 |
| BASF India Limited | Specialty materials producer | Local Ultradur PBT grades; Cellasto plant at Dahej |
| Covestro (India) Private Limited | Polycarbonate compounder | ISCC PLUS-certified Greater Noida compounding site |
| APPL Industries Limited | Domestic engineering plastics compounder | 125,000-135,000 metric tons of capacity around Pune and Dahej |
| LyondellBasell Industries | Global polyolefin producer | Catalloy-based mobility materials shown at PLASTINDIA 2026 |
Credence Research view on content per vehicle to 2035
Credence Research's view is that India automotive plastics value per vehicle will rise faster than vehicle output through 2035, because CAFE III and electrification both reward lighter and more heat-resistant parts. Polypropylene will keep the largest share, but engineering thermoplastics will gain the most value as battery, connector and charging parts spread. The biggest margin opportunity sits with compounders that hold carmaker approvals and plants close to assembly belts. The main risk is resin price volatility, which can erase molder margins within a quarter unless contracts carry index clauses.
Build volumes and resin prices anchor the estimate
The report uses 2025 as the base year for every value, share and growth rate. Market values come from the Credence Research model, which combines vehicle production and exports by type, plastic content per vehicle by application and average resin and compound prices. Regional zones and segment splits by polymer type, application, vehicle type and powertrain are Credence Research estimates. Sources used are industry association data, international production statistics, government notifications, producer price lists and company statements, and no interviews or surveys were used.
Electrified builds and lighter cars shape demand to 2035
The market is expected to reach USD 3.92 billion by 2035, a 7.95% CAGR during 2026–2035, as vehicle output grows and each vehicle carries more plastic. Growth should be strongest in battery electric models, in electrical and electronics parts and in North India, where new car capacity is concentrated. Engineering thermoplastics should grow at 9.1% a year, the fastest rate of any polymer type in India automotive plastics. South India should keep the largest share because of its two-wheeler and component clusters. In contrast, a sharp slowdown in vehicle sales or repeated resin price spikes would delay platform launches and squeeze molder margins.
Vehicle volumes and EV pace decide the 2035 range
The range of outcomes depends mainly on vehicle volumes and on how fast electric models gain share. A downside case assumes slower domestic sales after the 2025-26 peak and repeated resin price spikes that delay platform launches. The base case assumes steady production growth, CAFE III compliance through lighter parts and gradual EV adoption. An upside case needs faster electric two-wheeler and car adoption, plus export programs that bring more premium engineering grades into local builds.
| Scenario | CAGR, 2026–2035 | Value, 2035 | What has to hold |
|---|---|---|---|
| Downside | 6.5% | USD 3.46 billion | Domestic sales slow after the 2025-26 peak and resin spikes delay new platforms |
| Base | 7.95% | USD 3.92 billion | Production grows steadily, CAFE III is met with lighter parts and EV share rises gradually |
| Upside | 9.4% | USD 4.44 billion | Electric vehicle adoption accelerates and export programs lift premium grade use |
Frequently Asked Questions
How big is the India automotive plastics market?
Which region leads plastics demand from vehicle makers?
Which region grows fastest?
Which polymer type holds the largest share?
How do CAFE III norms affect plastics demand?
Which powertrain grows fastest?
Who are the leading suppliers?
What are the main risks to growth?
Table of Content
Chapter 1 Market Segmentation
- 1.1 Segmentation Framework
- 1.1.1 Product and Service Classification
- 1.1.2 Application and End-Use Classification
- 1.1.3 Technology and Solution Classification
- 1.1.4 Customer and Distribution Channel Classification
- 1.1.5 Geographic Segmentation
- 1.1.6 Market Segment Definitions and Boundaries
- 1.2 By Polymer Type
- 1.2.1 Polypropylene
- 1.2.2 Polyurethane
- 1.2.3 Acrylonitrile Butadiene Styrene
- 1.2.4 Engineering Thermoplastics
- 1.3 By Application
- 1.3.1 Interior Systems
- 1.3.2 Exterior Components
- 1.3.3 Powertrain and Under-the-Hood
- 1.3.4 Electrical and Electronics
- 1.4 By Vehicle Type
- 1.4.1 Passenger Vehicles
- 1.4.2 Two-Wheelers
- 1.4.3 Commercial Vehicles
- 1.4.4 Three-Wheelers and Quadricycles
- 1.5 By Powertrain
- 1.5.1 Internal Combustion Engine
- 1.5.2 Battery Electric
- 1.5.3 Hybrid Electric
- 1.5.4 CNG and LPG
Chapter 2 Introduction
- 2.1 Report Objectives and Scope
- 2.2 Product Definition and Industry Terminology
- 2.3 Market Inclusions and Exclusions
- 2.4 Research Process
- 2.4.1 Primary Research and Expert Interviews
- 2.4.2 Secondary Research and Source Review
- 2.4.3 Top-Down and Bottom-Up Estimation
- 2.4.4 Data Triangulation and Verification
- 2.5 Market Size Measurement Basis
- 2.5.1 2025: USD 1.81 billion → 2035: USD 3.92 billion
- 2.6 Historical and Forecast Reference Periods
- 2.6.1 Historical Period: 2018-2025
- 2.6.2 Base Year: 2025
- 2.6.3 Forecast Period: 2025-2035
- 2.7 Research Assumptions and Limitations
Chapter 3 Executive Summary
- 3.1 Market Snapshot and Key Findings
- 3.2 Base-Year Market Size, 2025
- 3.3 Forecast Market Size, 2035
- 3.4 Revenue and Volume Growth Outlook
- 3.5 Key Demand and Supply Indicators
- 3.6 Leading Market Segments
- 3.7 Fastest-Growing Market Opportunities
- 3.8 Regional Performance Highlights
- 3.9 Technology and Industry Transformation
- 3.10 Competitive Landscape Summary
- 3.11 Analyst View and Strategic Implications
Chapter 4 India Automotive Plastics Market Trends and Developments
- 4.1 Historical Industry Development, 2018-2025
- 4.2 Recent Market Trends and Developments
- 4.3 Demand and Customer Behavior Trends
- 4.4 Technology and Product Innovation
- 4.5 Artificial Intelligence, Automation and Digitalization
- 4.6 Local Manufacturing and Supply Chain Realignment
- 4.7 Industry Partnerships, Mergers and Acquisitions
- 4.8 Sustainability and Circular Economy Developments
- 4.9 Government and Private Sector Investment Trends
- 4.10 Emerging Business Models and Commercialization
- 4.11 Industry Developments and Announcements
Chapter 5 India Automotive Plastics Market Production, Supply and Demand Analysis
- 5.1 Demand Trend and Consumption Analysis, 2018-2025
- 5.2 Demand Forecast, 2025-2035
- 5.3 Production and Output Trend, 2018-2025
- 5.4 Production and Output Forecast, 2025-2035
- 5.5 Installed Capacity and Capacity Utilization
- 5.6 Company-Wise Production Plants and Statistics
- 5.6.1 Installed Production Capacity
- 5.6.2 Actual Production
- 5.6.3 Planned Capacity and Expansion Targets
- 5.7 Supply Chain Structure and Procurement Trends
- 5.8 Supply-Demand Gap and Bottlenecks
- 5.9 Import Dependence and Sourcing Structure
- 5.10 Contract Manufacturing and Outsourcing
- 5.11 Regional Supply and Demand Concentration
Chapter 6 India Automotive Plastics Market Pricing Analysis
- 6.1 Pricing Structure and Measurement
- 6.2 Historical Pricing Trends, 2018-2025
- 6.3 Pricing Outlook, 2025-2035
- 6.4 Average Selling Price and Unit Economics
- 6.5 Pricing by Product and Market Segment
- 6.6 Geographic Pricing Differences
- 6.7 Key Input, Energy, Labor and Logistics Costs
- 6.8 Contract Pricing and Purchasing Models
- 6.9 Pricing Sensitivity and Competitive Positioning
- 6.10 Price, Margin and Profitability Implications
Chapter 7 India Automotive Plastics Market Dynamics
- 7.1 Market Growth Drivers
- 7.1.1 Demand-Side Drivers
- 7.1.2 Technology and Innovation Drivers
- 7.1.3 Infrastructure and Investment Drivers
- 7.1.4 Regulatory and Policy Drivers
- 7.2 Market Restraints
- 7.2.1 Cost and Affordability Constraints
- 7.2.2 Technology and Adoption Barriers
- 7.2.3 Supply Chain and Operational Constraints
- 7.3 Market Challenges
- 7.3.1 Competitive Pressure and Margin Erosion
- 7.3.2 Skills, Infrastructure and Implementation Gaps
- 7.4 Emerging Market Opportunities
- 7.5 Market Dynamics Impact and Time-Horizon Assessment
Chapter 8 India Automotive Plastics Value Chain Analysis
- 8.1 Industry Value Chain Overview
- 8.2 Upstream Suppliers and Critical Inputs
- 8.3 Technology and Component Providers
- 8.4 Manufacturing or Service Delivery
- 8.5 Distribution, Channel Partners and Integrators
- 8.6 Downstream Applications and End Users
- 8.7 Value Addition and Profit Pools
- 8.8 Vertical Integration and Outsourcing
- 8.9 Supplier Concentration and Risk
- 8.10 Supply Chain Localization and Resilience
Chapter 9 India Automotive Plastics Market Regulations and Policies
- 9.1 Relevant Laws, Standards and Compliance Frameworks
- 9.2 Product, Service, Safety and Quality Requirements
- 9.3 Government Policies, Incentives and Subsidies
- 9.4 Imports, Exports and Trade Barriers
- 9.5 Public Procurement and Local Content Requirements
- 9.6 Environmental and Sustainability Compliance
- 9.7 Upcoming Policy Changes and Market Implications
Chapter 10 India Automotive Plastics Market Hotspots and Opportunities
- 10.1 Market Opportunity Mapping and Growth Hotspots
- 10.2 High-Growth Applications and Customer Groups
- 10.3 Underserved Markets and White-Space Opportunities
- 10.4 Emerging Technology and Product Opportunities
- 10.5 New Capacity and Investment Hotspots
- 10.6 Market Entry and Expansion Opportunities
- 10.7 Distribution and Partnership Opportunities
- 10.8 Near-Term and Long-Term Commercial Potential
- 10.9 Opportunity Attractiveness and Execution Risks
Chapter 11 India Automotive Plastics Market Outlook, 2025-2035
- 11.1 Market Size and Analysis
- 11.1.1 Revenue (Market Measurement: 2025: USD 1.81 billion → 2035: USD 3.92 billion)
- 11.1.2 Market Volume and Quantity Sold
- 11.1.3 Historical Market Size, 2018-2025
- 11.1.4 Base-Year Market Size, 2025
- 11.2 Market Forecast, 2025-2035
- 11.2.1 Revenue Forecast to 2035
- 11.2.2 Volume Forecast to 2035
- 11.2.3 CAGR and Year-on-Year Growth
- 11.2.4 Incremental Revenue Opportunity
- 11.3 Forecast Assumptions and Scenario Analysis
- 11.3.1 Base-Case Forecast
- 11.3.2 Optimistic and Conservative Scenarios
- 11.3.3 Technology, Pricing and Policy Sensitivities
- 11.4 Market Attractiveness and Growth Outlook
Chapter 12 India Automotive Plastics Market Segmentation and Outlook
- 12.1 Segmentation Summary and Market Shares, 2025
- 12.2 Largest and Fastest-Growing Segments
- 12.3 By Polymer Type - Market Size and Forecast, 2025-2035
- 12.3.1 Segment Definition and Scope
- 12.3.2 Historical Market Size, 2018-2025
- 12.3.3 Revenue Forecast, 2025-2035
- 12.3.4 Volume Forecast, 2025-2035
- 12.3.5 Base-Year Market Share, 2025
- 12.3.6 Segment CAGR and Growth Drivers
- 12.3.7 Subsegment Market Size and Forecast
- 12.3.7.1 Polypropylene
- 12.3.7.2 Polyurethane
- 12.3.7.3 Acrylonitrile Butadiene Styrene
- 12.3.7.4 Engineering Thermoplastics
- 12.3.8 Subsegment Pricing and Adoption Trends
- 12.3.9 Leading Suppliers and Competition
- 12.3.10 Regional Demand and Opportunities
- 12.4 By Application - Market Size and Forecast, 2025-2035
- 12.4.1 Segment Definition and Scope
- 12.4.2 Historical Market Size, 2018-2025
- 12.4.3 Revenue Forecast, 2025-2035
- 12.4.4 Volume Forecast, 2025-2035
- 12.4.5 Base-Year Market Share, 2025
- 12.4.6 Segment CAGR and Growth Drivers
- 12.4.7 Subsegment Market Size and Forecast
- 12.4.7.1 Interior Systems
- 12.4.7.2 Exterior Components
- 12.4.7.3 Powertrain and Under-the-Hood
- 12.4.7.4 Electrical and Electronics
- 12.4.8 Subsegment Pricing and Adoption Trends
- 12.4.9 Leading Suppliers and Competition
- 12.4.10 Regional Demand and Opportunities
- 12.5 By Vehicle Type - Market Size and Forecast, 2025-2035
- 12.5.1 Segment Definition and Scope
- 12.5.2 Historical Market Size, 2018-2025
- 12.5.3 Revenue Forecast, 2025-2035
- 12.5.4 Volume Forecast, 2025-2035
- 12.5.5 Base-Year Market Share, 2025
- 12.5.6 Segment CAGR and Growth Drivers
- 12.5.7 Subsegment Market Size and Forecast
- 12.5.7.1 Passenger Vehicles
- 12.5.7.2 Two-Wheelers
- 12.5.7.3 Commercial Vehicles
- 12.5.7.4 Three-Wheelers and Quadricycles
- 12.5.8 Subsegment Pricing and Adoption Trends
- 12.5.9 Leading Suppliers and Competition
- 12.5.10 Regional Demand and Opportunities
- 12.6 By Powertrain - Market Size and Forecast, 2025-2035
- 12.6.1 Segment Definition and Scope
- 12.6.2 Historical Market Size, 2018-2025
- 12.6.3 Revenue Forecast, 2025-2035
- 12.6.4 Volume Forecast, 2025-2035
- 12.6.5 Base-Year Market Share, 2025
- 12.6.6 Segment CAGR and Growth Drivers
- 12.6.7 Subsegment Market Size and Forecast
- 12.6.7.1 Internal Combustion Engine
- 12.6.7.2 Battery Electric
- 12.6.7.3 Hybrid Electric
- 12.6.7.4 CNG and LPG
- 12.6.8 Subsegment Pricing and Adoption Trends
- 12.6.9 Leading Suppliers and Competition
- 12.6.10 Regional Demand and Opportunities
- 12.7 Segment Growth Comparison
- 12.8 Segment Attractiveness and Priority Matrix
Chapter 13 India Automotive Plastics End-Use and Application Market Outlook
- 13.1 End-Use Industry and Customer Demand Structure
- 13.2 Leading Applications and Customer Groups
- 13.3 End-Use Market Size, Share and Forecast
- 13.4 Major End-Use Industry Deep Dives
- 13.4.1 Customer Requirements and Use Cases
- 13.4.2 Demand and Replacement Cycles
- 13.4.3 Technical and Regulatory Considerations
- 13.4.4 Purchasing and Procurement Models
- 13.4.5 Leading Vendors and Distribution Channels
- 13.4.6 Forecast and Commercial Opportunities
- 13.5 Emerging Applications and Cross-Segment Demand
- 13.6 End-Use Industry Investment Priorities
Chapter 14 India Automotive Plastics Geographic Market Outlook, 2025-2035
- 14.1 Domestic Market Distribution and Demand Clusters
- 14.2 State- or Province-Wise Market Size and Forecast, 2025-2035
- 14.3 City and Metropolitan Market Outlook
- 14.4 Industrial, Manufacturing and Commercial Clusters
- 14.5 Geographic Concentration of Key End Users
- 14.6 Local Pricing and Purchasing Differences
- 14.7 Domestic Production Facilities and Capacity Map
- 14.8 Local Infrastructure and Project Pipeline
- 14.9 State-Level Policy and Incentive Differences
- 14.10 Subnational Investment Hotspots and Opportunities
- 14.11 Distribution and Logistics Networks
- 14.12 Domestic Competitive Footprint
Chapter 15 India Automotive Plastics Technology, Innovation and Sustainability Outlook
- 15.1 Technology Landscape and Maturity
- 15.2 Product, Process and Service Innovation
- 15.3 AI, Automation and Digital Tools in the Industry
- 15.4 Technology Adoption and Performance Benchmarking
- 15.5 Innovation Pipeline and R&D Investment
- 15.6 Patent and Intellectual Property Trends
- 15.7 Energy Efficiency and Resource Management
- 15.8 Sustainability, Recycling and Circularity
- 15.9 Technology Roadmap, 2025-2035
- 15.10 Risks of Obsolescence and Technology Substitution
Chapter 16 India Automotive Plastics Market Key Strategic Imperatives
- 16.1 Growth and Market Entry Priorities
- 16.2 High-Return Products and Segments
- 16.3 Pricing, Profitability and Cost Optimization
- 16.4 Technology Investment and Product Differentiation
- 16.5 Supply Chain Localization and Resilience
- 16.6 Distribution and Customer Acquisition
- 16.7 Partnership, Acquisition and Capacity Strategy
- 16.8 Regional Expansion Priorities
- 16.9 Short-, Medium- and Long-Term Actions
Chapter 17 Competition Outlook
- 17.1 Industry Competition Characteristics
- 17.2 Market Structure and Concentration
- 17.3 Market Share and Competitive Positioning, 2025
- 17.4 Company-Wise Revenue and Product Benchmarking
- 17.5 Production and Service Capacity Benchmarking
- 17.6 Technology, Pricing and Differentiation
- 17.7 Regional Footprint and Distribution Strength
- 17.8 Mergers, Acquisitions and Strategic Alliances
- 17.9 New Entrants and Competitive Threats
- 17.10 Porter's Five Forces and Industry Attractiveness
- 17.11 Competitive Outlook, 2025-2035
Chapter 18 Company Profiles
- 18.1 Company Coverage and Selection Criteria
- 18.2 Reliance Industries Limited
- 18.2.1 Business Description
- 18.2.2 Company Ownership and Geographic Presence
- 18.2.3 Product and Service Portfolio
- 18.2.4 Manufacturing and Operating Footprint
- 18.2.5 Production Capacity and Expansion Plans
- 18.2.6 Financial Performance and Investment
- 18.2.7 Market Share and Competitive Position
- 18.2.8 Technology and Innovation Capabilities
- 18.2.9 Strategic Alliances or Partnerships
- 18.2.10 Recent Developments
- 18.2.11 Growth Strategy and Outlook
- 18.3 Indian Oil Corporation Limited
- 18.4 Kingfa Science & Technology (India) Limited
- 18.5 BASF India Limited
- 18.6 LyondellBasell Industries
- 18.7 Covestro (India) Private Limited
- 18.8 SABIC Innovative Plastics India Private Limited
- 18.9 APPL Industries Limited
- 18.10 Avient India Private Limited
- 18.11 Ravago Manufacturing India Private Limited
- 18.12 Other Relevant Market Participants
Note: Every listed company is profiled on the structure shown under the first company. The company list is preliminary and may change based on research findings, market developments, data availability and client requirements.
Chapter 19 Disclaimer
- 19.1 Research and Forecast Disclaimer
- 19.2 Data Source and Estimation Limitations
Note: The depth of individual sections depends on data availability for this market. Volume, capacity, trade and other unit-based metrics are included where applicable.