Cross-border trade and online retail steady freight demand
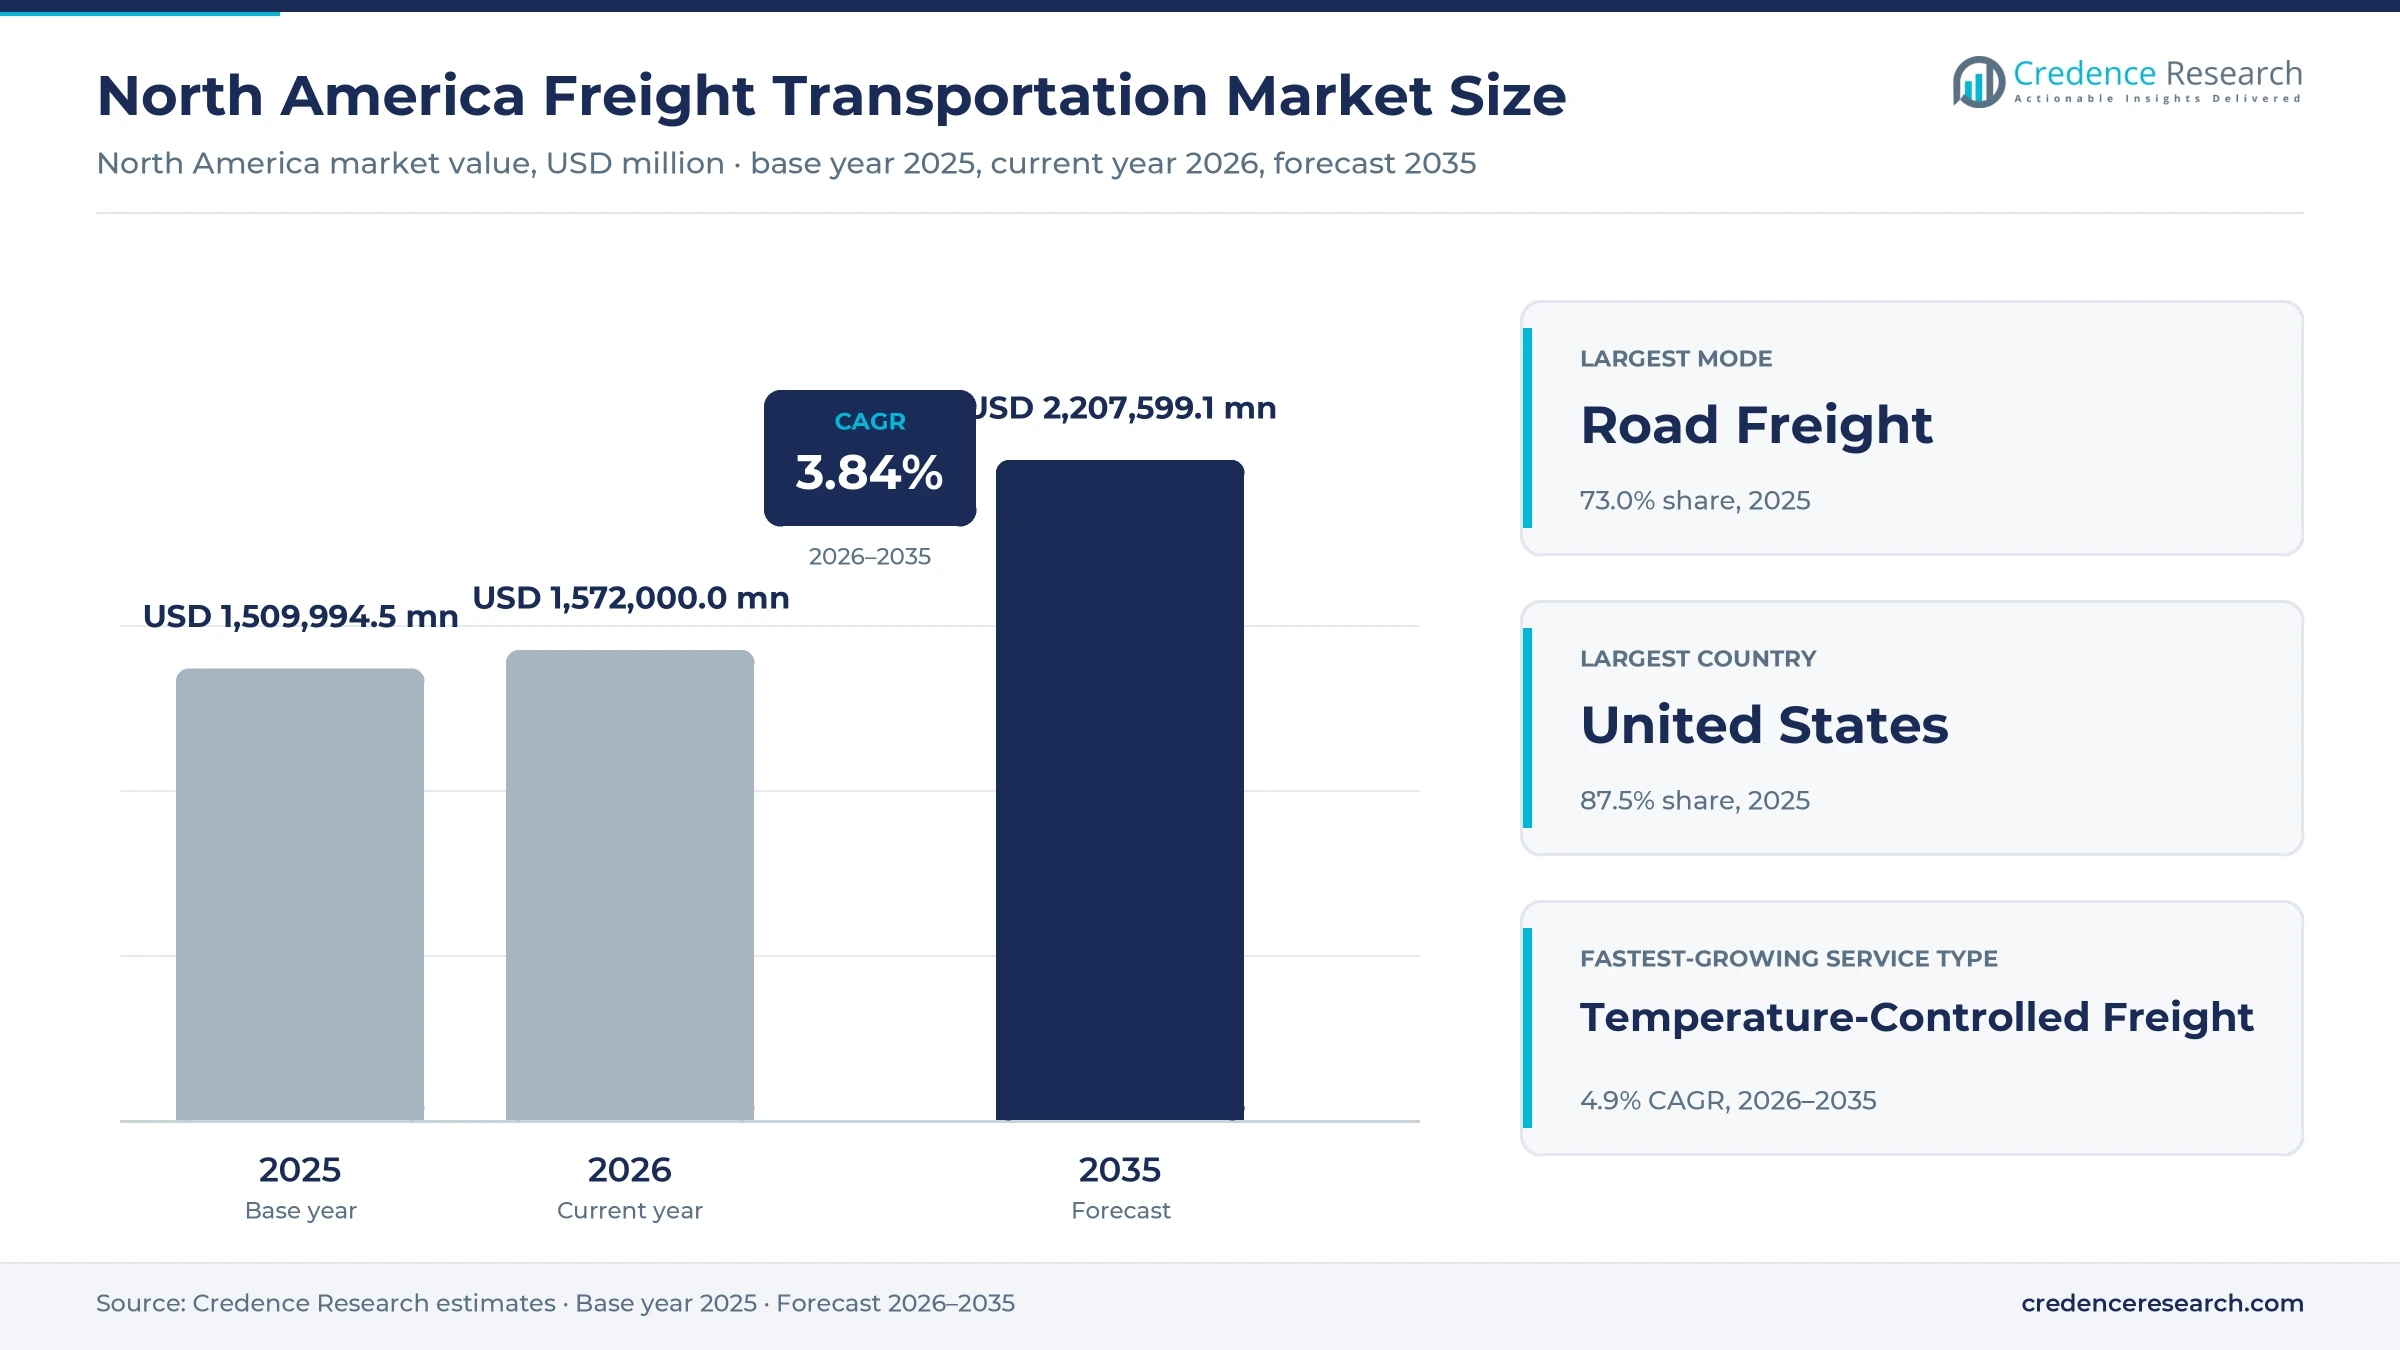
The North America freight transportation market was valued at USD 1,509.99 billion in 2025 and is projected to increase from USD 1,572.00 billion in 2026 to USD 2,207.60 billion by 2035, registering a CAGR of 3.84% during 2026–2035. Demand comes from manufacturers moving parts and finished goods between the United States, Canada and Mexico, from retailers restocking stores and filling online orders, and from bulk shippers of grain, chemicals and energy products. The United States held the largest share, 87.5% in 2025, because its domestic truckload, less-than-truckload and rail networks carry most of the continent's tonnage. Mexico is the fastest-growing country at 5.3% a year as nearshored factories lift northbound truck and rail flows. Road freight carries the largest share of value because trucks serve nearly every shipper and loading dock. The most important commercial change is rail consolidation, with a pending Union Pacific and Norfolk Southern merger that would put single-line rail service across most of the country in direct competition with long-haul trucking.
Carrier revenue across five modes defines the freight bill
The market counts the revenue that carriers earn for moving goods within and between the United States, Canada and Mexico by road, rail, air, water and pipeline, across general, specialized, temperature-controlled and express services. Buyers include direct shippers, third-party logistics providers, freight forwarders and government and defense agencies, which buy capacity through annual contracts, dedicated fleets and the spot market.
The count excludes warehousing, inventory carrying costs, customs brokerage and freight software sold on its own. Value sits with asset-based carriers, owner-operator networks, dedicated contract carriers and integrated multimodal operators, while brokers and forwarders arrange a large share of loads and earn a margin between shipper and carrier rates.
North America Freight Transportation Market Insights
- The North America freight transportation market rises from USD 1,509.99 billion in 2025 to USD 2,207.60 billion by 2035, growing at 3.84% a year as cross-border manufacturing and online retail add shipments.
- The United States held 87.5% of 2025 value, while Mexico grows fastest at 5.3% a year on nearshored northbound flows.
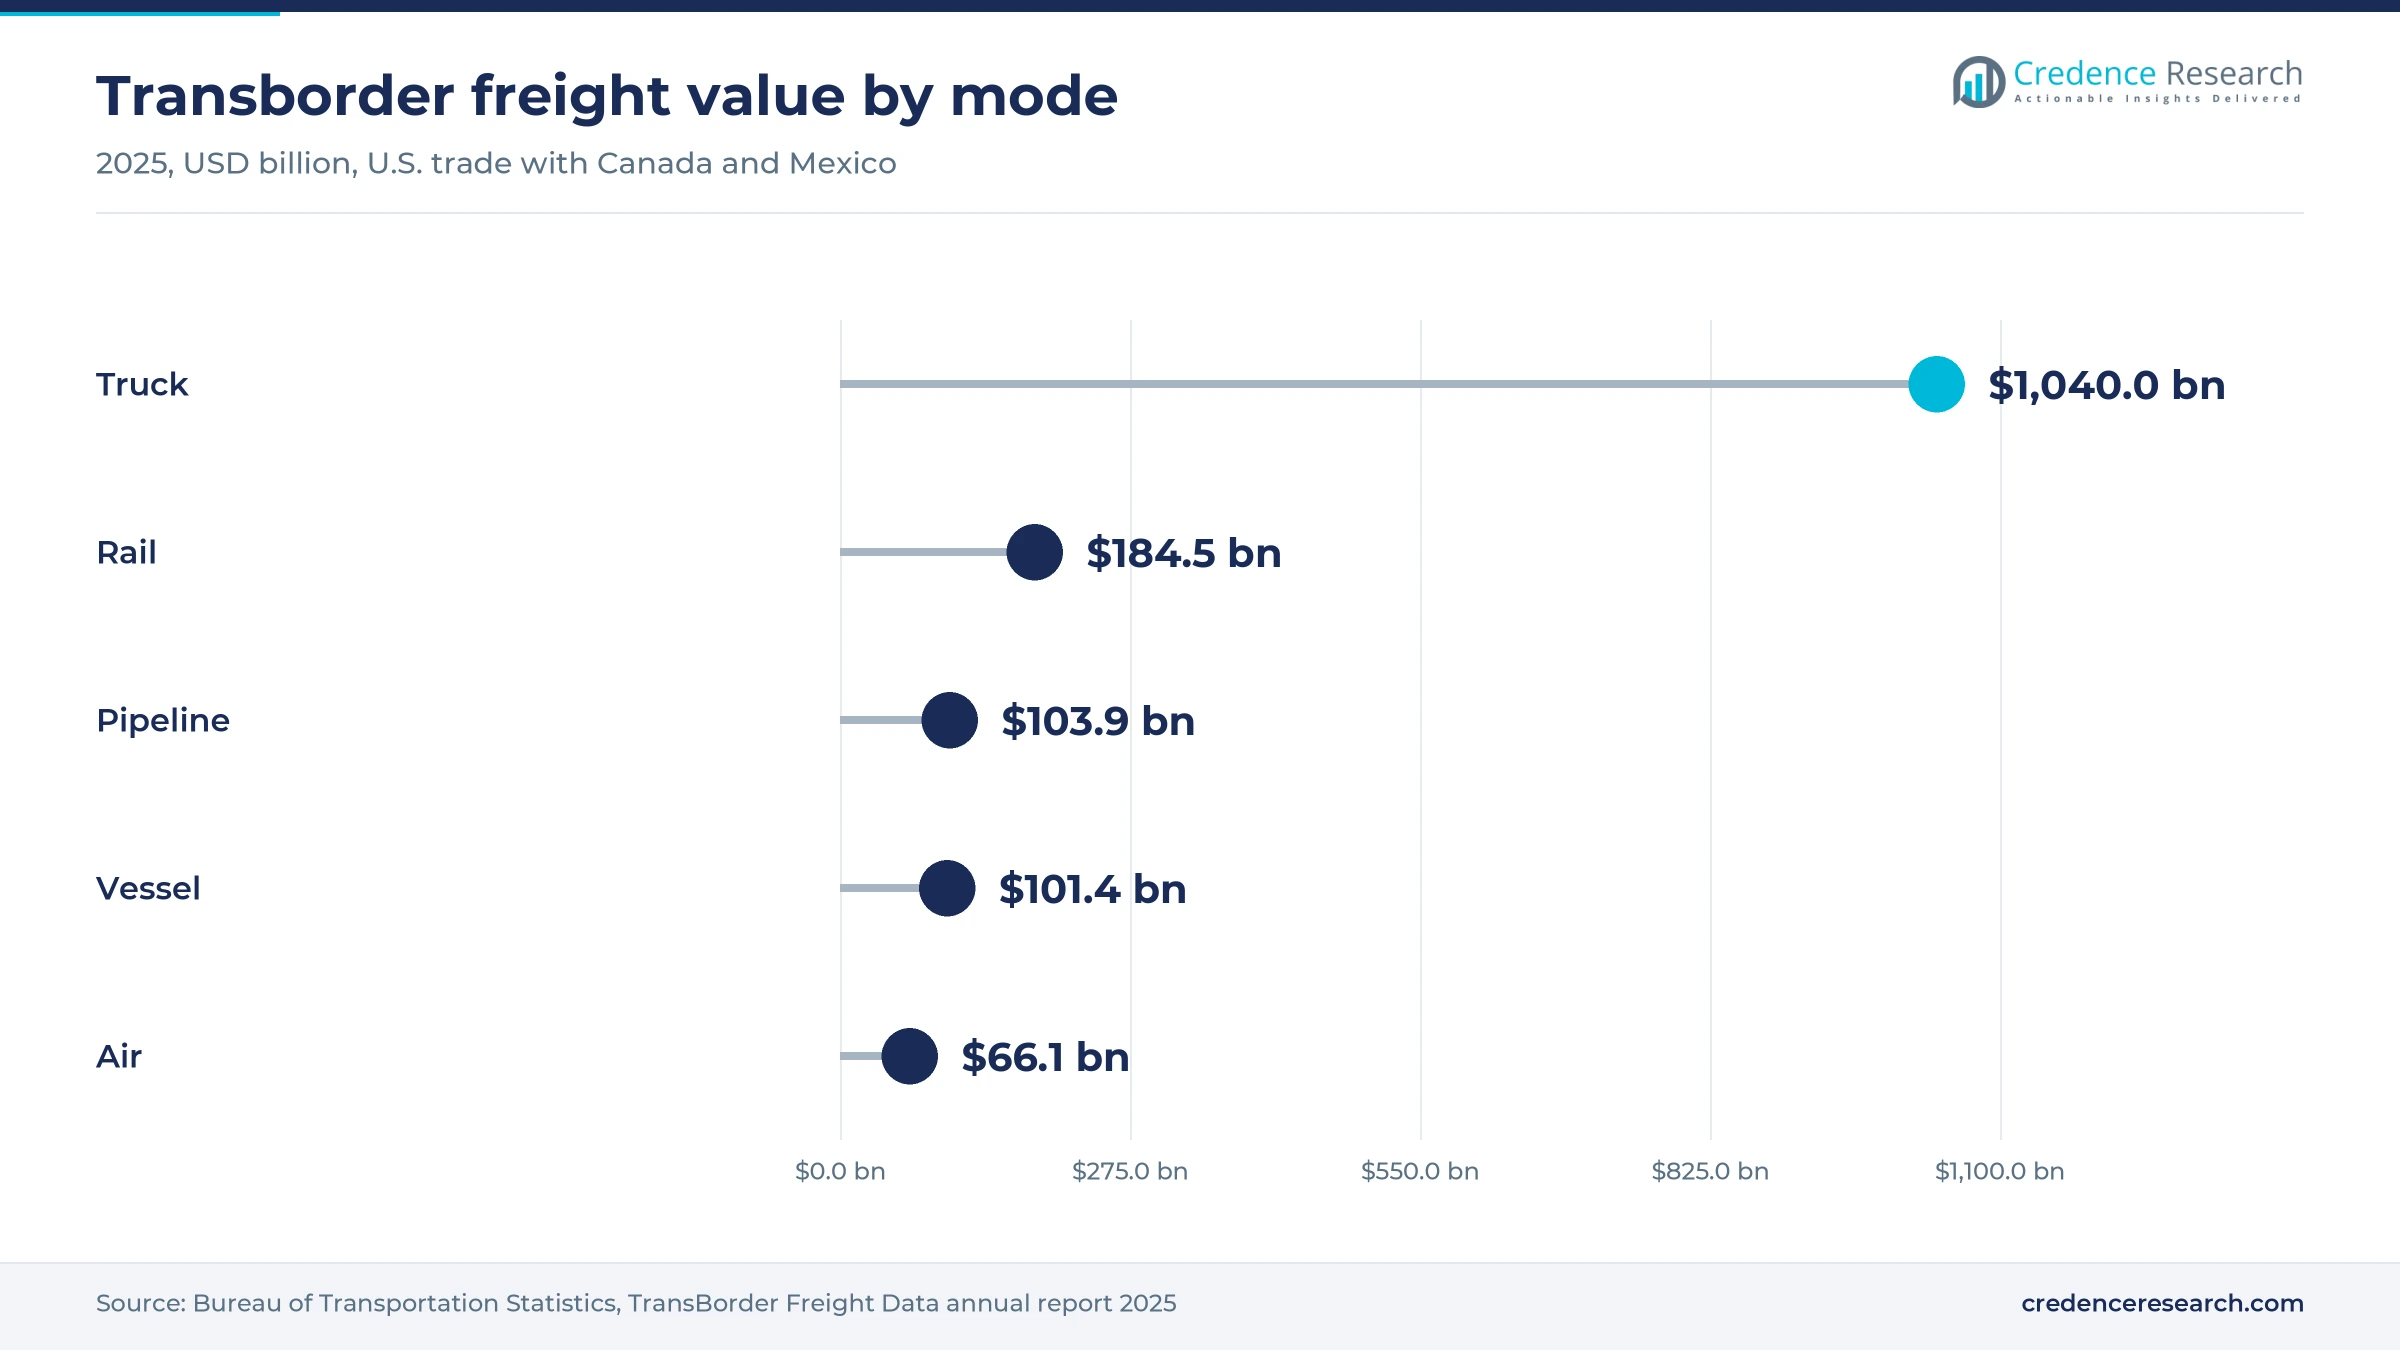
- Road Freight held 73.0% of 2025 value, and trucks moved $1.04 trillion of goods across U.S. borders in 2025, according to the Bureau of Transportation Statistics.
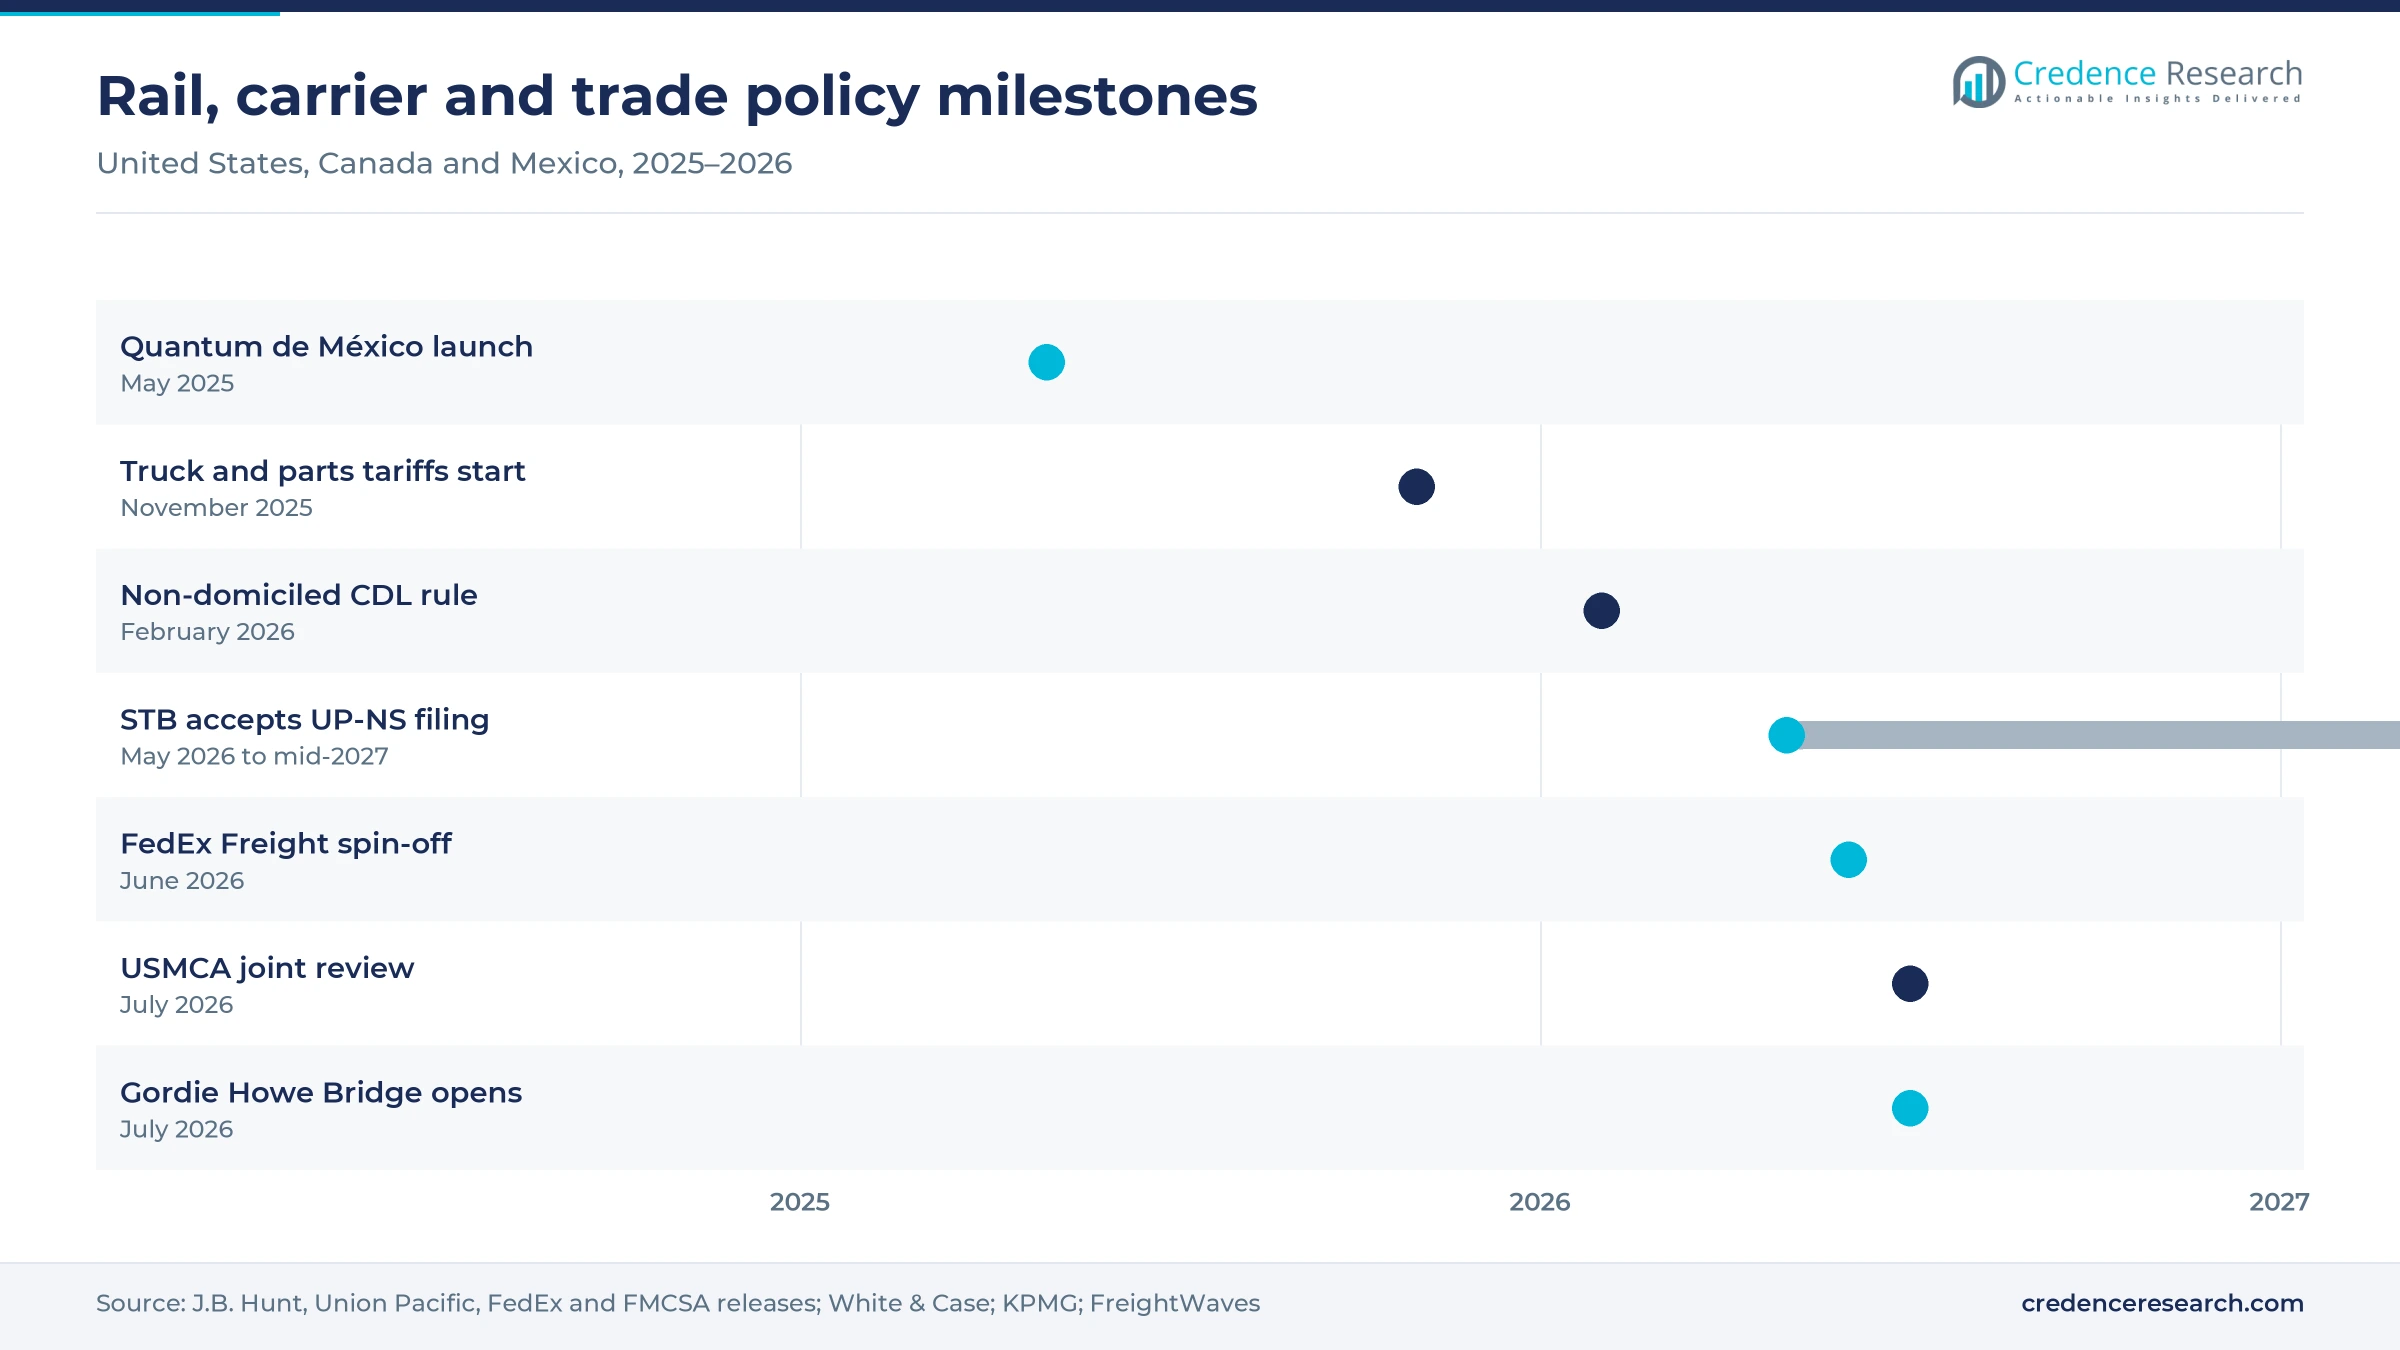
- Union Pacific said on May 28, 2026, that the Surface Transportation Board had accepted its merger application with Norfolk Southern, with closing expected in mid-2027.
- FedEx completed the spin-off of FedEx Freight on June 1, 2026, creating a standalone less-than-truckload carrier listed on the New York Stock Exchange.
Road and general freight lead as reefer and rail gain
General freight leads as temperature-controlled loads grow fastest
Based on service type, the market is categorized into general freight, specialized freight, temperature-controlled freight and express and expedited freight. General Freight led with 56.0% of 2025 value because dry van truckload and less-than-truckload networks handle most palletized goods. XPO reached 300 terminals in October 2026 with direct coverage of 99% of U.S. ZIP codes, FreightWaves reported, which shows how dense these networks have become. Temperature-Controlled Freight grows fastest at 4.9% a year, as CPKC added 1,000 refrigerated 53-foot intermodal containers, more than doubling its fleet for Midwest to Mexico food lanes. Reefer capacity carries a price premium, so this growth lifts value faster than tonnage.
Road freight leads while rail grows fastest on intermodal
Based on mode of transport, the market is categorized into road freight, rail freight, air freight and water and pipeline freight. Road Freight led with 73.0% of 2025 value because trucks reach every dock, and trucking took 59.5% of U.S. transportation costs in 2025, according to the Council of Supply Chain Management Professionals' 2026 State of Logistics report. Rail Freight grows fastest at 4.7% a year, as U.S. railroads moved 14.06 million intermodal containers and trailers in 2025, up 1.5%, the Association of American Railroads reported. Rail gains on long lanes where shippers can trade a day of transit for a lower rate.
Domestic loads lead as cross-border flows grow fastest
Based on shipment flow, the market is categorized into domestic freight, cross-border intra-North America freight, North America imports and North America exports. Domestic Freight led with 71.0% of 2025 value because most loads start and end inside one country, and U.S. trucks alone hauled about 11.27 billion tons in 2024, according to the American Trucking Associations. Cross-Border Intra-North America grows fastest at 5.0% a year as factories in northern Mexico ship to U.S. plants. Laredo, Texas, handled $344.6 billion of trade across all modes in 2025, the most of any U.S.-Mexico port, BTS data show. Carriers with bonded cross-border capacity and yards near Laredo capture most of this growth.
Manufacturing leads as retail and e-commerce grow fastest
Based on end-use industry, the market is categorized into manufacturing, retail and e-commerce, automotive and food, agriculture and chemicals. Manufacturing led with 34.0% of 2025 value because factory inputs and finished machinery move in frequent, high-value loads. Computer-related machinery and parts made up $189.1 billion, or 29.4%, of U.S.-Mexico truck freight in 2025, according to BTS. Retail and E-Commerce grows fastest at 4.5% a year, as U.S. parcel spending rose to $241.3 billion in 2025 from $229.5 billion, the State of Logistics report found. Retail shipments are smaller but more frequent, which raises revenue per pound for carriers.
| Segment Group | Leading Sub-segment | Share, 2025 | Fastest-growing Sub-segment | CAGR, 2026–2035 |
|---|---|---|---|---|
| By Service Type | General Freight | 56.0% | Temperature-Controlled Freight | 4.9% |
| By Mode of Transport | Road Freight | 73.0% | Rail Freight | 4.7% |
| By Shipment Flow | Domestic Freight | 71.0% | Cross-Border Intra-North America | 5.0% |
| By End-Use Industry | Manufacturing | 34.0% | Retail and E-Commerce | 4.5% |
Spot truck rates sit near contract as reefer keeps a premium
Truck pricing works per loaded mile, with a linehaul rate plus a fuel surcharge that moves weekly with diesel prices, while less-than-truckload rates follow weight, density and freight class. Annual contracts cover most volume, and the spot market absorbs surges and the loads that contract carriers reject. In December 2025, DAT data put the dry van spot rate only 17 cents a mile below the contract rate, a gap that tends to close as capacity tightens. Reefer and flatbed loads carry premiums for equipment and handling. For shippers, a narrow spot-contract gap is a signal to lock in contract capacity before rates rise.
| Service and rate type | Typical price or fee | Basis |
|---|---|---|
| Dry van, spot | $2.29 per mile | DAT, December 2025, via Logistics Management |
| Dry van, contract | $2.46 per mile | DAT, December 2025, via Logistics Management |
| Refrigerated, spot | $2.69 per mile | DAT, December 2025, via Logistics Management |
| Refrigerated, contract | $2.79 per mile | DAT, December 2025, via Logistics Management |
| Flatbed, spot | $2.53 per mile | DAT, December 2025, via Logistics Management |
| Flatbed, contract | $3.05 per mile | DAT, December 2025, via Logistics Management |
Request a Free Sample
Fill in your details and we'll send you a free sample report.
- Sample data tables & charts
- Research methodology
Trade, rail capacity and e-commerce lift shipment volume
Deepening cross-border trade keeps trucks and trains full
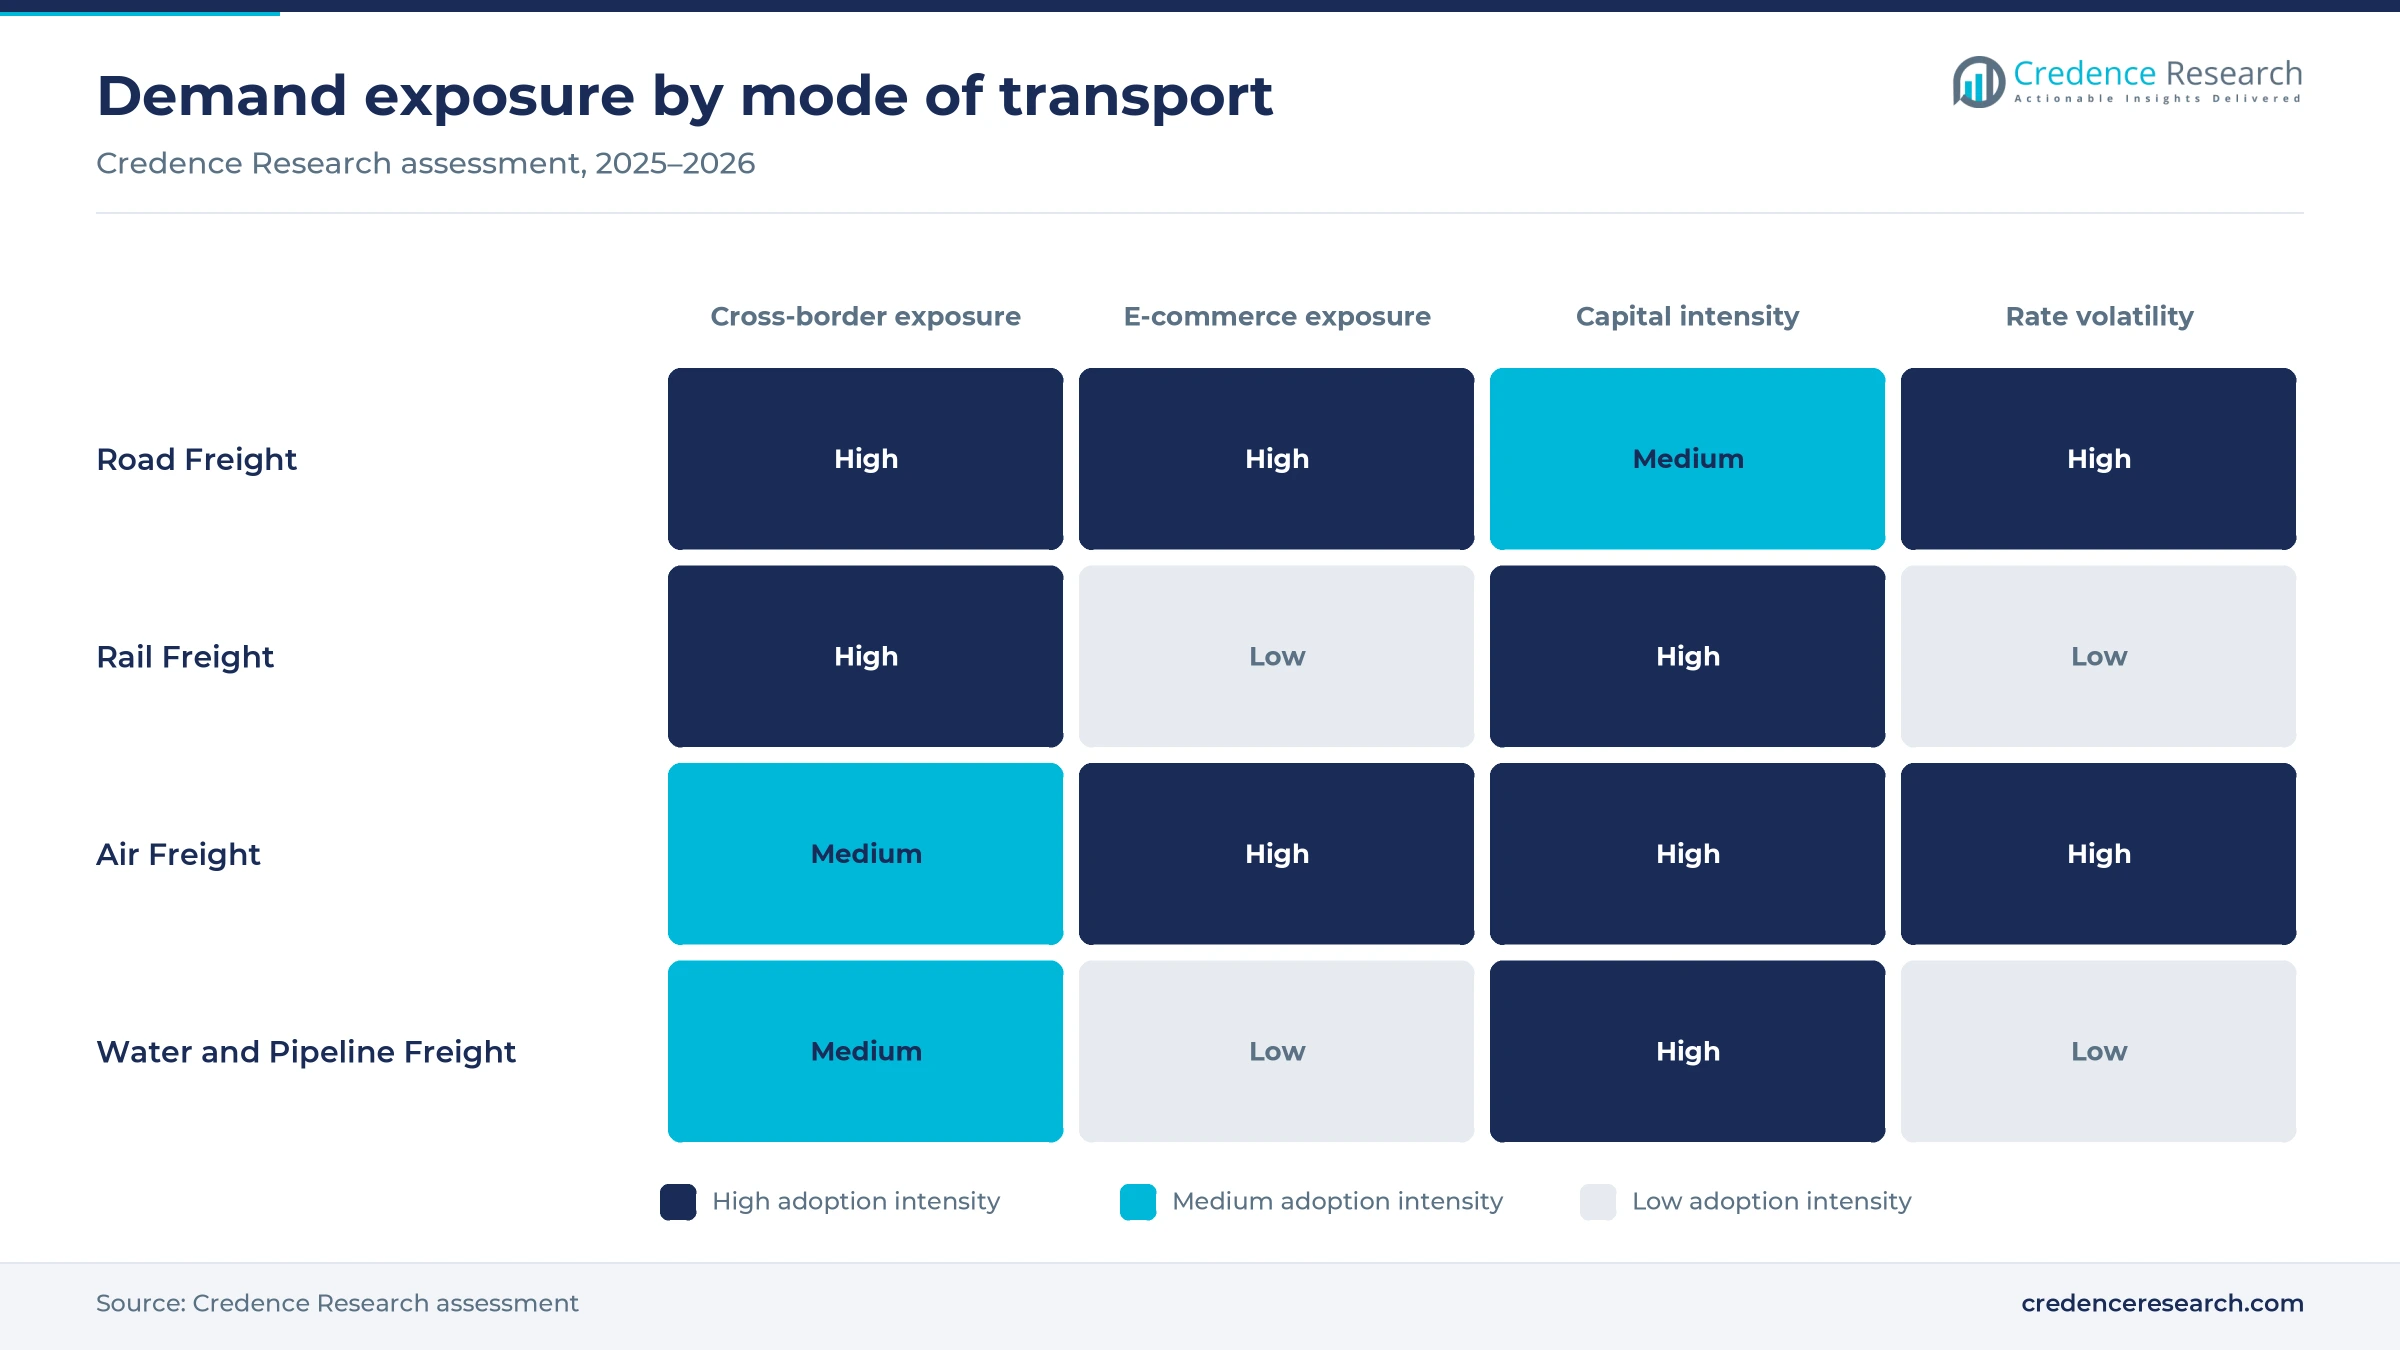
Cross-border trade is the largest single source of long-haul demand, because supply chains for vehicles, electronics and machinery cross the U.S. borders several times before a product is finished. Goods moved between the United States, Canada and Mexico were valued at $1.59 trillion in 2025, according to the Bureau of Transportation Statistics, down 1.0% from 2024 as Canadian trade weakened. Trucks carried $1.04 trillion of that total and handled 73.6% of trade with Mexico, more than any other mode, which makes trucking the default for cross-border shippers. For carriers, trade value is holding near record levels even in a weak year, so lanes into Laredo, Detroit and Port Huron remain the core of long-haul network planning.
Rail mergers, bridges and capital programs add capacity
Infrastructure spending and rail consolidation are expanding the capacity that shippers can buy, especially on long and cross-border lanes. Union Pacific said on May 28, 2026, that the Surface Transportation Board had accepted its merger application with Norfolk Southern, which would join a 23-state western network with a 22-state eastern one, with closing expected in mid-2027. CN is investing about C$2.8 billion in its 2026 capital program and supports more than 300 customer projects across its network, the railroad said in July 2026. The $4.7 billion Gordie Howe International Bridge opened on July 27, 2026, adding six lanes to a Detroit-Windsor corridor with an estimated 2.7 million to 2.9 million commercial truck crossings a year, FreightWaves reported. Fewer handoffs between railroads and trucks favor integrated operators on long lanes.
Online retail raises shipment frequency and parcel density
Online retail adds freight because it splits orders into smaller, more frequent shipments that need replenishment loads, line-haul moves and final-mile legs. E-commerce reached 17.1% of U.S. retail sales in the second quarter of 2026 and grew 12.2% from a year earlier, against 6.7% for total retail, according to the U.S. Census Bureau. UPS planned to cut its Amazon volume by more than half by June 2026 and processed about 66.5% of its volume in automated facilities at the end of 2025, FreightWaves reported. That shift pushes the largest online sellers toward in-house and regional parcel delivery networks. Carriers serving store replenishment and regional parcel lanes gain the most from this shift.
Truck tonnage growth to 2035 anchors baseline volume
Truck freight sets the baseline for demand across the region, because trucks carry most U.S. tonnage and will keep that role through the forecast period. Trucking moved 72.7% of U.S. freight tonnage and earned 76.9% of freight revenue in 2024, according to the American Trucking Associations. The association projected that trucking would still hold 76.8% of freight revenue in 2035, while rail's share of U.S. tonnage slips from 10.6% in 2024 to 9.9% as coal volumes fall, so rail's faster revenue growth comes from intermodal and cross-border lanes rather than bulk tonnage. For buyers, capacity planning still starts with truckload and less-than-truckload contracts, while rail and air serve selected lanes.
Premium intermodal and focused LTL networks reshape supply
Shift toward single-line intermodal service into Mexico
Railroads and intermodal marketers are building premium, truck-like services to win loads that cross the Mexican border. A premium service that BNSF and GMXT launched with intermodal marketer J.B. Hunt on May 30, 2025, called Quantum de México, offers on-time performance above 95% and transit up to one day faster than standard intermodal, the partners said. They also noted that nearly 70% of goods crossing the U.S.-Mexico border still move by truck, which defines the conversion target. CPKC runs its Mexico Midwest Express on a single line and quotes 98 hours from Chicago to San Luis Potosí, which it says is a day faster than its nearest competitor, Railway Age reported. Such services narrow the gap with trucks, so shippers can now tender time-sensitive parts to rail on selected lanes.
Rise of focused, standalone less-than-truckload networks
Less-than-truckload carriers are reorganizing into focused, standalone networks, which changes how shippers buy regional and national coverage. FedEx completed the spin-off of FedEx Freight on June 1, 2026, and the new company began trading on the New York Stock Exchange as an independent carrier. Knight-Swift moved its regional carriers under the AAA Cooper brand from Jan. 1, 2026, after its DHE purchase added 14 terminals and 465 doors, Transport Topics reported. Old Dominion plans about $265 million of 2026 capital spending, including $125 million for real estate and service center expansion. Shippers now deal with fewer but larger national carriers, so terminal density and claims performance count for more in bid decisions.
Opportunity in temperature-controlled cross-border lanes
Food shippers need more refrigerated capacity on cross-border and long-haul lanes, which opens room for carriers and railroads that can guarantee temperature and traceability. The FDA extended the compliance date of its food traceability rule to July 20, 2028, giving shippers time to build lot-level records with their carriers, CSP Daily News reported. CPKC's Mexico Midwest Express moves fresh produce, baked goods and candy northbound and beef, chicken and pork southbound, so one train earns revenue in both directions. The service offers third-day delivery to Laredo and 4.5-day delivery to San Luis Potosí, Railway Age reported, which keeps fresh loads within shelf-life windows. Operators that pair reefer fleets with cold chain equipment and data logging can sell traceability as part of the rate.
Opportunity in cargo security and shipment visibility
Rising theft losses create demand for secure parking, vetted carriers and real-time tracking, services that shippers increasingly buy together with the move itself. Verisk CargoNet counted 3,594 supply chain crime events in the United States and Canada in 2025 and estimated losses of nearly $725 million, up 60% from 2024. The average value per theft rose to $273,990 from $202,364, and California led with 1,218 incidents. UPS had installed RFID tracking in all of its U.S. package cars during 2025, FreightWaves reported, which shows how large carriers are adding item-level visibility. Carriers that can prove custody at every handoff can charge a premium on high-value electronics and pharmaceutical loads.
Soft demand, tariffs and driver rules squeeze carriers
Soft industrial demand leaves LTL networks underused
Industrial freight demand has been weak, which leaves terminal networks built for higher volumes running below capacity. Old Dominion reported that its less-than-truckload tons per day fell 10.7% in the fourth quarter of 2025 from a year earlier, and its operating ratio rose to 76.7% from 75.9%. Even a carrier with strong service cannot fill doors when manufacturing output stalls. Carriers are holding prices, cutting purchased line-haul and delaying hiring until volumes recover.
USMCA review uncertainty clouds long-term lane planning
Trade policy risk is now an annual event, which complicates long-term lane, plant and equipment decisions. At the July 1, 2026, joint review, the United States declined to renew the USMCA in its current form, triggering yearly reviews until the parties agree on an extension or the pact expires on July 1, 2036, White & Case noted. Shippers weighing new Mexican plants may delay commitments as a result. Carriers respond with shorter contracts and tariff clauses that pass new costs to customers.
Truck and parts tariffs raise equipment costs
Equipment costs are rising because imported trucks and components now carry tariffs. A Section 232 proclamation signed on Oct. 17, 2025, set a 25% tariff on imported medium- and heavy-duty trucks and parts, including engines, transmissions and tires, from Nov. 1, 2025, KPMG noted, with USMCA-qualifying trucks taxed only on non-U.S. content. Fleets replacing tractors face higher capital costs, which weighs most on small carriers with thin margins and limited access to credit.
Stricter driver licensing rules tighten truck capacity
Driver supply is tightening because federal rules now exclude many foreign-domiciled drivers. The Federal Motor Carrier Safety Administration finalized a rule on Feb. 11, 2026, limiting non-domiciled commercial driver's licenses to H-2A, H-2B and E-2 visa holders and ending the use of employment authorization documents as proof of eligibility. The agency said more than 30 states had issued tens of thousands of such licenses to ineligible drivers. Carriers that relied on these drivers must recruit replacements, which raises wage costs on long-haul lanes.
United States dominates while Mexico grows fastest
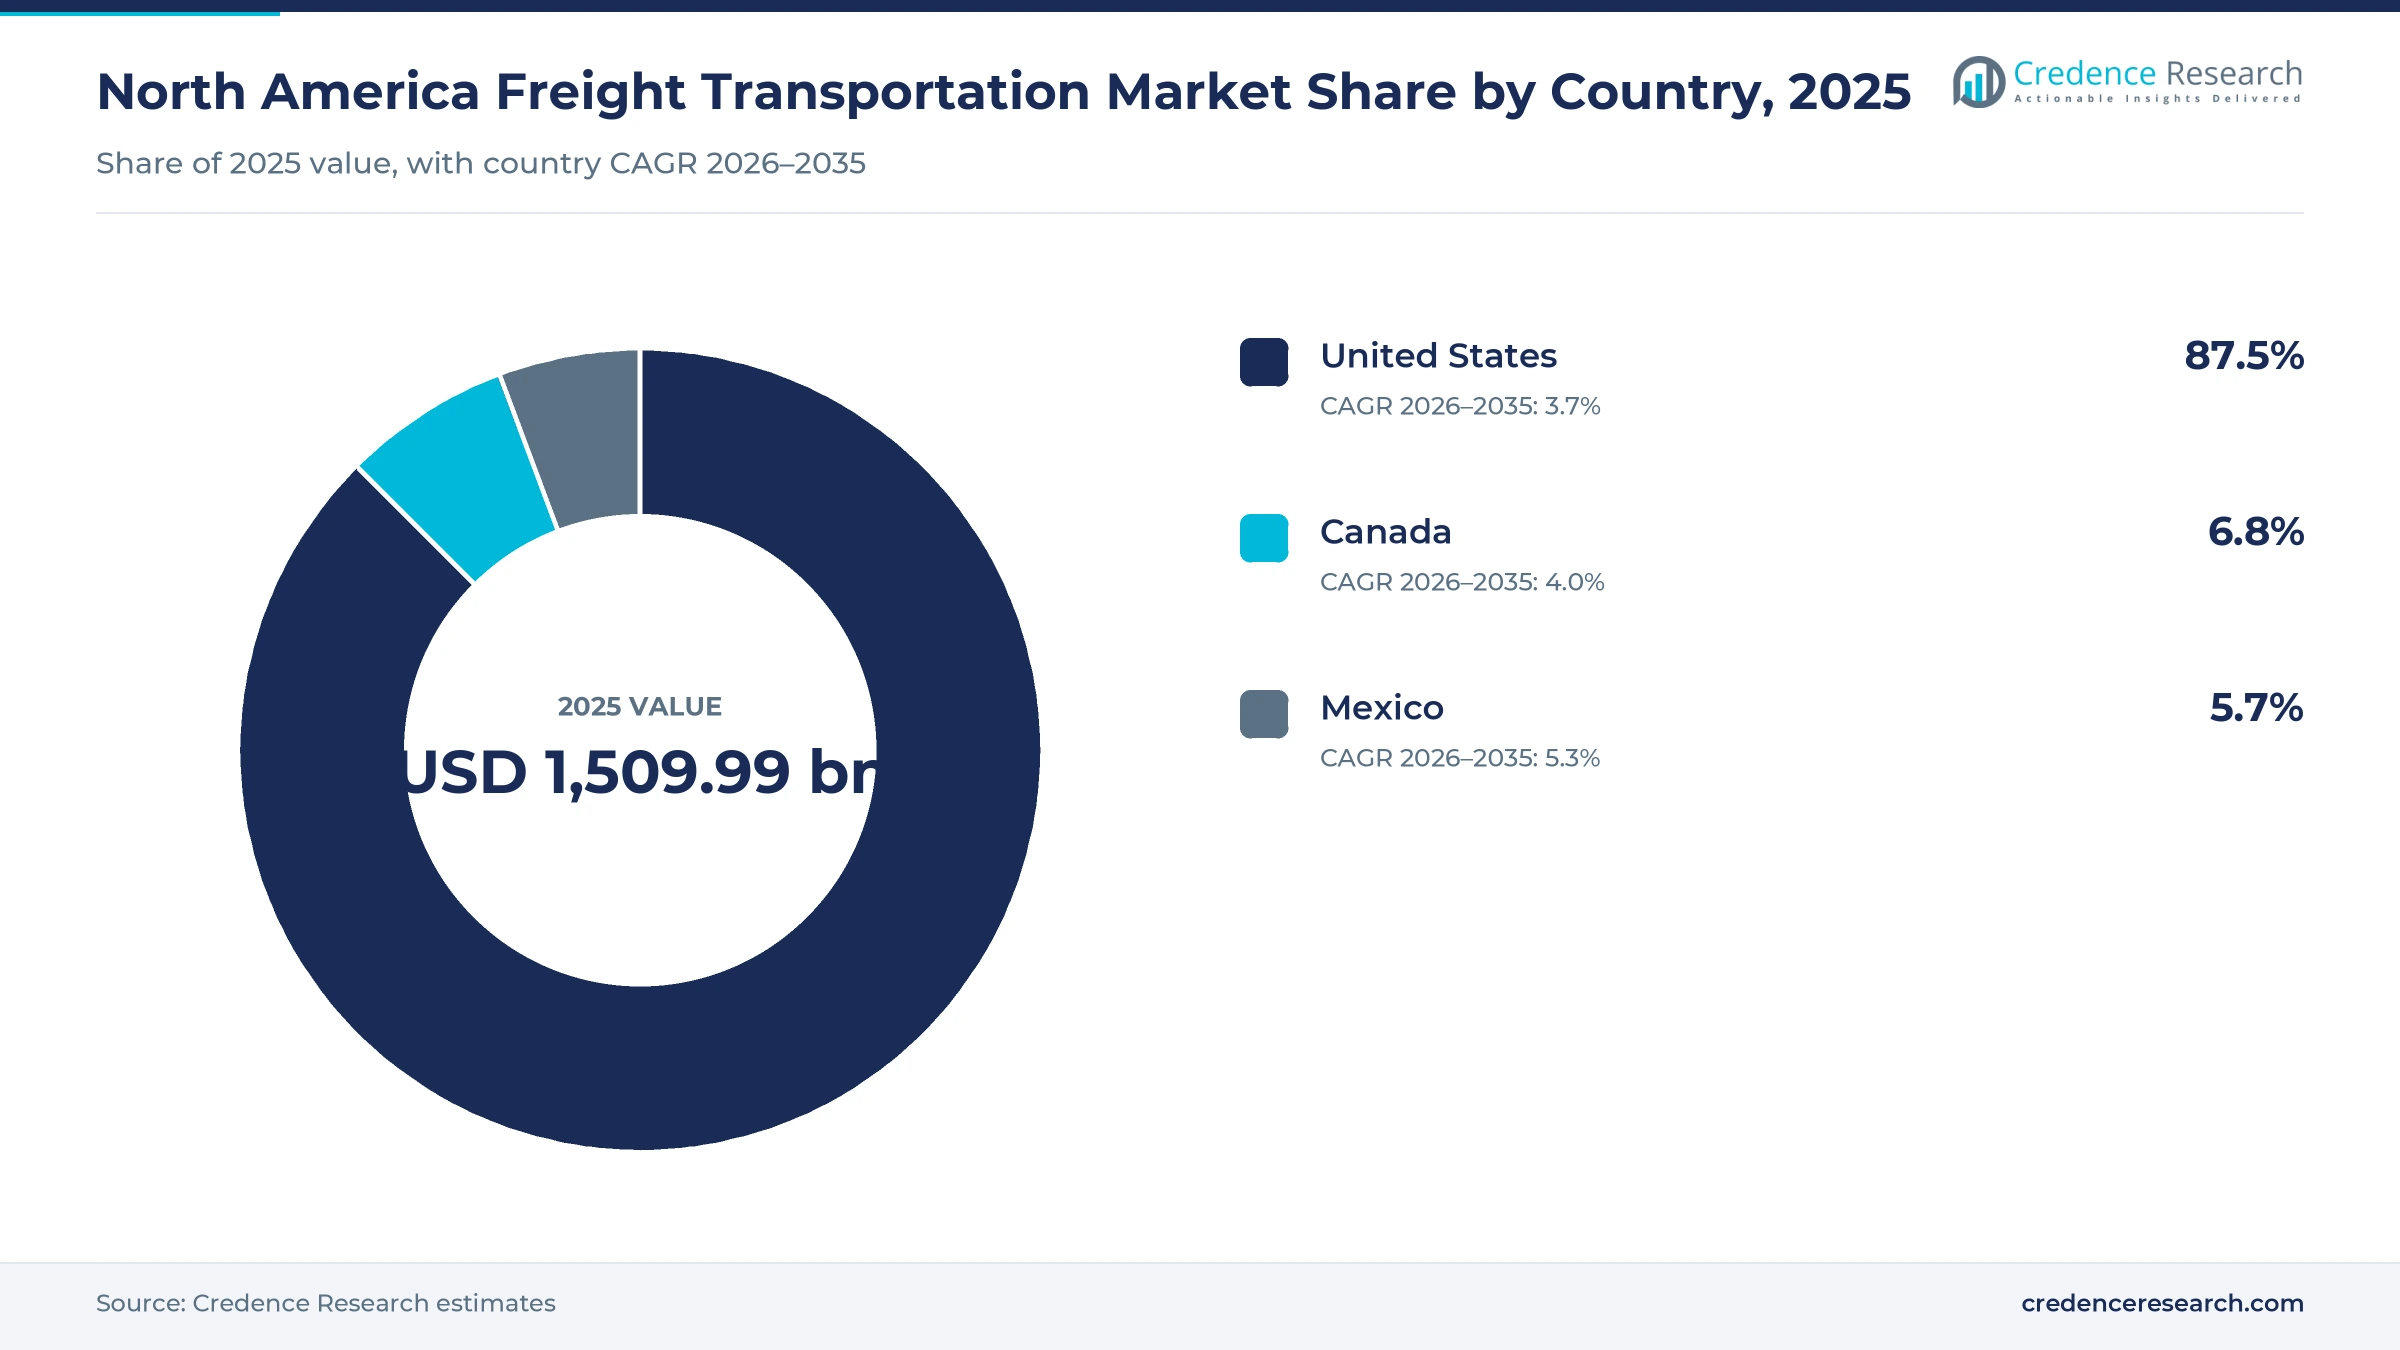
Country shares of North America freight transportation spending in 2025 follow the Credence Research regional model, built from carrier revenue, logistics cost data and trade flows in each country. The United States dominates value, while Mexico grows fastest on cross-border manufacturing.
| Country | Value, 2025 (USD billion) | Share, 2025 | CAGR, 2026–2035 |
|---|---|---|---|
| United States | 1,321.25 | 87.5% | 3.7% |
| Canada | 102.68 | 6.8% | 4.0% |
| Mexico | 86.07 | 5.7% | 5.3% |
United States carries most of the continent's freight bill
The United States held an 87.5% share of 2025 value and grows at 3.7% a year. U.S. business logistics costs reached $2.40 trillion in 2025, down 1% from 2024, and transportation made up 61.8% of that total, the State of Logistics report found. Logistics costs fell to 7.8% of gross domestic product from 8.3%, which shows how soft rates offset steady volumes. The country holds the densest truckload lanes, the largest Class I rail networks and the main parcel hubs, so continental contracts are usually set here.
Canada leans on rail as cross-border trade softens
Canada held a 6.8% share of 2025 value and grows at 4.0% a year. U.S.-Canada freight trade fell 6.4% to $712.8 billion in 2025, BTS data show, and Canada's priority in talks with Washington remains U.S. tariffs on steel, aluminum, autos and lumber. Rail is steadier, as Statistics Canada reported that Canadian railways carried 190.6 million metric tons in the first half of 2026, up 1.3%, with June loadings up 3.2%. Grain loadings support rail, while truck carriers depend on Ontario and Quebec manufacturing lanes.
Mexico grows fastest on nearshored northbound flows
Mexico held 5.7% of 2025 value and grows fastest at 5.3% a year. U.S.-Mexico freight trade rose 3.9% to $872.8 billion in 2025, making Mexico the larger of the two U.S. neighbors for freight trade, according to BTS. Road carriers moved 430.3 million metric tons inside Mexico between October 2024 and June 2025, Autocosmos reported citing federal data, and road freight contributes about 4% of GDP, according to INEGI. Carriers with Mexican operating authority, bonded yards and security escorts capture most of this growth.
Rail merger, LTL spin-off and Mexico intermodal moves
| Development | Status and market relevance |
|---|---|
| In May 2025, J.B. Hunt, BNSF and GMXT launched Quantum de México, a premium intermodal service linking Chicago, Dallas-Fort Worth and the West Coast with Mexico City, Guadalajara and Monterrey. | In service; J.B. Hunt opened an office in Querétaro |
| In October 2025, Knight-Swift told customers that its less-than-truckload units would operate under the AAA Cooper Transportation brand from Jan. 1, 2026. | Completed; prices unchanged by the consolidation |
| In May 2026, Union Pacific said the Surface Transportation Board had accepted its merger application with Norfolk Southern. | Under review; closing expected in mid-2027 |
| In June 2026, FedEx completed the spin-off of FedEx Freight as an independent, NYSE-listed less-than-truckload carrier. | Completed; FedEx kept a 19.9% stake to sell within 24 months |
| In October 2026, XPO opened terminals in Mesa, Arizona and Cameron, Missouri, adding 118 dock doors to its network. | Open; serving the Phoenix and Kansas City markets |
Telematics, automation and RFID change cargo handling
- Electronic logging and telematics record hours of service and location for every truck, which gives brokers and shippers the data to price lanes and verify delivery times.
- Automated sortation lets parcel and less-than-truckload hubs process more shipments per hour with fewer workers, a shift UPS has pursued across its network.
- RFID and item-level tracking link packages to vehicles, hub scans and smart parcel lockers, which cuts misloads and helps carriers prove custody on high-value loads.
- Digital load matching pairs loads with available trucks in real time, which speeds tendering on spot lanes and lets owner-operators find backhauls faster.
Need a Custom Version of This Report?
Tailor the scope, geography, or segments to your exact requirements.
- Custom geography or segment scope
- Direct access to our analyst team
Rail, parcel and LTL leaders compete across modes
Competition runs along mode lines, but the largest groups increasingly sell across them. UPS and FedEx compete in parcel and express, while FedEx Freight now competes as a standalone carrier against Old Dominion, XPO and Knight-Swift's AAA Cooper in less-than-truckload. Union Pacific, BNSF, CN and CPKC compete for long-haul and cross-border rail volume, and the pending Union Pacific and Norfolk Southern combination would join western and eastern networks under one owner. Rather than owning track or locomotives, the intermodal marketer J.B. Hunt partners with BNSF and GMXT and wins loads through marketing, containers and drayage. Truckload remains open to thousands of small carriers, so large fleets compete on dedicated contracts, technology and safety records. Many shippers also buy transport together with warehousing and distribution services from integrated providers, which gives asset-light third-party logistics firms a role between shippers and carriers.
Fragmented trucking meets concentrated rail and LTL networks
The supply side has three layers with very different economics. Truckload is highly fragmented, with large fleets such as Knight-Swift and J.B. Hunt competing against owner-operators and small carriers that can enter with a single tractor. Less-than-truckload and Class I rail are concentrated because terminals and track are scarce, and XPO paid $870 million in 2023 for 28 former Yellow terminals, FreightWaves noted. Entry barriers are therefore highest where networks need scarce terminal real estate near large cities. Margins sit with dense LTL networks and railroads, while truckload margins swing with the spot cycle and brokers earn on the spread between shipper and carrier rates.
Companies profiled and their roles in this market
| Company | Type | Role in the market |
|---|---|---|
| UPS | Parcel and express carrier | Planned to halve Amazon volume by June 2026 and is automating hubs |
| FedEx Corporation | Parcel and express carrier | Spun off FedEx Freight in June 2026 and kept a 19.9% stake |
| Union Pacific | Class I railroad | Western U.S. railroad seeking approval to merge with Norfolk Southern |
| BNSF Railway | Class I railroad | Runs Quantum and Quantum de México intermodal services with J.B. Hunt |
| Canadian National Railway | Class I railroad | Investing about C$2.8 billion in its 2026 capital program |
| Canadian Pacific Kansas City | Class I railroad | Operates single-line Mexico Midwest Express intermodal service |
| J.B. Hunt Transport Services | Intermodal and dedicated carrier | Markets rail intermodal with BNSF and GMXT and opened a Querétaro office |
| Knight-Swift Transportation Holdings | Truckload and LTL carrier | Unified its LTL units under the AAA Cooper brand in January 2026 |
| Old Dominion Freight Line | LTL carrier | Plans about $265 million of 2026 capital spending on service centers and equipment |
| XPO | LTL carrier | Operates about 300 terminals with cross-border service to Canada and Mexico |
Steady demand meets a reshaped carrier base
Credence Research's view is that North American freight demand is steadier than the rate cycle suggests. Cross-border demand held near $1.6 trillion of trade in a weak 2025, online retail keeps adding shipments, and trucks remain the default mode. The bigger change is on the supply side, where rail consolidation, premium intermodal products and standalone LTL networks give shippers more choices on long and cross-border lanes. Trade policy is the main risk, because annual USMCA reviews make plant decisions harder. Carriers with cross-border authority, dense terminals and rail partnerships are best placed through 2035.
Values built from carrier revenue and trade flows
The report uses 2025 as the base year for the North America freight transportation estimates and forecasts demand to 2035. Market values come from the Credence Research model, built from carrier freight revenue by mode, cross-border trade flows and national logistics cost data. Country, segment and mode splits for 2025 are Credence Research estimates built from public data. Sources used include the Bureau of Transportation Statistics, the U.S. Census Bureau, Statistics Canada, the Federal Motor Carrier Safety Administration, INEGI, trade associations, company announcements and trade press. No interviews or surveys were conducted by Credence Research for this report.
Cross-border lanes and rail gains carry growth to 2035
By 2035 the North America freight transportation market reaches USD 2,207.60 billion, growing at 3.84% a year from USD 1,572.00 billion in 2026. Road freight keeps the largest share, but rail gains on long and cross-border lanes as single-line intermodal services mature. Mexico grows fastest as nearshored plants ship north, while Canada depends on rail-heavy commodity flows. Online retail and temperature-controlled food lanes lift value per shipment. Carriers that combine cross-border capability, terminal density and rail partnerships will take most of the new volume, while trade policy reviews decide how fast the cross-border gains arrive.
Trade policy and rail approval set the range of outcomes
The range of outcomes depends mainly on whether USMCA trade terms stay intact through the annual reviews and how quickly rail consolidation delivers single-line service. Stable trade rules would keep nearshoring investment flowing into northern Mexico and lift cross-border truck and rail demand. A breakdown in the reviews, or higher sectoral tariffs, would cut cross-border volume and slow plant decisions. Diesel prices and the truckload rate cycle add year-to-year swings around each case.
| Scenario | CAGR, 2026–2035 | Value, 2035 | What has to hold |
|---|---|---|---|
| Downside | 2.6% | USD 1,987.48 billion | USMCA reviews stall and new tariffs cut cross-border manufacturing shipments for several years |
| Base | 3.84% | USD 2,207.60 billion | Trade terms hold, truck tonnage grows steadily and the rail merger closes on schedule |
| Upside | 4.8% | USD 2,405.45 billion | An early USMCA extension and faster intermodal conversion lift cross-border and long-haul volumes |
Frequently Asked Questions
How big is the North America freight transportation market?
Which mode of transport leads the market?
Which country holds the largest share?
How much freight crosses U.S. borders each year?
Which service type grows fastest?
How did the USMCA joint review affect freight planning?
What are truckload spot rates?
Who are the key companies in the market?
Table of Content
Chapter 1 Market Segmentation
- 1.1 Segmentation Framework
- 1.1.1 Product and Service Classification
- 1.1.2 Application and End-Use Classification
- 1.1.3 Technology and Solution Classification
- 1.1.4 Customer and Distribution Channel Classification
- 1.1.5 Geographic Segmentation
- 1.1.6 Market Segment Definitions and Boundaries
- 1.2 By Service Type
- 1.2.1 General Freight
- 1.2.2 Specialized Freight
- 1.2.3 Temperature-Controlled Freight
- 1.2.4 Express and Expedited Freight
- 1.3 By Mode of Transport
- 1.3.1 Road Freight
- 1.3.2 Rail Freight
- 1.3.3 Air Freight
- 1.3.4 Water and Pipeline Freight
- 1.4 By Shipment Flow
- 1.4.1 Domestic Freight
- 1.4.2 Cross-Border Intra-North America
- 1.4.3 North America Imports
- 1.4.4 North America Exports
- 1.5 By End-Use Industry
- 1.5.1 Manufacturing
- 1.5.2 Retail and E-Commerce
- 1.5.3 Automotive
- 1.5.4 Food, Agriculture and Chemicals
- 1.6 By Country
- 1.6.1 United States
- 1.6.2 Canada
- 1.6.3 Mexico
Chapter 2 Introduction
- 2.1 Report Objectives and Scope
- 2.2 Product Definition and Industry Terminology
- 2.3 Market Inclusions and Exclusions
- 2.4 Research Process
- 2.4.1 Primary Research and Expert Interviews
- 2.4.2 Secondary Research and Source Review
- 2.4.3 Top-Down and Bottom-Up Estimation
- 2.4.4 Data Triangulation and Verification
- 2.5 Market Size Measurement Basis
- 2.5.1 2025: USD 1,509.99 billion → 2035: USD 2,207.60 billion
- 2.6 Historical and Forecast Reference Periods
- 2.6.1 Historical Period: 2018-2025
- 2.6.2 Base Year: 2025
- 2.6.3 Forecast Period: 2025-2035
- 2.7 Research Assumptions and Limitations
Chapter 3 Executive Summary
- 3.1 Market Snapshot and Key Findings
- 3.2 Base-Year Market Size, 2025
- 3.3 Forecast Market Size, 2035
- 3.4 Revenue and Volume Growth Outlook
- 3.5 Key Demand and Supply Indicators
- 3.6 Leading Market Segments
- 3.7 Fastest-Growing Market Opportunities
- 3.8 Regional Performance Highlights
- 3.9 Technology and Industry Transformation
- 3.10 Competitive Landscape Summary
- 3.11 Analyst View and Strategic Implications
Chapter 4 North America Freight Transportation Market Trends and Developments
- 4.1 Historical Industry Development, 2018-2025
- 4.2 Recent Market Trends and Developments
- 4.3 Demand and Customer Behavior Trends
- 4.4 Technology and Product Innovation
- 4.5 Artificial Intelligence, Automation and Digitalization
- 4.6 Local Manufacturing and Supply Chain Realignment
- 4.7 Industry Partnerships, Mergers and Acquisitions
- 4.8 Sustainability and Circular Economy Developments
- 4.9 Government and Private Sector Investment Trends
- 4.10 Emerging Business Models and Commercialization
- 4.11 Industry Developments and Announcements
Chapter 5 North America Freight Transportation Market Production, Supply and Demand Analysis
- 5.1 Demand Trend and Consumption Analysis, 2018-2025
- 5.2 Demand Forecast, 2025-2035
- 5.3 Production and Output Trend, 2018-2025
- 5.4 Production and Output Forecast, 2025-2035
- 5.5 Installed Capacity and Capacity Utilization
- 5.6 Company-Wise Production Plants and Statistics
- 5.6.1 Installed Production Capacity
- 5.6.2 Actual Production
- 5.6.3 Planned Capacity and Expansion Targets
- 5.7 Supply Chain Structure and Procurement Trends
- 5.8 Supply-Demand Gap and Bottlenecks
- 5.9 Import Dependence and Sourcing Structure
- 5.10 Contract Manufacturing and Outsourcing
- 5.11 Regional Supply and Demand Concentration
Chapter 6 North America Freight Transportation Market Pricing Analysis
- 6.1 Pricing Structure and Measurement
- 6.2 Historical Pricing Trends, 2018-2025
- 6.3 Pricing Outlook, 2025-2035
- 6.4 Average Selling Price and Unit Economics
- 6.5 Pricing by Product and Market Segment
- 6.6 Geographic Pricing Differences
- 6.7 Key Input, Energy, Labor and Logistics Costs
- 6.8 Contract Pricing and Purchasing Models
- 6.9 Pricing Sensitivity and Competitive Positioning
- 6.10 Price, Margin and Profitability Implications
Chapter 7 North America Freight Transportation Market Dynamics
- 7.1 Market Growth Drivers
- 7.1.1 Demand-Side Drivers
- 7.1.2 Technology and Innovation Drivers
- 7.1.3 Infrastructure and Investment Drivers
- 7.1.4 Regulatory and Policy Drivers
- 7.2 Market Restraints
- 7.2.1 Cost and Affordability Constraints
- 7.2.2 Technology and Adoption Barriers
- 7.2.3 Supply Chain and Operational Constraints
- 7.3 Market Challenges
- 7.3.1 Competitive Pressure and Margin Erosion
- 7.3.2 Skills, Infrastructure and Implementation Gaps
- 7.4 Emerging Market Opportunities
- 7.5 Market Dynamics Impact and Time-Horizon Assessment
Chapter 8 North America Freight Transportation Value Chain Analysis
- 8.1 Industry Value Chain Overview
- 8.2 Upstream Suppliers and Critical Inputs
- 8.3 Technology and Component Providers
- 8.4 Manufacturing or Service Delivery
- 8.5 Distribution, Channel Partners and Integrators
- 8.6 Downstream Applications and End Users
- 8.7 Value Addition and Profit Pools
- 8.8 Vertical Integration and Outsourcing
- 8.9 Supplier Concentration and Risk
- 8.10 Supply Chain Localization and Resilience
Chapter 9 North America Freight Transportation Market Regulations and Policies
- 9.1 Relevant Laws, Standards and Compliance Frameworks
- 9.2 Product, Service, Safety and Quality Requirements
- 9.3 Government Policies, Incentives and Subsidies
- 9.4 Imports, Exports and Trade Barriers
- 9.5 Public Procurement and Local Content Requirements
- 9.6 Environmental and Sustainability Compliance
- 9.7 Upcoming Policy Changes and Market Implications
Chapter 10 North America Freight Transportation Market Hotspots and Opportunities
- 10.1 Market Opportunity Mapping and Growth Hotspots
- 10.2 High-Growth Applications and Customer Groups
- 10.3 Underserved Markets and White-Space Opportunities
- 10.4 Emerging Technology and Product Opportunities
- 10.5 New Capacity and Investment Hotspots
- 10.6 Market Entry and Expansion Opportunities
- 10.7 Distribution and Partnership Opportunities
- 10.8 Near-Term and Long-Term Commercial Potential
- 10.9 Opportunity Attractiveness and Execution Risks
Chapter 11 North America Freight Transportation Market Outlook, 2025-2035
- 11.1 Market Size and Analysis
- 11.1.1 Revenue (Market Measurement: 2025: USD 1,509.99 billion → 2035: USD 2,207.60 billion)
- 11.1.2 Market Volume and Quantity Sold
- 11.1.3 Historical Market Size, 2018-2025
- 11.1.4 Base-Year Market Size, 2025
- 11.2 Market Forecast, 2025-2035
- 11.2.1 Revenue Forecast to 2035
- 11.2.2 Volume Forecast to 2035
- 11.2.3 CAGR and Year-on-Year Growth
- 11.2.4 Incremental Revenue Opportunity
- 11.3 Forecast Assumptions and Scenario Analysis
- 11.3.1 Base-Case Forecast
- 11.3.2 Optimistic and Conservative Scenarios
- 11.3.3 Technology, Pricing and Policy Sensitivities
- 11.4 Market Attractiveness and Growth Outlook
Chapter 12 North America Freight Transportation Market Segmentation and Outlook
- 12.1 Segmentation Summary and Market Shares, 2025
- 12.2 Largest and Fastest-Growing Segments
- 12.3 By Service Type - Market Size and Forecast, 2025-2035
- 12.3.1 Segment Definition and Scope
- 12.3.2 Historical Market Size, 2018-2025
- 12.3.3 Revenue Forecast, 2025-2035
- 12.3.4 Volume Forecast, 2025-2035
- 12.3.5 Base-Year Market Share, 2025
- 12.3.6 Segment CAGR and Growth Drivers
- 12.3.7 Subsegment Market Size and Forecast
- 12.3.7.1 General Freight
- 12.3.7.2 Specialized Freight
- 12.3.7.3 Temperature-Controlled Freight
- 12.3.7.4 Express and Expedited Freight
- 12.3.8 Subsegment Pricing and Adoption Trends
- 12.3.9 Leading Suppliers and Competition
- 12.3.10 Regional Demand and Opportunities
- 12.4 By Mode of Transport - Market Size and Forecast, 2025-2035
- 12.4.1 Segment Definition and Scope
- 12.4.2 Historical Market Size, 2018-2025
- 12.4.3 Revenue Forecast, 2025-2035
- 12.4.4 Volume Forecast, 2025-2035
- 12.4.5 Base-Year Market Share, 2025
- 12.4.6 Segment CAGR and Growth Drivers
- 12.4.7 Subsegment Market Size and Forecast
- 12.4.7.1 Road Freight
- 12.4.7.2 Rail Freight
- 12.4.7.3 Air Freight
- 12.4.7.4 Water and Pipeline Freight
- 12.4.8 Subsegment Pricing and Adoption Trends
- 12.4.9 Leading Suppliers and Competition
- 12.4.10 Regional Demand and Opportunities
- 12.5 By Shipment Flow - Market Size and Forecast, 2025-2035
- 12.5.1 Segment Definition and Scope
- 12.5.2 Historical Market Size, 2018-2025
- 12.5.3 Revenue Forecast, 2025-2035
- 12.5.4 Volume Forecast, 2025-2035
- 12.5.5 Base-Year Market Share, 2025
- 12.5.6 Segment CAGR and Growth Drivers
- 12.5.7 Subsegment Market Size and Forecast
- 12.5.7.1 Domestic Freight
- 12.5.7.2 Cross-Border Intra-North America
- 12.5.7.3 North America Imports
- 12.5.7.4 North America Exports
- 12.5.8 Subsegment Pricing and Adoption Trends
- 12.5.9 Leading Suppliers and Competition
- 12.5.10 Regional Demand and Opportunities
- 12.6 By End-Use Industry - Market Size and Forecast, 2025-2035
- 12.6.1 Segment Definition and Scope
- 12.6.2 Historical Market Size, 2018-2025
- 12.6.3 Revenue Forecast, 2025-2035
- 12.6.4 Volume Forecast, 2025-2035
- 12.6.5 Base-Year Market Share, 2025
- 12.6.6 Segment CAGR and Growth Drivers
- 12.6.7 Subsegment Market Size and Forecast
- 12.6.7.1 Manufacturing
- 12.6.7.2 Retail and E-Commerce
- 12.6.7.3 Automotive
- 12.6.7.4 Food, Agriculture and Chemicals
- 12.6.8 Subsegment Pricing and Adoption Trends
- 12.6.9 Leading Suppliers and Competition
- 12.6.10 Regional Demand and Opportunities
- 12.7 By Country - Market Size and Forecast, 2025-2035
- 12.7.1 Segment Definition and Scope
- 12.7.2 Historical Market Size, 2018-2025
- 12.7.3 Revenue Forecast, 2025-2035
- 12.7.4 Volume Forecast, 2025-2035
- 12.7.5 Base-Year Market Share, 2025
- 12.7.6 Segment CAGR and Growth Drivers
- 12.7.7 Subsegment Market Size and Forecast
- 12.7.7.1 United States
- 12.7.7.2 Canada
- 12.7.7.3 Mexico
- 12.7.8 Subsegment Pricing and Adoption Trends
- 12.7.9 Leading Suppliers and Competition
- 12.7.10 Regional Demand and Opportunities
- 12.8 Segment Growth Comparison
- 12.9 Segment Attractiveness and Priority Matrix
Chapter 13 North America Freight Transportation End-Use and Application Market Outlook
- 13.1 End-Use Industry and Customer Demand Structure
- 13.2 Leading Applications and Customer Groups
- 13.3 End-Use Market Size, Share and Forecast
- 13.4 Major End-Use Industry Deep Dives
- 13.4.1 Customer Requirements and Use Cases
- 13.4.2 Demand and Replacement Cycles
- 13.4.3 Technical and Regulatory Considerations
- 13.4.4 Purchasing and Procurement Models
- 13.4.5 Leading Vendors and Distribution Channels
- 13.4.6 Forecast and Commercial Opportunities
- 13.5 Emerging Applications and Cross-Segment Demand
- 13.6 End-Use Industry Investment Priorities
Chapter 14 North America Freight Transportation Geographic Market Outlook, 2025-2035
- 14.1 Regional Market Size and Country-Level Shares, 2025
- 14.2 Country Market Size Comparison, 2025
- 14.3 Country Market Forecasts, 2025-2035
- 14.4 Subregional Industrial and Demand Clusters
- 14.5 Intra-Regional Pricing and Cost Differences
- 14.6 Cross-Border Trade and Supply Networks
- 14.7 Regional Supply and Demand Balances
- 14.8 Country Opportunity Comparison and Prioritization
Note: Every listed country is covered on the structure shown under the first country.
Chapter 15 North America Freight Transportation Technology, Innovation and Sustainability Outlook
- 15.1 Technology Landscape and Maturity
- 15.2 Product, Process and Service Innovation
- 15.3 AI, Automation and Digital Tools in the Industry
- 15.4 Technology Adoption and Performance Benchmarking
- 15.5 Innovation Pipeline and R&D Investment
- 15.6 Patent and Intellectual Property Trends
- 15.7 Energy Efficiency and Resource Management
- 15.8 Sustainability, Recycling and Circularity
- 15.9 Technology Roadmap, 2025-2035
- 15.10 Risks of Obsolescence and Technology Substitution
Chapter 16 North America Freight Transportation Market Key Strategic Imperatives
- 16.1 Growth and Market Entry Priorities
- 16.2 High-Return Products and Segments
- 16.3 Pricing, Profitability and Cost Optimization
- 16.4 Technology Investment and Product Differentiation
- 16.5 Supply Chain Localization and Resilience
- 16.6 Distribution and Customer Acquisition
- 16.7 Partnership, Acquisition and Capacity Strategy
- 16.8 Regional Expansion Priorities
- 16.9 Short-, Medium- and Long-Term Actions
Chapter 17 Competition Outlook
- 17.1 Industry Competition Characteristics
- 17.2 Market Structure and Concentration
- 17.3 Market Share and Competitive Positioning, 2025
- 17.4 Company-Wise Revenue and Product Benchmarking
- 17.5 Production and Service Capacity Benchmarking
- 17.6 Technology, Pricing and Differentiation
- 17.7 Regional Footprint and Distribution Strength
- 17.8 Mergers, Acquisitions and Strategic Alliances
- 17.9 New Entrants and Competitive Threats
- 17.10 Porter's Five Forces and Industry Attractiveness
- 17.11 Competitive Outlook, 2025-2035
Chapter 18 Company Profiles
- 18.1 Company Coverage and Selection Criteria
- 18.2 UPS
- 18.2.1 Business Description
- 18.2.2 Company Ownership and Geographic Presence
- 18.2.3 Product and Service Portfolio
- 18.2.4 Manufacturing and Operating Footprint
- 18.2.5 Production Capacity and Expansion Plans
- 18.2.6 Financial Performance and Investment
- 18.2.7 Market Share and Competitive Position
- 18.2.8 Technology and Innovation Capabilities
- 18.2.9 Strategic Alliances or Partnerships
- 18.2.10 Recent Developments
- 18.2.11 Growth Strategy and Outlook
- 18.3 FedEx Corporation
- 18.4 Union Pacific
- 18.5 BNSF Railway
- 18.6 Canadian National Railway
- 18.7 Canadian Pacific Kansas City
- 18.8 J.B. Hunt Transport Services
- 18.9 Knight-Swift Transportation Holdings
- 18.10 Old Dominion Freight Line
- 18.11 XPO
- 18.12 Other Relevant Market Participants
Note: Every listed company is profiled on the structure shown under the first company. The company list is preliminary and may change based on research findings, market developments, data availability and client requirements.
Chapter 19 Disclaimer
- 19.1 Research and Forecast Disclaimer
- 19.2 Data Source and Estimation Limitations
Note: The depth of individual sections depends on data availability for this market. Volume, capacity, trade and other unit-based metrics are included where applicable.