A huge vehicle fleet and export-scale plants shape demand
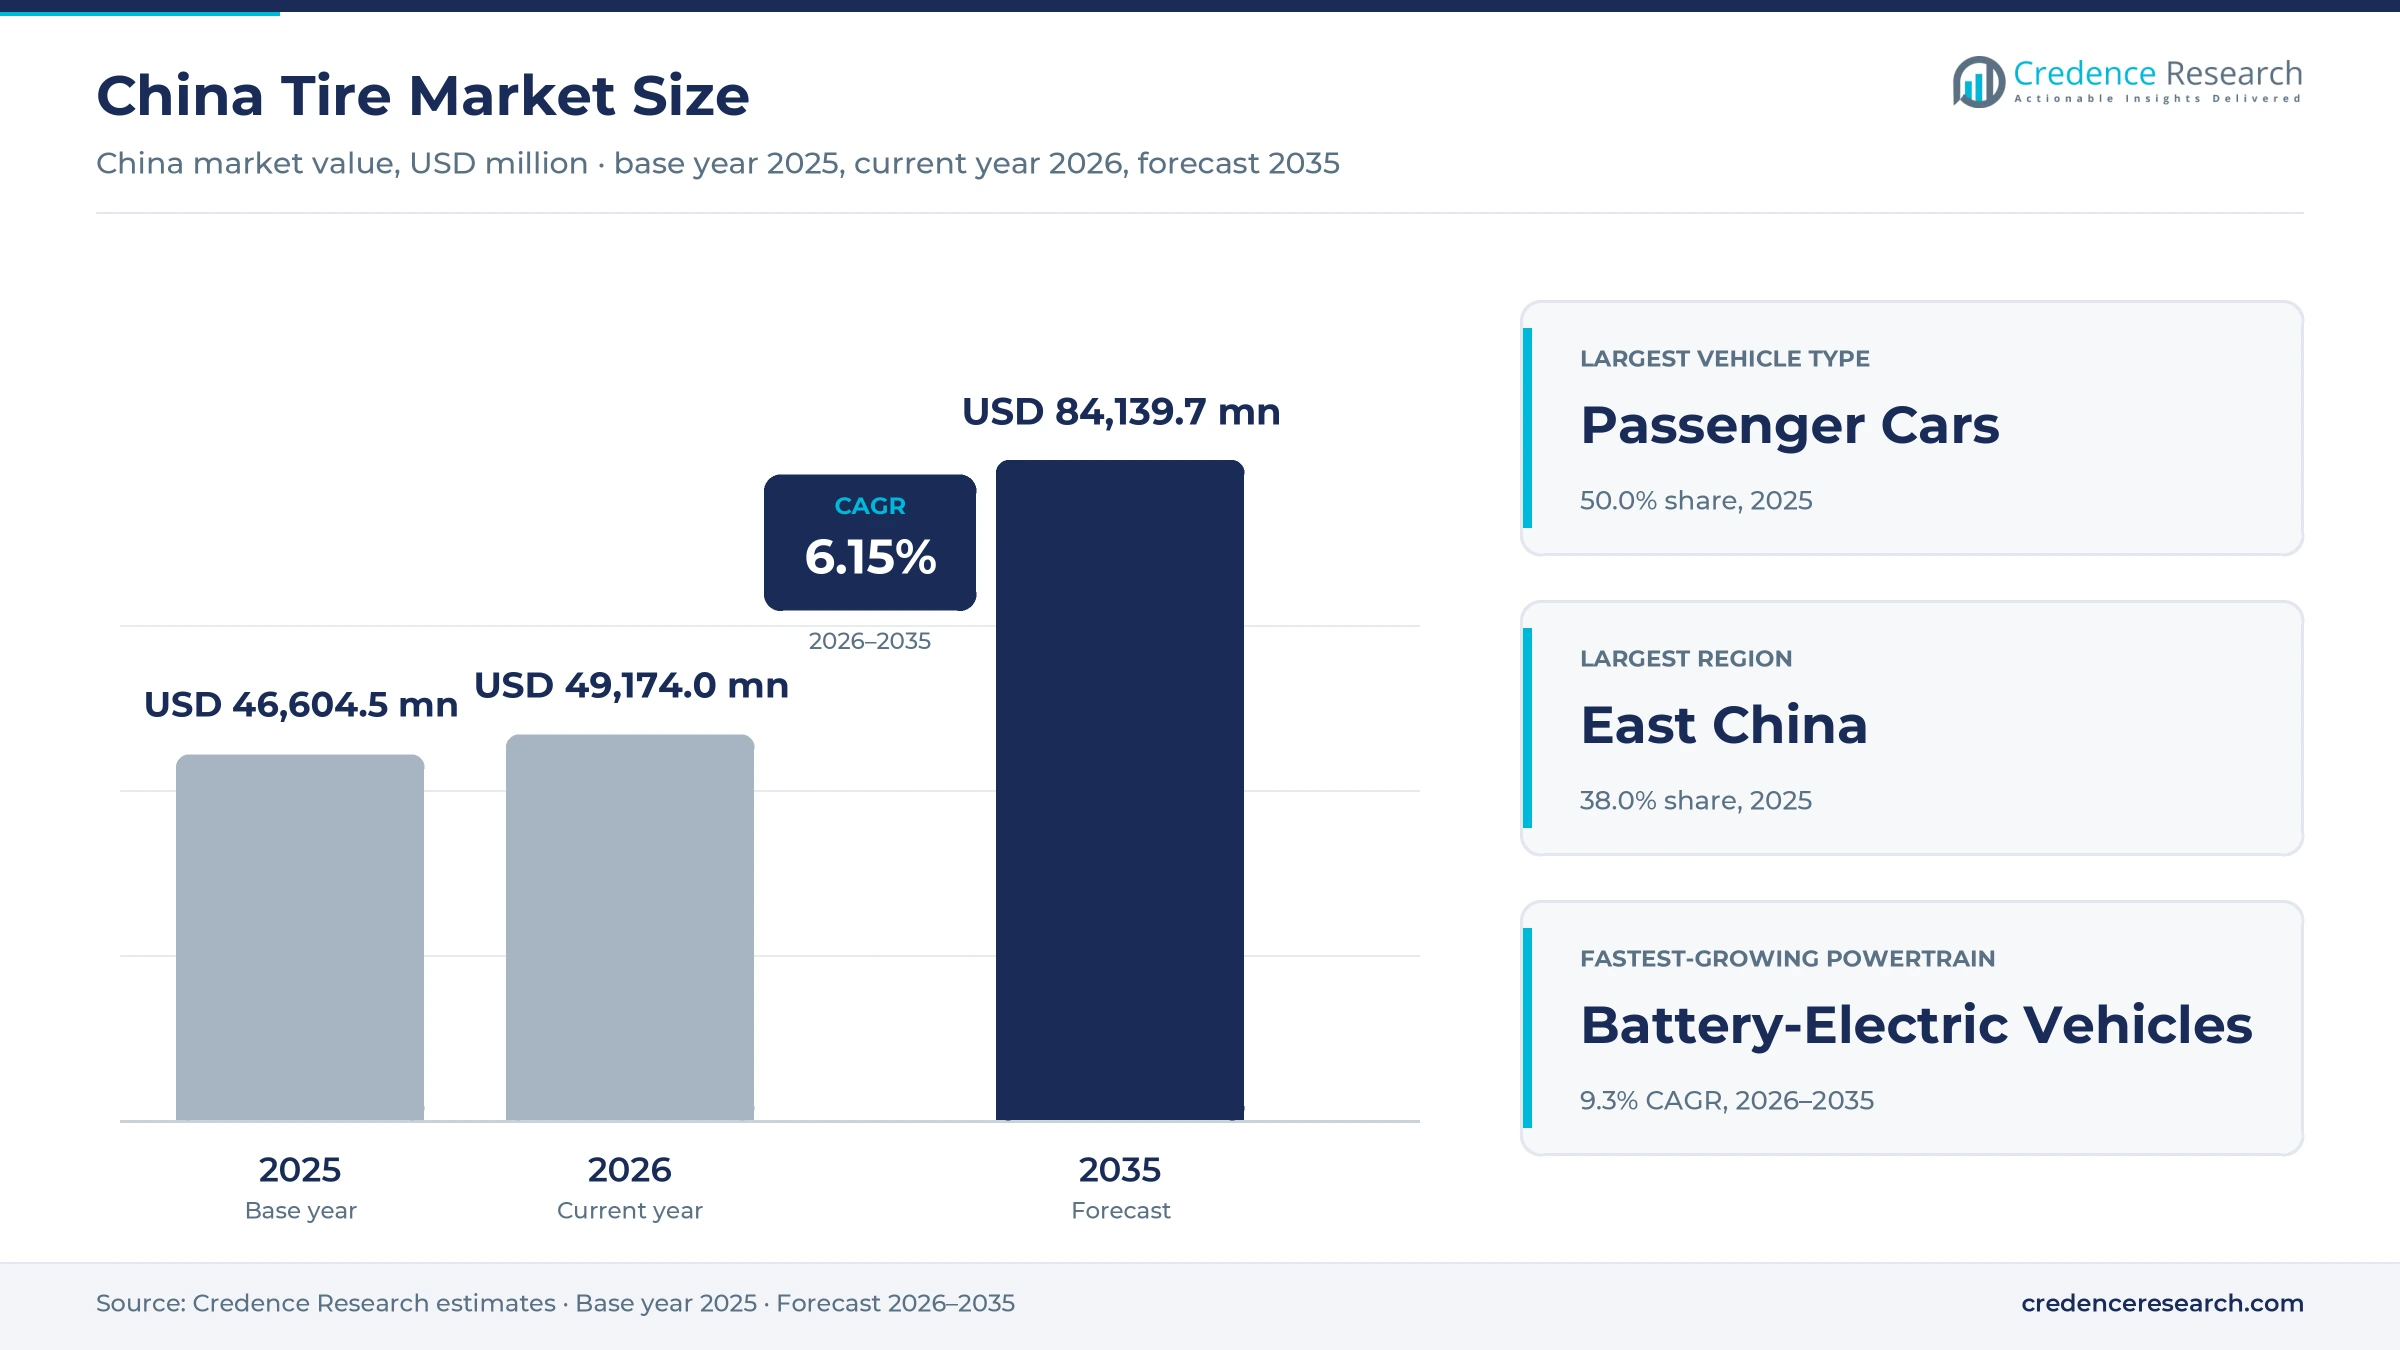
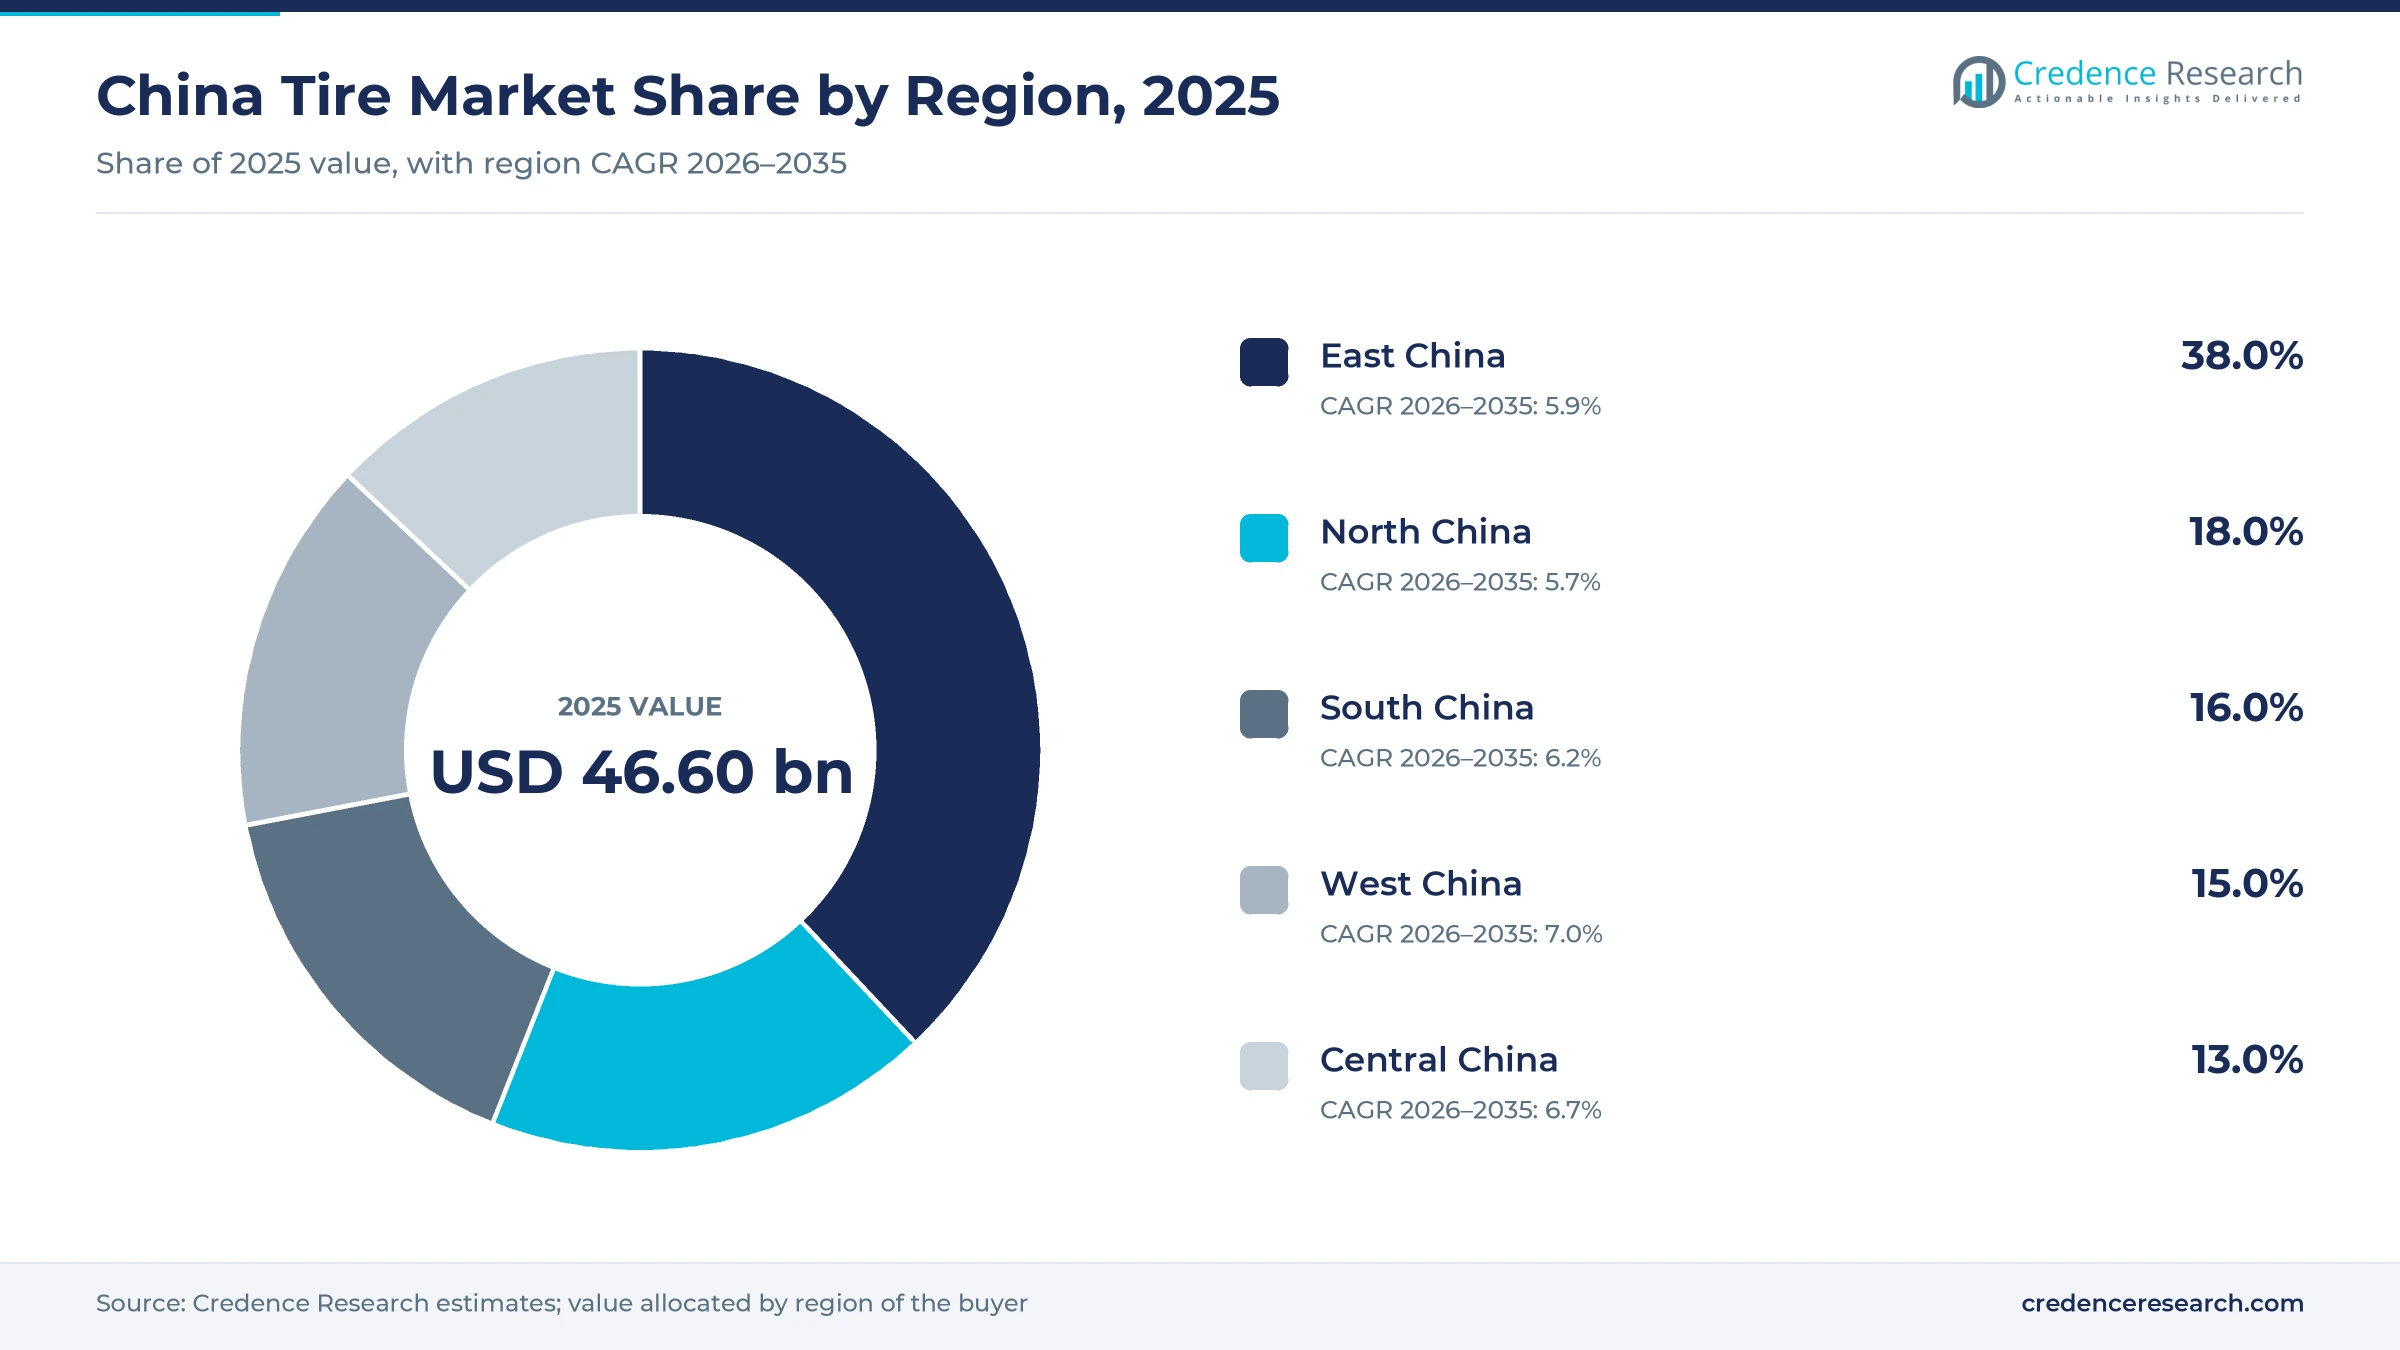
The China tire market was valued at USD 46.60 billion in 2025 and is projected to increase from USD 49.17 billion in 2026 to USD 84.14 billion by 2035, registering a CAGR of 6.15% during 2026–2035. Demand rests on replacement buying across one of the largest vehicle fleets in the world, on original-equipment fitments for record vehicle output, and on truck and bus tires worn down by heavy road freight. East China held the largest regional share, 38.0% in 2025, because Shandong, Jiangsu and Zhejiang combine dense car ownership with the main tire manufacturing clusters. West China is the fastest-growing region at 7.0% a year as Sichuan, Chongqing and Shaanxi add vehicles and logistics routes. Electric vehicles are changing what buyers need, since heavier battery cars require higher load ratings, quieter treads and larger rims. Raw material inflation in 2026 is the main near-term pressure on domestic tire makers.
Which tires and buyers make up spending in China?
The market counts tires sold for use in China across passenger cars, light and heavy commercial vehicles, two-wheelers and off-the-road machines, whether fitted at the vehicle factory or bought as replacements. Carmakers buy directly from tire plants under supply contracts, while drivers and fleets buy through dealers, service chains, brand stores and online platforms.
Tires made in China and shipped abroad, retreading services, inner tubes and wheels sold on their own sit outside the count. The value chain runs from imported natural rubber, synthetic rubber, carbon black and steel cord through plants concentrated in Shandong, Zhejiang and Jiangsu, then to carmakers, distributors, workshops and fleet operators.
China Tire Market Insights
- Spending rises from USD 46.60 billion in 2025 to USD 84.14 billion by 2035, a 6.15% CAGR, as a fleet of 366 million automobiles keeps replacement demand steady.
- East China held 38.0% of 2025 value, supported by the Shandong, Jiangsu and Zhejiang economies and the country’s densest cluster of tire plants and distributors.
- Passenger Cars accounted for 50.0% of 2025 spending, while Radial Tires made up 88.0% of value across all vehicle classes.
- New energy vehicles reached 47.9% of new vehicle sales in 2025, which pushes tire makers toward high-load, low-noise designs for battery-electric models.
- More than 70 tire makers issued price increase notices from mid-April 2026, mostly 2% to 5%, as synthetic rubber and carbon black costs climbed.
Passenger cars and radials lead, BEV fitments grow fastest
Why do passenger cars dominate Chinese tire spending?
Based on vehicle type, the market is categorized into passenger cars, light commercial vehicles, medium and heavy commercial vehicles, two-wheelers and off-the-road vehicles. Passenger Cars led with 50.0% of 2025 value because the national fleet held 197.73 million civilian cars at the end of 2025, according to the National Bureau of Statistics, each needing a new set every few years. Off-the-road vehicles grow fastest at 6.8% a year as domestic makers localize giant mining tires, with Prinx Chengshan announcing its first 30.00R51 giant tire from Rongcheng on Jan. 19, 2026. Imported giant tires are steadily losing share to this new local supply.
How far has radial construction replaced bias-ply tires?
Based on tire construction, the market is categorized into radial tires, bias-ply tires and non-pneumatic and specialty tires. Radial Tires led with 88.0% of 2025 value because semi-steel and all-steel radials made up 833 million of the 1.207 billion outer tires produced in 2025, according to National Bureau of Statistics data compiled by China Baogao. Radial tires also grow fastest at 6.3% a year as all-steel truck radial output rose 7.19% in 2025 while total output rose only 1.72%. Bias-ply demand is shrinking to farm, industrial and two-wheeler niches.
Where do Chinese drivers and fleets buy replacement tires?
Based on sales channel, the market is categorized into OEM direct supply, dealer and distributor networks, brand-owned retail, e-commerce platforms and fleet contract sales. Dealer & Distributor Networks led with 42.0% of 2025 value because independent operators still run most workshops, and even Tuhu runs only 175 of its workshops itself, with the rest managed by more than 3,500 franchisees, according to its 2025 annual results. E-commerce platforms grow fastest at 8.1% a year as online retail sales of physical goods reached 13.09 trillion yuan in 2025, 26.1% of consumer goods retail sales, according to the National Bureau of Statistics, part of a wider shift toward the online automotive aftermarket.
How quickly are electric powertrains changing fitment demand?
Based on powertrain, the market is categorized into internal-combustion vehicles, battery-electric vehicles, plug-in hybrid vehicles and hybrid and fuel-cell vehicles. Internal-Combustion Vehicles led with 72.0% of 2025 value because new energy vehicles were only 12.01% of the 366 million automobiles on the road at the end of 2025, according to the Ministry of Public Security. Battery-electric vehicles grow fastest at 9.3% a year as the battery-electric fleet reached 30.22 million, or 68.74% of all new energy vehicles in use. Their heavier curb weights mean more frequent replacement and higher-load tires.
| Segment Group | Leading Sub-segment | Share, 2025 | Fastest-growing Sub-segment | CAGR, 2026–2035 |
|---|---|---|---|---|
| By Vehicle Type | Passenger Cars | 50.0% | Off-the-Road Vehicles | 6.8% |
| By Tire Construction | Radial Tires | 88.0% | Radial Tires | 6.3% |
| By Sales Channel | Dealer & Distributor Networks | 42.0% | E-Commerce Platforms | 8.1% |
| By Powertrain | Internal-Combustion Vehicles | 72.0% | Battery-Electric Vehicles | 9.3% |
Raw material pass-through sets the price of a tire
Tire pricing works through list prices that makers revise with notices to dealers, while carmakers negotiate annual contracts with tighter margins. Raw materials make up the largest share of tire cost, so price notices follow rubber and carbon black with a lag of one or two months. Specialized electric vehicle tires sell at a premium to standard models, which helps protect margins as the fleet shifts. Export prices are lower than domestic replacement prices, so any volume pushed back home by trade duties weighs on domestic price levels and on dealer margins.
| Price point or cost item | Typical price or fee | Basis |
|---|---|---|
| Average export value, new pneumatic tires, 2024 | About 17.6 yuan per kg | Credence Research estimate from General Administration of Customs data via European Rubber Journal |
| Chinese car and light truck tires shipped to the EU, 2024 | About EUR 27 per unit | Credence Research estimate from Eunews, July 2026 (93 million units, over EUR 2.5 billion) |
| Dedicated electric vehicle tire versus standard tire | 1.5 to 2 times the price | CnAuto industry report, 2026 |
| Industry list price increases, May 2026 | 2% to 5%, up to 10% for some makers | Rubber Plastic Parts, April 2026 |
| Butadiene rubber input cost, January to April 2026 | 11,960 to 18,140 yuan per ton | Rubber Plastic Parts, April 2026 |
Request a Free Sample
Fill in your details and we'll send you a free sample report.
- Sample data tables & charts
- Research methodology
Fleet size, electrification and freight sustain tire volumes
Expanding vehicle parc strengthens replacement demand
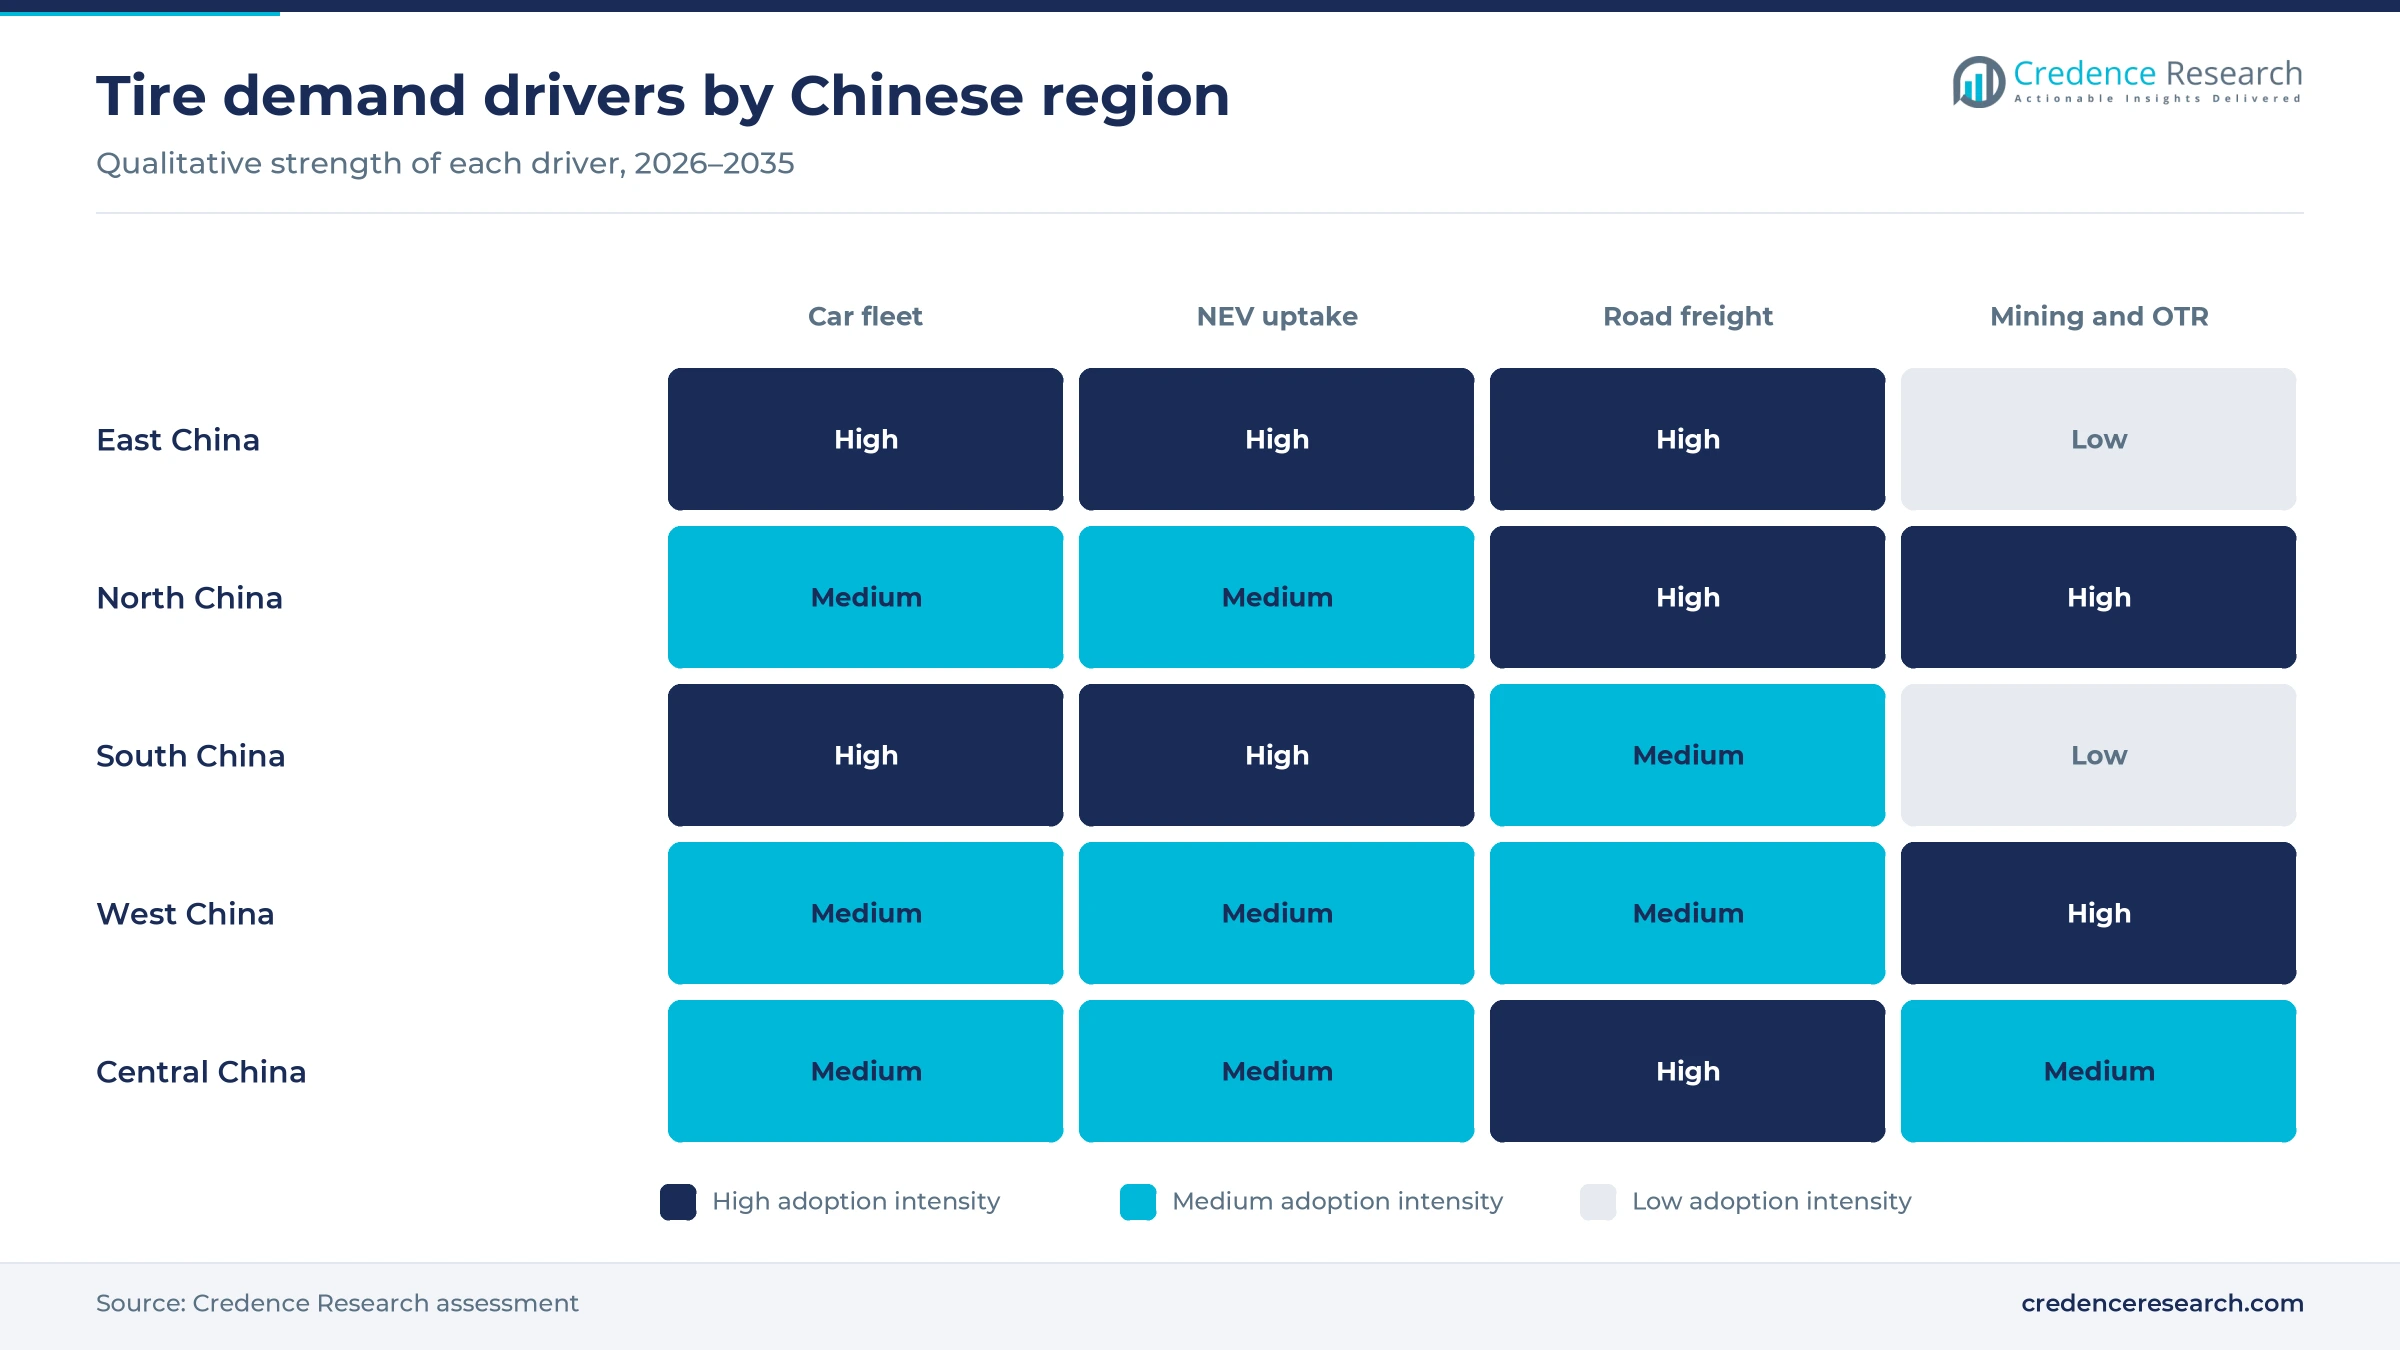
A large and still growing fleet turns into a predictable stream of replacement sets, which makes up most domestic tire spending. China had 469 million motor vehicles and 366 million automobiles on its roads at the end of 2025, and 26.19 million automobiles were newly registered during the year, according to Ministry of Public Security data reported by Gasgoo. Older cars are being replaced quickly, since the Ministry of Commerce renewed the scrappage and trade-in subsidy for 2026 with payments capped at 20,000 yuan per vehicle. Each new car arrives on factory tires but enters the replacement pool within three to five years, so the passenger car segment carries most replacement volume through 2035.
Electrification expands specialized tire requirements
Electric cars are changing tire specifications faster than any other force, because battery weight, instant torque and quiet cabins demand different compounds and constructions. China sold 16.49 million new energy vehicles in 2025, up 28.2%, and they reached 47.9% of new vehicle sales, according to the China Association of Automobile Manufacturers. Registrations confirm the shift, with 12.93 million of the 26.19 million automobiles registered in 2025 being new energy models. The broader electric vehicle build-out means tire makers must certify products with each carmaker, so suppliers with test capacity win platform awards. Battery-electric vehicles, the fastest-growing powertrain at 9.3% a year, lift average tire value per vehicle.
Road and logistics scale sustains commercial tire consumption
Road freight remains the backbone of Chinese logistics, so truck and bus tires wear out on a steady schedule regardless of the passenger car cycle. Highway freight volume reached 43.29 billion tons in 2025, up 3.4%, according to the National Bureau of Statistics. Express delivery added 199.0 billion parcels, much of it carried by road on regional routes. Fleet renewal is adding original-equipment demand, as sales of heavy-duty trucks reached about 1.137 million units in 2025, a four-year high, according to SteelOrbis. Each heavy truck runs on 10 or more tires, so commercial fleets spend far more per vehicle than car owners do.
Organized service chains widen replacement access
Chain workshops are making replacement buying easier to plan and price, which pulls demand toward branded tires and away from roadside repair shops. Tuhu reported 8,008 workshops at the end of 2025, reaching into 1,953 county-level divisions. The platform served 28.4 million transacting users in 2025, and its annual repeat purchase rate of 65.0% shows how chain service ties drivers to one outlet. Chains bundle fitting with alignment and inspection, which makes branded tires easier to sell than at roadside repair shops. Wider chain coverage in smaller cities gives tire brands a national route to buyers, while bargaining power shifts toward the platforms that control traffic.
Larger rims and giant mining tires reshape the product mix
Shift toward larger rims and premium fitments
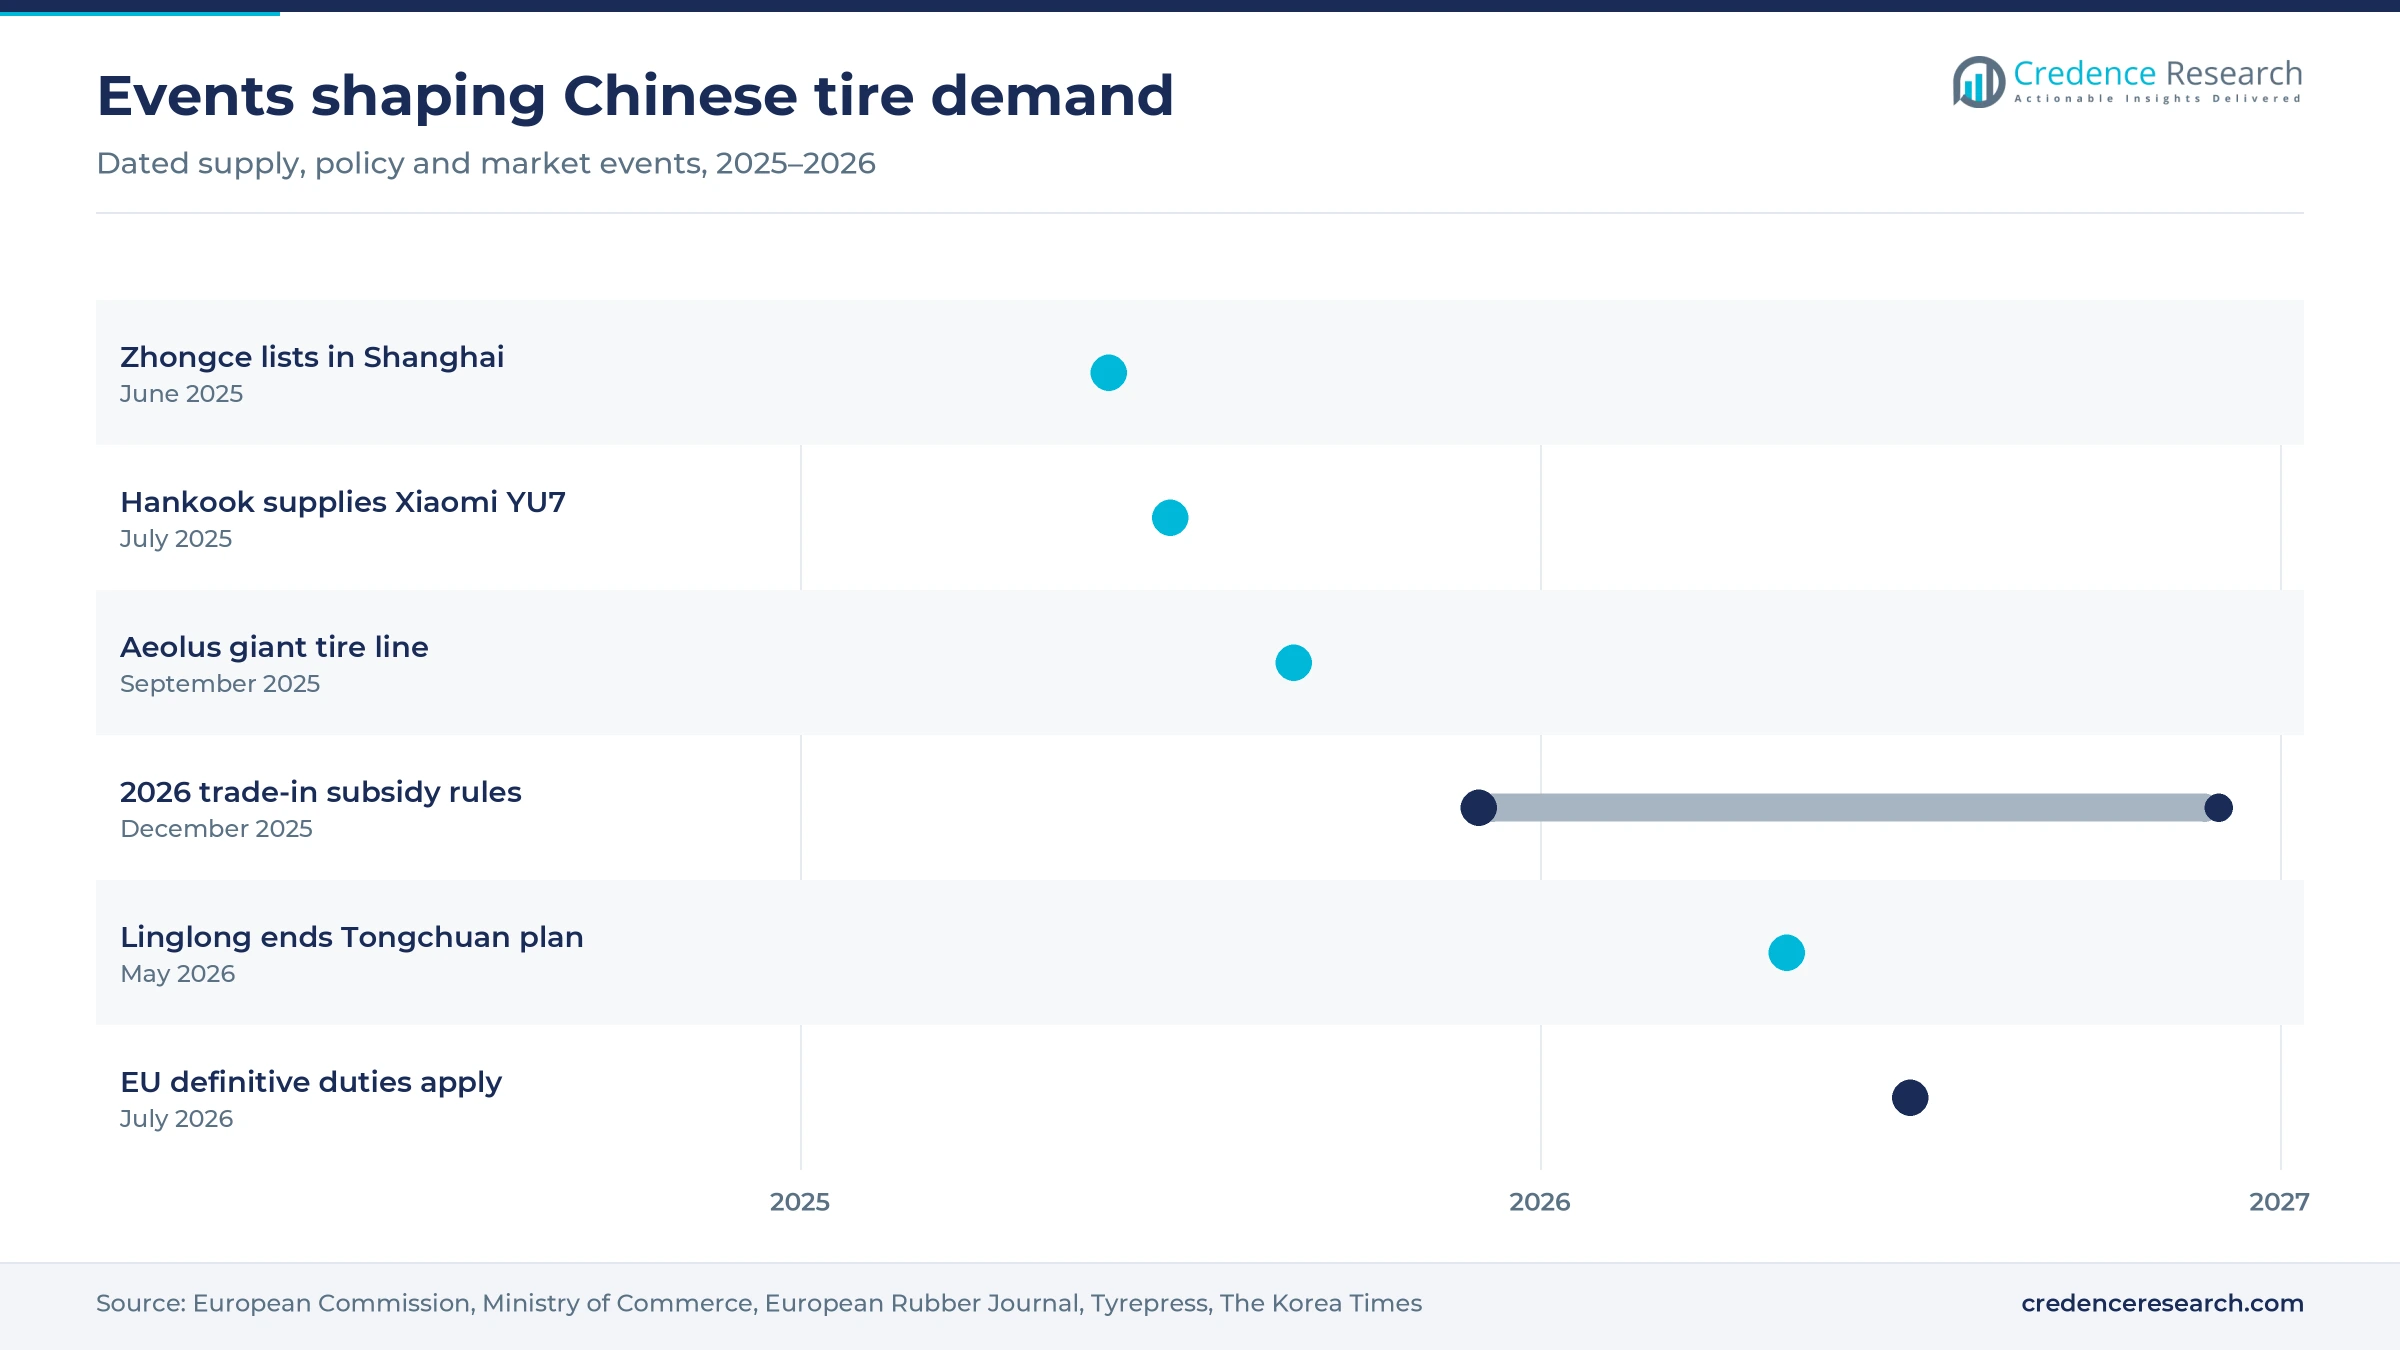
Rim sizes are rising across new Chinese cars, and that shift raises the value of every replacement set. Tuhu said tires of 18 inches and above came close to 30% of its tire sales in 2025, up more than five percentage points in one year. Carmakers are fitting larger sizes to electric crossovers, and in July 2025 Hankook announced that it supplies its iON evo SUV tire as original equipment for the Xiaomi YU7, The Korea Times reported. Online catalogs are widening to match, with Tuhu’s online transacting tire SKUs up 22%. Suppliers without a strong range above 18 inches will compete mostly on price in the shrinking small-rim tiers.
Rise of domestic giant mining tire production
Chinese makers are moving into giant off-the-road tires, a category long dominated by imports, as mines buy larger haul trucks. Aeolus rolled its first 45/65R45 giant loader tire off a new line in Jiaozuo, Henan, in September 2025, and the site is set to make 260,930 all-steel OTR tires a year, European Rubber Journal reported. Linglong unveiled a 59/80R63 tire for ultra-class haul trucks at its Changchun plant on Oct. 20, 2025, Tyre News reported. Triangle added 46/90R57 and 27.00R49 sizes for coal and copper mines in the second half of 2025. Local supply of giant tires for electric-drive mining trucks should cut lead times for domestic mines.
Opportunity in the battery-electric replacement wave
The first large cohorts of battery-electric cars are now reaching their first tire change, which opens a replacement pool that barely existed five years ago. China had 43.97 million new energy vehicles in use at the end of 2025, according to the Ministry of Public Security, and most were bought within the last four years. Tuhu counted 4.27 million new energy vehicle transacting users in 2025, up about 60%, more than 15% of its users. Heavier battery cars wear tires faster, so replacement demand per vehicle should exceed that of comparable gasoline cars. Brands that already supply electric original equipment can convert those fitments into aftermarket sales.
Opportunity in certified sustainable materials and recycling
Carmakers and exporters increasingly ask tire suppliers to document recycled and bio-based materials, which gives certified plants an edge in supply contracts. Hankook announced in May 2026 that its Jiaxing plant in Zhejiang earned ISCC PLUS certification for mass-balance tracking of sustainable materials, Autosphere reported. Recycling routes are forming in retail as well, since Tuhu’s self-operated stores collected about 300,000 used tires for recycling in 2025. Aeolus is also removing capacity for 1 million truck tires at Jiaozuo while adding just under 111,000 OTR tires a year. Plants that pair traceable materials with take-back programs can win preferred-supplier status as carmakers tighten sourcing rules.
Rubber costs, EU duties and idle plants squeeze margins
Raw material inflation squeezes margins
Input costs rose sharply in 2026, because butadiene rubber climbed from 11,960 yuan per ton at the start of the year to 18,140 yuan in early April, and carbon black rose over 13% in one month, Rubber Plastic Parts reported. Linglong swung to a third-quarter loss as raw material costs outweighed higher sales, Tyrepress reported on Nov. 2, 2026. Makers selling mostly to carmakers under fixed contracts carry the greatest exposure.
EU duties redirect export capacity home
Export curbs are pushing surplus volume back into the domestic market. The European Commission imposed definitive anti-dumping duties on Chinese car and light truck tires, effective July 8, 2026, at rates of 4.3% to 45.3%, against imports of about 93 million units in 2024, Eunews reported. Semi-steel plants were already running below capacity in the second half of 2025. Rerouted volume intensifies price competition in the domestic replacement market.
Stalled projects expose overcapacity risk
Capacity plans are now being cut as expected returns on new tire plants weaken. Linglong announced in May 2026 that it terminated a planned plant in Tongchuan, Shaanxi, a project sized for 15.2 million radial tires a year, after spending about 380 million yuan, European Rubber Journal reported. Its Anhui plant was moved because the original Hefei site lacked energy-consumption quotas. Investors and suppliers of tire machinery face fewer domestic orders as a result.
Two-wheeler demand weakens under new rules
The two-wheeler tire segment faces falling domestic volumes after rule changes and weak spending. Domestic motorcycle sales fell 3.45% to 8.602 million in 2025, China Motor World reported, and electric two-wheeler sales dropped 37.9% in February 2026 after a revised safety standard took effect on Sept. 1, 2025, Caixin reported. Small bias-ply makers depend most on this segment and feel the drop first. Export markets offer the main relief, since complete motorcycle exports rose 21.33% in 2025.
East China leads value while West China grows fastest
Regional shares of tire spending follow the Credence Research regional model, built from vehicle ownership, provincial output, freight flows and the location of tire plants and distributors. The five regions group provinces by how tires reach buyers, with the northeast included in North China. East China and North China together held 56.0% of 2025 demand.
| Region | Value, 2025 (USD billion) | Share, 2025 | CAGR, 2026–2035 |
|---|---|---|---|
| East China | 17.71 | 38.0% | 5.9% |
| North China | 8.39 | 18.0% | 5.7% |
| South China | 7.46 | 16.0% | 6.2% |
| West China | 6.99 | 15.0% | 7.0% |
| Central China | 6.06 | 13.0% | 6.7% |
East China leads on car density and tire clusters
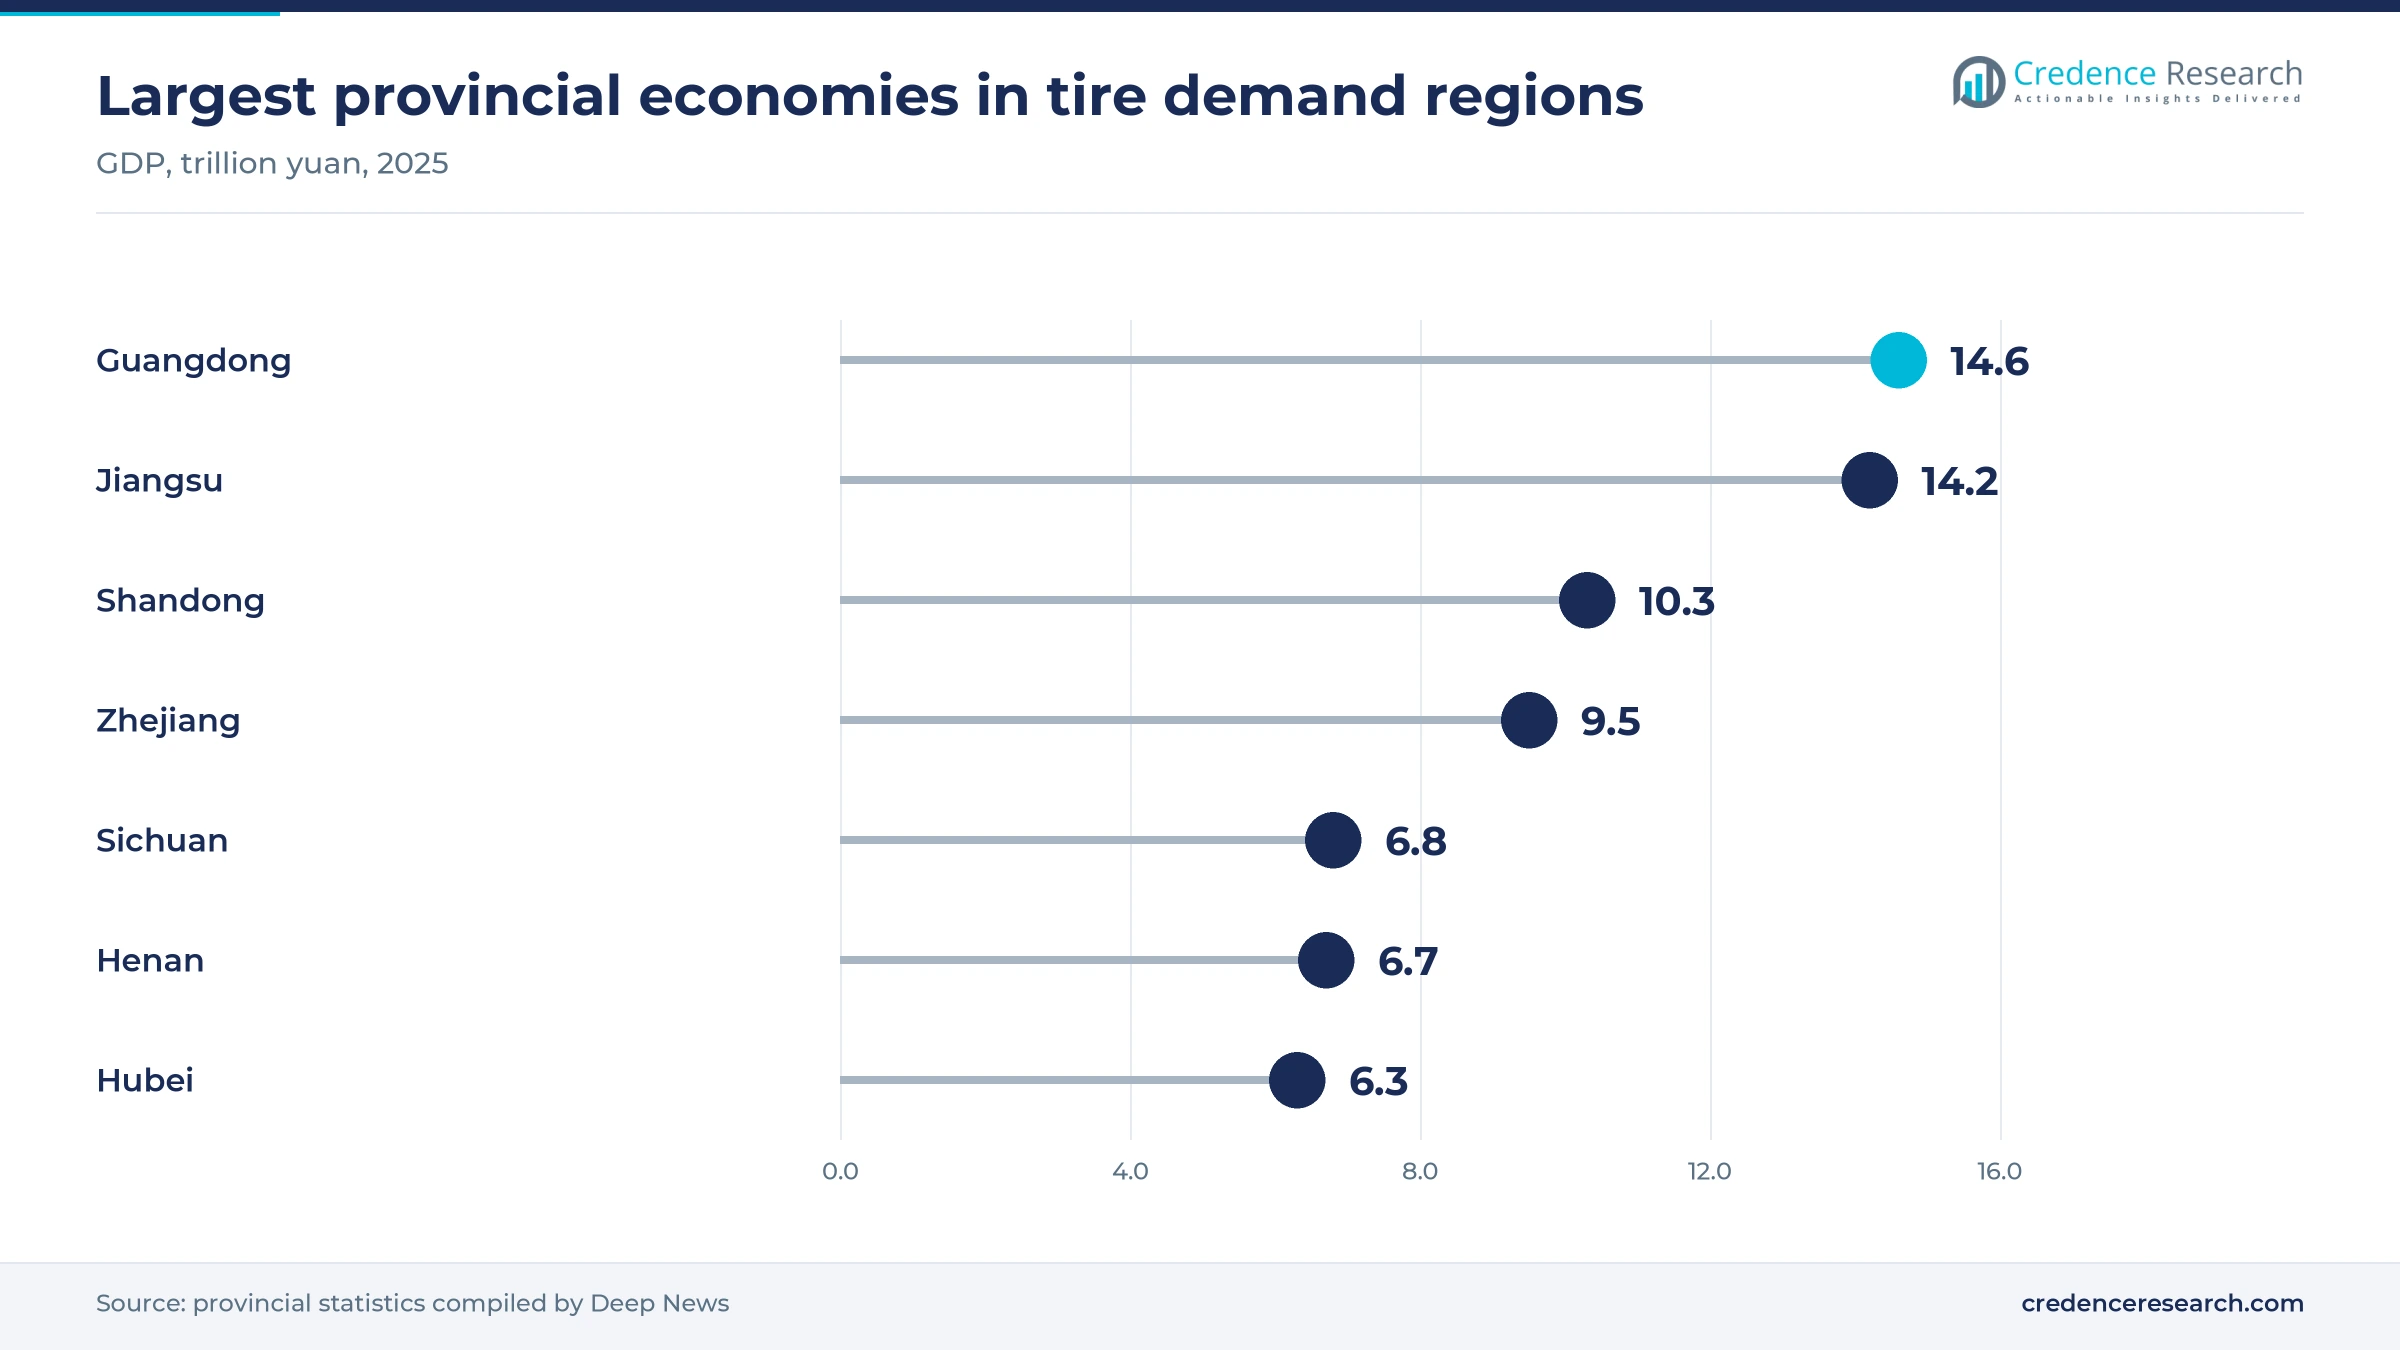
East China held 38.0% of 2025 value and grows at 5.9% a year. Jiangsu, Shandong and Zhejiang together produced about 34.0 trillion yuan of GDP in 2025, about a quarter of China’s 140.2 trillion yuan, according to provincial data compiled by Deep News and the National Bureau of Statistics. Shandong hosts Linglong, Sentury, Triangle and Prinx Chengshan, and Sentury alone runs 15 million units of capacity in Jimo, Qingdao. Short delivery routes let distributors in the region hold the widest stock ranges in the country.
North China pairs heavy freight with mining fleets
North China held 18.0% of 2025 value and grows at 5.7% a year. The region carries coal, steel and port traffic through Hebei, Shanxi, Inner Mongolia and Tianjin, which wears down truck tires quickly. Zhongce is investing 850 million yuan in an engineering tire project in Tianjin, European Rubber Journal reported in 2025, while Linglong builds giant tires in Changchun. Mining and heavy freight keep commercial tires a larger share of spending here than in the south.
South China rides electric car output and logistics
South China held 16.0% of 2025 value and grows at 6.2% a year. Guangdong is a center of electric car assembly and e-commerce fulfillment, and Tuhu’s Guangzhou distribution center shipped 42,000 tires on its peak Double Eleven day in 2025, up over 30%. Online replacement buying is therefore more advanced here than in other regions. The Guangzhou peak-day gain outpaced the growth of Tuhu’s national user base, which rose 17.7% to 28.4 million transacting users in 2025, according to its annual results.
Central China gains on giant tire lines and freight hubs
Central China held 13.0% of 2025 value and grows at 6.7% a year. Henan and Hubei together produced about 12.9 trillion yuan of GDP in 2025, according to provincial data compiled by Deep News. Aeolus is turning its Jiaozuo site in Henan into a giant tire base, and the region’s rail and road hubs move freight between the coast and the west. That mix supports truck, OTR and passenger car demand in roughly equal measure.
West China grows fastest as fleets catch up
West China is the fastest-growing region at 7.0% a year and held 15.0% of 2025 value. Sichuan produced about 6.8 trillion yuan of GDP in 2025, the fifth-largest provincial economy, according to the same provincial data. Vehicle ownership per person is still lower than on the coast, so new registrations add proportionally more to the regional fleet. Guizhou Tyre, based in Guiyang, makes truck, OTR and agricultural tires close to southwestern mines and construction projects.
Listings, giant tires and trade rulings mark 2025-2026
| Development | Status and market relevance |
|---|---|
| In June 2025, Zhongce Rubber listed on the Shanghai Stock Exchange, issuing 87.45 million shares at 46.50 yuan each. | Listed, with funds for research and high-end capacity |
| In July 2025, Hankook began supplying its iON evo SUV tire as original equipment for the Xiaomi YU7 electric SUV. | In supply on a high-volume electric crossover |
| In September 2025, Aeolus rolled its first 45/65R45 giant loader tire off a new line in Jiaozuo, Henan. | Production ramping toward giant OTR capacity |
| In January 2026, Prinx Chengshan produced its first 30.00R51 giant OTR tire at its Rongcheng plant in Shandong. | New plant rated for 10,000 giant tires a year |
| In May 2026, Linglong terminated its planned Tongchuan plant in Shaanxi, sized for 15.2 million radial tires a year. | Cancelled, with recovery of costs sought |
Low-noise, high-load and giant tire builds lead upgrades
- High-load electric vehicle tires carry heavier battery cars with stiffer sidewalls and lower rolling resistance, which carmakers now specify for heavier electric crossovers.
- Giant radial OTR tires serve ultra-class haul trucks, with Linglong producing a 59/80R63 size of over four meters in diameter at Changchun.
- All-steel truck radials replace bias truck tires in long-haul fleets, and their output rose 7.19% in 2025 to 149 million units.
- Mass-balance material tracking documents recycled and bio-based inputs, which Hankook’s Jiaxing plant now applies under ISCC PLUS rules.
- Digital tire catalogs and fitment tools match sizes to vehicles online, and Tuhu reported a 10% rise in its tire shopping guide conversion rate in December 2025.
Need a Custom Version of This Report?
Tailor the scope, geography, or segments to your exact requirements.
- Custom geography or segment scope
- Direct access to our analyst team
Domestic groups widen ties to OEMs as foreign brands defend
Competition in the China tire market is split between large domestic groups, a few Asian brands with Chinese plants and Western brands that still lead in premium original equipment. Zhongce raised funds to expand high-end lines when it listed in Shanghai in June 2025, and Zhongce, Sailun, Linglong and Triangle supply carmakers and replacement dealers nationwide, while Prinx Chengshan, Sentury and Guizhou Tyre focus on truck, OTR or export-oriented passenger lines. Aeolus and Guizhou Tyre lean on truck and mining tires for domestic fleets and mines. Giti and Hankook run Chinese plants that serve both local carmakers and replacement buyers, and Hankook’s electric crossover fitment noted above shows how foreign brands defend electric fitments. Domestic makers are raising research spending and seeking carmaker approvals for electric models, because original-equipment fitments lead to later replacement sales. Retail platforms such as Tuhu are also building private labels, which increases pressure on mid-tier brands.
A crowded field split between export-scale groups and brands
Supply in the China tire market is fragmented, with dozens of domestic makers and a handful of foreign brands that still hold the premium car segment. The largest domestic groups, Zhongce, Sailun, Linglong and Triangle, compete on scale and original-equipment approvals, while smaller Shandong plants sell mostly economy replacement and truck tires. Entry is easy at the economy end but hard in original equipment, where carmaker testing takes years. Margins sit with makers that control premium brands and long-term carmaker contracts, while commodity producers absorb raw material swings and export price pressure.
Companies profiled and their roles in this market
| Company | Type | Role in the market |
|---|---|---|
| Zhongce Rubber Group Co., Ltd. | Domestic tire group | Passenger, truck and engineering tires; listed in Shanghai in June 2025 |
| Sailun Group Co., Ltd. | Domestic tire group | Passenger and commercial vehicle radials with large domestic and overseas plants |
| Shandong Linglong Tyre Co., Ltd. | Domestic tire group | Original-equipment supplier; giant OTR tires made at Changchun |
| Triangle Tyre Co., Ltd. | Domestic tire maker | Truck, bus and OTR tires including giant mining sizes |
| Prinx Chengshan Holdings Limited | Domestic tire maker | Truck and passenger radials; giant OTR plant in Rongcheng |
| Aeolus Tyre Co., Ltd. | Domestic tire maker | Truck and OTR tires; giant tire base in Jiaozuo, Henan |
| Guizhou Tyre Co., Ltd. | Domestic tire maker | Truck, OTR and agricultural tires for southwest mines and fleets |
| Qingdao Sentury Tire Co., Ltd. | Domestic tire maker | Passenger radials with 15 million units of capacity in Qingdao |
| Hankook Tire & Technology Co., Ltd. | Foreign brand with local plants | Electric vehicle original equipment and replacement tires from Jiaxing and other plants |
Cost pass-through and NEV fitments will decide margins
Credence Research's view is that the next stage of the China tire market will be decided by cost pass-through and by who wins electric vehicle fitments. Domestic groups already have scale, yet the raw material spike of 2026 shows how thin their margins become when contracts lag input costs. Makers that secure approvals on high-volume electric platforms should gain replacement share as those cars reach their first tire change. Commodity producers that relied on exports face a harder decade, because the EU duties noted above will push volume into a domestic market that is already competitive.
Output, fleet and trade data anchor the tire estimates
The report uses 2025 as the base year and forecasts to 2035. Market values for the China tire market come from the Credence Research model, checked against a bottom-up calculation of domestic tire output, export shares, vehicle fleet data and typical buyer prices. Regional and segment shares and growth rates are Credence Research estimates based on public data, including national statistics, ministry fleet data, industry association releases, company filings and press coverage. No interviews or surveys were carried out for this edition.
Replacement cycles and NEV wear carry growth to 2035
The China tire market is forecast to reach USD 84.14 billion by 2035, at a 6.15% CAGR across 2026–2035. Early years will depend on raw material costs and on how much export capacity returns home after trade rulings. Later growth should come from a larger fleet, from battery-electric cars entering their replacement cycles and from rim sizes above 18 inches becoming standard on mid-priced models. Domestic makers are likely to gain original-equipment share, while foreign brands focus on premium fitments. East China should keep the largest share through 2035, although West China narrows the gap.
Raw material costs and trade rules decide the range of outcomes
In the base case, spending grows steadily from USD 49.17 billion in 2026 along the central forecast. The range depends mostly on whether makers can pass on raw material costs and on how much export volume returns to the home market after the EU duties. The downside case assumes sustained rubber inflation, deeper price competition and weaker truck demand. The upside case adds a faster battery-electric replacement wave and a quicker move to rims above 18 inches, which raise the value of each set.
| Scenario | CAGR, 2026–2035 | Value, 2035 | What has to hold |
|---|---|---|---|
| Downside | 4.6% | USD 73.39 billion | Rubber costs stay high, redirected exports deepen price cuts and freight growth slows |
| Base | 6.15% | USD 84.14 billion | Fleet growth continues, NEV sales hold near current shares and costs pass through gradually |
| Upside | 7.6% | USD 94.67 billion | BEV replacement accelerates and larger rim sizes spread quickly into mid-priced cars |
Frequently Asked Questions
How big is the China tire market?
Which vehicle type leads tire spending in China?
Which region holds the largest share?
Which region is growing fastest?
How do electric vehicles affect tire demand in China?
Do Chinese drivers buy tires online?
Which companies are active in the market?
What are the main risks for tire makers?
Table of Content
Chapter 1 Market Segmentation
- 1.1 Segmentation Framework
- 1.1.1 Product and Service Classification
- 1.1.2 Application and End-Use Classification
- 1.1.3 Technology and Solution Classification
- 1.1.4 Customer and Distribution Channel Classification
- 1.1.5 Geographic Segmentation
- 1.1.6 Market Segment Definitions and Boundaries
- 1.2 By Vehicle Type
- 1.2.1 Passenger Cars
- 1.2.2 Medium & Heavy Commercial Vehicles
- 1.2.3 Light Commercial Vehicles
- 1.2.4 Off-the-Road Vehicles
- 1.2.5 Two-Wheelers
- 1.3 By Tire Construction
- 1.3.1 Radial Tires
- 1.3.2 Bias-Ply Tires
- 1.3.3 Non-Pneumatic & Specialty Tires
- 1.4 By Sales Channel
- 1.4.1 Dealer & Distributor Networks
- 1.4.2 OEM Direct Supply
- 1.4.3 E-Commerce Platforms
- 1.4.4 Fleet Contract Sales
- 1.4.5 Brand-Owned Retail
- 1.5 By Powertrain
- 1.5.1 Internal-Combustion Vehicles
- 1.5.2 Battery-Electric Vehicles
- 1.5.3 Plug-In Hybrid Vehicles
- 1.5.4 Hybrid & Fuel-Cell Vehicles
Chapter 2 Introduction
- 2.1 Report Objectives and Scope
- 2.2 Product Definition and Industry Terminology
- 2.3 Market Inclusions and Exclusions
- 2.4 Research Process
- 2.4.1 Primary Research and Expert Interviews
- 2.4.2 Secondary Research and Source Review
- 2.4.3 Top-Down and Bottom-Up Estimation
- 2.4.4 Data Triangulation and Verification
- 2.5 Market Size Measurement Basis
- 2.5.1 2025: USD 46.60 billion → 2035: USD 84.14 billion
- 2.6 Historical and Forecast Reference Periods
- 2.6.1 Historical Period: 2018-2025
- 2.6.2 Base Year: 2025
- 2.6.3 Forecast Period: 2025-2035
- 2.7 Research Assumptions and Limitations
Chapter 3 Executive Summary
- 3.1 Market Snapshot and Key Findings
- 3.2 Base-Year Market Size, 2025
- 3.3 Forecast Market Size, 2035
- 3.4 Revenue and Volume Growth Outlook
- 3.5 Key Demand and Supply Indicators
- 3.6 Leading Market Segments
- 3.7 Fastest-Growing Market Opportunities
- 3.8 Regional Performance Highlights
- 3.9 Technology and Industry Transformation
- 3.10 Competitive Landscape Summary
- 3.11 Analyst View and Strategic Implications
Chapter 4 China Tire Market Trends and Developments
- 4.1 Historical Industry Development, 2018-2025
- 4.2 Recent Market Trends and Developments
- 4.3 Demand and Customer Behavior Trends
- 4.4 Technology and Product Innovation
- 4.5 Artificial Intelligence, Automation and Digitalization
- 4.6 Local Manufacturing and Supply Chain Realignment
- 4.7 Industry Partnerships, Mergers and Acquisitions
- 4.8 Sustainability and Circular Economy Developments
- 4.9 Government and Private Sector Investment Trends
- 4.10 Emerging Business Models and Commercialization
- 4.11 Industry Developments and Announcements
Chapter 5 China Tire Market Production, Supply and Demand Analysis
- 5.1 Demand Trend and Consumption Analysis, 2018-2025
- 5.2 Demand Forecast, 2025-2035
- 5.3 Production and Output Trend, 2018-2025
- 5.4 Production and Output Forecast, 2025-2035
- 5.5 Installed Capacity and Capacity Utilization
- 5.6 Company-Wise Production Plants and Statistics
- 5.6.1 Installed Production Capacity
- 5.6.2 Actual Production
- 5.6.3 Planned Capacity and Expansion Targets
- 5.7 Supply Chain Structure and Procurement Trends
- 5.8 Supply-Demand Gap and Bottlenecks
- 5.9 Import Dependence and Sourcing Structure
- 5.10 Contract Manufacturing and Outsourcing
- 5.11 Regional Supply and Demand Concentration
Chapter 6 China Tire Market Pricing Analysis
- 6.1 Pricing Structure and Measurement
- 6.2 Historical Pricing Trends, 2018-2025
- 6.3 Pricing Outlook, 2025-2035
- 6.4 Average Selling Price and Unit Economics
- 6.5 Pricing by Product and Market Segment
- 6.6 Geographic Pricing Differences
- 6.7 Key Input, Energy, Labor and Logistics Costs
- 6.8 Contract Pricing and Purchasing Models
- 6.9 Pricing Sensitivity and Competitive Positioning
- 6.10 Price, Margin and Profitability Implications
Chapter 7 China Tire Market Dynamics
- 7.1 Market Growth Drivers
- 7.1.1 Demand-Side Drivers
- 7.1.2 Technology and Innovation Drivers
- 7.1.3 Infrastructure and Investment Drivers
- 7.1.4 Regulatory and Policy Drivers
- 7.2 Market Restraints
- 7.2.1 Cost and Affordability Constraints
- 7.2.2 Technology and Adoption Barriers
- 7.2.3 Supply Chain and Operational Constraints
- 7.3 Market Challenges
- 7.3.1 Competitive Pressure and Margin Erosion
- 7.3.2 Skills, Infrastructure and Implementation Gaps
- 7.4 Emerging Market Opportunities
- 7.5 Market Dynamics Impact and Time-Horizon Assessment
Chapter 8 China Tire Value Chain Analysis
- 8.1 Industry Value Chain Overview
- 8.2 Upstream Suppliers and Critical Inputs
- 8.3 Technology and Component Providers
- 8.4 Manufacturing or Service Delivery
- 8.5 Distribution, Channel Partners and Integrators
- 8.6 Downstream Applications and End Users
- 8.7 Value Addition and Profit Pools
- 8.8 Vertical Integration and Outsourcing
- 8.9 Supplier Concentration and Risk
- 8.10 Supply Chain Localization and Resilience
Chapter 9 China Tire Market Regulations and Policies
- 9.1 Relevant Laws, Standards and Compliance Frameworks
- 9.2 Product, Service, Safety and Quality Requirements
- 9.3 Government Policies, Incentives and Subsidies
- 9.4 Imports, Exports and Trade Barriers
- 9.5 Public Procurement and Local Content Requirements
- 9.6 Environmental and Sustainability Compliance
- 9.7 Upcoming Policy Changes and Market Implications
Chapter 10 China Tire Market Hotspots and Opportunities
- 10.1 Market Opportunity Mapping and Growth Hotspots
- 10.2 High-Growth Applications and Customer Groups
- 10.3 Underserved Markets and White-Space Opportunities
- 10.4 Emerging Technology and Product Opportunities
- 10.5 New Capacity and Investment Hotspots
- 10.6 Market Entry and Expansion Opportunities
- 10.7 Distribution and Partnership Opportunities
- 10.8 Near-Term and Long-Term Commercial Potential
- 10.9 Opportunity Attractiveness and Execution Risks
Chapter 11 China Tire Market Outlook, 2025-2035
- 11.1 Market Size and Analysis
- 11.1.1 Revenue (Market Measurement: 2025: USD 46.60 billion → 2035: USD 84.14 billion)
- 11.1.2 Market Volume and Quantity Sold
- 11.1.3 Historical Market Size, 2018-2025
- 11.1.4 Base-Year Market Size, 2025
- 11.2 Market Forecast, 2025-2035
- 11.2.1 Revenue Forecast to 2035
- 11.2.2 Volume Forecast to 2035
- 11.2.3 CAGR and Year-on-Year Growth
- 11.2.4 Incremental Revenue Opportunity
- 11.3 Forecast Assumptions and Scenario Analysis
- 11.3.1 Base-Case Forecast
- 11.3.2 Optimistic and Conservative Scenarios
- 11.3.3 Technology, Pricing and Policy Sensitivities
- 11.4 Market Attractiveness and Growth Outlook
Chapter 12 China Tire Market Segmentation and Outlook
- 12.1 Segmentation Summary and Market Shares, 2025
- 12.2 Largest and Fastest-Growing Segments
- 12.3 By Vehicle Type - Market Size and Forecast, 2025-2035
- 12.3.1 Segment Definition and Scope
- 12.3.2 Historical Market Size, 2018-2025
- 12.3.3 Revenue Forecast, 2025-2035
- 12.3.4 Volume Forecast, 2025-2035
- 12.3.5 Base-Year Market Share, 2025
- 12.3.6 Segment CAGR and Growth Drivers
- 12.3.7 Subsegment Market Size and Forecast
- 12.3.7.1 Passenger Cars
- 12.3.7.2 Medium & Heavy Commercial Vehicles
- 12.3.7.3 Light Commercial Vehicles
- 12.3.7.4 Off-the-Road Vehicles
- 12.3.7.5 Two-Wheelers
- 12.3.8 Subsegment Pricing and Adoption Trends
- 12.3.9 Leading Suppliers and Competition
- 12.3.10 Regional Demand and Opportunities
- 12.4 By Tire Construction - Market Size and Forecast, 2025-2035
- 12.4.1 Segment Definition and Scope
- 12.4.2 Historical Market Size, 2018-2025
- 12.4.3 Revenue Forecast, 2025-2035
- 12.4.4 Volume Forecast, 2025-2035
- 12.4.5 Base-Year Market Share, 2025
- 12.4.6 Segment CAGR and Growth Drivers
- 12.4.7 Subsegment Market Size and Forecast
- 12.4.7.1 Radial Tires
- 12.4.7.2 Bias-Ply Tires
- 12.4.7.3 Non-Pneumatic & Specialty Tires
- 12.4.8 Subsegment Pricing and Adoption Trends
- 12.4.9 Leading Suppliers and Competition
- 12.4.10 Regional Demand and Opportunities
- 12.5 By Sales Channel - Market Size and Forecast, 2025-2035
- 12.5.1 Segment Definition and Scope
- 12.5.2 Historical Market Size, 2018-2025
- 12.5.3 Revenue Forecast, 2025-2035
- 12.5.4 Volume Forecast, 2025-2035
- 12.5.5 Base-Year Market Share, 2025
- 12.5.6 Segment CAGR and Growth Drivers
- 12.5.7 Subsegment Market Size and Forecast
- 12.5.7.1 Dealer & Distributor Networks
- 12.5.7.2 OEM Direct Supply
- 12.5.7.3 E-Commerce Platforms
- 12.5.7.4 Fleet Contract Sales
- 12.5.7.5 Brand-Owned Retail
- 12.5.8 Subsegment Pricing and Adoption Trends
- 12.5.9 Leading Suppliers and Competition
- 12.5.10 Regional Demand and Opportunities
- 12.6 By Powertrain - Market Size and Forecast, 2025-2035
- 12.6.1 Segment Definition and Scope
- 12.6.2 Historical Market Size, 2018-2025
- 12.6.3 Revenue Forecast, 2025-2035
- 12.6.4 Volume Forecast, 2025-2035
- 12.6.5 Base-Year Market Share, 2025
- 12.6.6 Segment CAGR and Growth Drivers
- 12.6.7 Subsegment Market Size and Forecast
- 12.6.7.1 Internal-Combustion Vehicles
- 12.6.7.2 Battery-Electric Vehicles
- 12.6.7.3 Plug-In Hybrid Vehicles
- 12.6.7.4 Hybrid & Fuel-Cell Vehicles
- 12.6.8 Subsegment Pricing and Adoption Trends
- 12.6.9 Leading Suppliers and Competition
- 12.6.10 Regional Demand and Opportunities
- 12.7 Segment Growth Comparison
- 12.8 Segment Attractiveness and Priority Matrix
Chapter 13 China Tire Geographic Market Outlook, 2025-2035
- 13.1 Domestic Market Distribution and Demand Clusters
- 13.2 State- or Province-Wise Market Size and Forecast, 2025-2035
- 13.3 City and Metropolitan Market Outlook
- 13.4 Industrial, Manufacturing and Commercial Clusters
- 13.5 Geographic Concentration of Key End Users
- 13.6 Local Pricing and Purchasing Differences
- 13.7 Domestic Production Facilities and Capacity Map
- 13.8 Local Infrastructure and Project Pipeline
- 13.9 State-Level Policy and Incentive Differences
- 13.10 Subnational Investment Hotspots and Opportunities
- 13.11 Distribution and Logistics Networks
- 13.12 Domestic Competitive Footprint
Chapter 14 China Tire Technology, Innovation and Sustainability Outlook
- 14.1 Technology Landscape and Maturity
- 14.2 Product, Process and Service Innovation
- 14.3 AI, Automation and Digital Tools in the Industry
- 14.4 Technology Adoption and Performance Benchmarking
- 14.5 Innovation Pipeline and R&D Investment
- 14.6 Patent and Intellectual Property Trends
- 14.7 Energy Efficiency and Resource Management
- 14.8 Sustainability, Recycling and Circularity
- 14.9 Technology Roadmap, 2025-2035
- 14.10 Risks of Obsolescence and Technology Substitution
Chapter 15 China Tire Market Key Strategic Imperatives
- 15.1 Growth and Market Entry Priorities
- 15.2 High-Return Products and Segments
- 15.3 Pricing, Profitability and Cost Optimization
- 15.4 Technology Investment and Product Differentiation
- 15.5 Supply Chain Localization and Resilience
- 15.6 Distribution and Customer Acquisition
- 15.7 Partnership, Acquisition and Capacity Strategy
- 15.8 Regional Expansion Priorities
- 15.9 Short-, Medium- and Long-Term Actions
Chapter 16 Competition Outlook
- 16.1 Industry Competition Characteristics
- 16.2 Market Structure and Concentration
- 16.3 Market Share and Competitive Positioning, 2025
- 16.4 Company-Wise Revenue and Product Benchmarking
- 16.5 Production and Service Capacity Benchmarking
- 16.6 Technology, Pricing and Differentiation
- 16.7 Regional Footprint and Distribution Strength
- 16.8 Mergers, Acquisitions and Strategic Alliances
- 16.9 New Entrants and Competitive Threats
- 16.10 Porter's Five Forces and Industry Attractiveness
- 16.11 Competitive Outlook, 2025-2035
Chapter 17 Company Profiles
- 17.1 Company Coverage and Selection Criteria
- 17.2 Zhongce Rubber Group Co., Ltd.
- 17.2.1 Business Description
- 17.2.2 Company Ownership and Geographic Presence
- 17.2.3 Product and Service Portfolio
- 17.2.4 Manufacturing and Operating Footprint
- 17.2.5 Production Capacity and Expansion Plans
- 17.2.6 Financial Performance and Investment
- 17.2.7 Market Share and Competitive Position
- 17.2.8 Technology and Innovation Capabilities
- 17.2.9 Strategic Alliances or Partnerships
- 17.2.10 Recent Developments
- 17.2.11 Growth Strategy and Outlook
- 17.3 Sailun Group Co., Ltd.
- 17.4 Shandong Linglong Tyre Co., Ltd.
- 17.5 Triangle Tyre Co., Ltd.
- 17.6 Giti Tire Pte. Ltd.
- 17.7 Prinx Chengshan Holdings Limited
- 17.8 Aeolus Tyre Co., Ltd.
- 17.9 Guizhou Tyre Co., Ltd.
- 17.10 Qingdao Sentury Tire Co., Ltd.
- 17.11 Hankook Tire & Technology Co., Ltd.
- 17.12 Other Relevant Market Participants
Note: Every listed company is profiled on the structure shown under the first company. The company list is preliminary and may change based on research findings, market developments, data availability and client requirements.
Chapter 18 Disclaimer
- 18.1 Research and Forecast Disclaimer
- 18.2 Data Source and Estimation Limitations
Note: The depth of individual sections depends on data availability for this market. Volume, capacity, trade and other unit-based metrics are included where applicable.