Road haulage carries most value as port imports surge
The Colombia freight and logistics market was valued at USD 22.17 billion in 2025 and is projected to increase from USD 23.60 billion in 2026 to USD 40.11 billion by 2035, registering a CAGR of 6.07% during 2026–2035. Demand comes from the trucking of consumer goods, fuels and food between the Andean cities and the coasts, from container imports through the Caribbean and Pacific ports, and from parcel delivery for online retailers. Bogotá-Cundinamarca held 32.0% of 2025 value, the largest regional share, because the capital district and its surrounding department concentrate the most consumers, distribution centers and air cargo. The Pacific-Buenaventura Corridor is the fastest-growing region at 7.0% a year, as more import containers move through Buenaventura toward Cali and Bogotá. On the policy side, rail freight on the central corridor between the Magdalena valley and the Caribbean has resumed at commercial scale under a new concession, which gives bulk shippers an alternative to long truck hauls.
Trucking, forwarding, warehousing and customs form one estimate
The estimate measures revenue earned by companies that move, store and clear goods for shippers in Colombia. It covers road, maritime, air and rail freight services billed in the country, freight forwarding, contract logistics and warehousing, customs brokerage and trade compliance, and value-added services such as fulfillment, kitting and labeling.
The estimate excludes passenger transport, pipelines, the in-house fleets of shippers that do not bill a third party, port terminal handling charges collected by port operators, and the value of the goods themselves. The value chain runs from shippers through forwarders, carriers, warehouse operators and customs agencies to ports, airports and final consignees.
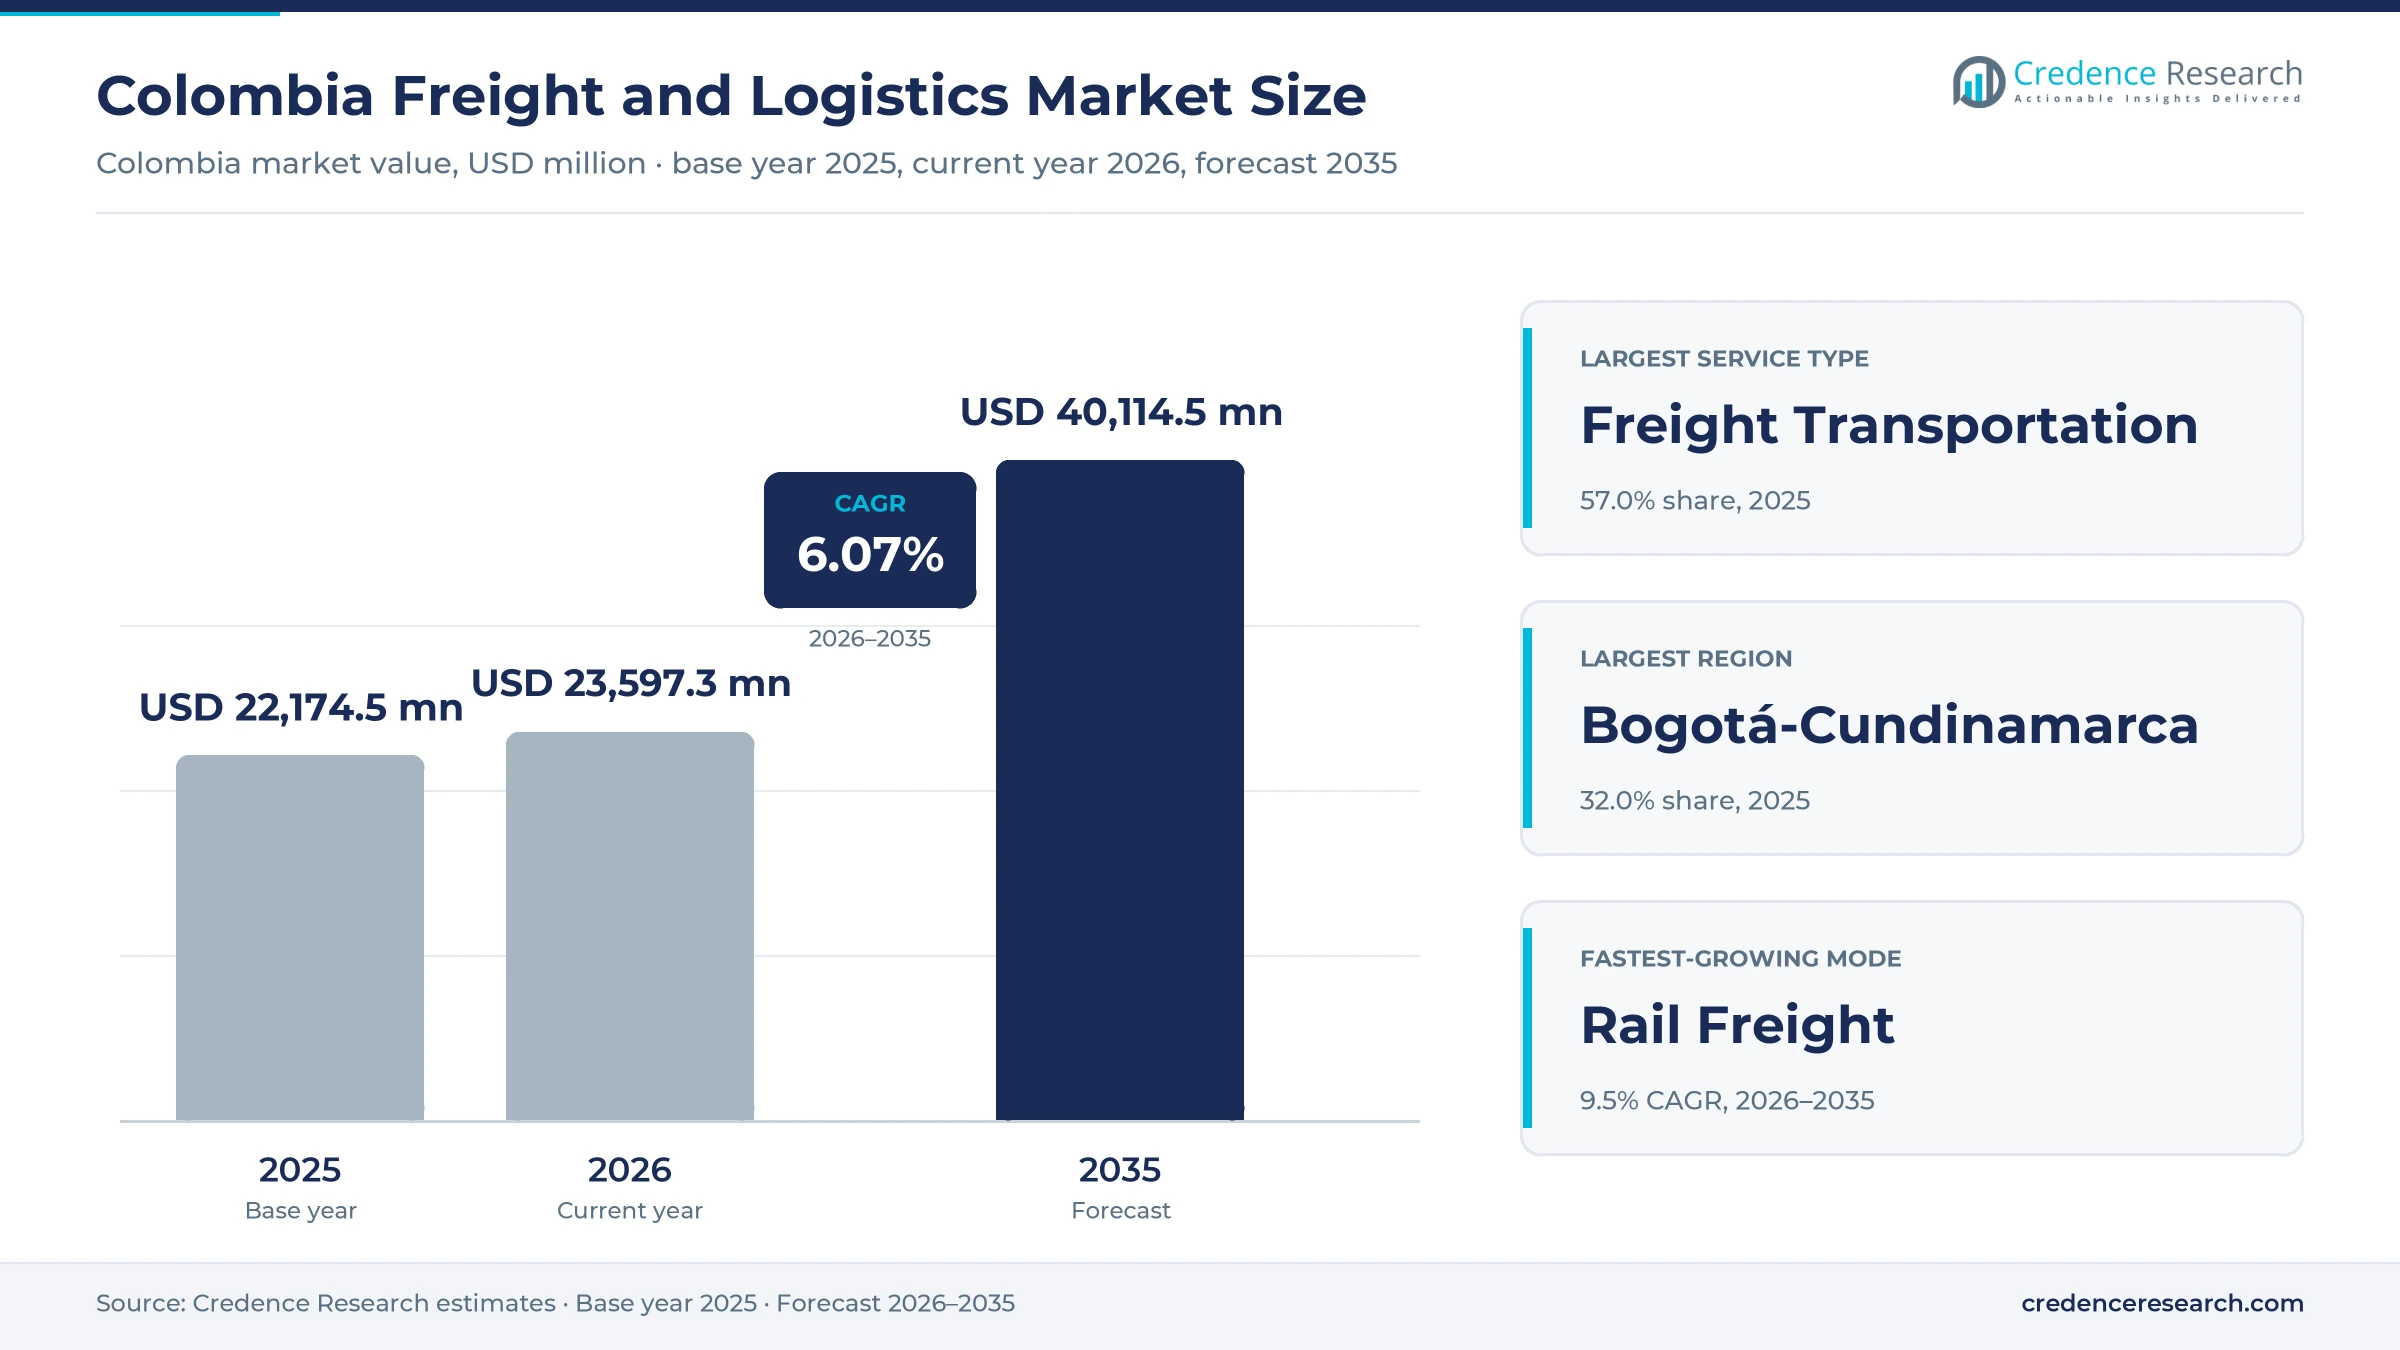
Colombia Freight and Logistics Market Insights
- The Colombia freight and logistics market was valued at USD 22.17 billion in 2025 and is projected to reach USD 40.11 billion by 2035, registering a CAGR of 6.07% during 2026–2035.
- Bogotá-Cundinamarca held 32.0% of 2025 value, because the capital and Cundinamarca produced 31.7% of national GDP in 2025 and El Dorado handles most air cargo.
- Freight transportation led service types with 57.0% of 2025 value, because transport makes up 44.5% of logistics costs reported by Colombian companies.
- Colombian ports handled 6,227,205 TEU in 2025, up 17.2% from 2024, while import tonnage rose 9.9% and export tonnage fell 12.3%, according to Supertransporte.
- DSV completed its acquisition of Schenker on April 30, 2025, which combined two of the larger international forwarders active in Colombia.
Trucking leads while rail and fulfillment grow fastest
Why does freight transportation earn most logistics spending?
Based on service type, the market is categorized into freight transportation, freight forwarding, contract logistics, customs brokerage and trade compliance, and value-added logistics. Freight Transportation led with 57.0% of 2025 value, because transport made up 44.5% of company logistics costs in the 2024 national logistics survey, against 22.4% for storage, according to Analdex. Value-Added Logistics grows fastest at 7.4% a year, as online purchases reached 684.6 million transactions in 2025, up 19.9%, according to the Colombian Chamber of Electronic Commerce. Each order needs picking, packing and returns handling, which shippers increasingly buy from third parties.
How much of Colombian freight still moves by truck?
Based on mode of transport, the market is categorized into road freight, maritime freight, air freight and rail freight. Road Freight led with 74.5% of 2025 value, because trucks moved more than 151 million tons in 2025 while the main active rail corridor carried about 1 million tons, according to the Ministry of Transport and the Agencia Nacional de Infraestructura. Rail Freight grows fastest at 9.5% a year from a small base, as the Agencia Nacional de Infraestructura reported that the La Dorada to Chiriguaná line more than tripled its volume in 2025. Rail still lacks direct links to most ports, so trucks keep the first and last legs of these trips.
Which cargo flows add the most new logistics revenue?
Based on shipment flow, the market is categorized into domestic inland freight, export freight, import freight and transit and transshipment. Domestic Inland Freight led with 55.0% of 2025 value, because the national dispatch register logged more than 13 million road trips in 2025, against 11,515 vessel arrivals at Colombian ports, according to Supertransporte. Import Freight grows fastest at 6.9% a year, as port import tonnage rose 9.9% in 2025 while export tonnage fell 12.3%. Imports also carry more value per ton than coal and oil exports, so they generate more forwarding and customs work.
Which industries buy the most freight and logistics?
Based on end-use industry, the market is categorized into wholesale and retail trade, manufacturing, agriculture and food, mining and energy, and construction and infrastructure. Wholesale and Retail Trade led with 30.0% of 2025 value, because corn, mixed goods and parcels were the solid cargoes with the most road traffic in 2025, according to the Ministry of Transport. Agriculture and Food grows fastest at 6.7% a year, as sugar exports through Buenaventura rose 16.5% and unroasted coffee 7.9% in 2025 while coal fell 12.9%, according to the Cali Chamber of Commerce. Food shippers buy refrigerated trucking and export forwarding that bulk coal miners rarely need.
| Segment Group | Leading Sub-segment | Share, 2025 | Fastest-growing Sub-segment | CAGR, 2026–2035 |
|---|---|---|---|---|
| By Service Type | Freight Transportation | 57.0% | Value-Added Logistics | 7.4% |
| By Mode of Transport | Road Freight | 74.5% | Rail Freight | 9.5% |
| By Shipment Flow | Domestic Inland Freight | 55.0% | Import Freight | 6.9% |
| By End-Use Industry | Wholesale and Retail Trade | 30.0% | Agriculture and Food | 6.7% |
Diesel, tolls and port charges set Colombian freight rates
Road freight in Colombia is priced per trip or per ton between origin and destination, and the Ministry of Transport publishes reference operating costs through its SICE-TAC system, which shippers and carriers use as a reference in negotiations. Forwarders charge per container or per kilogram plus surcharges, contract logistics is billed per pallet position or per order, and parcel networks charge per shipment by weight and zone. Diesel, tolls and waiting time move road rates most, while port and municipal charges add to drayage. Carriers with fuel clauses and backhaul cargo keep better margins.
| Service or cost item | Typical price or fee | Basis |
|---|---|---|
| Express parcel shipment, national average | About COP 8,100 a shipment | Credence Research estimate from the MinTIC postal bulletin, first quarter of 2026 |
| Road freight reference cost after the 2024 diesel increase | Up 7.83% on average, up to 10% on some routes | Imétrica estimate reported by La República, September 2024 |
| Diesel at the pump, the largest truck cost item | COP 10,725 a gallon from Jan. 1, 2025 | Portafolio, January 2025 |
| Buenaventura municipal cargo charge | COP 4,253 a ton, about COP 127,050 per 30-ton trip | ANDI estimate reported by La República, October 2026 |
Request a Free Sample
Fill in your details and we'll send you a free sample report.
- Sample data tables & charts
- Research methodology
Road volumes, container imports and rail lift demand
How do domestic road volumes keep trucking demand growing?
Domestic road freight is the base load of the market, because almost every consumer good, fuel shipment and food delivery in Colombia spends part of its trip on a truck. The Ministry of Transport recorded more than 151 million tons moved by road in 2025, up 3.7% from 2024, across more than 13 million trips, as reported by Portafolio. Valle del Cauca ranked first as both origin and destination, ahead of Cundinamarca and Antioquia. The same register counted 2,620 cargo companies, so demand is spread across many carriers rather than a few. Road freight already holds 74.5% of 2025 value, and steady consumer spending keeps that base growing even when export bulk cargo weakens.
Why are container imports lifting forwarding and port logistics?
Container imports are the fastest source of new revenue for forwarders, customs agencies and drayage carriers, because each box needs booking, clearance and inland delivery. Colombian ports handled 6,227,205 TEU in 2025, up 17.2% from 2024, according to the Superintendencia de Transporte. That increase added 913,360 TEU in one year, according to the same Supertransporte bulletin. Import tonnage rose 9.9% in the same year, even as coal and oil exports declined. Import freight grows fastest by shipment flow at 6.9% a year, which favors forwarders with strong Asia and U.S. lanes. Container volume at Buenaventura grew 21.6% in 2025, faster than the national total, according to Analdex.
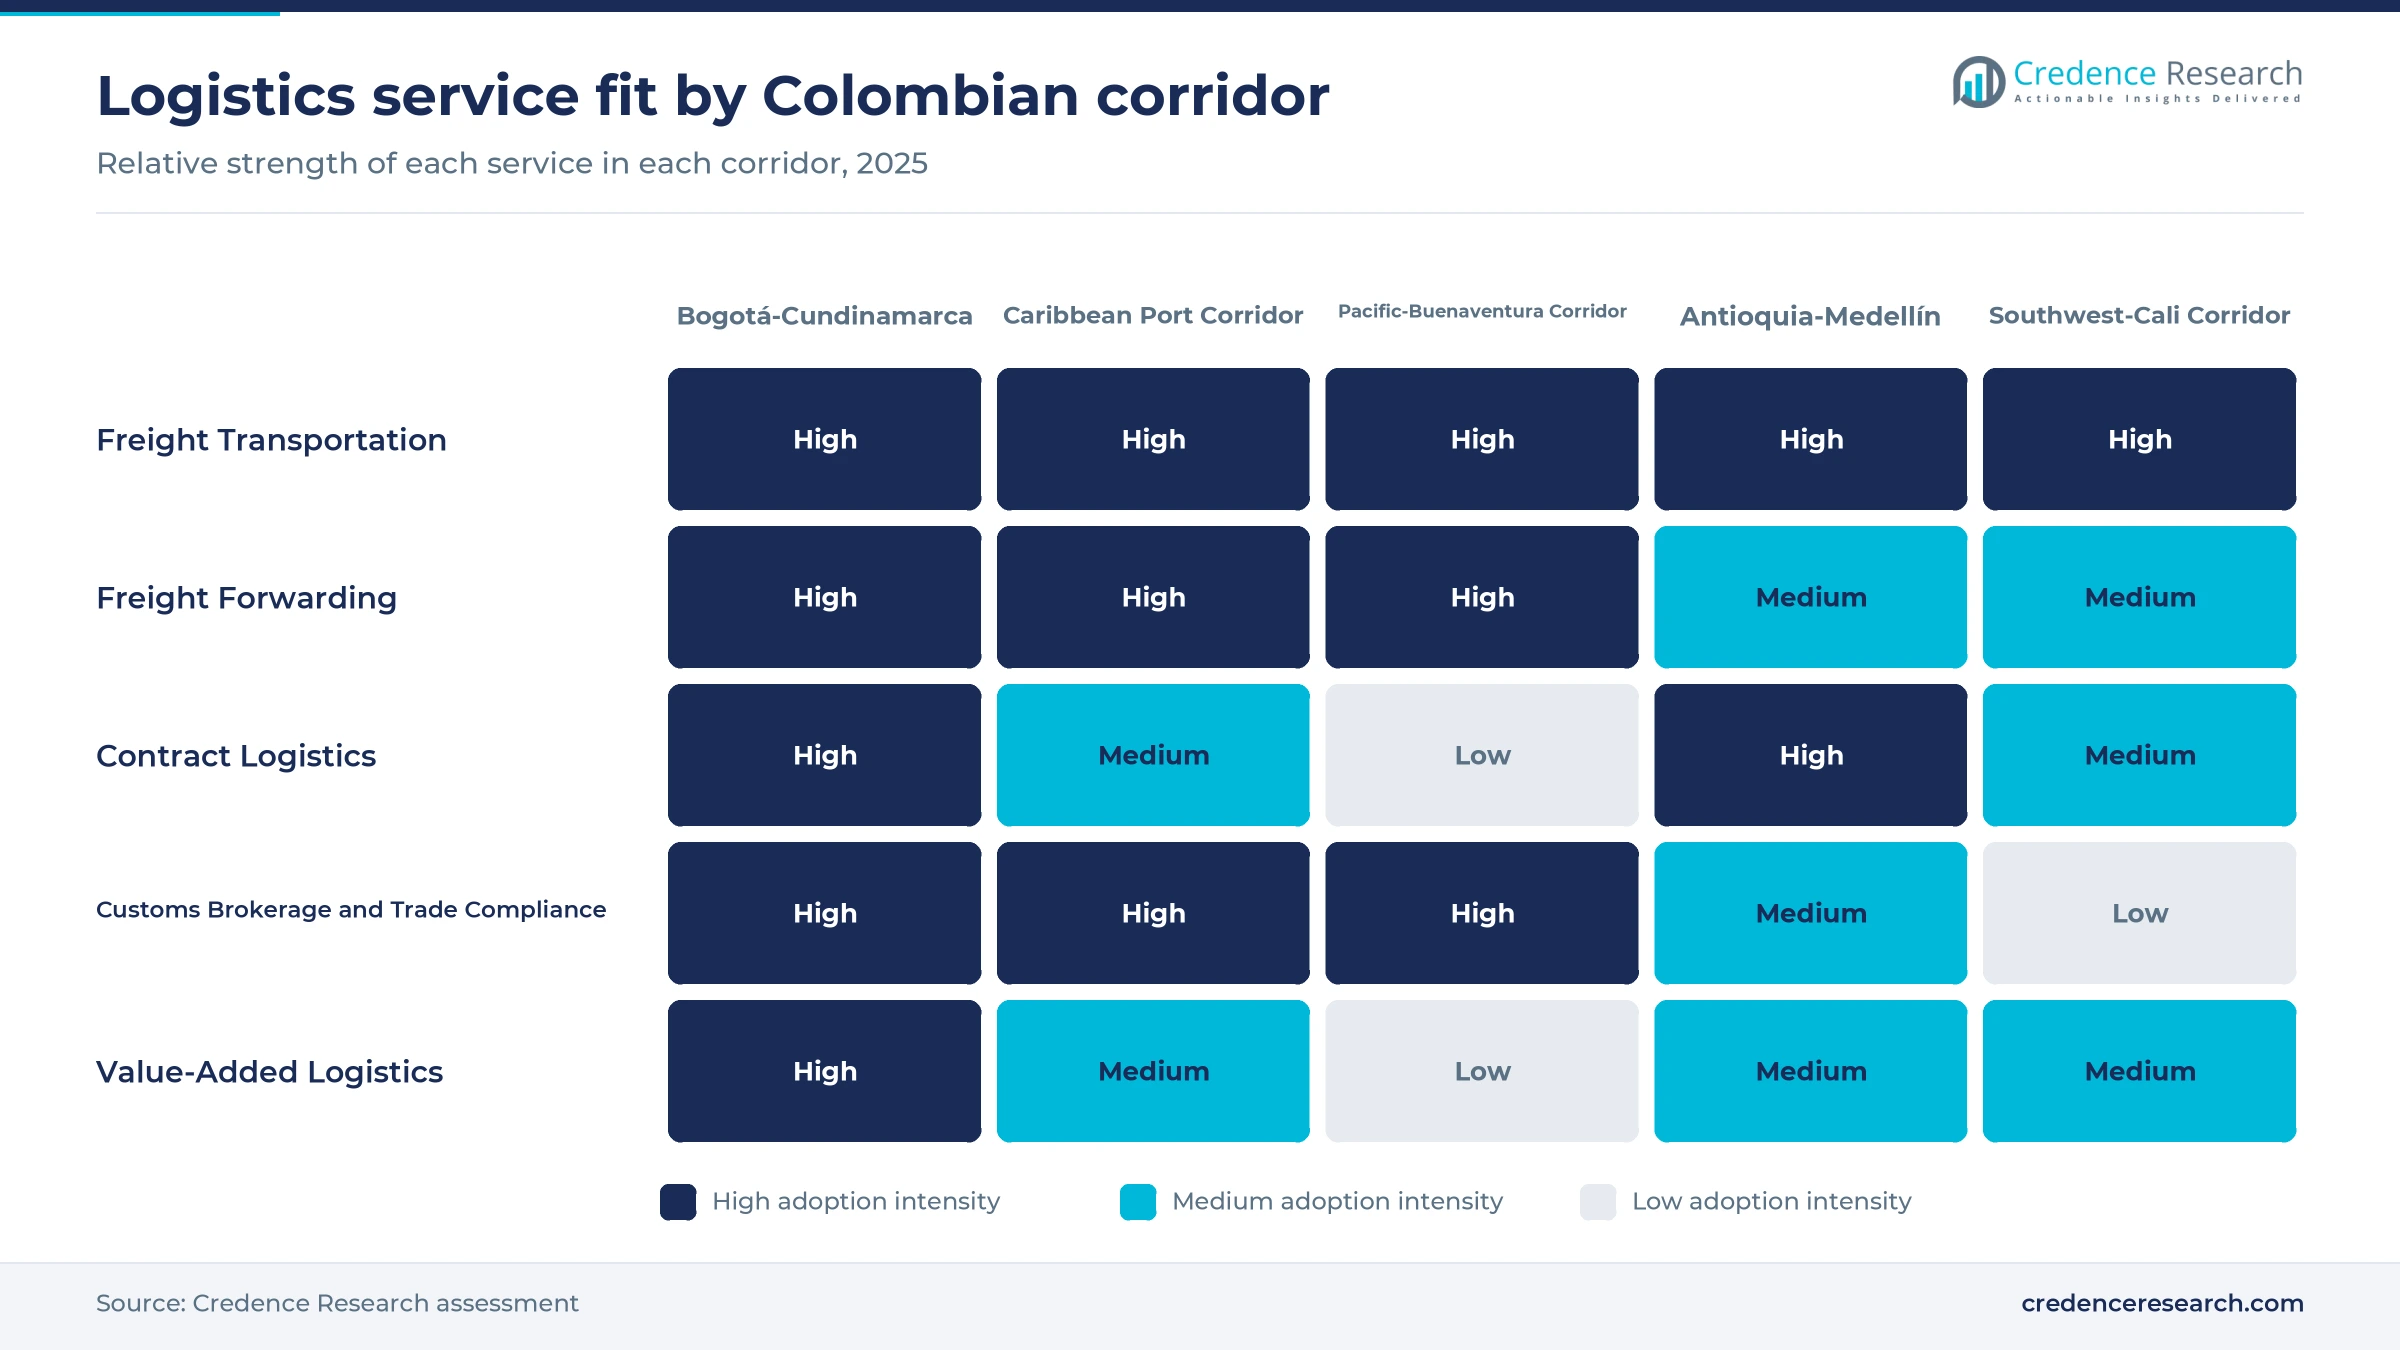
Can rail and multimodal corridors win bulk cargo from trucks?
The revival of freight rail gives bulk shippers between the interior and the Caribbean a cheaper option than long truck hauls, and it creates new transfer and storage work at rail yards. The Agencia Nacional de Infraestructura reported that the 526-kilometer La Dorada to Chiriguaná corridor carried 1,030,789 tons between January and November 2025, 350% more than in all of 2024. The agency signed the first rail public-private partnership for the corridor, valued at COP 3.39 trillion, with the Línea Férrea Central consortium in 2025. Rail freight grows fastest by mode at 9.5% a year, although from a small base.
How does online retail push parcel and fulfillment volumes?
Online retail is turning freight into many small shipments, which shifts spending toward parcel networks, urban delivery and fulfillment centers. The Colombian Chamber of Electronic Commerce reported online sales of COP 145.4 trillion in 2025, up 11.1% from 2024, as reported by El Colombiano. The postal bulletin of the Ministry of Information Technologies and Communications counted 84.1 million express shipments in the first quarter of 2026, 11.1 million more than a year earlier. Coordinadora, which invested in more than 155 new vehicles in 2025, told Portafolio that the November and December season, which starts with Black Friday, brings about 15% of its annual sales. Value-added logistics grows fastest by service type at 7.4% a year as these volumes climb.
Inland depots, electric vans and new ports reshape supply
Rise of inland container yards around Bogotá
Carriers and forwarders are moving container storage and cargo services inland, close to the Bogotá consumer market, instead of keeping them only at the ports. Maersk opened a logistics center in Tocancipá in June 2024 with a 23,000-square-meter container yard, a 3,378-square-meter warehouse and room for up to 1,600 containers, according to La República. DHL Global Forwarding reinforced its pharmaceutical center in Bogotá for temperature-controlled cargo, Portafolio reported in August 2025. Because the capital region is the largest consumer market, inland yards cut empty container returns to the coast and shorten delivery times for importers in the capital.
Shift to electric vans and trucks in city delivery
Parcel and distribution companies are adding electric vehicles for city routes, where short daily distances suit battery range and diesel prices have risen. TCC runs 20 electric trucks in Bogotá, Medellín, Barranquilla and Cartagena, each with an 81.14 kWh battery, according to La República in July 2025. The company reports maintenance costs about 50% lower than for diesel units. DANE data show fuel costs for road freight rose 13.57% in the year to March 2025, as reported by Portafolio. Operators that run electric trucks on dense urban routes can protect margins when diesel subsidies are cut further.
Can Puerto Antioquia open a new Urabá gateway?
Puerto Antioquia gives exporters and importers in the Medellín region a Caribbean port much closer than Cartagena, which opens room for new trucking, forwarding and warehousing services in Urabá. CMA CGM launched the first regular call on Dec. 20, 2025, with the 6,874-TEU CMA CGM Imagination, according to ABC Economía. CMA CGM, Eiffage and Astris Finance provided USD 770 million of the USD 800 million project, which plans 600,000 TEU a year in its first phase. The terminal formally began operating on Feb. 5, 2026, according to Forbes Colombia. Carriers that set up Medellín to Turbo shuttles early can win volume that now travels to Cartagena.
Is customs compliance an opening for mid-size shippers?
The new customs rules and the high logistics costs of smaller firms create demand for outsourced customs brokerage and compliance services. Decree 659 of May 22, 2024, which began to take effect on June 7, 2024, changed rules on seizures, transit and free zone movements, according to Analdex. Analdex also found that 57.6% of importers did not know the advance declaration mechanism in its November 2025 note. The 2022 national logistics survey put logistics costs at 24.3% of sales for small companies against 12.1% for large ones, according to Portafolio. Customs agencies and forwarders that package clearance with transport can win these mid-size accounts.
Fuel, blockades and port access raise operating costs
How do diesel and toll increases squeeze carrier margins?
Operating costs for road carriers have risen faster than freight rates in recent years, because the government has cut its diesel subsidy. DANE's road freight cost index rose 8.31% in the year to March 2025, with fuels up 13.57% and tolls up 12.82%, as reported by Portafolio. A nationwide truckers' strike in early September 2024 followed the diesel increase, according to La República. Smaller owner-operators feel this most, and fuel surcharge clauses in contracts are the main mitigation.
Why do road blockades and insecurity raise delivery risk?
Road blockades, landslides and armed groups interrupt freight on key corridors, which raises delivery times and insurance costs. Colfecar counted about 700 road blockades in 2025, with losses near COP 1.9 trillion, according to a Gallagher report cited by Portafolio in July 2026. The government reported 190 emergencies on the national road network in early 2026. Carriers respond with convoy scheduling, satellite tracking and alternative routes, which add cost to every trip.
How does congested access to Buenaventura delay cargo?
The single road into Buenaventura makes the Pacific port slow and costly to reach, so delays hit importers in Cali and Bogotá. Trucks needed six to eight hours for the roughly 70 kilometers from Alto de Calima, and they waited up to 12 more hours to unload, according to La República in May 2026. Fedetranscarga estimated that each closure day stops about 57,000 tons of cargo. Appointment systems and inland yards reduce, but do not remove, these delays.
Why does truck overcapacity keep freight rates thin?
The trucking fleet has grown faster than cargo volumes, which keeps rates low even as costs climb. Road trips rose 28.8% between 2022 and 2025 while tonnage rose only 11.6%, and the average trip fell from 328.3 to 277.2 kilometers, according to a Universidad Pontificia Bolivariana study reported by Portafolio. The manager of Coltanques said in January 2025 that idle vehicles were raising fixed costs. Consolidation and backhaul matching platforms are the main remedies carriers now use.
Bogotá leads, while the Pacific corridor grows fastest
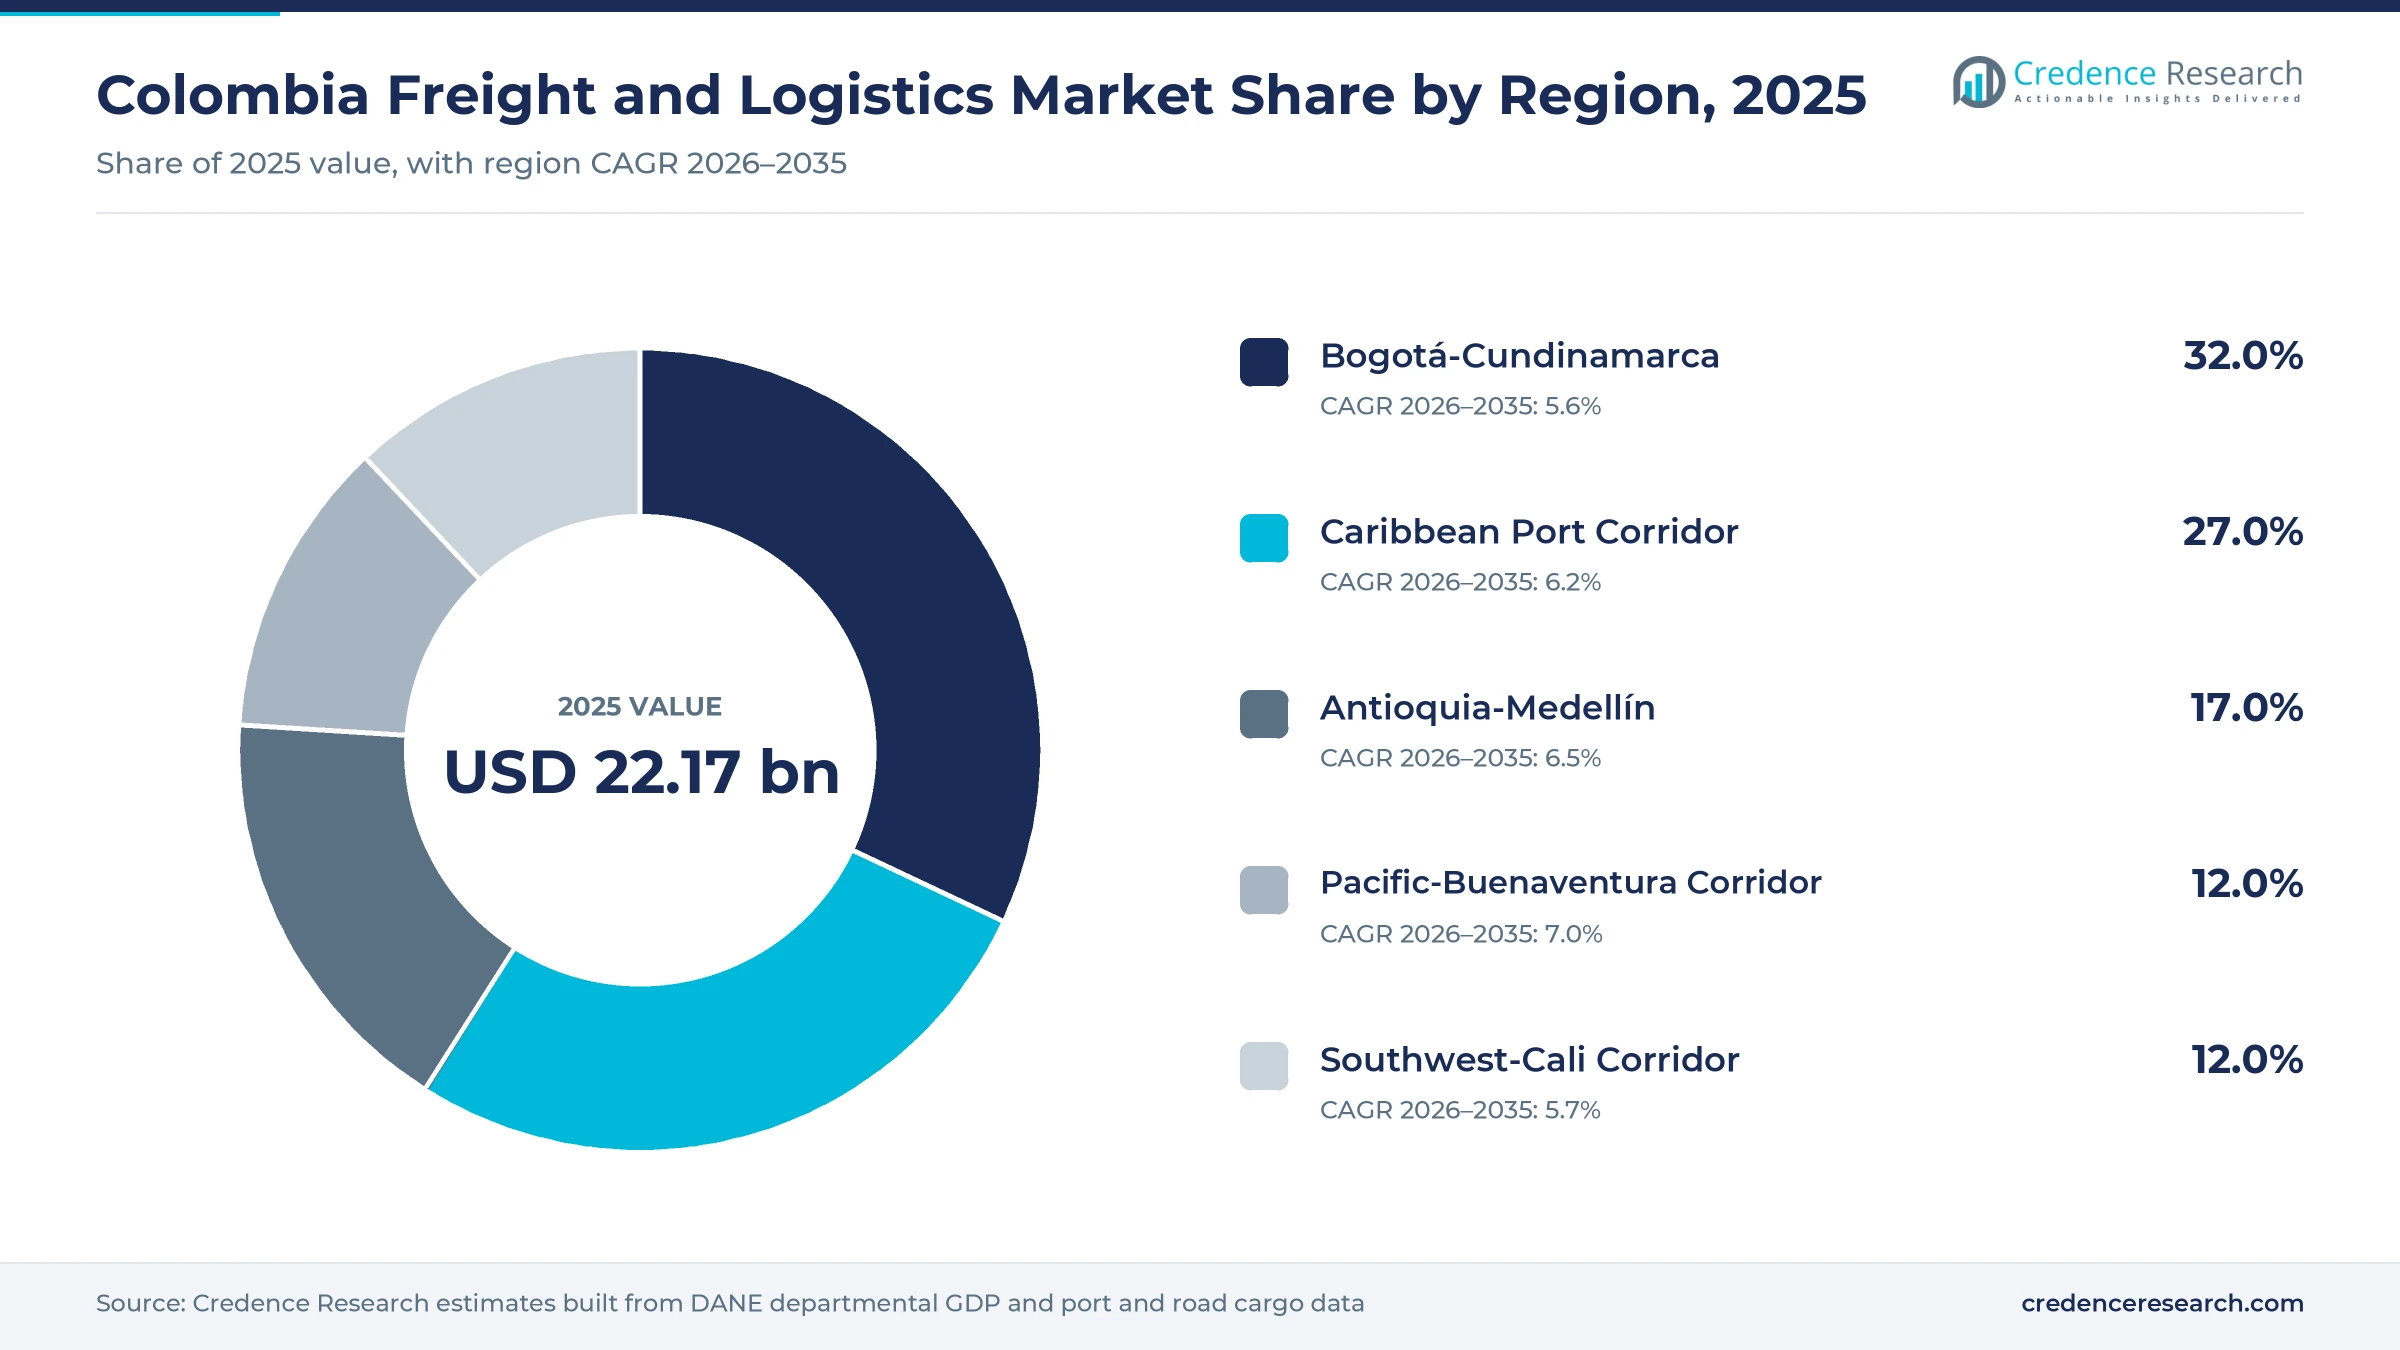
The Colombia freight and logistics market is split into five corridors that follow consumer demand, port gateways and industrial output, and smaller departments are grouped with the corridor that serves them. Corridor shares and growth rates are Credence Research estimates built from DANE departmental GDP and port, air and road cargo data.
| Region | Value, 2025 (USD billion) | Share, 2025 | CAGR, 2026–2035 |
|---|---|---|---|
| Bogotá-Cundinamarca | 7.10 | 32.0% | 5.6% |
| Caribbean Port Corridor | 5.99 | 27.0% | 6.2% |
| Antioquia-Medellín | 3.77 | 17.0% | 6.5% |
| Pacific-Buenaventura Corridor | 2.66 | 12.0% | 7.0% |
| Southwest-Cali Corridor | 2.66 | 12.0% | 5.7% |
Why does Bogotá-Cundinamarca hold the largest corridor share?
Bogotá-Cundinamarca held 32.0% of 2025 value and grows at 5.6% a year, because the capital and its surrounding department are the largest consumer market and distribution hub. Bogotá produced 25.4% of 2025 national GDP and Cundinamarca 6.3%, together 31.7%, according to DANE. El Dorado airport handled 810,800 tons of cargo in 2025, a 74.2% share of the national total, according to Analdex data reported by Portafolio. Most national parcel networks and forwarders run their main sorting centers and bonded warehouses here.
Cartagena moves most containers and transshipment cargo
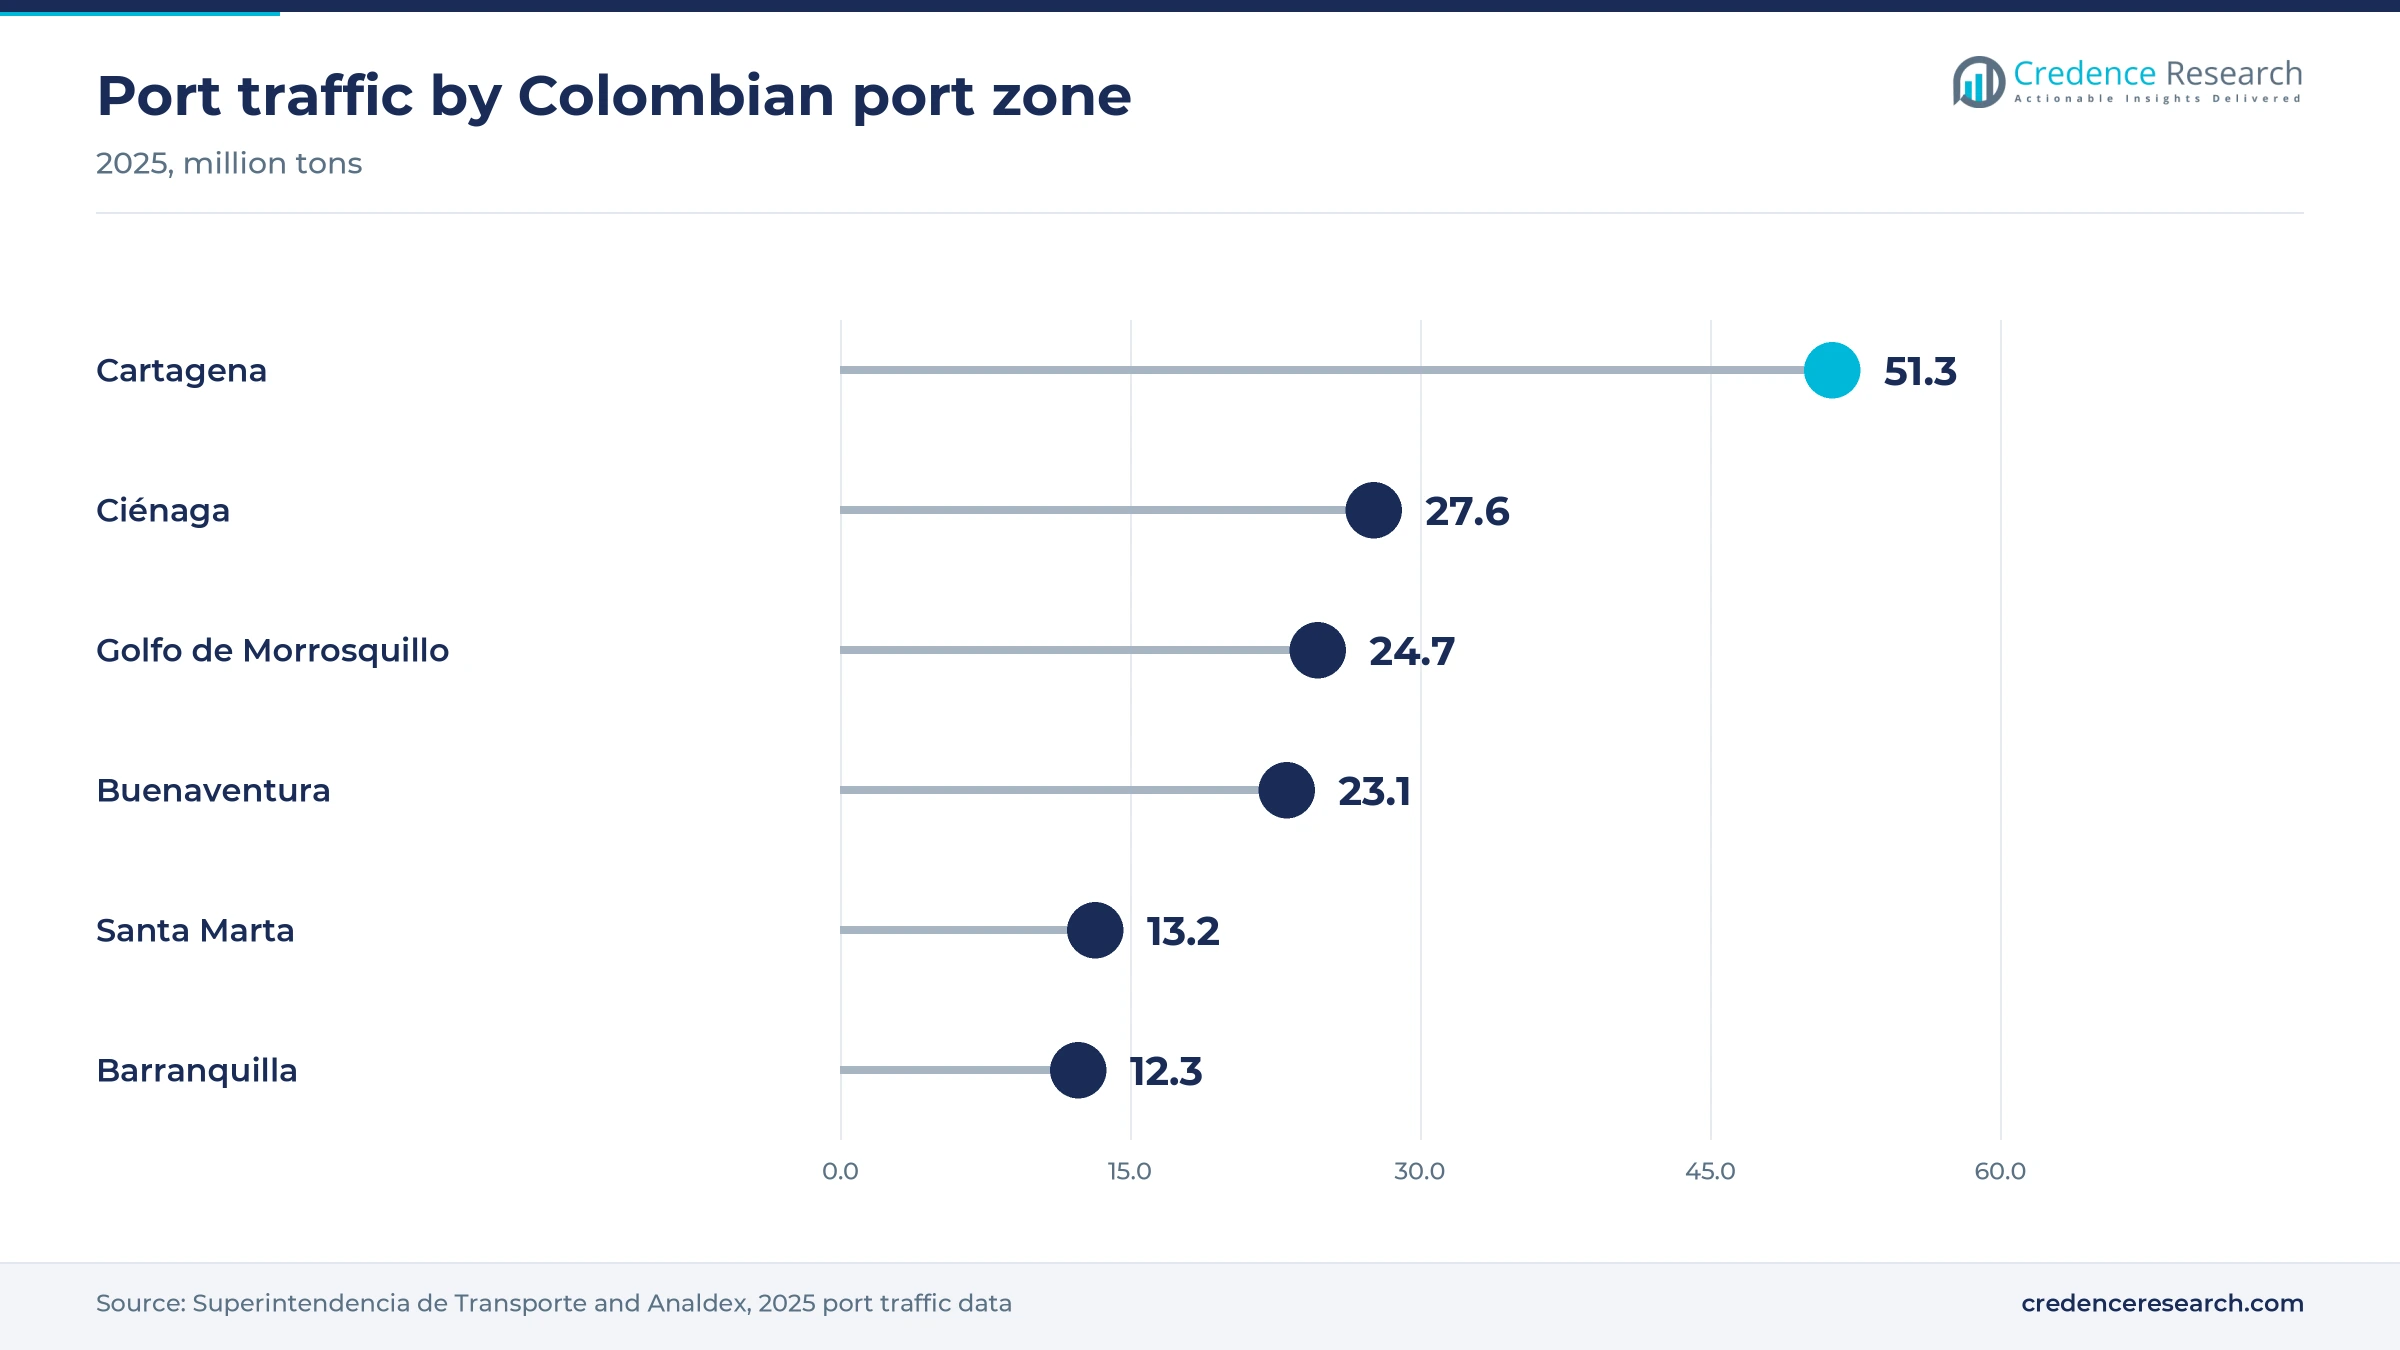
The Caribbean Port Corridor held 27.0% of 2025 value and grows at 6.2% a year, as Cartagena serves as the main container gateway and transshipment hub. Cartagena moved 51.3 million tons in 2025, a 29.5% share of national port traffic, according to Supertransporte. Its terminals handled about 4.05 million TEU, around a 65% share of the national total, and about 22.7 million tons of transshipment, according to Analdex. The World Bank reported in June 2024 that Cartagena rose to third place in its container port performance ranking. Barranquilla, Santa Marta and Ciénaga add bulk, coal and general cargo flows.
A new Caribbean port shortens Antioquia trade routes
Antioquia-Medellín held 17.0% of 2025 value and grows at 6.5% a year, faster than the national pace, as the region gains its own Caribbean port. Antioquia produced 15.0% of 2025 national GDP, according to DANE. José María Córdova airport in Rionegro handled 132,158 tons of cargo in 2025, according to La República. A truck can now cover the Medellín to Turbo route in about seven hours and return the same day, Portafolio reported in December 2025.
Container imports through Buenaventura drive the fastest growth
The Pacific-Buenaventura Corridor held 12.0% of 2025 value and grows fastest at 7.0% a year, because Buenaventura is the main Pacific gateway for container imports. The port moved 23.1 million tons in 2025, up 11.8%, and about 1.70 million TEU, up 21.6%, according to Analdex. Imports made up 87.3% of its volume, led by yellow maize, wheat and soybean cake, according to the Cali Chamber of Commerce. Inland trucking demand to Cali and Bogotá rises with every additional import container.
Valle del Cauca leads road cargo origins and destinations
The Southwest-Cali Corridor held 12.0% of 2025 value and grows at 5.7% a year, slower than the Pacific port zone because more of its freight is domestic. Valle del Cauca produced 9.8% of 2025 national GDP, according to DANE. The department ranked first as both origin and destination of road cargo in 2025, according to the Ministry of Transport. Alfonso Bonilla Aragón airport in Cali handled 24,032 tons of cargo, serving sugar, food and consumer goods shippers.
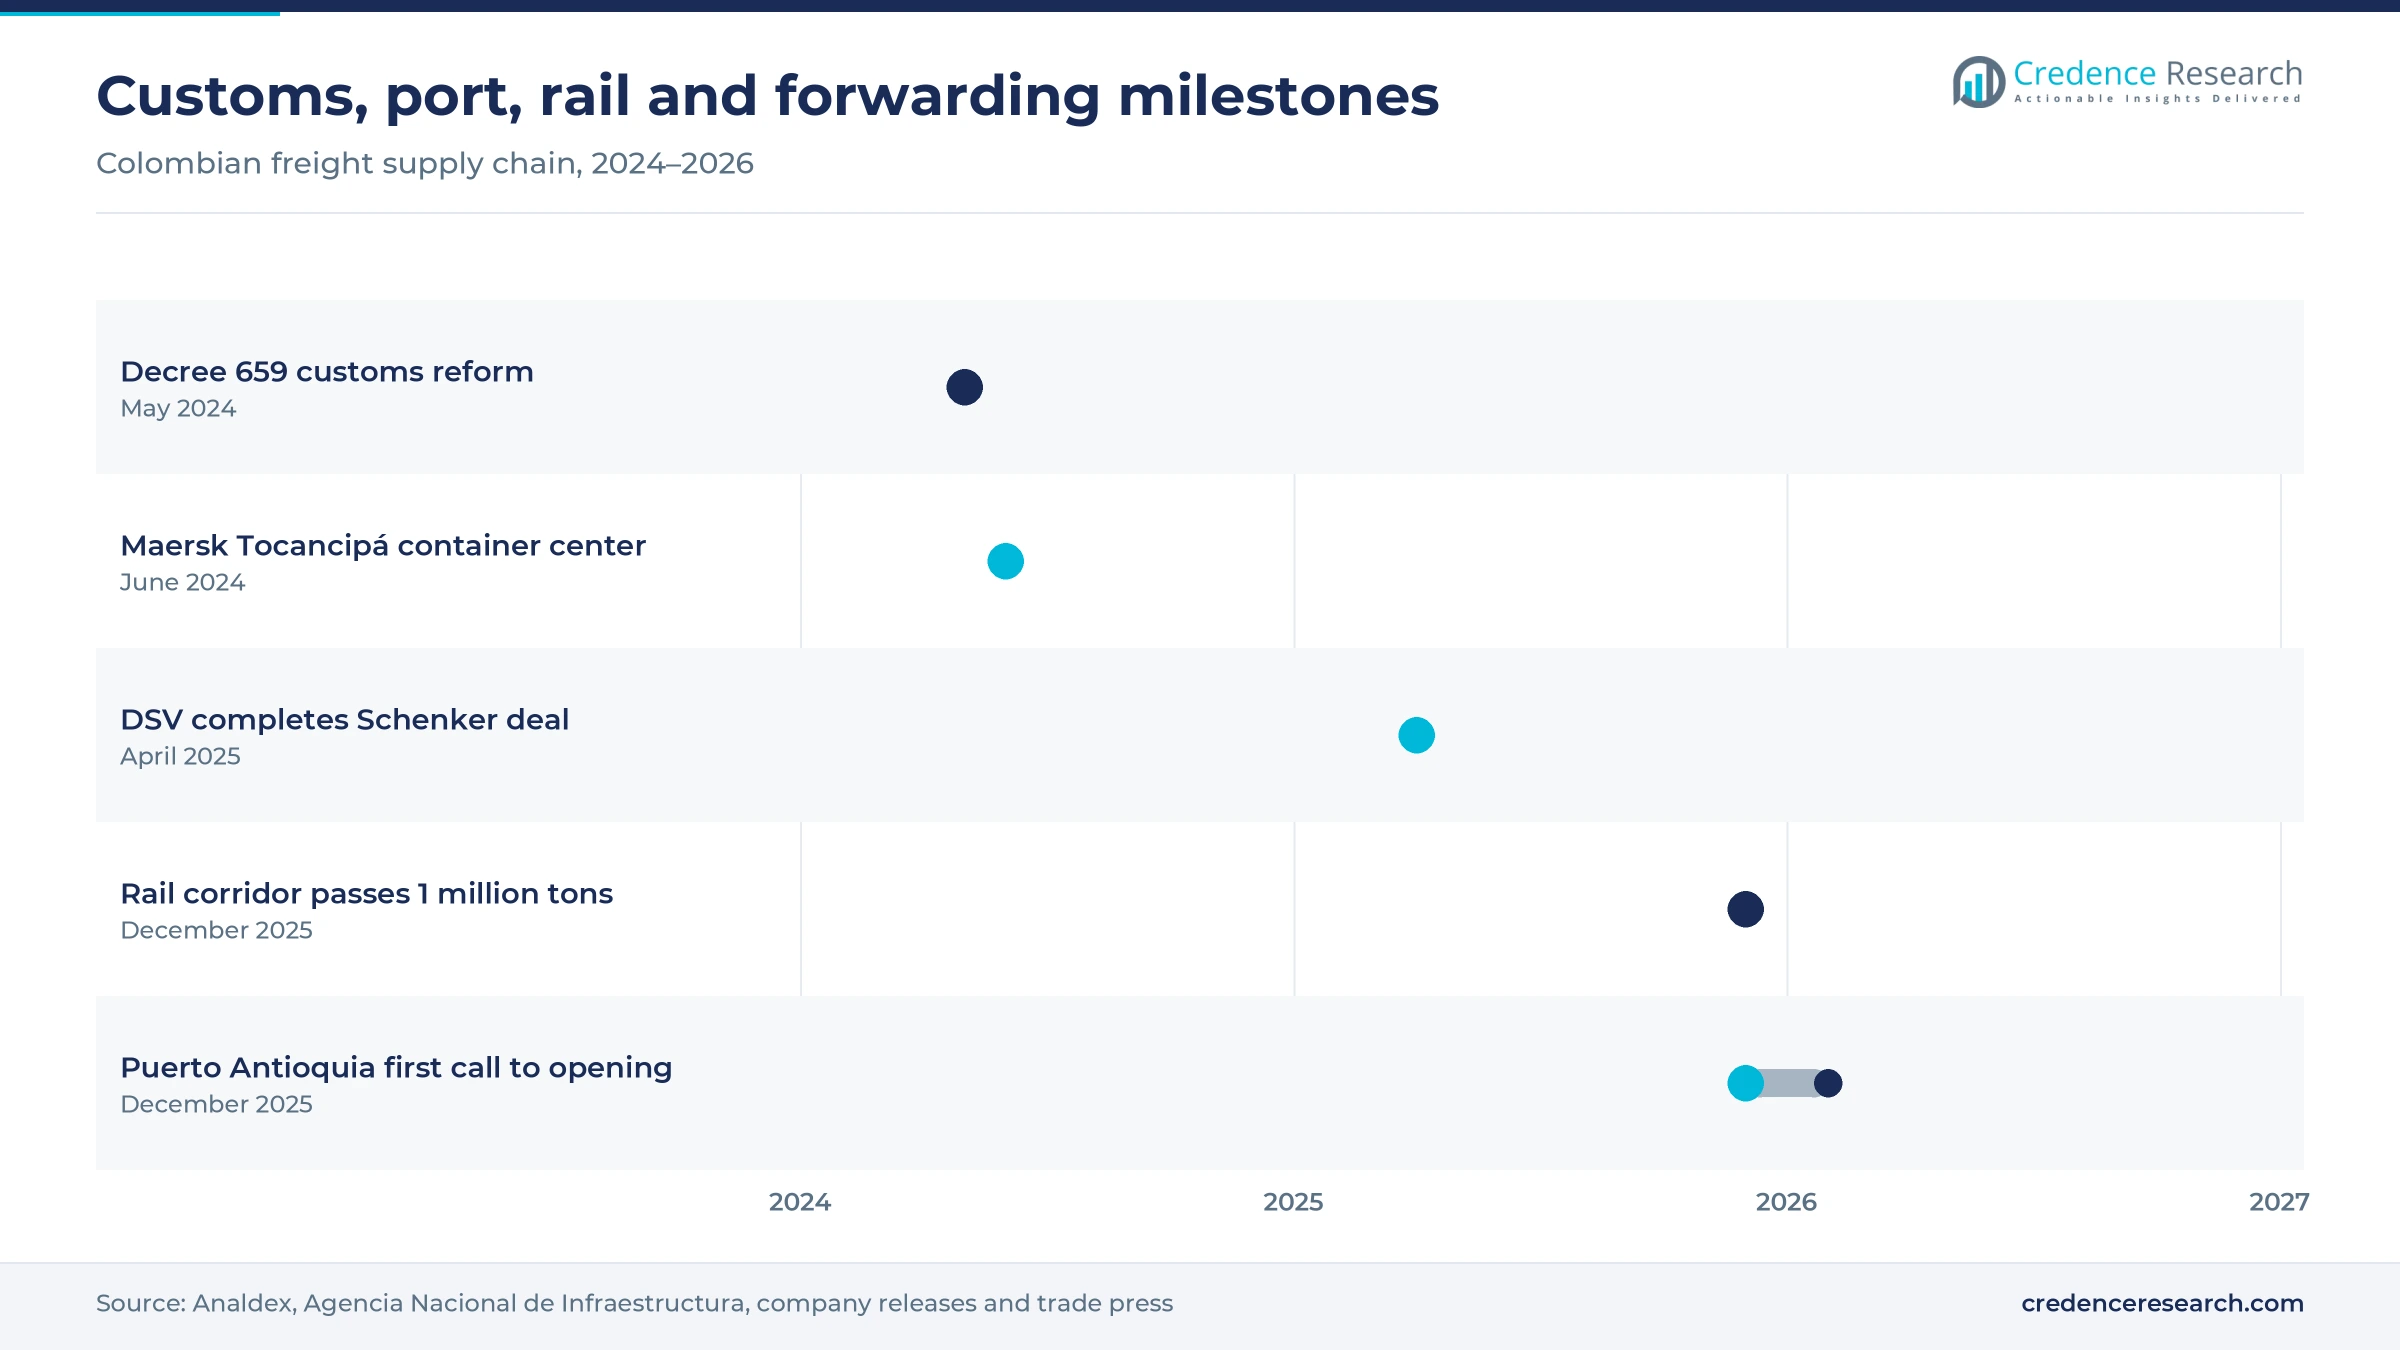
Port, rail and forwarding moves, 2024–2026
| Development | Status and market relevance |
|---|---|
| In June 2024, Maersk opened a container logistics center in Tocancipá, near Bogotá, with room for up to 1,600 containers. | Inland yard and warehouse for import cargo |
| In April 2025, DSV completed its acquisition of Schenker, closing the deal on April 30, 2025. | Combined forwarding networks in Colombia |
| In September 2025, Coordinadora added more than 155 vehicles, lifting its fleet to about 1,300 ahead of the peak season. | Largest fleet investment in its history |
| In December 2025, the Agencia Nacional de Infraestructura reported more than 1 million tons carried on the La Dorada to Chiriguaná rail corridor. | First time the corridor passed 1 million tons |
| In February 2026, Puerto Antioquia formally began operating in Turbo after CMA CGM made the first regular call in December 2025. | New Caribbean gateway for the Medellín region |
Dispatch registers, tracking and customs systems set pace
- The national cargo dispatch register (RNDC) records every road trip with its manifest, which gives regulators and shippers a shared view of volumes and routes.
- Satellite and GPS tracking lets carriers monitor trucks on corridors with blockade or theft risk and reroute them in real time.
- Transport management software matches loads with trucks and plans backhauls, which reduces empty kilometers for fleets that pay rising diesel costs.
- Electronic customs declarations allow importers to file before cargo arrives under the new customs rules, which shortens dwell time at ports and airports.
- Warehouse management systems track inventory and orders in fulfillment centers, so parcel networks can serve online retail clients at peak season.
Need a Custom Version of This Report?
Tailor the scope, geography, or segments to your exact requirements.
- Custom geography or segment scope
- Direct access to our analyst team
Parcel networks and global forwarders split the market
Competition in the Colombia freight and logistics market splits between national networks that own the domestic last mile and global forwarders that control international lanes. The MinTIC postal bulletin counted 12.8 million express shipments for Inter Rapidísimo in the first quarter of 2026, against 6.6 million for Coordinadora and 5.9 million for Servientrega. TCC adds parcel, freight and warehousing services, while Coltanques moves more than 7 million tons a year with over 1,384 trucks, according to La Nota Económica. DSV completed its acquisition of Schenker in April 2025, DHL Global Forwarding strengthened pharmaceutical handling in Bogotá, and Rhenus bought the Colombia-based Blu Logistics. Maersk and CEVA Logistics link ocean shipping with inland yards and warehouses, and forwarders also sell air cargo capacity for exporters and importers. Avianca Cargo carried more than 100,000 tons of flowers from Colombia and Ecuador in 2025, according to Forbes Colombia, which makes it the main air freight option for flower exporters.
Thousands of truckers and a few integrated networks shape supply
Supply in the Colombia freight and logistics market is organized in three layers. At the base, 2,620 cargo companies and more than 166,000 vehicles reported trips in the national dispatch register in 2025, many of them small owner-operators contracted by larger firms. Above them, national networks such as Coordinadora, Servientrega, Inter Rapidísimo and TCC run hubs, offices and fleets. Global forwarders and shipping lines control international lanes and bonded warehouses. Margins sit with firms that own customer contracts, customs licenses and network density, not with the trucks.
Companies profiled and their roles in this market
| Company | Type | Role in the market |
|---|---|---|
| Coordinadora Mercantil | National parcel and freight network | Parcel, freight and logistics services through more than 1,000 offices |
| Servientrega | National parcel network | Express parcel, cash on delivery and logistics services nationwide |
| Inter Rapidísimo | National parcel network | Express parcel network with the most shipments in early 2026 |
| TCC | Integrated logistics provider | Parcel, freight trucking and warehousing, plus electric city delivery trucks |
| DHL Global Forwarding (DHL Group) | Global forwarder | Air and ocean forwarding, with a Bogotá pharmaceutical handling center |
| DSV | Global forwarder | Air and sea forwarding, customs brokerage and contract logistics, now including Schenker |
| A.P. Moller-Maersk | Shipping line and integrator | Ocean shipping plus the Tocancipá container yard and warehouse near Bogotá |
| CEVA Logistics (CMA CGM) | Global forwarder and contract logistics | Forwarding, perishables export handling and multi-client warehousing in Colombia |
| Coltanques | Asset-based road carrier | Dry and liquid cargo trucking with more than 1,384 own vehicles |
| Avianca Cargo (Avianca Group) | Air cargo carrier | Scheduled and charter air freight from Colombia, led by flower exports |
| Rhenus Logistics | Global forwarder | Ocean and air forwarding, customs brokerage and warehousing after buying Blu Logistics |
Imports and parcels will outgrow bulk export cargo
Credence Research's view is that the Colombia freight and logistics market will grow faster than the wider economy, because container imports, online retail and rail reactivation all add services that pay more per ton than bulk exports. Container demand, up 17.2% in TEU terms in 2025, shows where new revenue will come from. Road freight keeps the largest share, but value-added logistics, import forwarding and rail gain from small bases. The Pacific-Buenaventura Corridor should grow fastest, while Bogotá-Cundinamarca keeps the largest share. Winners will combine national delivery networks, customs know-how and inland yards, while managing fuel, security and port-access risks that still keep Colombian logistics costs high.
Road, port and air registers anchor the model
The report uses 2025 as the base year on a calendar basis, and market values come from the Credence Research model. That model combines Ministry of Transport road dispatch data, Superintendencia de Transporte port statistics, air cargo data reported by Analdex, DANE national and departmental accounts and cost indexes, MinTIC postal statistics, World Bank port data and company announcements. Segment splits, corridor shares and corridor growth rates are Credence Research estimates built from cargo volumes and regional output. Sources used are government statistics, international agencies, trade associations, trade press and company releases, and no interviews or surveys were used.
Containers, rail and parcels carry growth to 2035
Freight and logistics revenue in Colombia is expected to reach USD 40.11 billion by 2035, a 6.07% CAGR during 2026–2035, as container imports, parcel volumes and rail freight grow faster than bulk exports. Road haulage stays the largest mode, while intermodal transport gains share where rail links reach the ports. Bogotá-Cundinamarca keeps its lead, while the Pacific corridor and Antioquia gain from new port capacity. Growth would slow if blockades and fuel costs rose sharply, while faster rail and port projects would lift the forecast toward the upside case.
Import growth and road security set the range of outcomes
In the base case, revenue grows from the 2026 value along the central forecast as container imports, parcels and rail volumes keep their recent pace. The downside case assumes more road blockades, weaker consumer spending and further diesel increases that freight rates cannot pass on, a risk shown by the 700 road blockades that stalled freight demand in 2025. The upside case adds faster rail growth, a quick ramp-up at Puerto Antioquia and better access to Buenaventura.
| Scenario | CAGR, 2026–2035 | Value, 2035 | What has to hold |
|---|---|---|---|
| Downside | 4.6% | USD 35.28 billion | Blockades rise, consumer spending weakens and fuel costs outpace freight rates |
| Base | 6.07% | USD 40.11 billion | Container imports, parcels and rail volumes keep their recent pace |
| Upside | 7.4% | USD 44.75 billion | Rail volumes, Puerto Antioquia and Buenaventura access all improve faster than planned |
Frequently Asked Questions
How big is the Colombia freight and logistics market?
Which service type leads Colombian logistics spending?
Which region holds the largest share of the market?
How fast is container traffic growing in Colombia?
What role does rail play in Colombian freight?
How does online retail affect logistics demand?
Who are the main companies in this market?
What are the main challenges for logistics providers?
Table of Content
Chapter 1 Market Segmentation
- 1.1 Segmentation Framework
- 1.1.1 Product and Service Classification
- 1.1.2 Application and End-Use Classification
- 1.1.3 Technology and Solution Classification
- 1.1.4 Customer and Distribution Channel Classification
- 1.1.5 Geographic Segmentation
- 1.1.6 Market Segment Definitions and Boundaries
- 1.2 By Service Type
- 1.2.1 Freight Transportation
- 1.2.2 Freight Forwarding
- 1.2.3 Contract Logistics
- 1.2.4 Customs Brokerage and Trade Compliance
- 1.2.5 Value-Added Logistics
- 1.3 By Mode of Transport
- 1.3.1 Road Freight
- 1.3.2 Maritime Freight
- 1.3.3 Air Freight
- 1.3.4 Rail Freight
- 1.4 By Shipment Flow
- 1.4.1 Domestic Inland Freight
- 1.4.2 Export Freight
- 1.4.3 Import Freight
- 1.4.4 Transit and Transshipment
- 1.5 By End-Use Industry
- 1.5.1 Wholesale and Retail Trade
- 1.5.2 Manufacturing
- 1.5.3 Agriculture and Food
- 1.5.4 Mining and Energy
- 1.5.5 Construction and Infrastructure
Chapter 2 Introduction
- 2.1 Report Objectives and Scope
- 2.2 Product Definition and Industry Terminology
- 2.3 Market Inclusions and Exclusions
- 2.4 Research Process
- 2.4.1 Primary Research and Expert Interviews
- 2.4.2 Secondary Research and Source Review
- 2.4.3 Top-Down and Bottom-Up Estimation
- 2.4.4 Data Triangulation and Verification
- 2.5 Market Size Measurement Basis
- 2.5.1 2025: USD 22.17 billion → 2035: USD 40.11 billion
- 2.6 Historical and Forecast Reference Periods
- 2.6.1 Historical Period: 2018-2025
- 2.6.2 Base Year: 2025
- 2.6.3 Forecast Period: 2025-2035
- 2.7 Research Assumptions and Limitations
Chapter 3 Executive Summary
- 3.1 Market Snapshot and Key Findings
- 3.2 Base-Year Market Size, 2025
- 3.3 Forecast Market Size, 2035
- 3.4 Revenue and Volume Growth Outlook
- 3.5 Key Demand and Supply Indicators
- 3.6 Leading Market Segments
- 3.7 Fastest-Growing Market Opportunities
- 3.8 Regional Performance Highlights
- 3.9 Technology and Industry Transformation
- 3.10 Competitive Landscape Summary
- 3.11 Analyst View and Strategic Implications
Chapter 4 Colombia Freight and Logistics Market Trends and Developments
- 4.1 Historical Industry Development, 2018-2025
- 4.2 Recent Market Trends and Developments
- 4.3 Demand and Customer Behavior Trends
- 4.4 Technology and Product Innovation
- 4.5 Artificial Intelligence, Automation and Digitalization
- 4.6 Local Manufacturing and Supply Chain Realignment
- 4.7 Industry Partnerships, Mergers and Acquisitions
- 4.8 Sustainability and Circular Economy Developments
- 4.9 Government and Private Sector Investment Trends
- 4.10 Emerging Business Models and Commercialization
- 4.11 Industry Developments and Announcements
Chapter 5 Colombia Freight and Logistics Market Production, Supply and Demand Analysis
- 5.1 Demand Trend and Consumption Analysis, 2018-2025
- 5.2 Demand Forecast, 2025-2035
- 5.3 Production and Output Trend, 2018-2025
- 5.4 Production and Output Forecast, 2025-2035
- 5.5 Installed Capacity and Capacity Utilization
- 5.6 Company-Wise Production Plants and Statistics
- 5.6.1 Installed Production Capacity
- 5.6.2 Actual Production
- 5.6.3 Planned Capacity and Expansion Targets
- 5.7 Supply Chain Structure and Procurement Trends
- 5.8 Supply-Demand Gap and Bottlenecks
- 5.9 Import Dependence and Sourcing Structure
- 5.10 Contract Manufacturing and Outsourcing
- 5.11 Regional Supply and Demand Concentration
Chapter 6 Colombia Freight and Logistics Market Pricing Analysis
- 6.1 Pricing Structure and Measurement
- 6.2 Historical Pricing Trends, 2018-2025
- 6.3 Pricing Outlook, 2025-2035
- 6.4 Average Selling Price and Unit Economics
- 6.5 Pricing by Product and Market Segment
- 6.6 Geographic Pricing Differences
- 6.7 Key Input, Energy, Labor and Logistics Costs
- 6.8 Contract Pricing and Purchasing Models
- 6.9 Pricing Sensitivity and Competitive Positioning
- 6.10 Price, Margin and Profitability Implications
Chapter 7 Colombia Freight and Logistics Market Dynamics
- 7.1 Market Growth Drivers
- 7.1.1 Demand-Side Drivers
- 7.1.2 Technology and Innovation Drivers
- 7.1.3 Infrastructure and Investment Drivers
- 7.1.4 Regulatory and Policy Drivers
- 7.2 Market Restraints
- 7.2.1 Cost and Affordability Constraints
- 7.2.2 Technology and Adoption Barriers
- 7.2.3 Supply Chain and Operational Constraints
- 7.3 Market Challenges
- 7.3.1 Competitive Pressure and Margin Erosion
- 7.3.2 Skills, Infrastructure and Implementation Gaps
- 7.4 Emerging Market Opportunities
- 7.5 Market Dynamics Impact and Time-Horizon Assessment
Chapter 8 Colombia Freight and Logistics Value Chain Analysis
- 8.1 Industry Value Chain Overview
- 8.2 Upstream Suppliers and Critical Inputs
- 8.3 Technology and Component Providers
- 8.4 Manufacturing or Service Delivery
- 8.5 Distribution, Channel Partners and Integrators
- 8.6 Downstream Applications and End Users
- 8.7 Value Addition and Profit Pools
- 8.8 Vertical Integration and Outsourcing
- 8.9 Supplier Concentration and Risk
- 8.10 Supply Chain Localization and Resilience
Chapter 9 Colombia Freight and Logistics Market Regulations and Policies
- 9.1 Relevant Laws, Standards and Compliance Frameworks
- 9.2 Product, Service, Safety and Quality Requirements
- 9.3 Government Policies, Incentives and Subsidies
- 9.4 Imports, Exports and Trade Barriers
- 9.5 Public Procurement and Local Content Requirements
- 9.6 Environmental and Sustainability Compliance
- 9.7 Upcoming Policy Changes and Market Implications
Chapter 10 Colombia Freight and Logistics Market Hotspots and Opportunities
- 10.1 Market Opportunity Mapping and Growth Hotspots
- 10.2 High-Growth Applications and Customer Groups
- 10.3 Underserved Markets and White-Space Opportunities
- 10.4 Emerging Technology and Product Opportunities
- 10.5 New Capacity and Investment Hotspots
- 10.6 Market Entry and Expansion Opportunities
- 10.7 Distribution and Partnership Opportunities
- 10.8 Near-Term and Long-Term Commercial Potential
- 10.9 Opportunity Attractiveness and Execution Risks
Chapter 11 Colombia Freight and Logistics Market Outlook, 2025-2035
- 11.1 Market Size and Analysis
- 11.1.1 Revenue (Market Measurement: 2025: USD 22.17 billion → 2035: USD 40.11 billion)
- 11.1.2 Market Volume and Quantity Sold
- 11.1.3 Historical Market Size, 2018-2025
- 11.1.4 Base-Year Market Size, 2025
- 11.2 Market Forecast, 2025-2035
- 11.2.1 Revenue Forecast to 2035
- 11.2.2 Volume Forecast to 2035
- 11.2.3 CAGR and Year-on-Year Growth
- 11.2.4 Incremental Revenue Opportunity
- 11.3 Forecast Assumptions and Scenario Analysis
- 11.3.1 Base-Case Forecast
- 11.3.2 Optimistic and Conservative Scenarios
- 11.3.3 Technology, Pricing and Policy Sensitivities
- 11.4 Market Attractiveness and Growth Outlook
Chapter 12 Colombia Freight and Logistics Market Segmentation and Outlook
- 12.1 Segmentation Summary and Market Shares, 2025
- 12.2 Largest and Fastest-Growing Segments
- 12.3 By Service Type - Market Size and Forecast, 2025-2035
- 12.3.1 Segment Definition and Scope
- 12.3.2 Historical Market Size, 2018-2025
- 12.3.3 Revenue Forecast, 2025-2035
- 12.3.4 Volume Forecast, 2025-2035
- 12.3.5 Base-Year Market Share, 2025
- 12.3.6 Segment CAGR and Growth Drivers
- 12.3.7 Subsegment Market Size and Forecast
- 12.3.7.1 Freight Transportation
- 12.3.7.2 Freight Forwarding
- 12.3.7.3 Contract Logistics
- 12.3.7.4 Customs Brokerage and Trade Compliance
- 12.3.7.5 Value-Added Logistics
- 12.3.8 Subsegment Pricing and Adoption Trends
- 12.3.9 Leading Suppliers and Competition
- 12.3.10 Regional Demand and Opportunities
- 12.4 By Mode of Transport - Market Size and Forecast, 2025-2035
- 12.4.1 Segment Definition and Scope
- 12.4.2 Historical Market Size, 2018-2025
- 12.4.3 Revenue Forecast, 2025-2035
- 12.4.4 Volume Forecast, 2025-2035
- 12.4.5 Base-Year Market Share, 2025
- 12.4.6 Segment CAGR and Growth Drivers
- 12.4.7 Subsegment Market Size and Forecast
- 12.4.7.1 Road Freight
- 12.4.7.2 Maritime Freight
- 12.4.7.3 Air Freight
- 12.4.7.4 Rail Freight
- 12.4.8 Subsegment Pricing and Adoption Trends
- 12.4.9 Leading Suppliers and Competition
- 12.4.10 Regional Demand and Opportunities
- 12.5 By Shipment Flow - Market Size and Forecast, 2025-2035
- 12.5.1 Segment Definition and Scope
- 12.5.2 Historical Market Size, 2018-2025
- 12.5.3 Revenue Forecast, 2025-2035
- 12.5.4 Volume Forecast, 2025-2035
- 12.5.5 Base-Year Market Share, 2025
- 12.5.6 Segment CAGR and Growth Drivers
- 12.5.7 Subsegment Market Size and Forecast
- 12.5.7.1 Domestic Inland Freight
- 12.5.7.2 Export Freight
- 12.5.7.3 Import Freight
- 12.5.7.4 Transit and Transshipment
- 12.5.8 Subsegment Pricing and Adoption Trends
- 12.5.9 Leading Suppliers and Competition
- 12.5.10 Regional Demand and Opportunities
- 12.6 By End-Use Industry - Market Size and Forecast, 2025-2035
- 12.6.1 Segment Definition and Scope
- 12.6.2 Historical Market Size, 2018-2025
- 12.6.3 Revenue Forecast, 2025-2035
- 12.6.4 Volume Forecast, 2025-2035
- 12.6.5 Base-Year Market Share, 2025
- 12.6.6 Segment CAGR and Growth Drivers
- 12.6.7 Subsegment Market Size and Forecast
- 12.6.7.1 Wholesale and Retail Trade
- 12.6.7.2 Manufacturing
- 12.6.7.3 Agriculture and Food
- 12.6.7.4 Mining and Energy
- 12.6.7.5 Construction and Infrastructure
- 12.6.8 Subsegment Pricing and Adoption Trends
- 12.6.9 Leading Suppliers and Competition
- 12.6.10 Regional Demand and Opportunities
- 12.7 Segment Growth Comparison
- 12.8 Segment Attractiveness and Priority Matrix
Chapter 13 Colombia Freight and Logistics End-Use and Application Market Outlook
- 13.1 End-Use Industry and Customer Demand Structure
- 13.2 Leading Applications and Customer Groups
- 13.3 End-Use Market Size, Share and Forecast
- 13.4 Major End-Use Industry Deep Dives
- 13.4.1 Customer Requirements and Use Cases
- 13.4.2 Demand and Replacement Cycles
- 13.4.3 Technical and Regulatory Considerations
- 13.4.4 Purchasing and Procurement Models
- 13.4.5 Leading Vendors and Distribution Channels
- 13.4.6 Forecast and Commercial Opportunities
- 13.5 Emerging Applications and Cross-Segment Demand
- 13.6 End-Use Industry Investment Priorities
Chapter 14 Colombia Freight and Logistics Geographic Market Outlook, 2025-2035
- 14.1 Domestic Market Distribution and Demand Clusters
- 14.2 State- or Province-Wise Market Size and Forecast, 2025-2035
- 14.3 City and Metropolitan Market Outlook
- 14.4 Industrial, Manufacturing and Commercial Clusters
- 14.5 Geographic Concentration of Key End Users
- 14.6 Local Pricing and Purchasing Differences
- 14.7 Domestic Production Facilities and Capacity Map
- 14.8 Local Infrastructure and Project Pipeline
- 14.9 State-Level Policy and Incentive Differences
- 14.10 Subnational Investment Hotspots and Opportunities
- 14.11 Distribution and Logistics Networks
- 14.12 Domestic Competitive Footprint
Chapter 15 Colombia Freight and Logistics Technology, Innovation and Sustainability Outlook
- 15.1 Technology Landscape and Maturity
- 15.2 Product, Process and Service Innovation
- 15.3 AI, Automation and Digital Tools in the Industry
- 15.4 Technology Adoption and Performance Benchmarking
- 15.5 Innovation Pipeline and R&D Investment
- 15.6 Patent and Intellectual Property Trends
- 15.7 Energy Efficiency and Resource Management
- 15.8 Sustainability, Recycling and Circularity
- 15.9 Technology Roadmap, 2025-2035
- 15.10 Risks of Obsolescence and Technology Substitution
Chapter 16 Colombia Freight and Logistics Market Key Strategic Imperatives
- 16.1 Growth and Market Entry Priorities
- 16.2 High-Return Products and Segments
- 16.3 Pricing, Profitability and Cost Optimization
- 16.4 Technology Investment and Product Differentiation
- 16.5 Supply Chain Localization and Resilience
- 16.6 Distribution and Customer Acquisition
- 16.7 Partnership, Acquisition and Capacity Strategy
- 16.8 Regional Expansion Priorities
- 16.9 Short-, Medium- and Long-Term Actions
Chapter 17 Competition Outlook
- 17.1 Industry Competition Characteristics
- 17.2 Market Structure and Concentration
- 17.3 Market Share and Competitive Positioning, 2025
- 17.4 Company-Wise Revenue and Product Benchmarking
- 17.5 Production and Service Capacity Benchmarking
- 17.6 Technology, Pricing and Differentiation
- 17.7 Regional Footprint and Distribution Strength
- 17.8 Mergers, Acquisitions and Strategic Alliances
- 17.9 New Entrants and Competitive Threats
- 17.10 Porter's Five Forces and Industry Attractiveness
- 17.11 Competitive Outlook, 2025-2035
Chapter 18 Company Profiles
- 18.1 Company Coverage and Selection Criteria
- 18.2 Coordinadora Mercantil
- 18.2.1 Business Description
- 18.2.2 Company Ownership and Geographic Presence
- 18.2.3 Product and Service Portfolio
- 18.2.4 Manufacturing and Operating Footprint
- 18.2.5 Production Capacity and Expansion Plans
- 18.2.6 Financial Performance and Investment
- 18.2.7 Market Share and Competitive Position
- 18.2.8 Technology and Innovation Capabilities
- 18.2.9 Strategic Alliances or Partnerships
- 18.2.10 Recent Developments
- 18.2.11 Growth Strategy and Outlook
- 18.3 Servientrega
- 18.4 Inter Rapidísimo
- 18.5 TCC
- 18.6 DHL Global Forwarding (DHL Group)
- 18.7 DSV
- 18.8 A.P. Moller-Maersk
- 18.9 CEVA Logistics (CMA CGM)
- 18.10 Coltanques
- 18.11 Avianca Cargo (Avianca Group)
- 18.12 Rhenus Logistics
- 18.13 Other Relevant Market Participants
Note: Every listed company is profiled on the structure shown under the first company. The company list is preliminary and may change based on research findings, market developments, data availability and client requirements.
Chapter 19 Disclaimer
- 19.1 Research and Forecast Disclaimer
- 19.2 Data Source and Estimation Limitations
Note: The depth of individual sections depends on data availability for this market. Volume, capacity, trade and other unit-based metrics are included where applicable.