
Licensing and mine oversight turn disposal into paid work
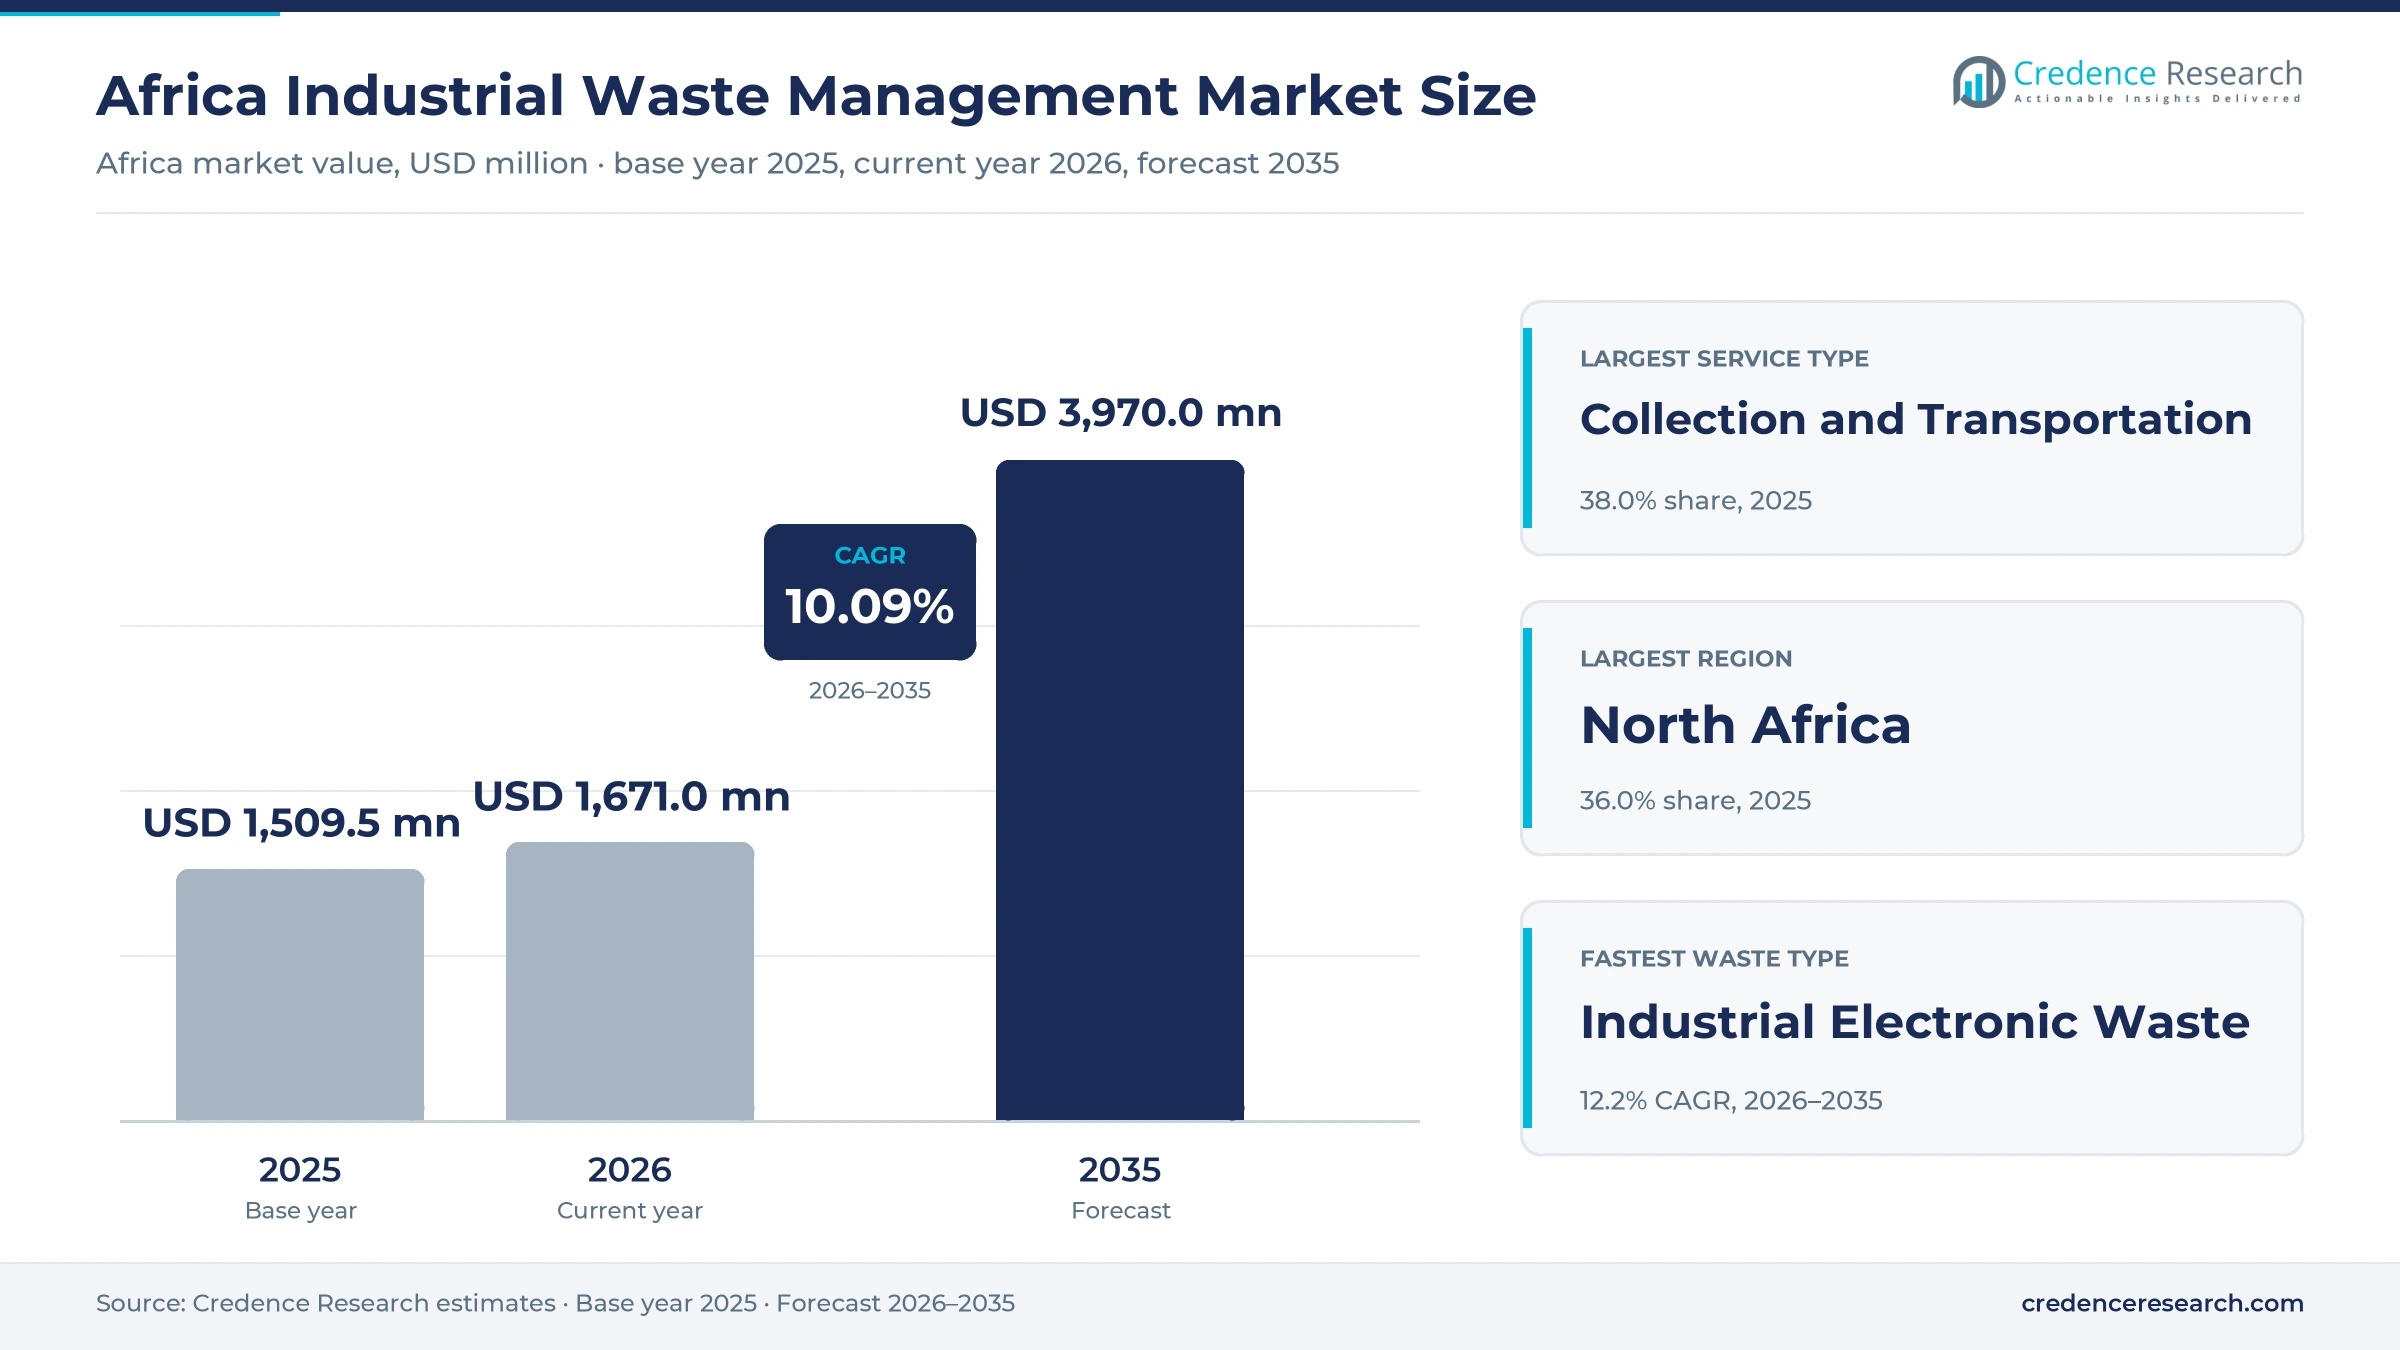
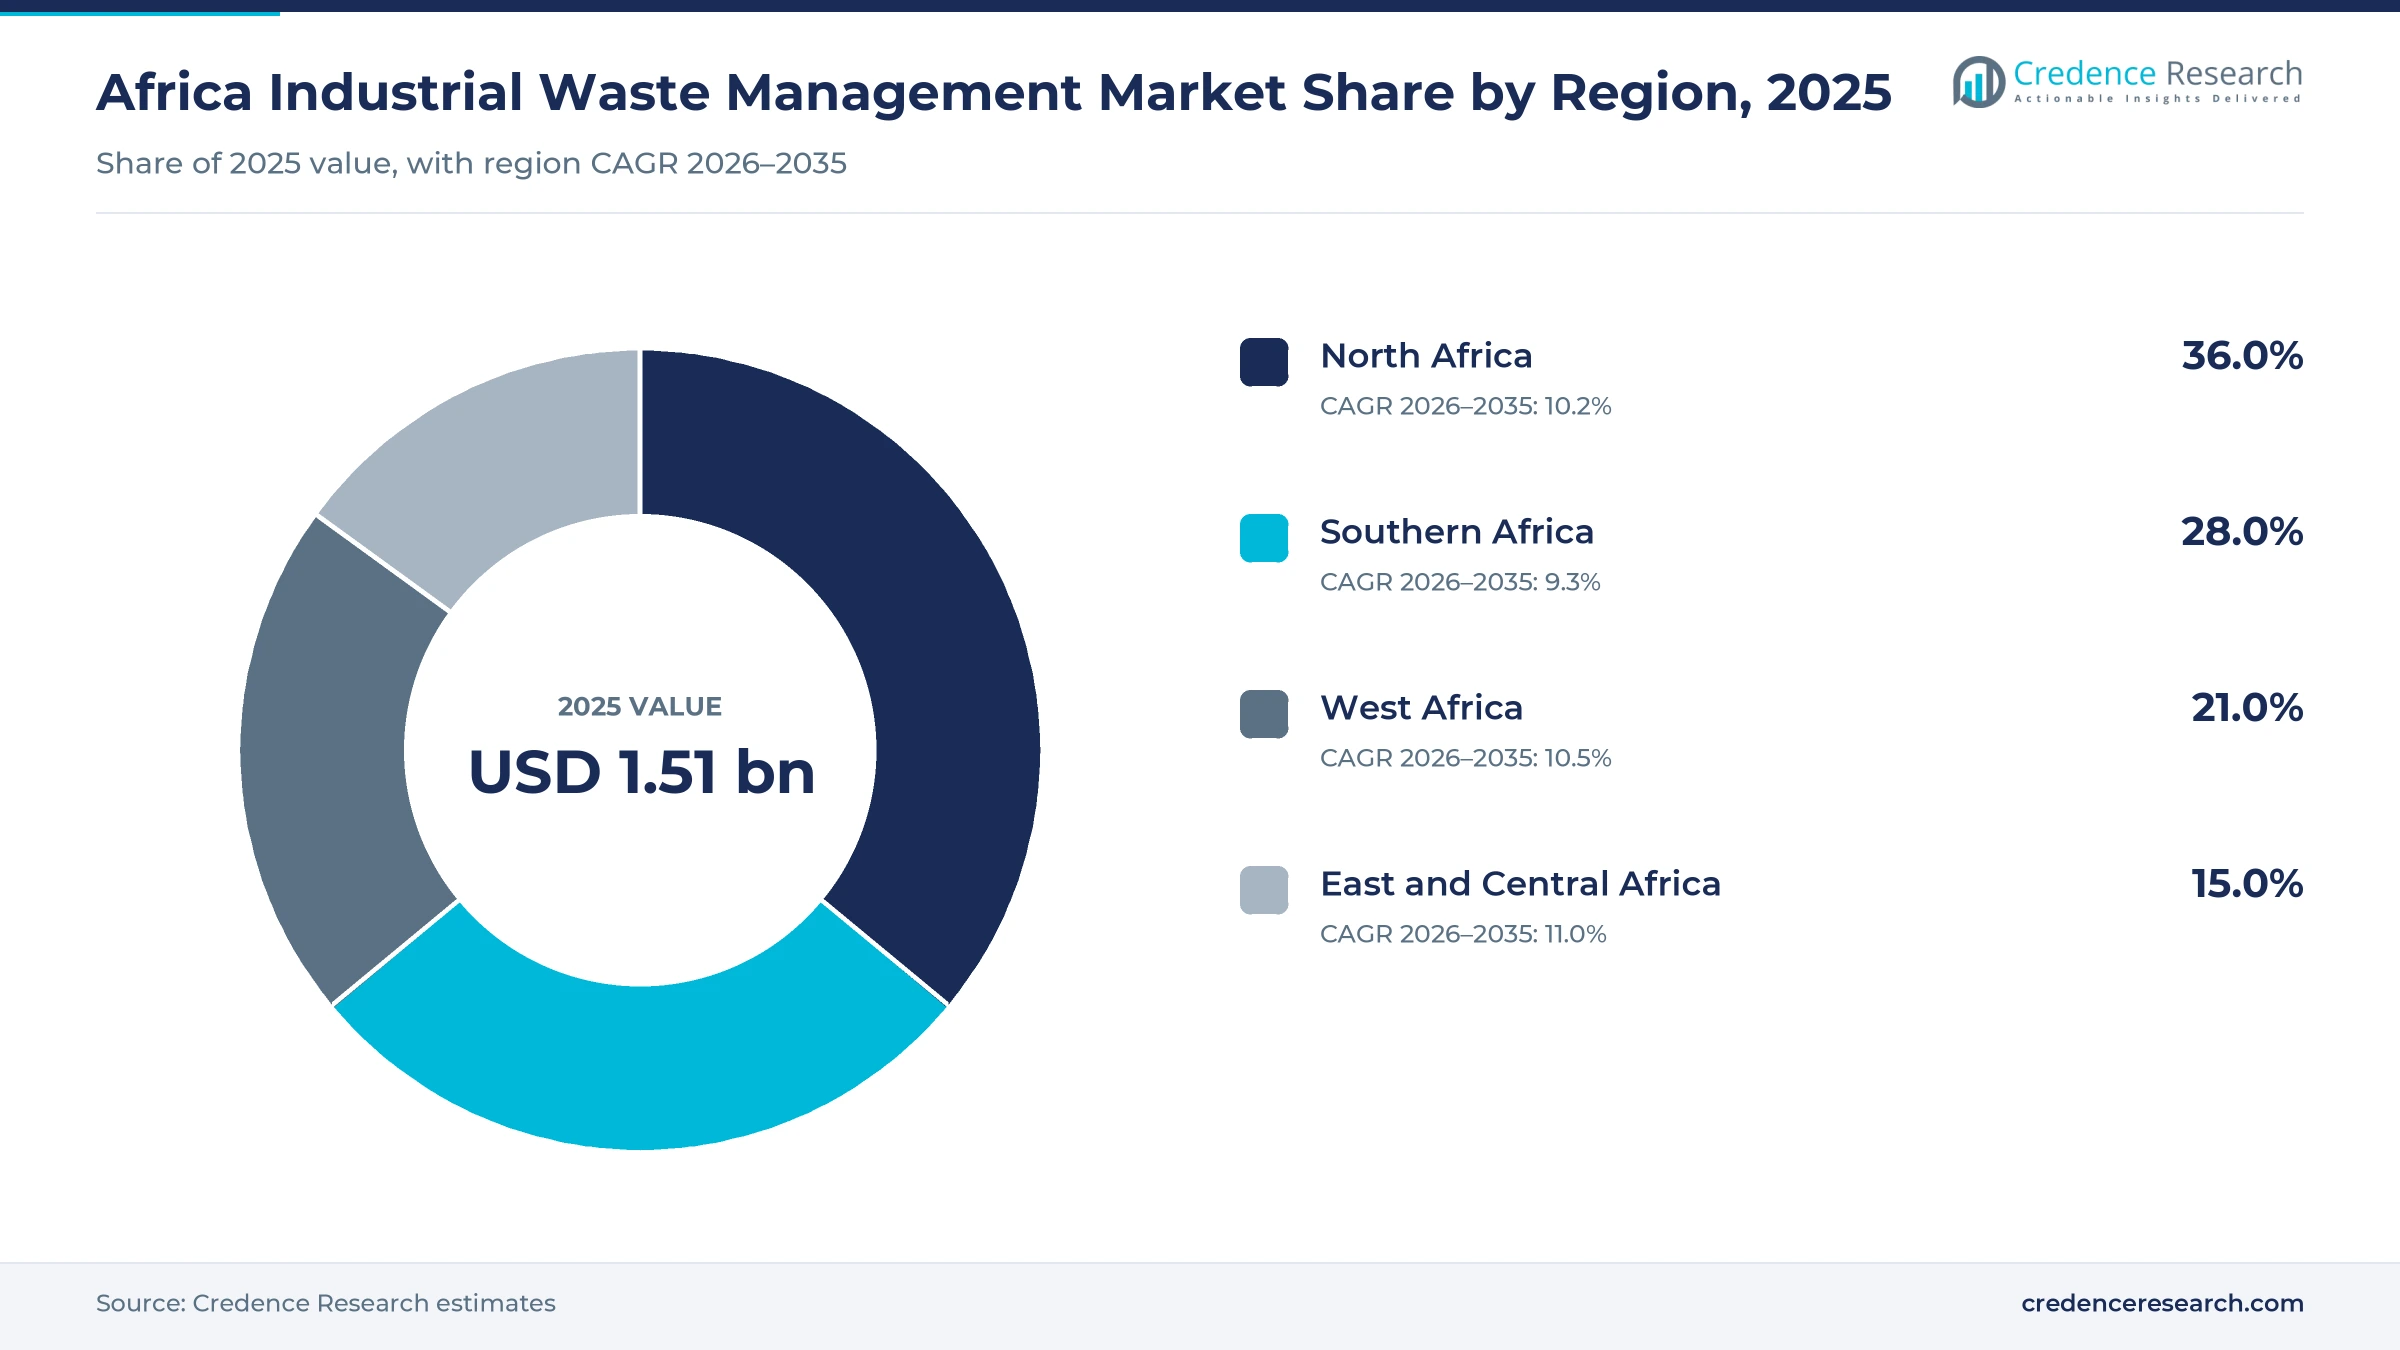
The Africa industrial waste management market was valued at USD 1.51 billion in 2025 and is projected to increase from USD 1.67 billion in 2026 to USD 3.97 billion by 2035, registering a CAGR of 10.09% during 2026–2035. Demand comes from mines, smelters, refineries, chemical and food plants and industrial builders that must classify, move, treat and dispose of their waste under licenses that regulators now enforce more closely. North Africa held the largest regional share, 36.0% in 2025, because Egypt and Morocco combine large cement, fertilizer and manufacturing bases with new waste laws. East and Central Africa is the fastest-growing region at 10.9% a year, as copper and cobalt output in the Democratic Republic of the Congo raises tailings and chemical handling needs. South Africa, the most developed service base, published a draft National Waste Management Strategy 2026 for comment in December 2025, which prioritizes hazardous waste treatment before disposal.
Contracted services from plant gate to final cell set the scope
The market counts fees paid by industrial generators to licensed contractors for collecting and transporting waste, treating and processing it, disposing of residues in engineered cells, and recovering materials or remediating contaminated sites. Buyers pay per ton, per lift, per load or through monthly site contracts, while remediation and plant clean-outs are usually priced per project.
Municipal household collection, medical waste, radioactive waste and wastewater utilities are excluded, as is waste that generators treat with their own staff and equipment. The value chain runs from the generator through collectors and transfer stations to treatment plants, cement kilns, recyclers and hazardous landfills, with regulators issuing the licenses that each step requires.
Africa Industrial Waste Management Market Insights
- The market grows from USD 1.51 billion in 2025 to USD 3.97 billion by 2035, a 10.09% CAGR, as waste laws in Egypt, Kenya and South Africa turn disposal into licensed, paid services.
- North Africa held 36.0% of 2025 value, supported by Egyptian licensing under Law 202 of 2020 and by cement kiln co-processing contracts in Morocco and Egypt.
- Collection and Transportation held 38.0% of 2025 value, because every licensed load must move by permitted vehicle from the plant gate to a treatment or disposal site.
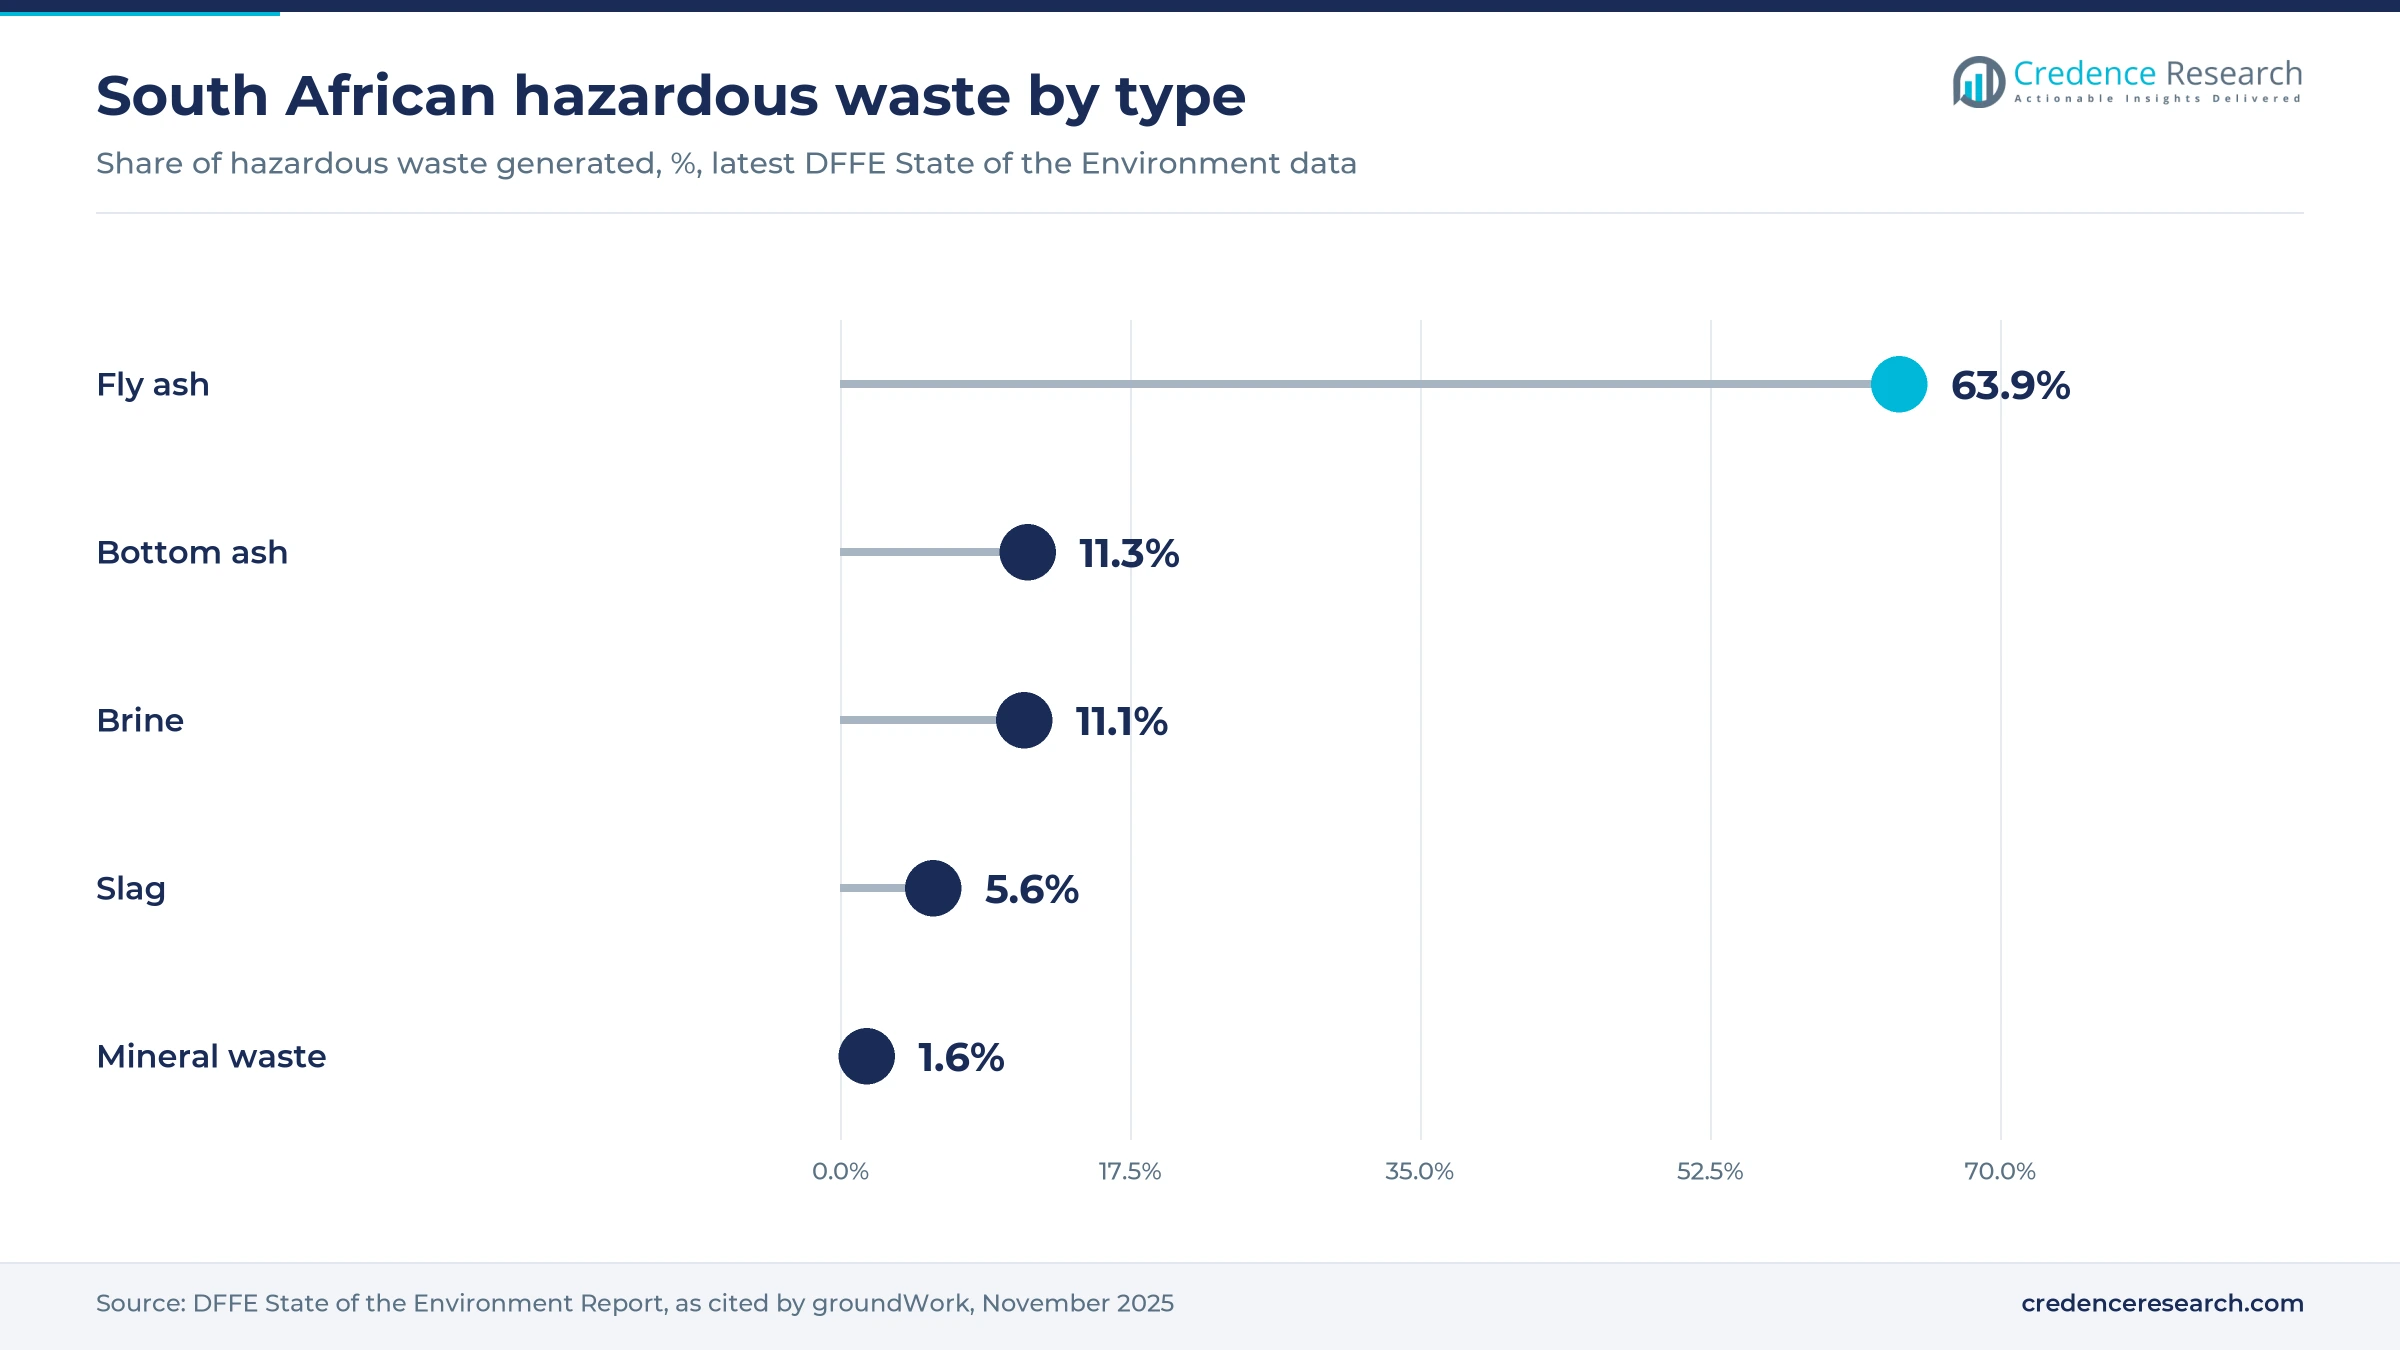
- South Africa still landfilled 92.7% of its hazardous waste according to DFFE data, while its draft 2026 strategy sets a 40% landfill diversion target over five years.
- Nigeria's upstream regulator listed 38 accredited waste treatment companies holding 94 approvals in May 2026, a supplier base built by oil and gas rules.
Collection leads as recovery and e-waste work grow fastest
Collection leads while recovery work grows fastest
Based on service type, the market is categorized into collection and transportation, treatment and processing, secure disposal and recovery and remediation. Collection and Transportation led with 38.0% of 2025 value, because Egypt's Decree 1114 of April 2024 attached monthly integrated waste fees to industrial and commercial establishments, which pulls more generators into licensed collection. Recovery and remediation grows fastest at 12.1% a year, as Morocco's cement producers agreed in 2025 to produce 660,000 tons of alternative fuels from waste. Collection prices should stay competitive, while recovery contracts carry longer terms and higher technical barriers.
General solids lead as electronic scrap grows fastest
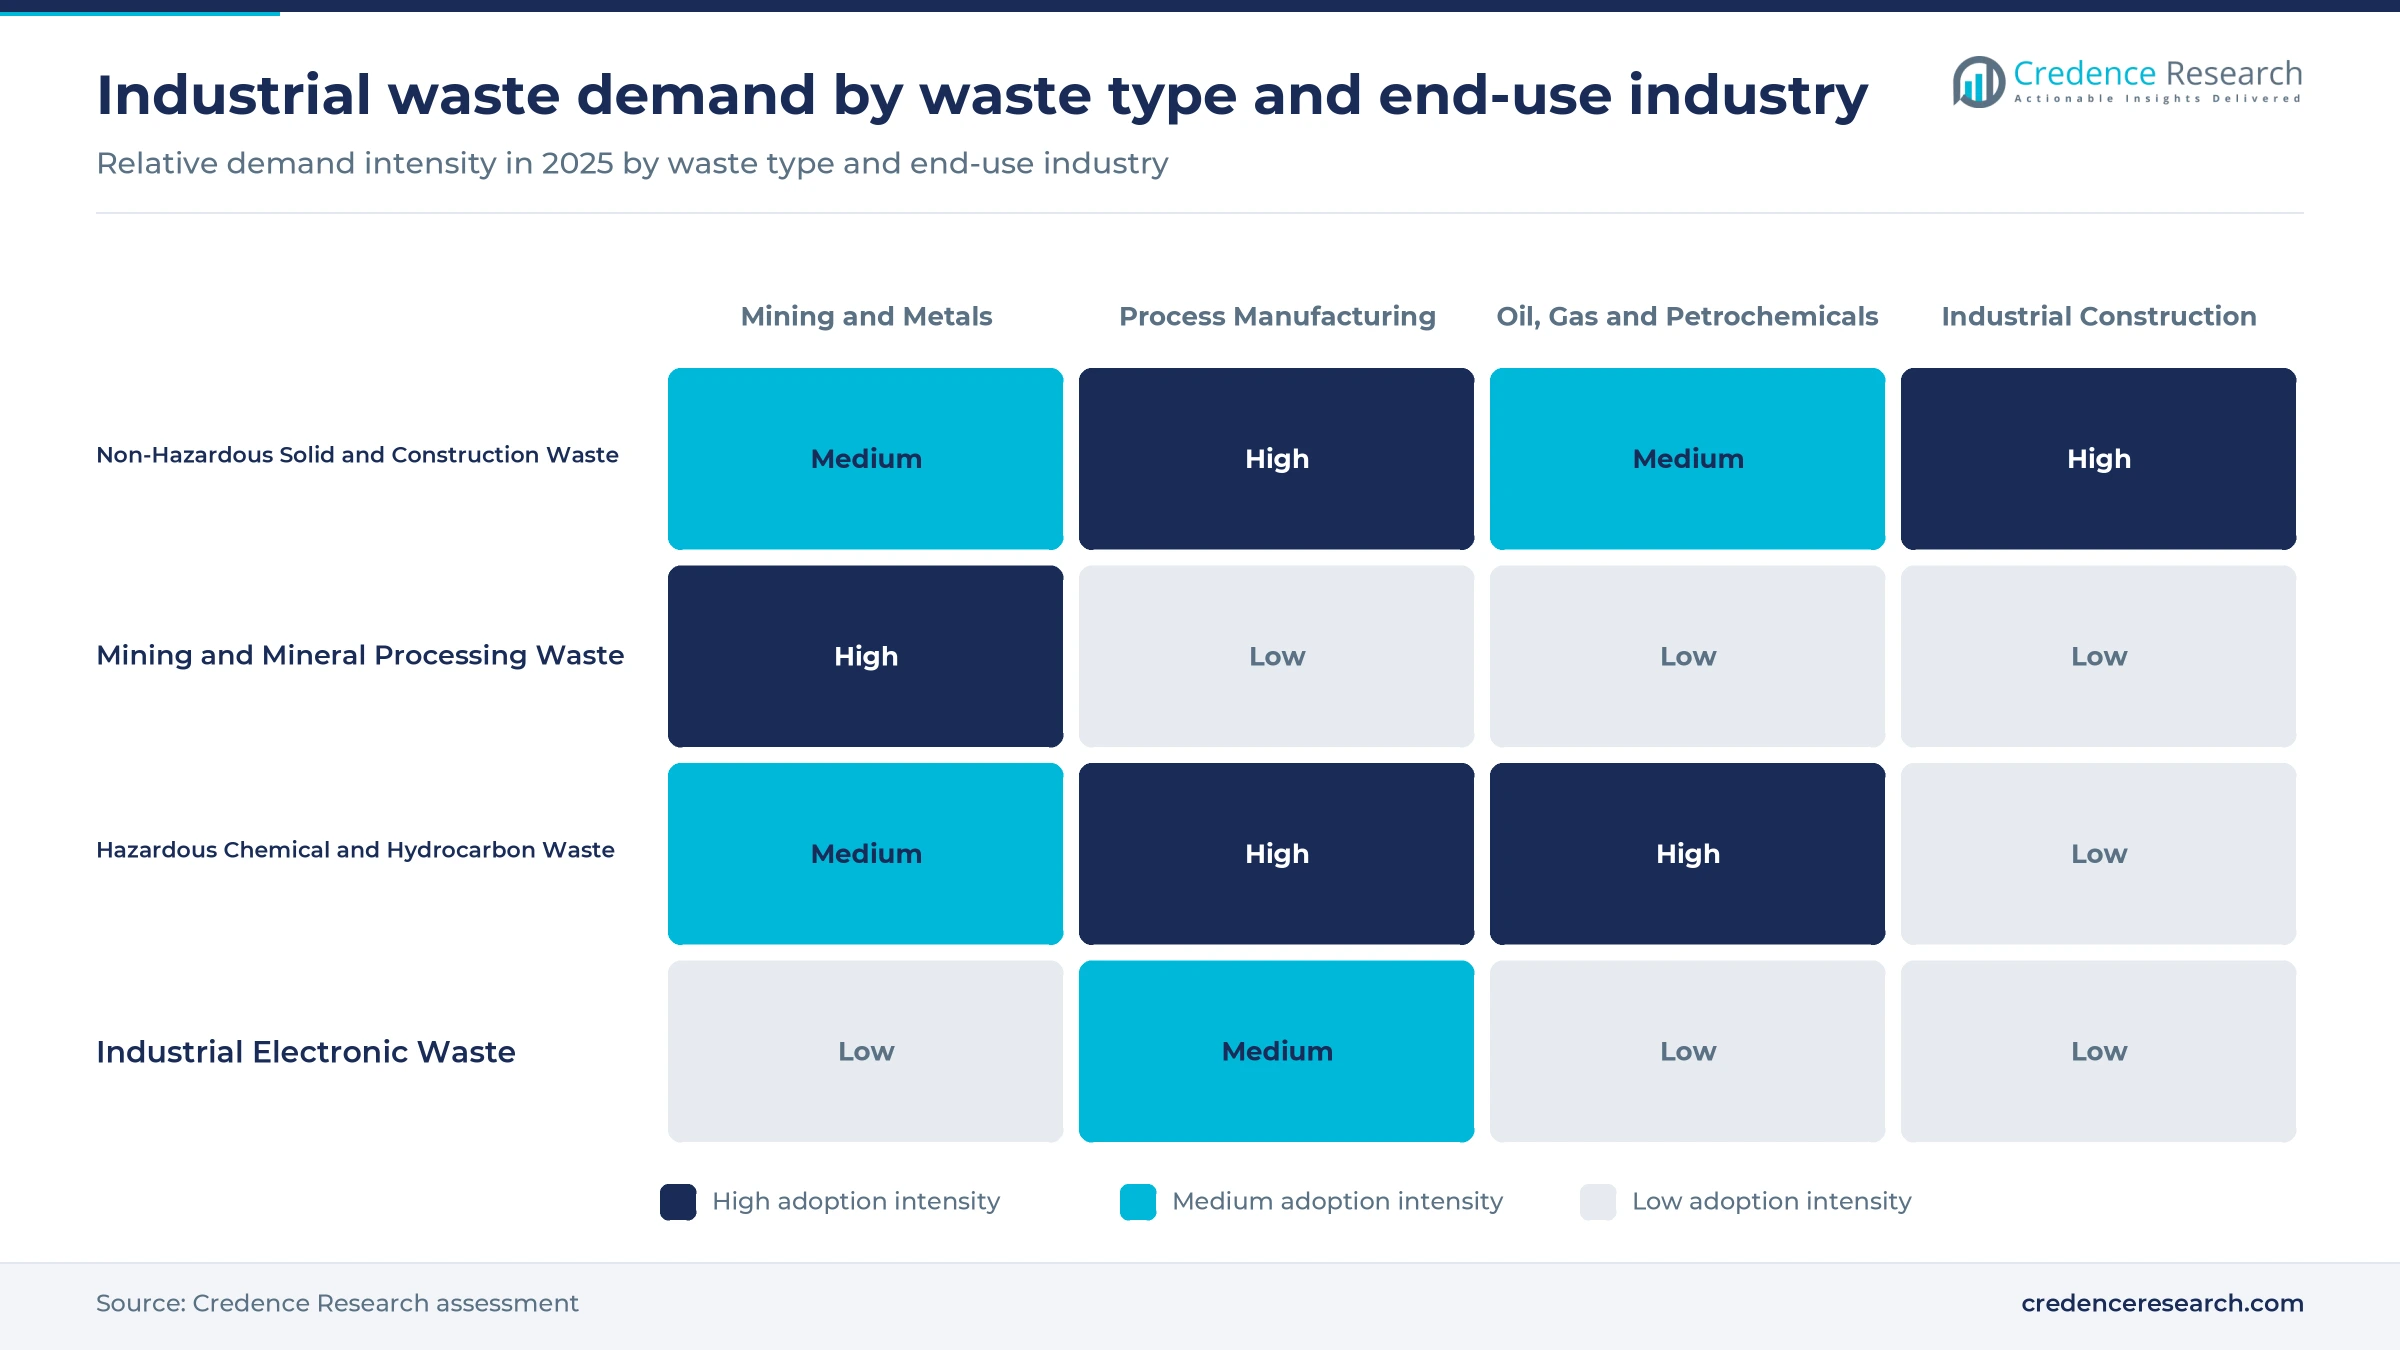
Based on waste type, the market is categorized into non-hazardous solid and construction waste, mining and mineral processing waste, hazardous chemical and hydrocarbon waste, and industrial electronic waste. Non-Hazardous Solid and Construction Waste led with 41.0% of 2025 value, because South Africa generated 107.7 million tons of waste in 2022, of which 49 million tons was hazardous, according to DFFE figures cited by groundWork, leaving the larger tonnage in general streams. Industrial electronic waste grows fastest at 12.2% a year, as South Africa's producer responsibility rules for electrical and lighting products took full effect on Nov. 5, 2021. This favors recyclers that can certify data destruction and metal recovery for corporate clients.
Mining and metals lead while process plants grow fastest
Based on end-use industry, the market is categorized into mining and metals, process manufacturing, oil, gas and petrochemicals, and industrial construction. Mining and Metals led with 34.0% of 2025 value, because gold mining accounts for about 47% of South Africa's mineral waste generation, according to the groundWork review, and tailings oversight has tightened since 2022. Process manufacturing grows fastest at 10.7% a year, as EnviroServ lifted a Western Cape food and beverage client's diversion rate from 20% in June 2025 to 77% by September. Food, chemical and packaging plants are therefore the most likely buyers of new recovery contracts.
Off-site facilities lead as on-site contracts gain share
Based on operating model, the market is categorized into on-site managed services, off-site facility services and mobile and project services. Off-Site Facility Services led with 45.0% of 2025 value, because licensed hazardous cells are scarce and EnviroServ's Holfontein site, described as South Africa's largest hazardous landfill, accepts Type 1 to Type 4 wastes. On-site managed services grow fastest at 10.8% a year, as EnviroServ placed a dedicated sorter on a Western Cape client's site twice a week from June 2025, according to the company. Plants that cut haulage volume at source reduce both disposal fees and transport risk.
| Segment Group | Leading Sub-segment | Share, 2025 | Fastest-growing Sub-segment | CAGR, 2026–2035 |
|---|---|---|---|---|
| By Service Type | Collection and Transportation | 38.0% | Recovery and Remediation | 12.1% |
| By Waste Type | Non-Hazardous Solid and Construction Waste | 41.0% | Industrial Electronic Waste | 12.2% |
| By End-Use Industry | Mining and Metals | 34.0% | Process Manufacturing | 10.7% |
| By Operating Model | Off-Site Facility Services | 45.0% | On-Site Managed Services | 10.8% |
Hazard class sets the per-ton price of disposal
Industrial waste is priced per ton at the weighbridge, per lift for containers and per project for clean-outs and remediation, with a steep premium for hazard class. In Ekurhuleni, trench-and-cover disposal of hazardous liquids costs about seven times the general waste rate, which explains why generators pay contractors to dewater, blend or stabilize waste before it reaches the gate. Haulage distance to licensed cells and kilns adds a large share of delivered cost outside the main industrial hubs. For suppliers, margin sits in the treatment steps that cut the disposal fee rather than in haulage itself.
| Service or benchmark | Typical price or fee | Basis |
|---|---|---|
| General waste disposal, Cape Town | ZAR 758.35 per ton, excluding VAT | City of Cape Town tariff notice, 2026/27 |
| Special hazardous waste disposal, Cape Town | ZAR 1,004.96 per ton, excluding VAT | City of Cape Town tariff notice, 2026/27 |
| General and dry industrial waste, Ekurhuleni | ZAR 421.48 per ton, excluding VAT | City of Ekurhuleni Schedule 5, 2026/27 |
| Hazardous liquids, trench and cover, Ekurhuleni | ZAR 2,892.37 per ton, excluding VAT | City of Ekurhuleni Schedule 5, 2026/27 |
| Hazardous waste disposal approval, Egypt | EGP 200,000 for a one-year approval | WMRA approval page, 2026 |
Request a Free Sample
Fill in your details and we'll send you a free sample report.
- Sample data tables & charts
- Research methodology
Waste laws, mine oversight and recovery goals lift spending
Waste laws turn informal disposal into licensed service
Regulatory formalization is the strongest driver, because each new license, register or fee converts disposal that generators once handled informally into a contracted service. Egypt's Law 202 of 2020 assigned oversight to the Waste Management Regulation Authority, and its hazardous waste disposal approval now costs EGP 200,000 for one year, a threshold that favors established operators. Kenya gazetted extended producer responsibility regulations on Nov. 4, 2024, requiring producers to register with NEMA and importers to pay KES 150 per imported item, according to law firm Cliffe Dekker Hofmeyr. South Africa's draft National Waste Management Strategy 2026 sets a 40% landfill diversion target over five years. Together these rules lift demand for documented collection, treatment and tracking across the largest industrial economies.
Mine residue oversight raises paid tailings work
Mining and process industries generate the heaviest and most technical waste volumes, and regulators have moved from paper compliance to enforcement after high-profile failures. Since the Jagersfontein tailings collapse in September 2022, South Africa's water and mineral departments have increased inspections, issued directives and pursued criminal liability against individuals, Mining Weekly reported in April 2026. In Morocco, OCP is building an inland phosphogypsum storage facility for up to 22 million tons at Jorf Lasfar, a project of about EUR 190 million financed partly by an IFC loan. Ghana's EPA set registration for gold leaching operators from February 2026 in a crackdown on cyanide and acid pollution. Each case adds engineered storage, monitoring and clean-up work that mines buy from specialist contractors.
Buyers procure recovery rather than landfill space
Recovery-oriented procurement is changing what industrial buyers pay for, because plants with zero-waste targets now contract for diversion rates rather than disposal tonnage. Geocycle Maroc announced a contract in April 2024 to manage Nestlé's industrial waste under its zero waste to landfill policy, with co-processing in LafargeHolcim Maroc cement kilns. Morocco's 2025 waste plan includes an agreement with cement producers to cut landfilled waste by 45% by 2030 and produce 660,000 tons of alternative fuels, according to Atalayar. In South Africa, Oricol's Cato Ridge blending plant handles about 1,000 tons a month of kiln fuel, and its technical manager told Mining Weekly in June 2026 that coal substitution of up to 30% is realistic. Recovery contracts therefore raise the value earned on each ton handled.
Nigeria's upstream rules create a licensed treatment base
Oil and gas waste rules in Nigeria add a fourth driver, because upstream operators cannot discharge drilling waste without permits and must send it to approved facilities. The Upstream Petroleum Environmental Regulations 2022 require spent oil-based mud to be reprocessed for reuse and bar its discharge on land or water. The NUPRC approved list for May 2026 named 38 accredited companies with 94 service approvals, including 23 thermal desorption units and 21 drill cuttings treatment approvals. This licensed base gives Nigerian producers and refiners a ready pool of contractors for permitted treatment, and lets accredited firms price on compliance rather than haulage.
Treatment before disposal and on-site contracts gain ground
Shift from landfill toward treatment before disposal
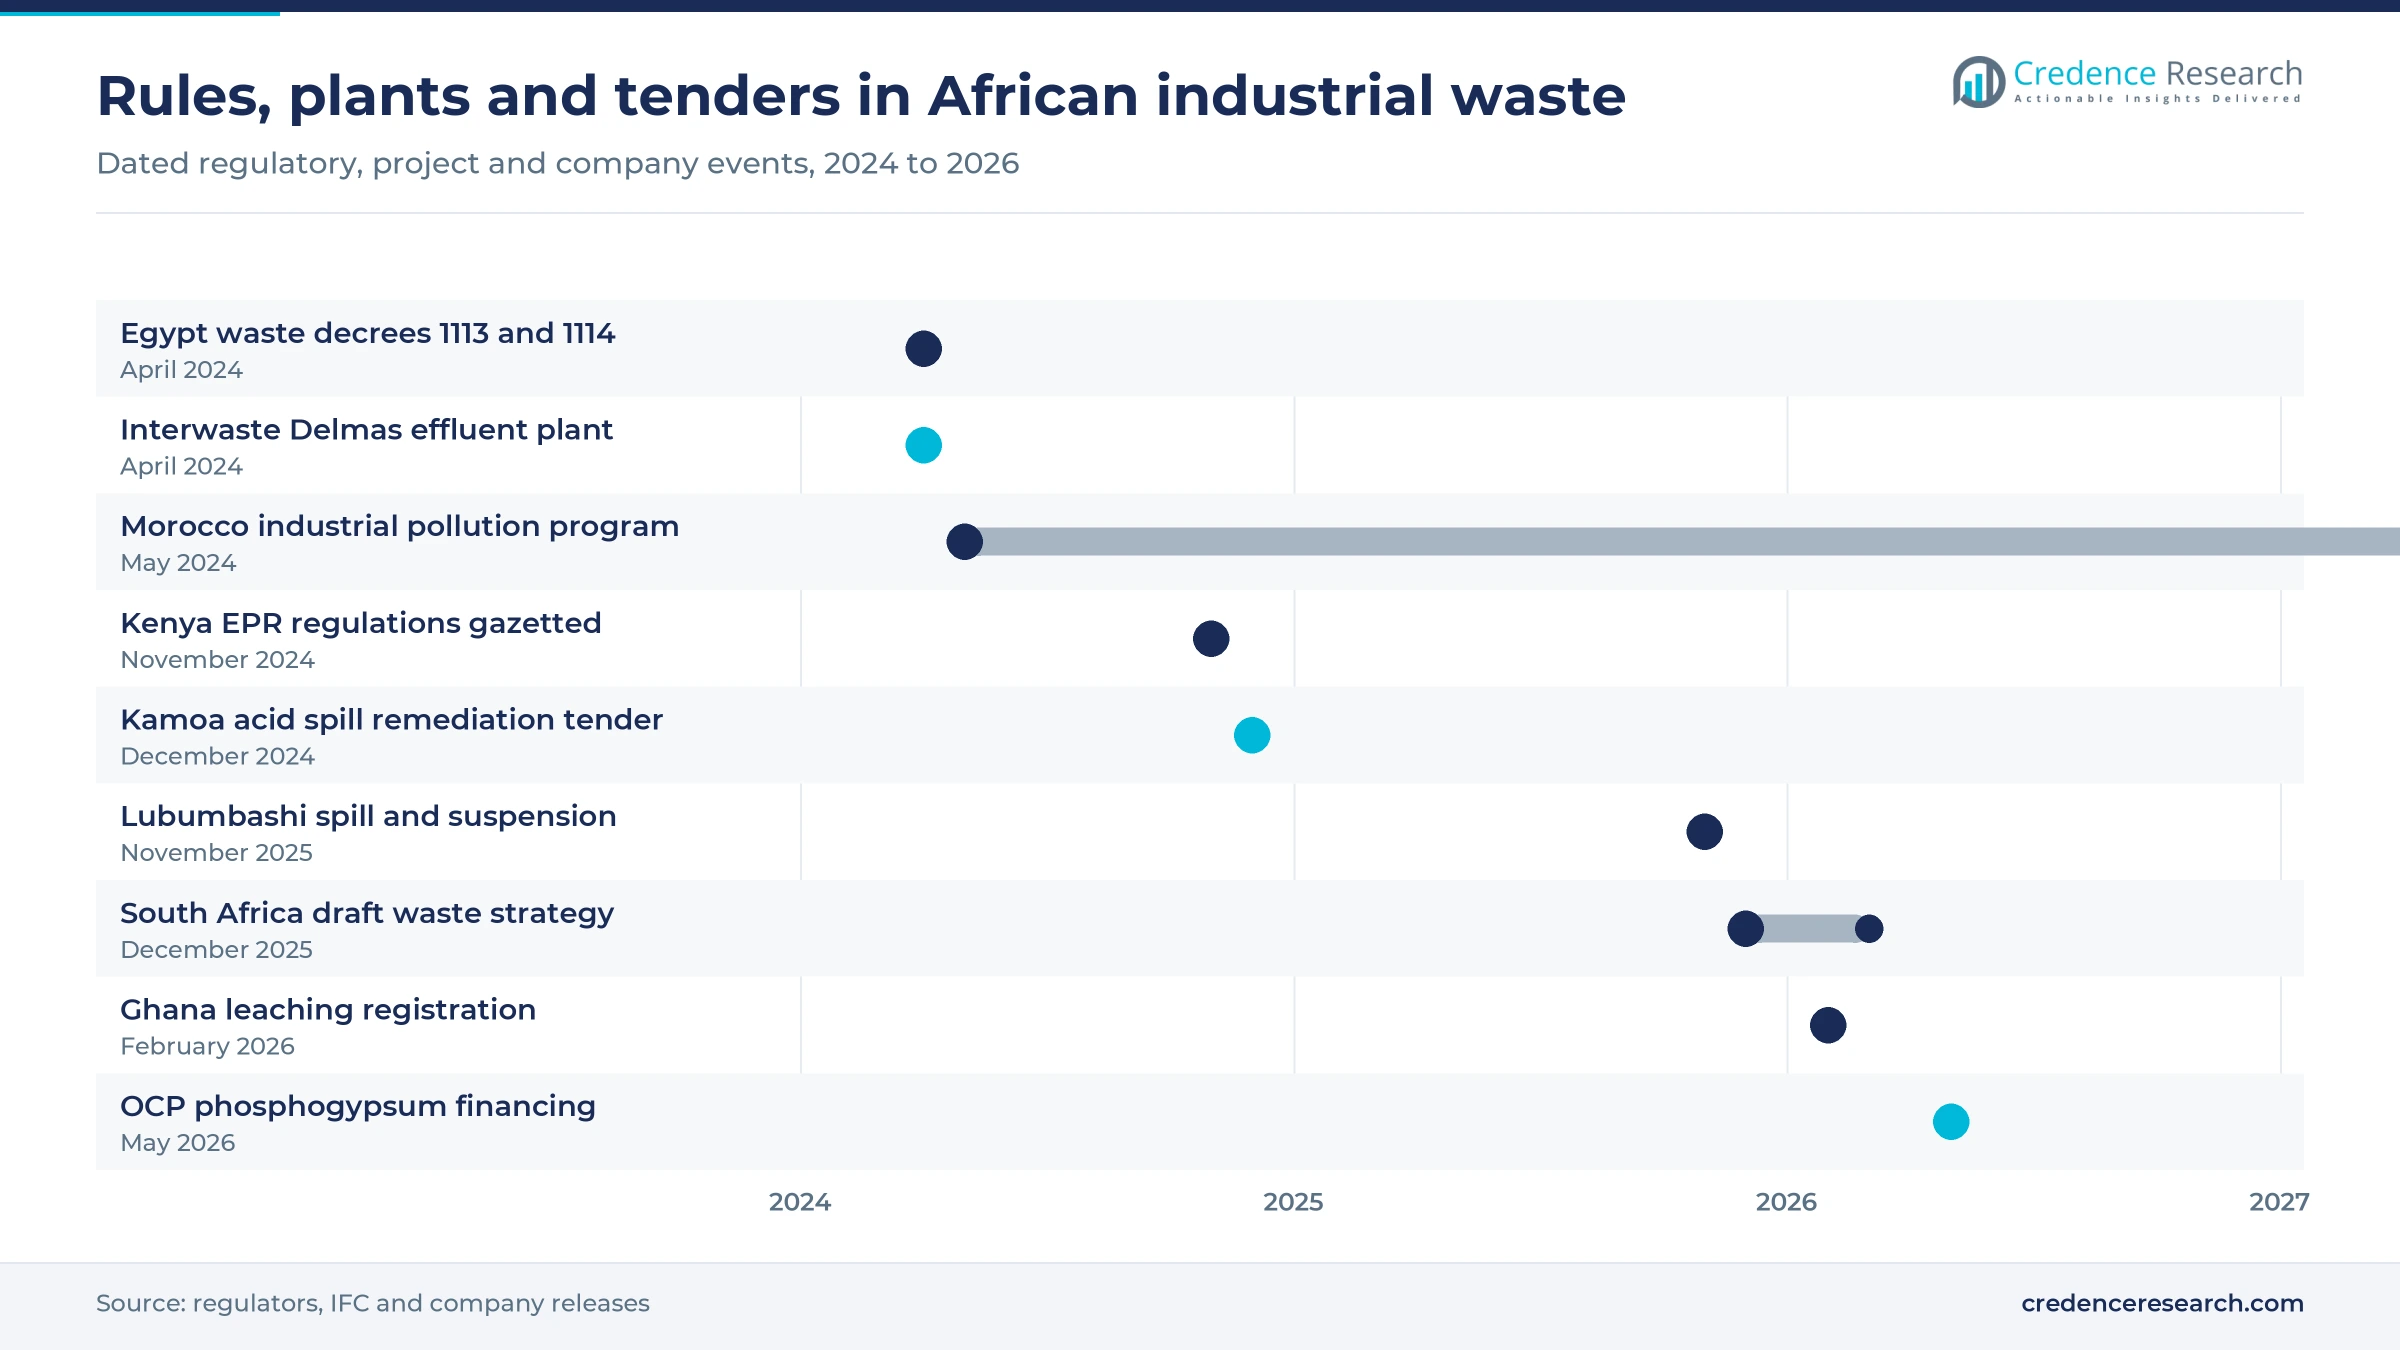
The shift from direct landfill toward treatment before disposal is the clearest trend in Southern Africa, where landfill still dominates hazardous streams. DFFE data presented to Parliament show 92.7% of South Africa's hazardous waste is still landfilled, and Oricol diverted more than 50,000 tons of hazardous waste from landfill across its treatment sites in the year to March 2026. Oricol's Gauteng facility destroys chemical waste and reclaims oils through solvent recovery before residues are disposed of. Interwaste, part of Séché Environnement, opened a ZAR 100 million leachate and effluent treatment plant in Delmas in April 2024 that treats 43 million liters a year. Treatment capacity is becoming the asset that separates leading operators from haulers.
Rise of on-site services at large industrial plants
On-site managed services are rising as generators try to cut haulage volume and landfill exposure before waste leaves the plant. Johannesburg's municipal landfill sites were 95% to 98% full by December 2025, according to Infrastructure News, which raises the cost and risk of off-site disposal. EnviroServ now offers tank and dam cleaning, desludging, vacuum truck work and asbestos removal alongside its landfill, and it tracks loads with digital manifests. Its sludge dewatering service returns up to 75% of reclaimed water to the client, which cuts tonnage before any truck leaves the site. Contractors that place staff and equipment inside the client fence gain longer contracts and better data on waste volumes.
Opening in certified electronic scrap processing
Industrial electronic waste offers a clear opening, because producer levies and take-back duties are creating funded volumes that few licensed plants can process. Ghana's Act 917 requires importers of electrical and electronic equipment to pay an advance eco levy and obliges manufacturers, distributors and wholesalers to take back used equipment for recycling. Ghana's EPA announced in March 2022 that the levy would cover 300 more products, bringing the total to 660, according to the Ghana News Agency. Enviroserve Rwanda's Bugesera plant can recycle 15,000 metric tons of e-waste a year, backed by close to USD 1.5 million from Rwanda's Green Fund. Investors in electronic scrap recycling can follow these levies to secure feedstock.
Opening in mine remediation and pollution programs
Remediation of mining and industrial contamination is the second opening, as miners and governments fund clean-up work that local contractors have rarely priced. Kamoa Copper in the Democratic Republic of the Congo invited expressions of interest on Dec. 9, 2024, for sulfuric acid spillage containment, neutralization and disposal through licensed facilities. Morocco drafted a MAD 19 billion program in May 2024 to prevent and combat industrial pollution through 2035, with a liquid-waste fund that covers up to 40% of company depollution costs. EnviroServ already sells soil rehabilitation and on-site bioremediation in South Africa, according to Infrastructure News in December 2025. Firms that offer environmental remediation services with local partners and certified crews are best placed for these tenders.
Cheap landfill and thin capacity slow the shift to treatment
Cheap landfill gate fees undercut treatment
Low landfill gate fees remain the main barrier to treatment, because generators compare every treatment quote with the cost of a cell. Cape Town charges ZAR 1,004.96 per ton for special hazardous waste in 2026/27, only about a third more than its ZAR 758.35 general waste rate. That narrow gap rarely covers the cost of blending, stabilization or kiln preparation. Treatment operators depend on regulation and buyer targets rather than price signals, and they sell compliance assurance as much as tonnage.
Weak landfill compliance lowers the price floor
Noncompliant disposal sites set an artificial price floor for compliant operators across much of the continent. In 2023 audits, 82.5% of South African landfills did not meet national requirements, according to the groundWork hazardous waste report published in November 2025. Generators that pick the cheapest permitted site face future liability, yet the price gap discourages switching. Compliant operators respond with waste tracking, safe disposal certificates and audits that help buyers defend their choice to regulators and lenders.
Kiln conversion costs slow co-processing contracts
Co-processing growth depends on cement plants that must spend before they can accept waste fuels. In the same June 2026 interview, Oricol's technical manager said that kilns must modify fuel feed systems, which requires significant investment, and that suppliers must commit to large volumes before co-processing starts. Environmental authorizations for co-processing add further lead time before the first load. Waste firms that cannot guarantee steady, specified volumes struggle to sign these contracts, which favors operators tied to cement groups.
Thin licensed capacity outside the main hubs
Licensed capacity outside a few hubs is thin, which leaves miners exposed when containment fails. On Nov. 4, 2025, a containment dam at Congo Dongfang International Mining in Lubumbashi released several million cubic meters of electrolytes, and the country's mines minister said its waste facilities did not meet international standards, Semafor reported. Congolese authorities then suspended the company's operation in the city. Mines in the Copperbelt need contractors that can mobilize engineers and equipment across borders, which raises response costs and insurance requirements.
North Africa leads as East and Central Africa grows fastest
| Region | Value, 2025 (USD billion) | Share, 2025 | CAGR, 2026–2035 |
|---|---|---|---|
| North Africa | 0.54 | 36.0% | 10.2% |
| Southern Africa | 0.42 | 28.0% | 9.2% |
| West Africa | 0.32 | 21.0% | 10.4% |
| East and Central Africa | 0.23 | 15.0% | 10.9% |
North Africa leads on Egyptian licensing and kiln capacity
North Africa held 36.0% of 2025 value and grows at 10.2% a year. Egypt's April 2024 decrees tightened hazardous landfill design, requiring double bottom insulation and leachate collection, and set monthly fees for industrial establishments. Geocycle Egypt opened an alternative fuel plant at the Lafarge cement works near Ain Sokhna in 2019 with 400,000 tons of capacity. In Morocco, the national 2030 waste strategy targets 25% recycling of industrial waste, which lifts regional demand for sorting and recovery contracts. These measures make North Africa the largest pool of paid industrial waste spending.
Southern Africa ranks second with the most permitted hazardous cells
Southern Africa held 28.0% of 2025 value and grows at 9.2% a year, the slowest regional rate. South Africa has the most developed hazardous waste infrastructure on the continent, with Averda managing the Vlakfontein hazardous landfill and EnviroServ running Holfontein. Averda's three-year contract with ArcelorMittal South Africa covers collection, transport and disposal of sludge, tar, oil and wastewater at Vereeniging and Vanderbijlpark. South Africa treated about 2.5 million tons of hazardous waste in 2023, according to SAWIC data cited by groundWork. Growth is slower because existing landfill capacity and municipal gate fees already serve most generators.
West Africa grows on Niger Delta treatment and Ghana rules
West Africa held 21.0% of 2025 value and grows at 10.4% a year. Rivers State accounted for 66 of the 94 upstream waste approvals on the NUPRC list in May 2026, ahead of Akwa Ibom with 12 and Delta with 10, so treatment capacity clusters in the Niger Delta. In Ghana, the EPA set registration and permits for gold leaching operators from February 2026, bringing chemical processing waste into the formal system. Demand outside these hubs still relies on mobile and project crews.
East and Central Africa grows fastest from a small base
East and Central Africa held 15.0% of 2025 value and grows at 10.9% a year, the fastest regional rate. Copper and cobalt mining in the Democratic Republic of the Congo drives demand for acid and tailings handling, as Kamoa Copper's 2024 call for remediation contractors and the Lubumbashi spill of November 2025 both show. Kenya's producer responsibility regulations add registered producer schemes that need collection and recycling partners. Rwanda already operates a dedicated e-waste dismantling plant in Bugesera, which gives the subregion a model for certified processing.
Plants, rules and tenders from 2024 to 2026
| Development | Status and market relevance |
|---|---|
| In April 2024, Interwaste, a Séché Environnement subsidiary, launched a ZAR 100 million leachate and effluent treatment plant in Delmas, Mpumalanga. | Operating; treats leachate and industrial liquid waste |
| In November 2024, Kenya gazetted extended producer responsibility regulations under the Sustainable Waste Management Act of 2022. | In force; producers must register with NEMA |
| In November 2025, Congolese authorities suspended Congo Dongfang International Mining after a dam failure released electrolytes in Lubumbashi. | Suspended; raises containment scrutiny |
| In December 2025, South Africa published the Draft National Waste Management Strategy 2026 for public comment until March 6, 2026. | Draft; prioritizes hazardous waste treatment |
| In May 2026, the IFC approved financing for OCP's inland phosphogypsum storage facility at Jorf Lasfar, Morocco. | Approved; signed May 26, 2026 |
Desorption, kilns and dewatering keep waste out of cells
- Thermal desorption units heat oil-based drill cuttings to separate hydrocarbons, which lets Nigerian operators reprocess spent mud as the upstream rules require.
- Cement kiln co-processing burns blended high-calorific waste as fuel, which replaces part of the coal or gas that a kiln would otherwise burn.
- Leachate and effluent treatment plants clean liquid waste from landfills, mines and factories, which reduces trench disposal of the liquids that carry the highest gate fees.
- Stabilization and micro-encapsulation bind toxic residues into solid forms before landfill, which lets operators meet stricter acceptance rules for hazardous cells.
- Sludge dewatering systems separate solids from water at the client site, which cuts the tonnage hauled and returns reclaimed water to process use.
Need a Custom Version of This Report?
Tailor the scope, geography, or segments to your exact requirements.
- Custom geography or segment scope
- Direct access to our analyst team
Owners of permitted cells and kilns hold the strongest hand
Competition turns on permits, disposal capacity and the ability to treat difficult streams, not on truck fleets. In South Africa, EnviroServ, Interwaste and Averda compete for long-term contracts with mines, steelmakers, refineries and chemical plants, and each links collection to its own landfill or treatment site, which locks in tonnage. Veolia Southern Africa extended its industrial waste business by acquiring DCLM in 2019, and Oricol competes on blending hazardous waste into kiln fuel from three facilities. In North Africa, Geocycle Egypt and Geocycle Maroc use the cement kilns of their sister companies to offer co-processing that independent operators cannot match. Rwanda's Enviroserve Green Park and Nigeria's NUPRC-accredited contractors compete in narrower niches. Contract wins increasingly depend on documented diversion rates, digital waste tracking and the financial strength to carry environmental liability for decades.
A few licensed cell owners and many haulers share supply
Supply is concentrated where licensed hazardous cells and treatment plants exist and fragmented everywhere else. In South Africa, EnviroServ, Interwaste, Averda, Veolia and Oricol operate the largest permitted hazardous landfills, blending plants and treatment sites, while many smaller firms haul general industrial waste. North Africa's recovery capacity is tied to cement groups through Geocycle. Entry barriers are licenses, engineered cells and kiln access rather than trucks, so margins sit with facility owners and thin out for pure haulers. Nigeria's upstream segment forms a separate pool of NUPRC-accredited firms.
Industrial waste contractors and their African roles
| Company | Type | Role in the market |
|---|---|---|
| EnviroServ | Hazardous waste operator | Holfontein hazardous landfill in Gauteng, industrial cleaning, sludge dewatering and on-site services |
| Interwaste | Integrated waste operator | Séché Environnement subsidiary with a Delmas leachate and effluent treatment plant |
| Averda | Integrated waste operator | Vlakfontein hazardous landfill and ArcelorMittal South Africa waste contract |
| Veolia Southern Africa / DCLM | Industrial services group | Acquired DCLM in 2019 to expand industrial waste treatment in South Africa |
| Oricol Environmental Services | Hazardous waste treater | Cato Ridge fuel blending plant plus Gauteng and Eastern Cape facilities |
| Geocycle Egypt | Co-processing operator | Alternative fuel plant at the Lafarge cement works near Ain Sokhna |
| Geocycle Maroc | Co-processing operator | Industrial waste contracts, including Nestlé, treated in LafargeHolcim Maroc kilns |
| Enviroserve Rwanda Green Park | E-waste recycler | E-waste dismantling and recycling plant in Bugesera District |
Permits and kiln access, not trucks, will capture the margin
Credence Research's view is that African industrial waste spending will grow faster than industrial output because regulators are now pricing disposal, not because waste volumes are rising sharply. Value will accrue to operators that own permitted treatment capacity and kiln access, while pure haulage remains a low-margin business. Buyers should favor contractors that can document diversion and carry long-term liability. Investors should look first at Egypt, the Nigerian upstream belt and the Congo copper corridor, where licensed capacity lags the rules.
Tonnage, licensed share and gate fees drive the estimate
The report uses 2025 as the base year and forecasts to 2035. Market values come from the Credence Research model, built from industrial waste tonnage by stream, the share handled by licensed contractors, and per-ton service and disposal prices by subregion. Regional, segment and operating model splits are estimates built from these public inputs. Inputs include national waste laws and regulations, regulator registers and approval lists, municipal tariff schedules, development finance disclosures, company releases and trade press. No interviews or primary surveys were conducted for this report.
Treatment and remediation carry growth to 2035
The Africa industrial waste management market is set to reach USD 3.97 billion by 2035 as licensing, producer responsibility and mining oversight convert more industrial waste into paid, documented services. Growth will be strongest in recovery and remediation, industrial electronic waste, on-site managed contracts and East and Central Africa. Collection and transportation will remain the largest service line, but its share will fall as treatment before disposal spreads. Demand for treatment near the source will also rise, because Ekurhuleni charges ZAR 3,956.49 per ton in 2026/27 for classified liquids from outside the metro. The key variables are enforcement pace in Egypt, Kenya and South Africa, and capital spending at copper, gold and phosphate operations.
Enforcement pace decides the range of outcomes to 2035
The outcome depends mainly on how fast regulators enforce the rules already written and on mining and refinery investment. Strict enforcement of Egyptian licensing, Kenyan producer schemes and South African diversion targets would move more tonnage into paid treatment, while delays would keep cheap landfill and informal disposal in place. Commodity cycles in copper, gold and phosphates shift tailings and chemical handling volumes in either direction.
| Scenario | CAGR, 2026–2035 | Value, 2035 | What has to hold |
|---|---|---|---|
| Downside | 8.3% | USD 3.42 billion | Enforcement stalls, landfill fees stay low and mining capital spending slows after a commodity downturn |
| Base | 10.09% | USD 3.97 billion | Current laws are enforced gradually and cement kilns expand alternative fuel use as planned |
| Upside | 11.6% | USD 4.48 billion | Diversion targets are enforced, producer schemes mature and new mine and refinery projects outsource waste |
Frequently Asked Questions
How big is the Africa industrial waste management market?
Which service type leads industrial waste spending in Africa?
Which region leads the market?
How much hazardous waste does South Africa still landfill?
What do Nigerian upstream rules require for drilling waste?
Which waste type grows fastest?
Who are the main companies in the market?
What could slow the market?
Table of Content
Chapter 1 Market Segmentation
- 1.1 Segmentation Framework
- 1.1.1 Product and Service Classification
- 1.1.2 Application and End-Use Classification
- 1.1.3 Technology and Solution Classification
- 1.1.4 Customer and Distribution Channel Classification
- 1.1.5 Geographic Segmentation
- 1.1.6 Market Segment Definitions and Boundaries
- 1.2 By Service Type
- 1.2.1 Collection and Transportation
- 1.2.2 Treatment and Processing
- 1.2.3 Secure Disposal
- 1.2.4 Recovery and Remediation
- 1.3 By Waste Type
- 1.3.1 Non-Hazardous Solid and Construction Waste
- 1.3.2 Mining and Mineral Processing Waste
- 1.3.3 Hazardous Chemical and Hydrocarbon Waste
- 1.3.4 Industrial Electronic Waste
- 1.4 By End-Use Industry
- 1.4.1 Mining and Metals
- 1.4.2 Process Manufacturing
- 1.4.3 Oil, Gas and Petrochemicals
- 1.4.4 Industrial Construction
- 1.5 By Operating Model
- 1.5.1 On-Site Managed Services
- 1.5.2 Off-Site Facility Services
- 1.5.3 Mobile and Project Services
Chapter 2 Introduction
- 2.1 Report Objectives and Scope
- 2.2 Product Definition and Industry Terminology
- 2.3 Market Inclusions and Exclusions
- 2.4 Research Process
- 2.4.1 Primary Research and Expert Interviews
- 2.4.2 Secondary Research and Source Review
- 2.4.3 Top-Down and Bottom-Up Estimation
- 2.4.4 Data Triangulation and Verification
- 2.5 Market Size Measurement Basis
- 2.5.1 2025: USD 1.51 billion → 2035: USD 3.97 billion
- 2.6 Historical and Forecast Reference Periods
- 2.6.1 Historical Period: 2018-2025
- 2.6.2 Base Year: 2025
- 2.6.3 Forecast Period: 2025-2035
- 2.7 Research Assumptions and Limitations
Chapter 3 Executive Summary
- 3.1 Market Snapshot and Key Findings
- 3.2 Base-Year Market Size, 2025
- 3.3 Forecast Market Size, 2035
- 3.4 Revenue and Volume Growth Outlook
- 3.5 Key Demand and Supply Indicators
- 3.6 Leading Market Segments
- 3.7 Fastest-Growing Market Opportunities
- 3.8 Regional Performance Highlights
- 3.9 Technology and Industry Transformation
- 3.10 Competitive Landscape Summary
- 3.11 Analyst View and Strategic Implications
Chapter 4 Africa Industrial Waste Management Market Trends and Developments
- 4.1 Historical Industry Development, 2018-2025
- 4.2 Recent Market Trends and Developments
- 4.3 Demand and Customer Behavior Trends
- 4.4 Technology and Product Innovation
- 4.5 Artificial Intelligence, Automation and Digitalization
- 4.6 Local Manufacturing and Supply Chain Realignment
- 4.7 Industry Partnerships, Mergers and Acquisitions
- 4.8 Sustainability and Circular Economy Developments
- 4.9 Government and Private Sector Investment Trends
- 4.10 Emerging Business Models and Commercialization
- 4.11 Industry Developments and Announcements
Chapter 5 Africa Industrial Waste Management Market Production, Supply and Demand Analysis
- 5.1 Demand Trend and Consumption Analysis, 2018-2025
- 5.2 Demand Forecast, 2025-2035
- 5.3 Production and Output Trend, 2018-2025
- 5.4 Production and Output Forecast, 2025-2035
- 5.5 Installed Capacity and Capacity Utilization
- 5.6 Company-Wise Production Plants and Statistics
- 5.6.1 Installed Production Capacity
- 5.6.2 Actual Production
- 5.6.3 Planned Capacity and Expansion Targets
- 5.7 Supply Chain Structure and Procurement Trends
- 5.8 Supply-Demand Gap and Bottlenecks
- 5.9 Import Dependence and Sourcing Structure
- 5.10 Contract Manufacturing and Outsourcing
- 5.11 Regional Supply and Demand Concentration
Chapter 6 Africa Industrial Waste Management Market Pricing Analysis
- 6.1 Pricing Structure and Measurement
- 6.2 Historical Pricing Trends, 2018-2025
- 6.3 Pricing Outlook, 2025-2035
- 6.4 Average Selling Price and Unit Economics
- 6.5 Pricing by Product and Market Segment
- 6.6 Geographic Pricing Differences
- 6.7 Key Input, Energy, Labor and Logistics Costs
- 6.8 Contract Pricing and Purchasing Models
- 6.9 Pricing Sensitivity and Competitive Positioning
- 6.10 Price, Margin and Profitability Implications
Chapter 7 Africa Industrial Waste Management Market Dynamics
- 7.1 Market Growth Drivers
- 7.1.1 Demand-Side Drivers
- 7.1.2 Technology and Innovation Drivers
- 7.1.3 Infrastructure and Investment Drivers
- 7.1.4 Regulatory and Policy Drivers
- 7.2 Market Restraints
- 7.2.1 Cost and Affordability Constraints
- 7.2.2 Technology and Adoption Barriers
- 7.2.3 Supply Chain and Operational Constraints
- 7.3 Market Challenges
- 7.3.1 Competitive Pressure and Margin Erosion
- 7.3.2 Skills, Infrastructure and Implementation Gaps
- 7.4 Emerging Market Opportunities
- 7.5 Market Dynamics Impact and Time-Horizon Assessment
Chapter 8 Africa Industrial Waste Management Value Chain Analysis
- 8.1 Industry Value Chain Overview
- 8.2 Upstream Suppliers and Critical Inputs
- 8.3 Technology and Component Providers
- 8.4 Manufacturing or Service Delivery
- 8.5 Distribution, Channel Partners and Integrators
- 8.6 Downstream Applications and End Users
- 8.7 Value Addition and Profit Pools
- 8.8 Vertical Integration and Outsourcing
- 8.9 Supplier Concentration and Risk
- 8.10 Supply Chain Localization and Resilience
Chapter 9 Africa Industrial Waste Management Market Regulations and Policies
- 9.1 Relevant Laws, Standards and Compliance Frameworks
- 9.2 Product, Service, Safety and Quality Requirements
- 9.3 Government Policies, Incentives and Subsidies
- 9.4 Imports, Exports and Trade Barriers
- 9.5 Public Procurement and Local Content Requirements
- 9.6 Environmental and Sustainability Compliance
- 9.7 Upcoming Policy Changes and Market Implications
Chapter 10 Africa Industrial Waste Management Market Hotspots and Opportunities
- 10.1 Market Opportunity Mapping and Growth Hotspots
- 10.2 High-Growth Applications and Customer Groups
- 10.3 Underserved Markets and White-Space Opportunities
- 10.4 Emerging Technology and Product Opportunities
- 10.5 New Capacity and Investment Hotspots
- 10.6 Market Entry and Expansion Opportunities
- 10.7 Distribution and Partnership Opportunities
- 10.8 Near-Term and Long-Term Commercial Potential
- 10.9 Opportunity Attractiveness and Execution Risks
Chapter 11 Africa Industrial Waste Management Market Outlook, 2025-2035
- 11.1 Market Size and Analysis
- 11.1.1 Revenue (Market Measurement: 2025: USD 1.51 billion → 2035: USD 3.97 billion)
- 11.1.2 Market Volume and Quantity Sold
- 11.1.3 Historical Market Size, 2018-2025
- 11.1.4 Base-Year Market Size, 2025
- 11.2 Market Forecast, 2025-2035
- 11.2.1 Revenue Forecast to 2035
- 11.2.2 Volume Forecast to 2035
- 11.2.3 CAGR and Year-on-Year Growth
- 11.2.4 Incremental Revenue Opportunity
- 11.3 Forecast Assumptions and Scenario Analysis
- 11.3.1 Base-Case Forecast
- 11.3.2 Optimistic and Conservative Scenarios
- 11.3.3 Technology, Pricing and Policy Sensitivities
- 11.4 Market Attractiveness and Growth Outlook
Chapter 12 Africa Industrial Waste Management Market Segmentation and Outlook
- 12.1 Segmentation Summary and Market Shares, 2025
- 12.2 Largest and Fastest-Growing Segments
- 12.3 By Service Type - Market Size and Forecast, 2025-2035
- 12.3.1 Segment Definition and Scope
- 12.3.2 Historical Market Size, 2018-2025
- 12.3.3 Revenue Forecast, 2025-2035
- 12.3.4 Volume Forecast, 2025-2035
- 12.3.5 Base-Year Market Share, 2025
- 12.3.6 Segment CAGR and Growth Drivers
- 12.3.7 Subsegment Market Size and Forecast
- 12.3.7.1 Collection and Transportation
- 12.3.7.2 Treatment and Processing
- 12.3.7.3 Secure Disposal
- 12.3.7.4 Recovery and Remediation
- 12.3.8 Subsegment Pricing and Adoption Trends
- 12.3.9 Leading Suppliers and Competition
- 12.3.10 Regional Demand and Opportunities
- 12.4 By Waste Type - Market Size and Forecast, 2025-2035
- 12.4.1 Segment Definition and Scope
- 12.4.2 Historical Market Size, 2018-2025
- 12.4.3 Revenue Forecast, 2025-2035
- 12.4.4 Volume Forecast, 2025-2035
- 12.4.5 Base-Year Market Share, 2025
- 12.4.6 Segment CAGR and Growth Drivers
- 12.4.7 Subsegment Market Size and Forecast
- 12.4.7.1 Non-Hazardous Solid and Construction Waste
- 12.4.7.2 Mining and Mineral Processing Waste
- 12.4.7.3 Hazardous Chemical and Hydrocarbon Waste
- 12.4.7.4 Industrial Electronic Waste
- 12.4.8 Subsegment Pricing and Adoption Trends
- 12.4.9 Leading Suppliers and Competition
- 12.4.10 Regional Demand and Opportunities
- 12.5 By End-Use Industry - Market Size and Forecast, 2025-2035
- 12.5.1 Segment Definition and Scope
- 12.5.2 Historical Market Size, 2018-2025
- 12.5.3 Revenue Forecast, 2025-2035
- 12.5.4 Volume Forecast, 2025-2035
- 12.5.5 Base-Year Market Share, 2025
- 12.5.6 Segment CAGR and Growth Drivers
- 12.5.7 Subsegment Market Size and Forecast
- 12.5.7.1 Mining and Metals
- 12.5.7.2 Process Manufacturing
- 12.5.7.3 Oil, Gas and Petrochemicals
- 12.5.7.4 Industrial Construction
- 12.5.8 Subsegment Pricing and Adoption Trends
- 12.5.9 Leading Suppliers and Competition
- 12.5.10 Regional Demand and Opportunities
- 12.6 By Operating Model - Market Size and Forecast, 2025-2035
- 12.6.1 Segment Definition and Scope
- 12.6.2 Historical Market Size, 2018-2025
- 12.6.3 Revenue Forecast, 2025-2035
- 12.6.4 Volume Forecast, 2025-2035
- 12.6.5 Base-Year Market Share, 2025
- 12.6.6 Segment CAGR and Growth Drivers
- 12.6.7 Subsegment Market Size and Forecast
- 12.6.7.1 On-Site Managed Services
- 12.6.7.2 Off-Site Facility Services
- 12.6.7.3 Mobile and Project Services
- 12.6.8 Subsegment Pricing and Adoption Trends
- 12.6.9 Leading Suppliers and Competition
- 12.6.10 Regional Demand and Opportunities
- 12.7 Segment Growth Comparison
- 12.8 Segment Attractiveness and Priority Matrix
Chapter 13 Africa Industrial Waste Management End-Use and Application Market Outlook
- 13.1 End-Use Industry and Customer Demand Structure
- 13.2 Leading Applications and Customer Groups
- 13.3 End-Use Market Size, Share and Forecast
- 13.4 Major End-Use Industry Deep Dives
- 13.4.1 Customer Requirements and Use Cases
- 13.4.2 Demand and Replacement Cycles
- 13.4.3 Technical and Regulatory Considerations
- 13.4.4 Purchasing and Procurement Models
- 13.4.5 Leading Vendors and Distribution Channels
- 13.4.6 Forecast and Commercial Opportunities
- 13.5 Emerging Applications and Cross-Segment Demand
- 13.6 End-Use Industry Investment Priorities
Chapter 14 Africa Industrial Waste Management Geographic Market Outlook, 2025-2035
- 14.1 Regional Market Size and Country-Level Shares, 2025
- 14.2 Country Market Size Comparison, 2025
- 14.3 Country Market Forecasts, 2025-2035
- 14.4 Subregional Industrial and Demand Clusters
- 14.5 Intra-Regional Pricing and Cost Differences
- 14.6 Cross-Border Trade and Supply Networks
- 14.7 Regional Supply and Demand Balances
- 14.8 Country Opportunity Comparison and Prioritization
Note: Every listed country is covered on the structure shown under the first country.
Chapter 15 Africa Industrial Waste Management Technology, Innovation and Sustainability Outlook
- 15.1 Technology Landscape and Maturity
- 15.2 Product, Process and Service Innovation
- 15.3 AI, Automation and Digital Tools in the Industry
- 15.4 Technology Adoption and Performance Benchmarking
- 15.5 Innovation Pipeline and R&D Investment
- 15.6 Patent and Intellectual Property Trends
- 15.7 Energy Efficiency and Resource Management
- 15.8 Sustainability, Recycling and Circularity
- 15.9 Technology Roadmap, 2025-2035
- 15.10 Risks of Obsolescence and Technology Substitution
Chapter 16 Africa Industrial Waste Management Market Key Strategic Imperatives
- 16.1 Growth and Market Entry Priorities
- 16.2 High-Return Products and Segments
- 16.3 Pricing, Profitability and Cost Optimization
- 16.4 Technology Investment and Product Differentiation
- 16.5 Supply Chain Localization and Resilience
- 16.6 Distribution and Customer Acquisition
- 16.7 Partnership, Acquisition and Capacity Strategy
- 16.8 Regional Expansion Priorities
- 16.9 Short-, Medium- and Long-Term Actions
Chapter 17 Competition Outlook
- 17.1 Industry Competition Characteristics
- 17.2 Market Structure and Concentration
- 17.3 Market Share and Competitive Positioning, 2025
- 17.4 Company-Wise Revenue and Product Benchmarking
- 17.5 Production and Service Capacity Benchmarking
- 17.6 Technology, Pricing and Differentiation
- 17.7 Regional Footprint and Distribution Strength
- 17.8 Mergers, Acquisitions and Strategic Alliances
- 17.9 New Entrants and Competitive Threats
- 17.10 Porter's Five Forces and Industry Attractiveness
- 17.11 Competitive Outlook, 2025-2035
Chapter 18 Company Profiles
- 18.1 Company Coverage and Selection Criteria
- 18.2 Veolia Southern Africa / DCLM
- 18.2.1 Business Description
- 18.2.2 Company Ownership and Geographic Presence
- 18.2.3 Product and Service Portfolio
- 18.2.4 Manufacturing and Operating Footprint
- 18.2.5 Production Capacity and Expansion Plans
- 18.2.6 Financial Performance and Investment
- 18.2.7 Market Share and Competitive Position
- 18.2.8 Technology and Innovation Capabilities
- 18.2.9 Strategic Alliances or Partnerships
- 18.2.10 Recent Developments
- 18.2.11 Growth Strategy and Outlook
- 18.3 Averda
- 18.4 EnviroServ
- 18.5 Interwaste
- 18.6 WastePlan
- 18.7 Oricol Environmental Services
- 18.8 Geocycle Egypt
- 18.9 Geocycle Maroc
- 18.10 Enviroserve Rwanda Green Park
- 18.11 Re-Co Environmental Solutions
- 18.12 Other Relevant Market Participants
Note: Every listed company is profiled on the structure shown under the first company. The company list is preliminary and may change based on research findings, market developments, data availability and client requirements.
Chapter 19 Disclaimer
- 19.1 Research and Forecast Disclaimer
- 19.2 Data Source and Estimation Limitations
Note: The depth of individual sections depends on data availability for this market. Volume, capacity, trade and other unit-based metrics are included where applicable.

