
City rubble becomes aggregates, sand and pavers
The India construction demolition waste recycling market was valued at USD 230.0 million in 2025 and is projected to increase from USD 243.8 million in 2026 to USD 411.9 million by 2035, registering a CAGR of 6.00% during 2026–2035. Demand comes from city corporations that pay tipping fees to licensed plants, bulk builders that must now prove debris goes to recyclers, and road and building contractors that buy aggregates, sand and pavers made from crushed rubble. North India held the largest regional share, 35.0% in 2025, because Delhi's four plants process about 5,000 metric tons a day and Noida and Gurugram add about 300 each. Northeast India is the fastest-growing region at 7.18% a year, from a very small base, because Guwahati and other state capitals still lack processing plants. The main regulatory change is the Construction and Demolition Waste Management Rules, 2025, which apply from April 1, 2026 and set recycling and reuse targets for large producers.
Which recycling revenue and products are counted here?
The market counts revenue that licensed plants in India earn from processing construction and demolition debris. It covers tipping and processing fees paid by municipal bodies and builders, collection and transport charges inside integrated contracts, and sales of recycled aggregates, manufactured sand, bricks, pavers and other precast products made from the processed material.
The scope excludes informal dumping, landfill disposal fees, mining of virgin stone and sand, and the sale of crushing and screening equipment. Value is counted once at the plant level, so a city fee and the product sale from the same metric ton are both included, but resale by traders is not.
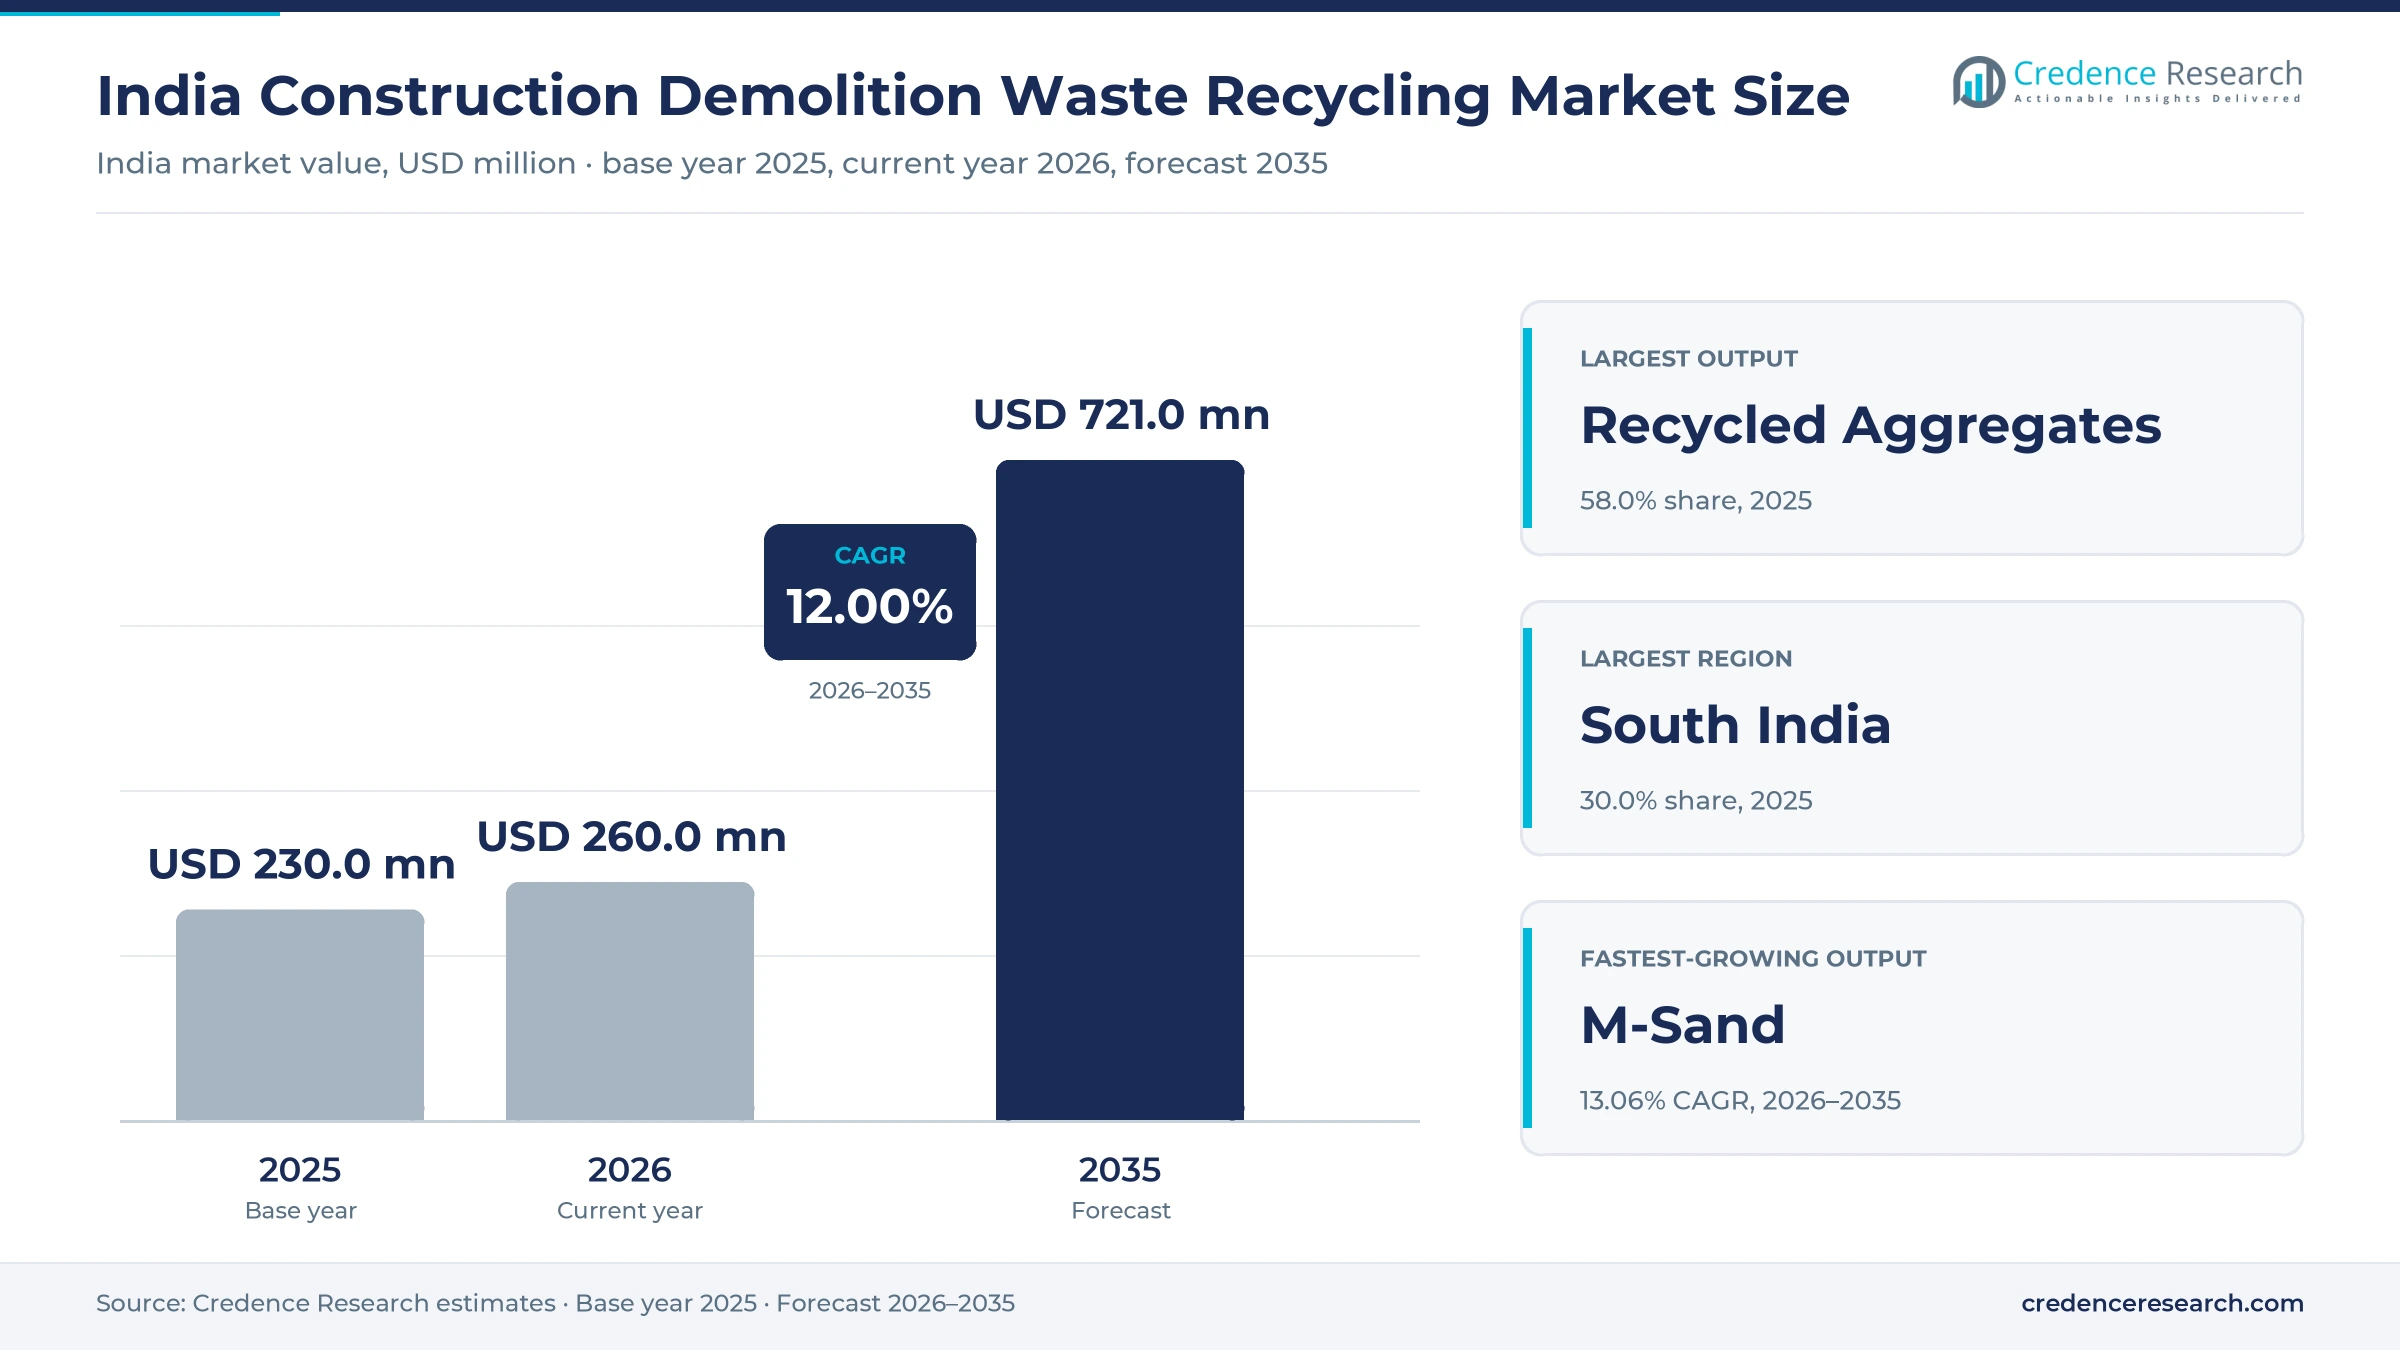
India Construction Demolition Waste Recycling Market Insights
- The market grows from USD 230.0 million in 2025 to USD 411.9 million by 2035 at a 6.00% CAGR, as reuse targets rise from 5% in 2026-27 to 25% in 2030-31.
- North India held 35.0% of 2025 value, as Delhi's four plants process about 5,000 metric tons a day and Tehkhand adds 1,000 by December 2026.
- Recycled aggregates led the output split with 58.0% in 2025, as Ahmedabad turns about 874 of every 1,000 metric tons into graded stone.
- The C&D Waste Management Rules, 2025 apply from April 1, 2026, covering projects with 20,000 square meters or more of built-up area.
- Delhi runs about 5,000 metric tons a day of capacity at four plants and plans a 1,000-ton-a-day Tehkhand plant by December 2026.
Aggregates, municipal PPPs and Delhi plants lead value
Why do recycled aggregates earn the largest share?
Based on output, the market is categorized into recycled aggregates, M-sand and bricks and pavers. Recycled Aggregates led with 58.0% of 2025 value because crushing yields mostly coarse stone, and Gujarat Samachar reported in September 2024 that Ahmedabad turns about 874 of each 1,000 metric tons into 10 mm to 40 mm concrete aggregates. Bricks and pavers earn more per metric ton at plants such as Burari. M-Sand grows fastest at 7.05% a year as wet plants wash fines into sand, which competes with river sand priced at Rs 2,950 a metric ton in Delhi NCR in August 2026, according to Infralens.
How do municipal PPPs and private plants compare?
Based on model, the market is categorized into municipal PPP and private. Municipal PPP led with 71.0% of 2025 value because city concessions pay steady tipping fees, and Deccan Herald reported in December 2025 that Bengaluru approved fees of about Rs 765 a metric ton for 15 years at its Kannur and Chikkajala plants. Most large plants, from Delhi to Kolkata, run on municipal land under such contracts. Private plants grow fastest at 6.91% a year as the 2025 rules make builders of 20,000 square meters or more responsible for their debris from April 2026, and Indian Infrastructure reported that private buyers took about 67% of output in 2025.
Why do Delhi and Bengaluru stand out among cities?
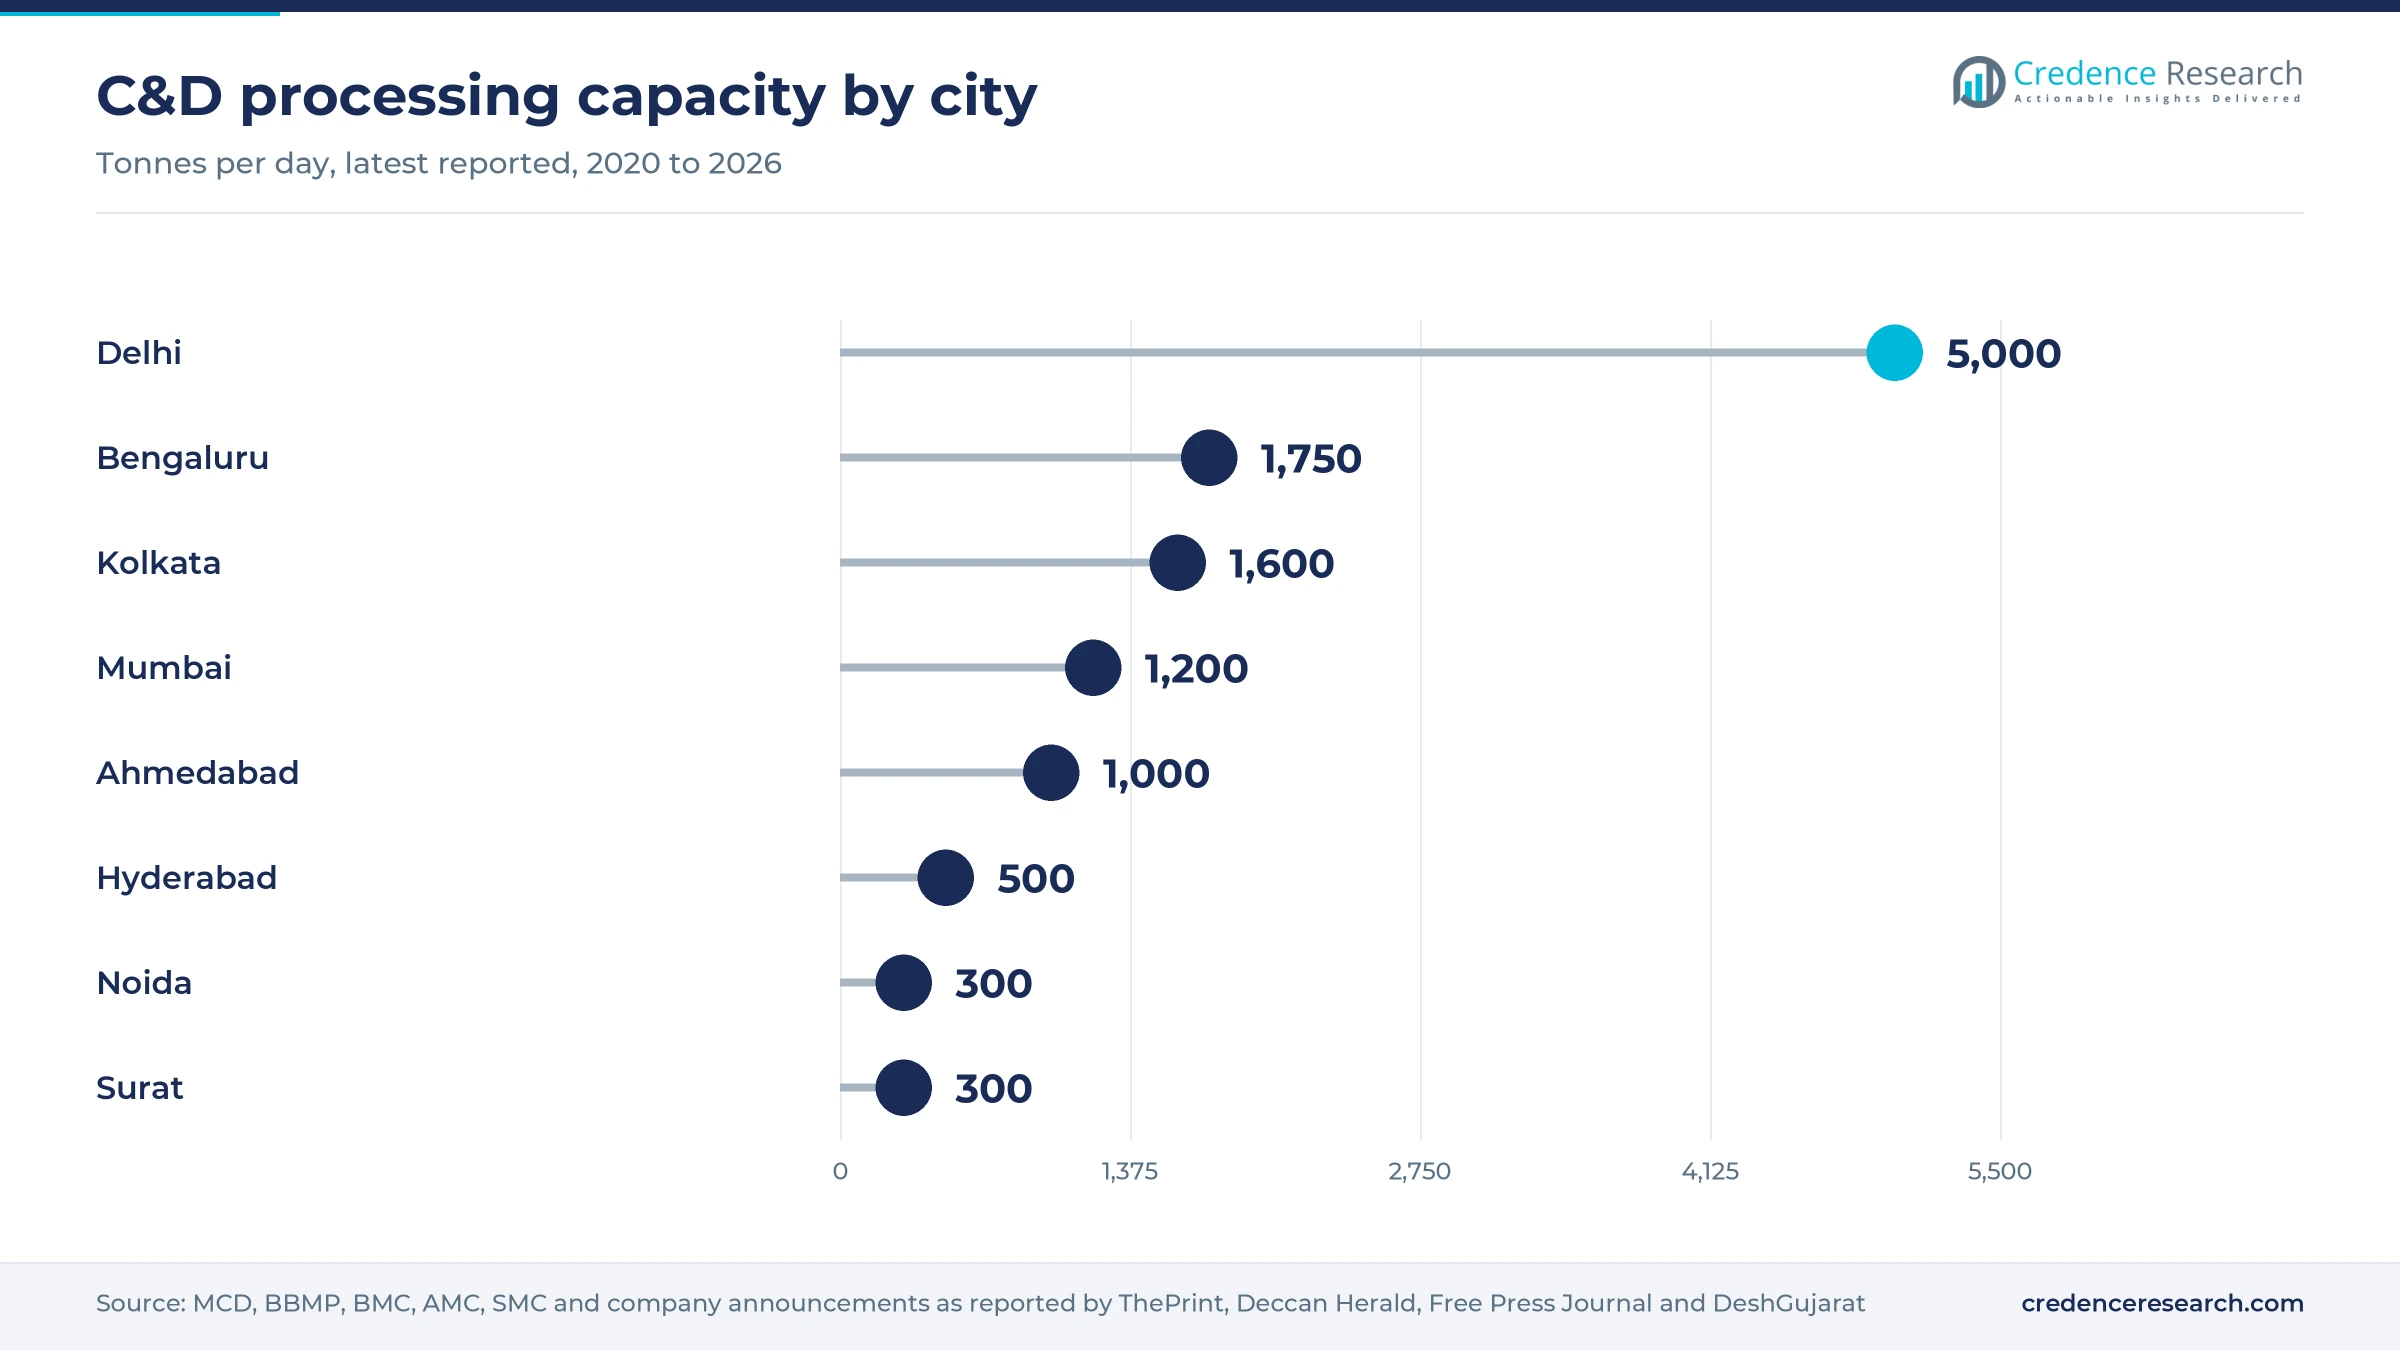
Based on city, the market is categorized into Delhi, Ahmedabad, Bengaluru and others. Others, which covers Mumbai, Hyderabad, Kolkata, Chennai, Surat and smaller cities, led with 61.0% of 2025 value because it pools Kolkata's 1,600-ton-a-day plant, Mumbai's 1,200 metric tons a day at Dahisar and Diaghar, Hyderabad's 500 and Surat's 300. Delhi is the largest single city for C&D waste recycling, with four plants processing about 5,000 metric tons a day in March 2026. Bengaluru grows fastest at 7.48% a year as Chaitra Civil Ventures received an appointment order on Dec. 29, 2025 for three new plants of 750 metric tons a day, more than doubling the city base of 1,750 metric tons a day.
| Segment Group | Leading Sub-segment | Share, 2025 | Fastest-growing Sub-segment | CAGR, 2026–2035 |
|---|---|---|---|---|
| By Output | Recycled Aggregates | 58.0% | M-Sand | 7.05% |
| By Model | Municipal PPP | 71.0% | Private | 6.91% |
| By City | Others | 61.0% | Bengaluru | 7.48% |
Request a Free Sample
Fill in your details and we'll send you a free sample report.
- Sample data tables & charts
- Research methodology
EPR rules, rebuilding and reuse mandates fill plants
Waste rules push builders toward formal recycling plants
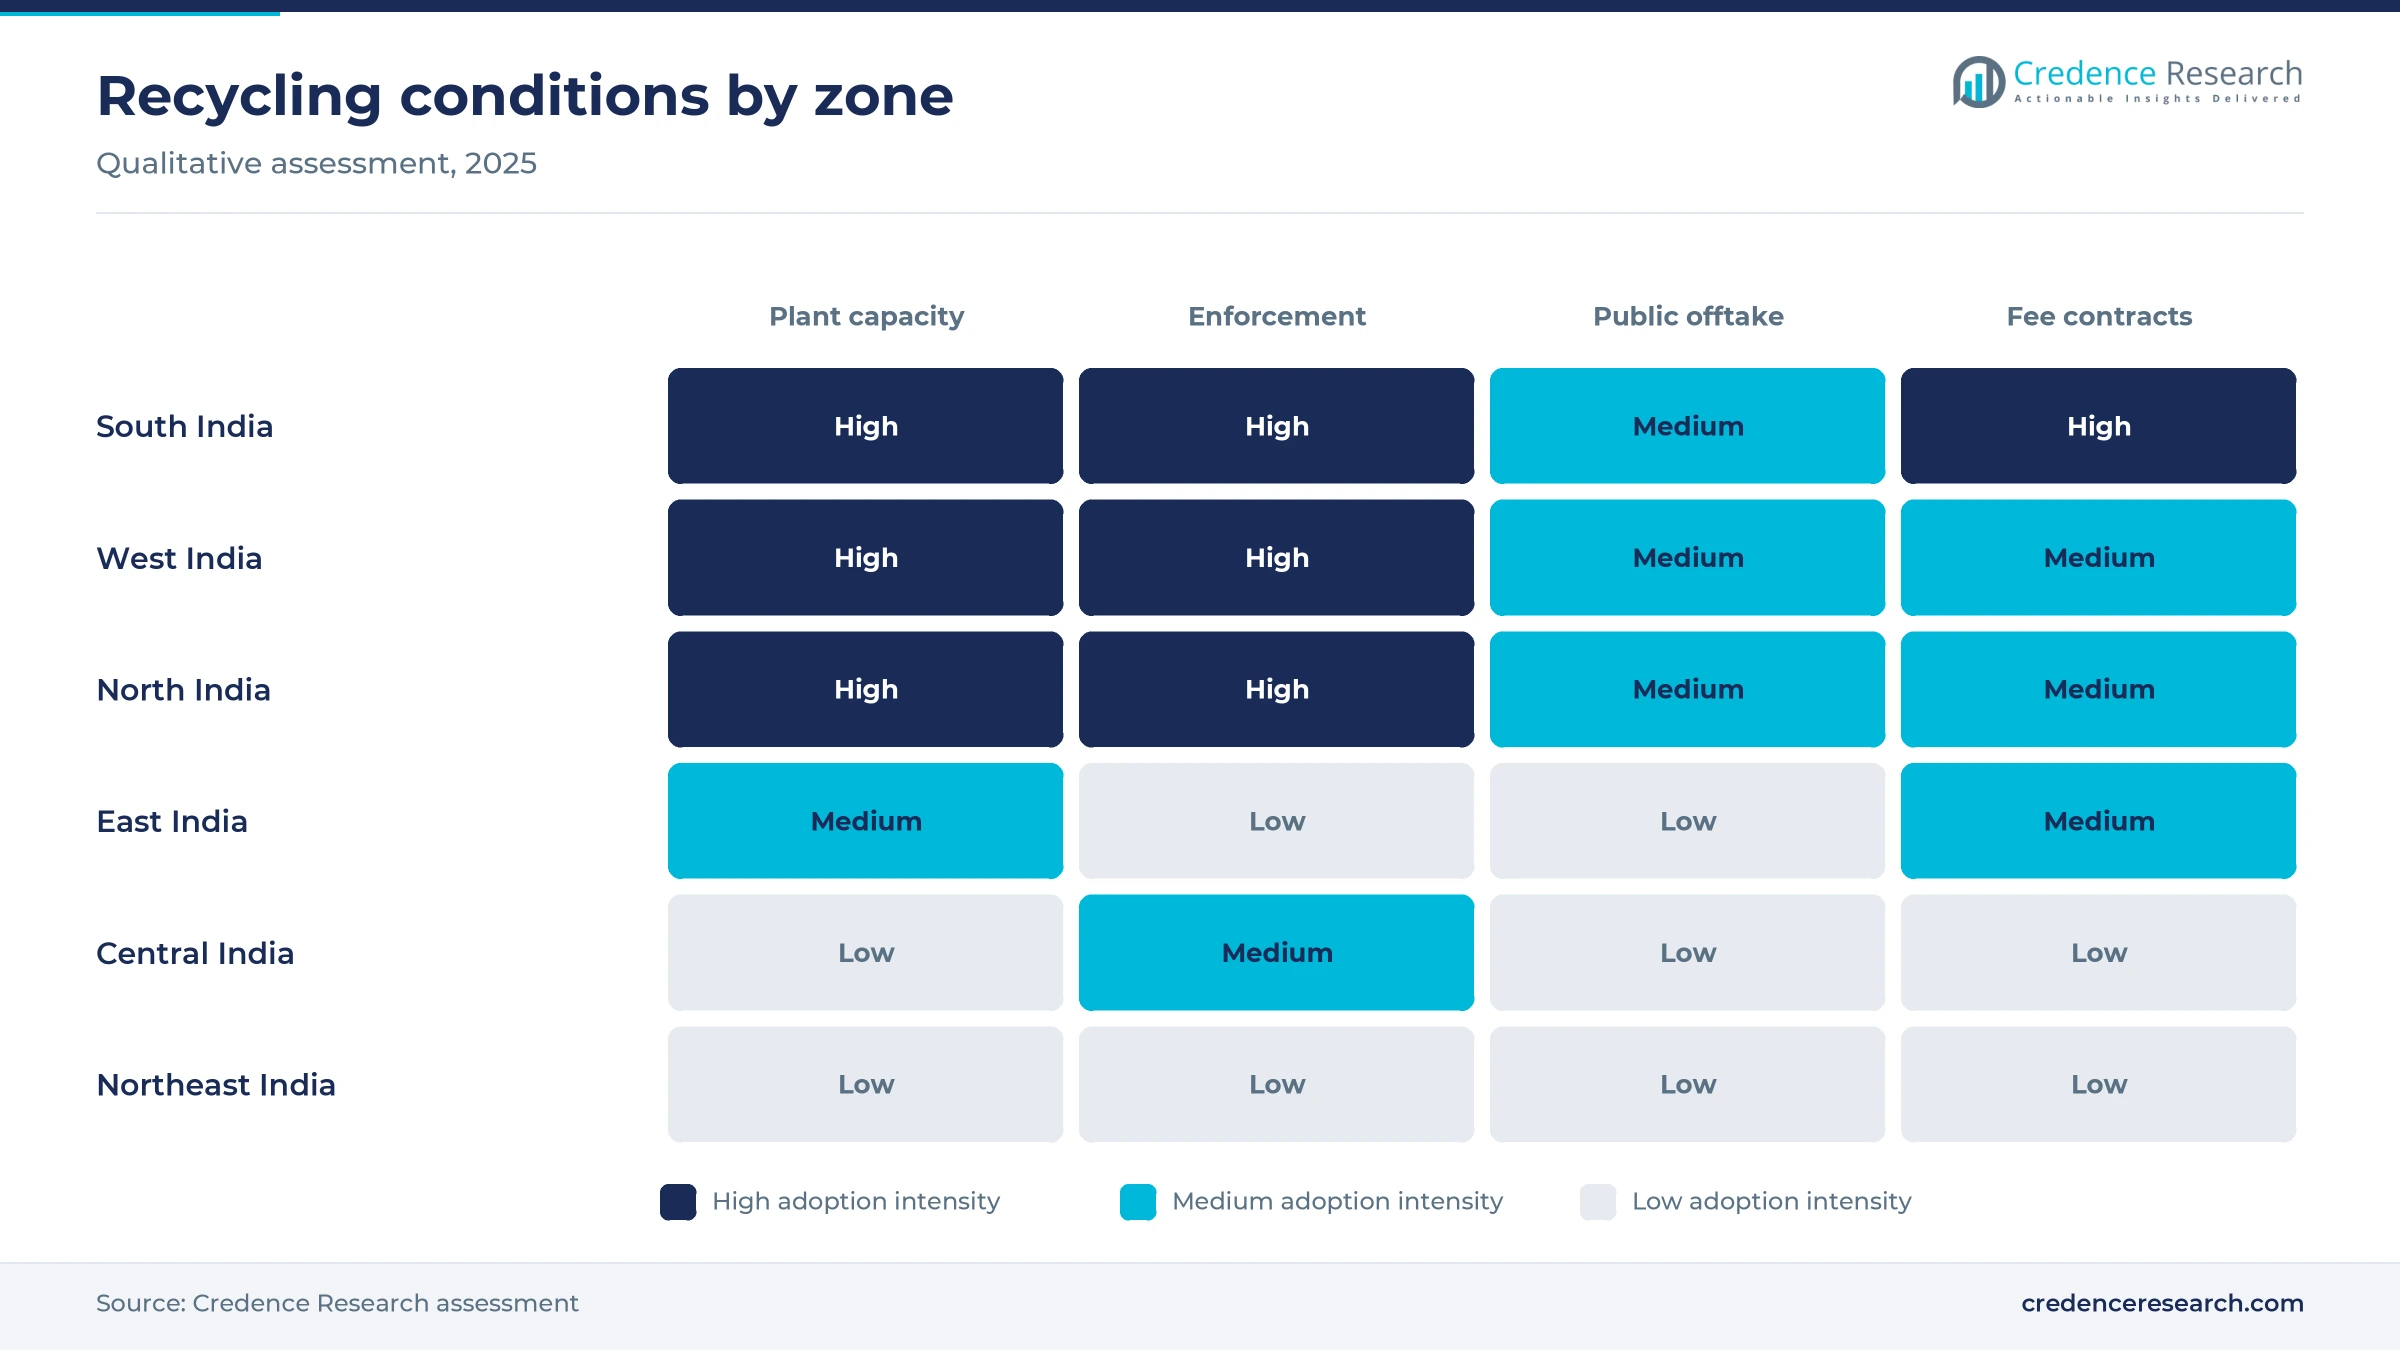
Regulation is the strongest driver, because the 2025 rules turn recycling from a city duty into a producer obligation with targets. Down To Earth reported in May 2025 that the rules apply from April 1, 2026 to bulk producers with 20,000 square meters or more of built-up area. Recycling targets rise every year until producers must recycle all their debris by 2028-29, while reuse of processed material starts at 5% in 2026-27 and reaches 25% by 2030-31. Cities are enforcing earlier, as Chennai collected Rs 39.30 lakh in penalties in 2025 after guidelines took effect on April 21, 2025, DT Next reported. In the Credence Research model this adds about 2.5 percentage points to annual growth to 2035.
Rebuilding of cities and roads yields reusable concrete
Redevelopment and infrastructure work create a large, steady stream of concrete and masonry rubble that plants can crush into aggregates. Mumbai now generates about 8,000 metric tons of C&D waste a day, against just over 1,000 metric tons five years earlier, with about 2,000 buildings under redevelopment, The Week reported in May 2026. Public works add volume, as the Union Budget for 2026-27 raised central capital expenditure to Rs 12.2 lakh crore from Rs 11.2 lakh crore, Deccan Herald reported. Housing and office building activity also add rubble when old blocks are cleared. In the Credence Research model this adds about 1.6 percentage points to annual growth to 2035.
Recycled-material buying and landfill costs improve economics
Assured buyers and fee income make plants bankable, because a recycler earns from both the metric ton it receives and the product it sells. Road projects must use at least 5% recycled or processed C&D content in 2026-27, rising to 15% by 2030-31, Indian Infrastructure reported in May 2026. The same report said the Municipal Corporation of Delhi mandated recycled C&D materials in its works in November 2025, while about 450,000 metric tons were sold to private buyers from April to November 2025. Surat makes up to 20% recycled material mandatory in government tenders, DeshGujarat reported in January 2026. In the Credence Research model this adds about 1.0 percentage point to annual growth to 2035.
Urban growth and Swachh Bharat funds widen city coverage
A larger urban base widens the number of cities that must build processing capacity, because the rules require plants in cities above one million people. World Bank data put India's urban population at about 522 million in 2025, or 35.7% of the total, up from about 504 million in 2023. Swachh Bharat Mission-Urban 2.0 earmarked Rs 10,884.80 crore of central assistance for solid waste projects, with C&D waste eligible, according to a July 2023 Press Information Bureau release. The Centre for Science and Environment counted more than 34 operating plants and over 35 more planned in September 2024. As a result, Bengaluru and other new city plants add capacity faster than the national average.
Bundled concessions and debris tracking reshape the trade
Rise of bundled concessions for collection and processing
Cities are shifting from plant-only contracts to long concessions that bundle collection, transport and processing under one operator. Deccan Herald reported in January 2026 that Bengaluru awarded three packages worth Rs 1,714 crore for 2,250 metric tons a day to Chaitra Civil Ventures on a 15-year DBFOT basis, at a tipping fee of about Rs 967 a metric ton. Mumbai followed, as the Brihanmumbai Municipal Corporation invited private partners on Aug. 20, 2026 to add about 2,000 metric tons a day under PPP or DBFOT models. Chennai already uses a private collector, Premier Precision Surface, with 168 vehicles, DT Next reported. As a result, municipal PPP plants still hold 71.0% of 2025 value.
Shift toward digital tracking of debris movement
Cities are moving to digital records of where debris goes, because diversion to open land cuts plant intake and fee income. Mumbai launched a dashboard in May 2026 where developers declare disposal plans, and vehicles carrying debris need tracking devices or face a Rs 25,000 fine, The Week reported. Chennai added vehicle seizure, real-time monitoring and fines of Rs 5,000 a metric ton for reckless dumping in January 2026, Indian Infrastructure reported. At national level, the 2025 rules require the Central Pollution Control Board to link stakeholders to an online portal within six months of notification, Down To Earth reported. Collection data show the gap, as Mumbai averaged only 432 metric tons a day of debris pickup from April 2025 to March 2026, Free Press Journal reported.
Washed sand and precast products offer higher-value outlets
Plants that wash and grade fines can sell sand and precast goods, which earn far more per metric ton than coarse fill. Re Sustainability and the Kolkata Municipal Corporation run a 1,600-ton-a-day wet plant in New Town that sorts, crushes, washes and screens debris, Surfaces Reporter noted in May 2023. Demand for manufactured sand is firm, with M-sand at Rs 2,100 a metric ton and river sand at Rs 2,950 in Delhi NCR in August 2026, according to Infralens. A CIDCO affordable housing project in Maharashtra used 50% fine recycled aggregate in precast work, Down To Earth reported. M-sand grows fastest at 7.05% a year in the Credence Research model.
Smaller cities without plants open new tenders
Cities that still lack processing capacity offer the next wave of contracts, because the rules now push every large city to build plants. Faridabad, which generates about 300 metric tons a day, plans a 300-ton-a-day plant and two 50-ton-a-day mobile units, while Gurugram proposes a 400-ton-a-day facility beside its Basai plant, Indian Infrastructure reported in May 2026. Bhopal planned a second plant beyond its Kolar unit in November 2024, Free Press Journal reported. Guwahati had no processing plant when it launched a debris pick-up service in October 2023, The Assam Tribune reported. In turn, Central and Northeast India grow faster than the national rate.
Idle capacity, code limits and weak offtake test plants
Plants run below capacity as debris goes elsewhere
Many plants receive far less debris than they were built for, because haulers still dump on open land. Surat's Kosad plant processes about 80 metric tons a day against a 300-ton capacity, DeshGujarat reported in January 2026. In Chennai, both authorized 400-ton-a-day plants were not operating from January to July 2025, according to Citizen consumer and civic Action Group. Low intake raises fixed costs per metric ton, so operators need enforcement and assured supply clauses in their contracts.
Code limits keep recycled material in low-value uses
Building codes cap how much recycled stone can enter concrete, which keeps much output in fill and road bases. IS 383 allows recycled concrete aggregate to replace natural aggregate by 20% in M25 concrete, but not in the M30 and M40 grades used in monolithic housing, Down To Earth reported in May 2025. Indian Infrastructure noted in May 2026 that use is skewed to landfilling and embankments. Plants therefore earn less per metric ton until the codes are revised.
Weak government offtake leaves stockpiles at plants
Public agencies buy less recycled material than their targets require, which leaves product piling up at plant yards. The Ministry of Housing and Urban Affairs set a revised 2025-26 use target of 990,000 metric tons for agencies including MCD and DDA, yet only about 13%, or 130,000 metric tons, was used from April 2025 to February 2026, Indian Infrastructure reported. Government agencies took only about 14% of recycled C&D demand in Delhi over the same period. Operators must lean on private buyers until public procurement catches up.
Tax and data gaps blur the business case
Investors struggle to size plants because official data on debris volumes are weak and taxes still favor virgin material. The Ministry of Housing and Urban Affairs estimates annual C&D waste at 150 million to 500 million metric tons, a range noted by Citizen consumer and civic Action Group in January 2026. Recycled construction materials carry 18% GST, and a lower rate has only been proposed, Indian Infrastructure reported. These gaps make lenders cautious, so plants rely on fee-backed municipal contracts.
North India leads on Delhi's 5,000-ton plant network
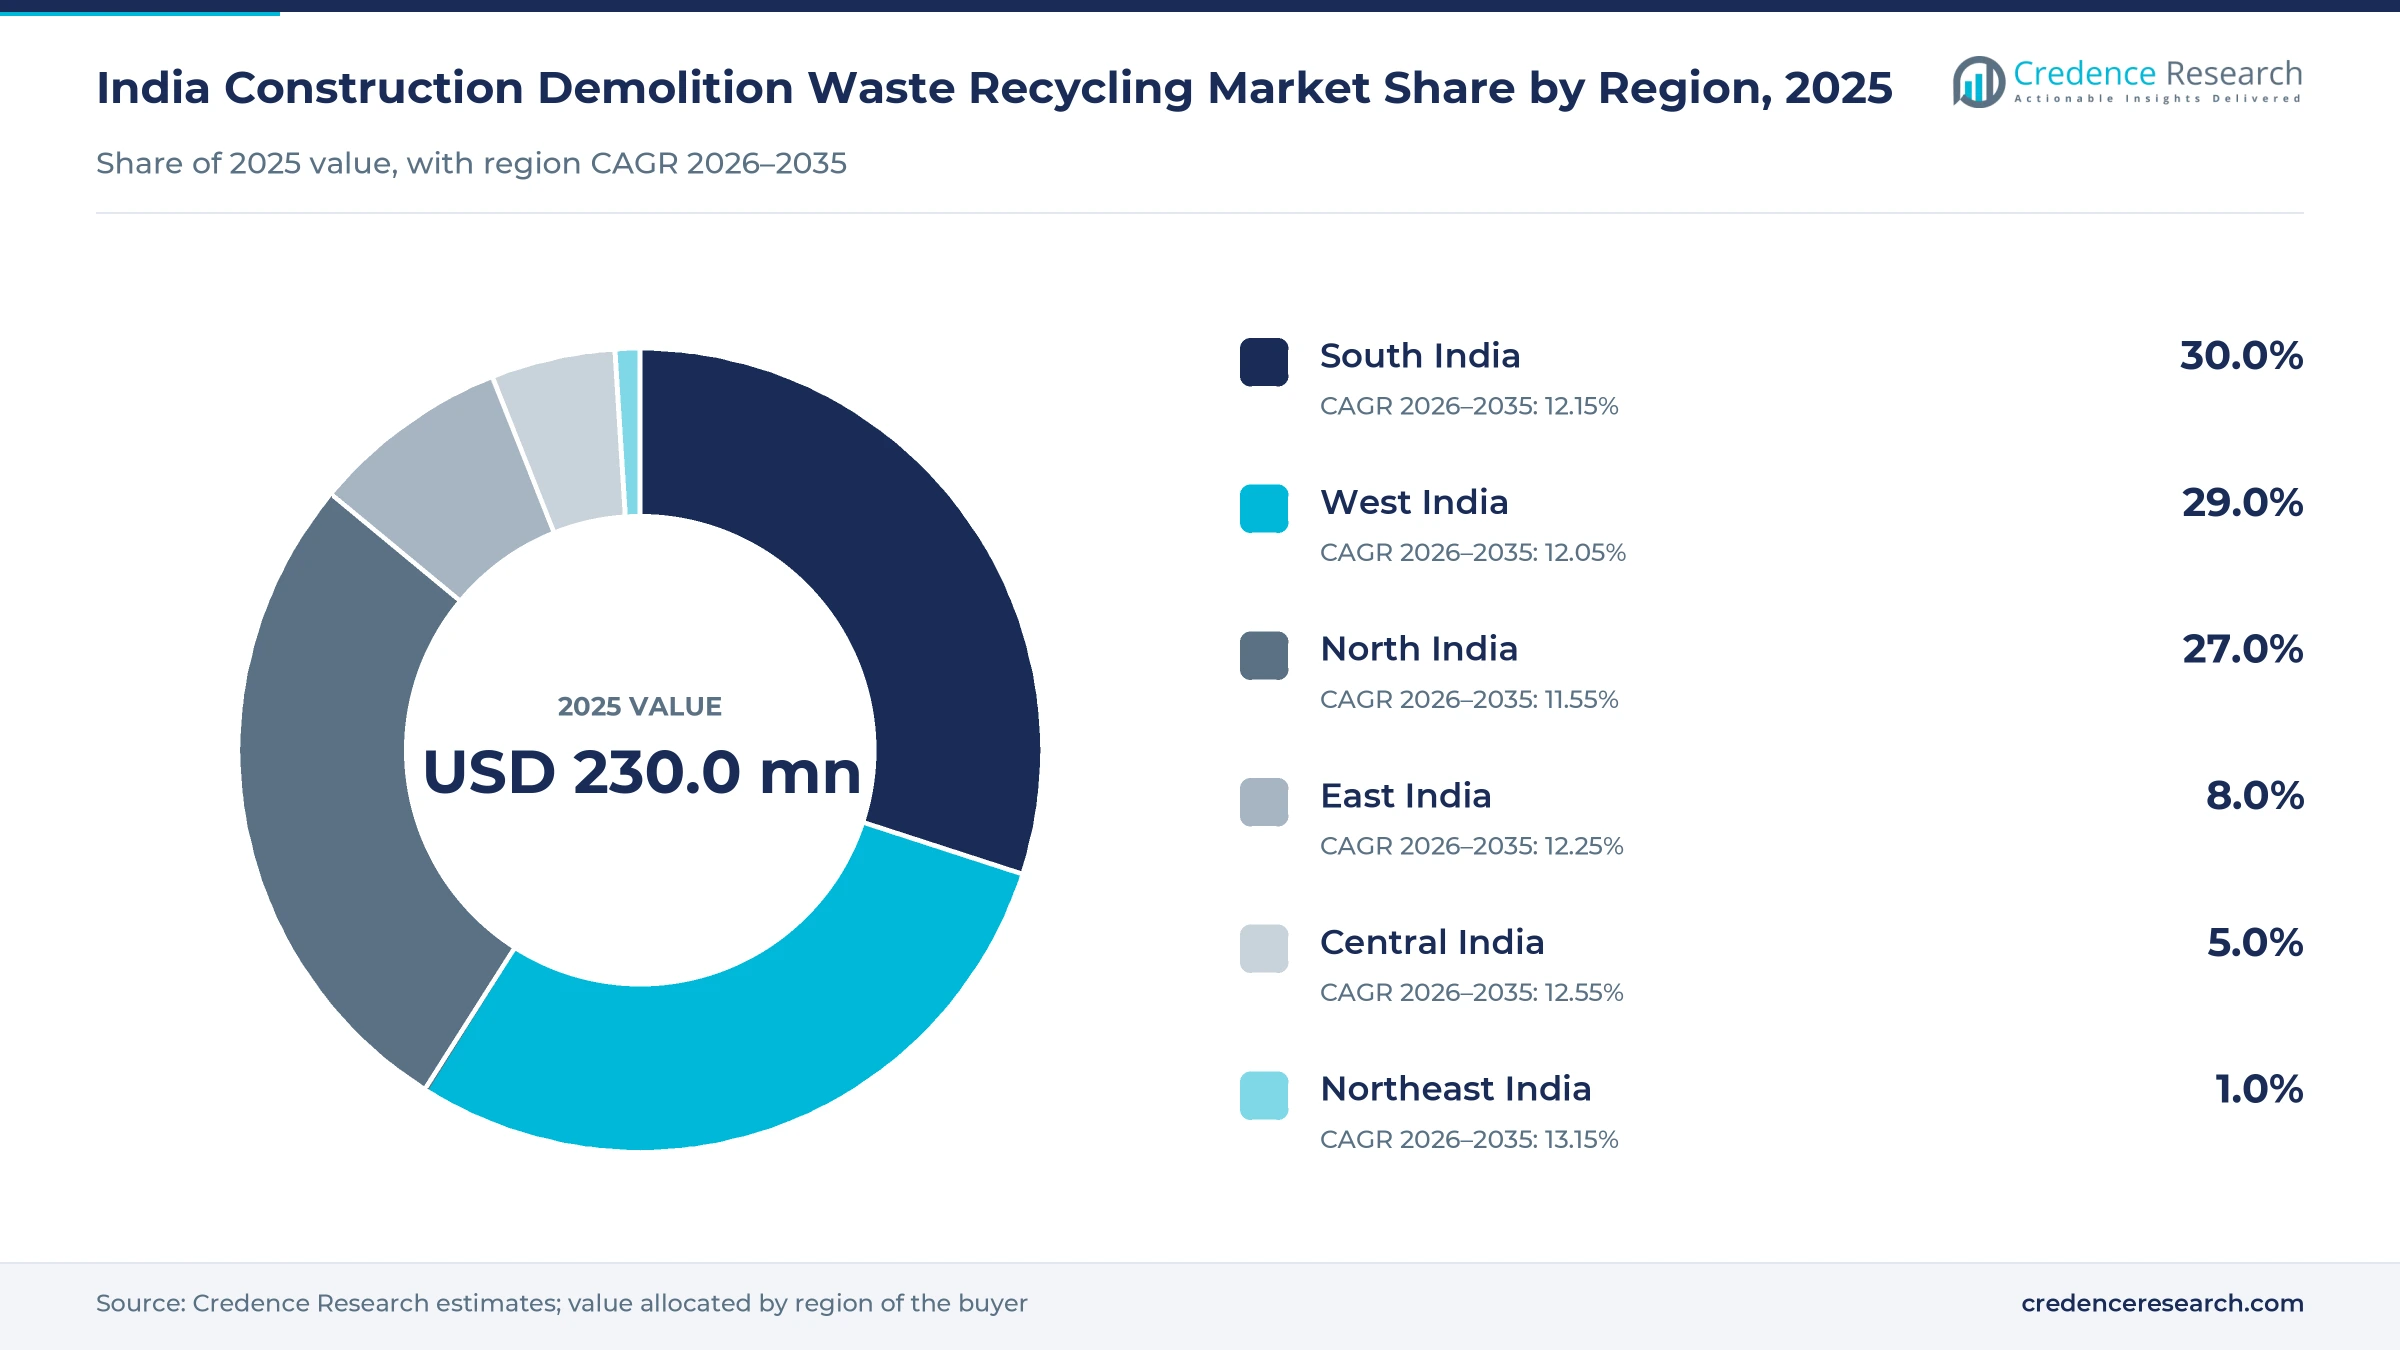
| Region | Value, 2025 (USD million) | Share, 2025 | CAGR, 2026–2035 |
|---|---|---|---|
| North India | 80.5 | 35.0% | 5.58% |
| South India | 55.2 | 24.0% | 6.18% |
| West India | 52.9 | 23.0% | 6.08% |
| East India | 25.3 | 11.0% | 6.28% |
| Central India | 13.8 | 6.0% | 6.58% |
| Northeast India | 2.3 | 1.0% | 7.18% |
North India leads on Delhi's 5,000-ton plant network
North India held 35.0% of 2025 value and grows at 5.58% a year, the largest base in the country. ThePrint reported in March 2026 that Delhi's plants at Burari, Bakkarwala, Ranikhera and Shastri Park process about 5,000 metric tons a day, with Burari alone at 2,000. The Tehkhand plant adds 1,000 metric tons a day by December 2026. Nearby, Re Sustainability runs the authorized 300-ton-a-day plant in Noida, and Gurugram's Basai plant handles about 300 metric tons a day.
South India grows on Bengaluru and Hyderabad contracts
South India held 24.0% of 2025 value and grows at 6.18% a year, the second-largest zone. Bengaluru has approved 1,750 metric tons a day at Kannur and Chikkajala and added three 750-ton-a-day plants in December 2025. Chennai removed about 3.51 lakh metric tons of debris in 2025, DT Next reported, though its two plants sat idle from January to July 2025. Hyderabad's Jeedimetla plant, opened by Ramky Enviro Engineers with the city corporation in November 2020, processes 500 metric tons a day and makes paver blocks and kerb stones.
West India grows on Ahmedabad, Mumbai and Surat plants
West India held 23.0% of 2025 value and grows at 6.08% a year. Ahmedabad runs a 1,000-ton-a-day plant with a private partner and had recycled 1.67 million metric tons since 2015, Gujarat Samachar reported, with a second plant at Gyaspur under construction. Mumbai processes about 1,200 metric tons a day at Dahisar and Diaghar and plans a 1,000-ton-a-day plant at Deonar, as real estate redevelopment lifts debris volumes. Surat's Kosad plant has run under a PPP model since 2018.
East India builds on Kolkata's wet processing plant
East India held 11.0% of 2025 value and grows at 6.28% a year, slightly faster than the national rate. The New Town plant run by Re Sustainability with the Kolkata Municipal Corporation can take 1,600 metric tons a day, one of the largest in the country. Odisha generated about 455 metric tons a day in 2022-23, according to a Council on Energy, Environment and Water estimate cited by Citizen consumer and civic Action Group. Most other cities in the zone still send debris to landfills.
Central India gains as Bhopal and Raipur add plants
Central India held 6.0% of 2025 value and grows at 6.58% a year, among the fastest zones. In Raipur, a C&D plant opened at Hirapur Jarwai in April 2023 that makes paver blocks, tiles and drain covers, Drishti IAS reported. In Bhopal, the city runs a plant at Kolar and planned a second unit in November 2024, according to Free Press Journal. Plants in Bhopal and Raipur are smaller than metro units, so volume growth comes from new sites rather than larger ones.
Northeast India starts from the smallest base
Northeast India held 1.0% of 2025 value and grows at 7.18% a year, the fastest rate of any zone. Guwahati launched a debris pick-up service in October 2023 but had no processing plant, The Assam Tribune reported, although the Swachh Bharat Mission requires one. Debris volumes in hill cities are smaller than in the plains. Growth therefore stays small in absolute terms, since the zone starts from very few licensed sites.
Concessions, mandates and new plants, 2025 to 2026
| Development | Status and market relevance |
|---|---|
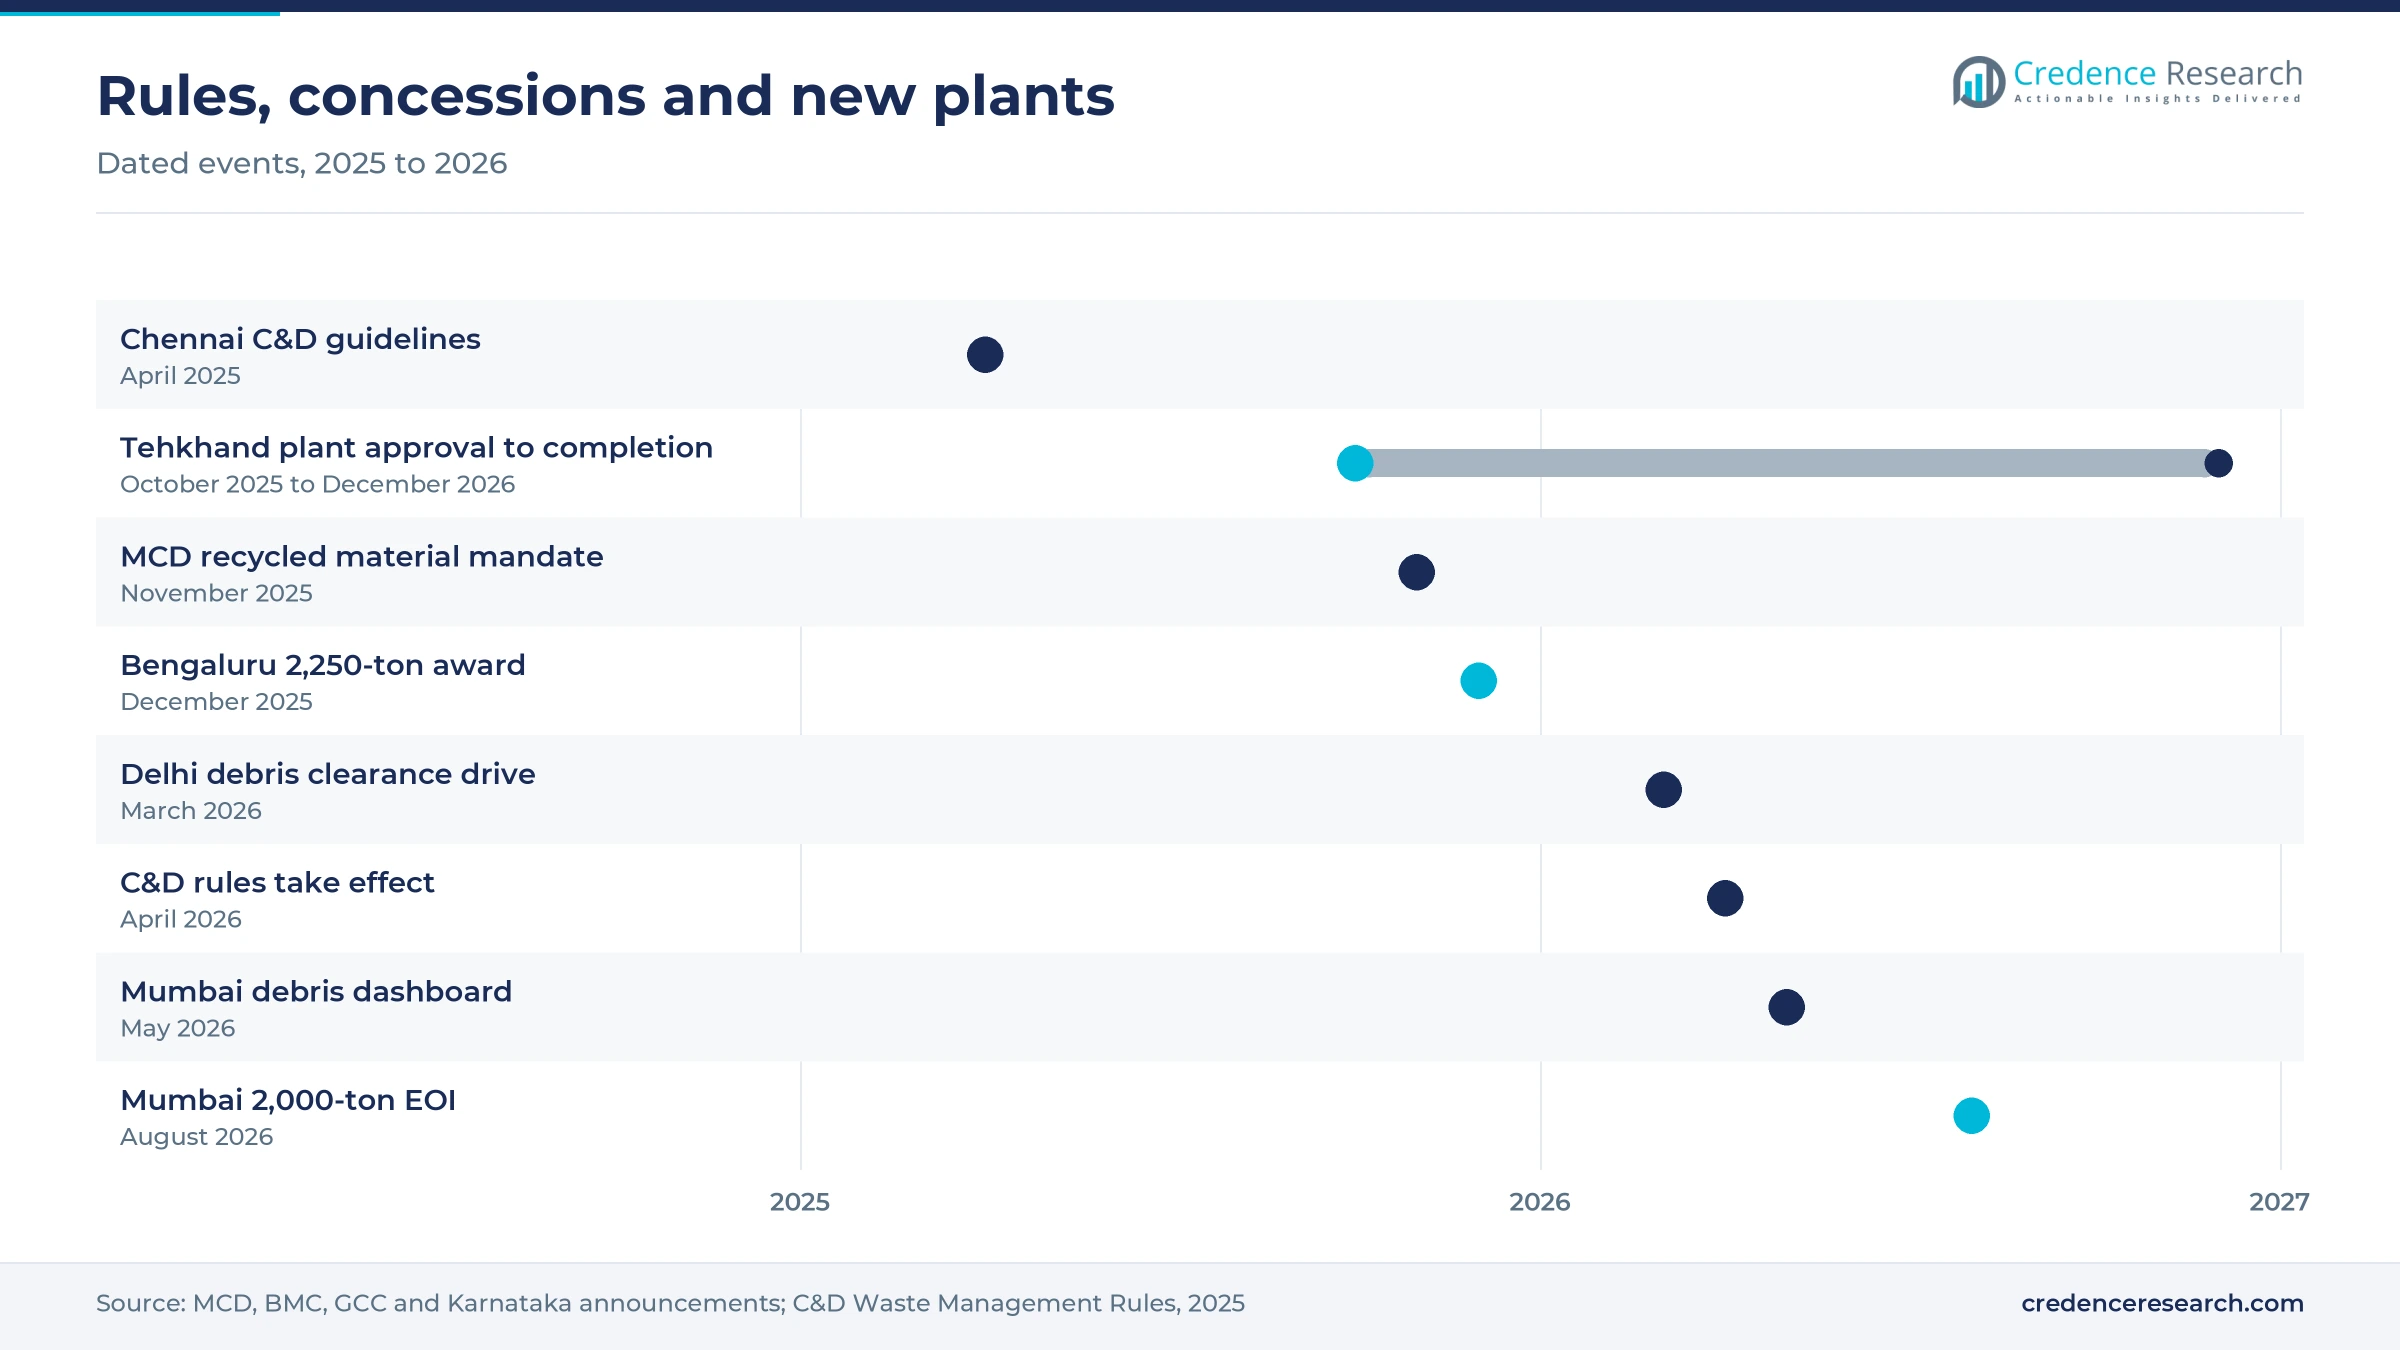
| In October 2025, the Municipal Corporation of Delhi approved a 1,000-ton-a-day C&D plant at Tehkhand, expandable to 2,000 metric tons a day. | Under construction; completion targeted for December 2026 |
| In December 2025, Karnataka issued the appointment order for Chaitra Civil Ventures to build and run three 750-ton-a-day plants in Bengaluru. | Awarded; Rs 1,714 crore over 15 years on a DBFOT basis |
| In April 2026, the Construction and Demolition Waste Management Rules, 2025 took effect, with recycling and reuse targets for bulk producers. | In force; reuse of processed material starts at 5% in 2026-27 |
| In May 2026, the Brihanmumbai Municipal Corporation launched a digital dashboard and vehicle tracking for construction debris. | Live; Rs 25,000 fine for each illegal dumping incident |
| In August 2026, the Brihanmumbai Municipal Corporation invited private partners to add about 2,000 metric tons a day of processing capacity. | Expression of interest stage; PPP or DBFOT model to be fixed in the RFP |
Wet washing, sorting and tracking lift product quality
- Wet processing washes and screens crushed debris into clean sand and graded stone, as at the 1,600-ton-a-day New Town plant in Kolkata.
- Multi-size screening splits output into 10 mm, 20 mm and 40 mm aggregates, which lets plants such as Ahmedabad match demand from road, concrete and fill buyers.
- Precast block lines turn fines and aggregates into paver blocks, kerb stones and tiles, which earn more per metric ton than loose fill.
- GPS vehicle tracking records each debris trip, which Mumbai made mandatory with a Rs 25,000 fine for untracked vehicles in May 2026.
Need a Custom Version of This Report?
Tailor the scope, geography, or segments to your exact requirements.
- Custom geography or segment scope
- Direct access to our analyst team
Concession holders compete for long city contracts
Competition in Indian C&D waste recycling centers on long municipal concessions rather than open product markets. Operators bid on tipping fees, land use and processing capacity, and Bengaluru's 2025 awards went to a single bidder, Chaitra Civil Ventures, at Rs 765 to Rs 967 a metric ton. Re Sustainability runs plants in Kolkata and Noida under PPP terms, while IL&FS Environmental Infrastructure & Services built Delhi's first plants at Burari and Shastri Park with technology from CDE Asia. EverEnviro Resource Management operates the 2,000-ton-a-day Burari facility, which makes aggregates, bricks, pavers and tiles. Municipal bodies in Mumbai, Ahmedabad and Surat also run plants directly or with private partners. Winners combine assured debris supply, washing lines that yield sand, and contracts that bind city agencies to buy recycled products.
Companies profiled and their roles in this market
| Company | Type | Role in the market |
|---|---|---|
| Re Sustainability | PPP plant operator | 1,600-ton-a-day New Town plant in Kolkata; authorized Noida plant |
| IL&FS Environmental Infrastructure & Services | PPP plant operator | Built and ran Delhi's first plants at Burari and Shastri Park |
| EverEnviro Resource Management | PPP plant operator | 2,000-ton-a-day Burari facility making aggregates, bricks and pavers |
| Chaitra Civil Ventures | Concession holder | Bengaluru packages for 1,750 plus 2,250 metric tons a day over 15 years |
| CDE Asia | Technology supplier | Wet processing equipment for the first Delhi plants |
| Municipal operators | City-run plants | BMC plants at Dahisar and Diaghar; AMC and SMC plants with private partners |
Bundled contracts with assured offtake will win share
Credence Research's view is that C&D waste recycling operators with bundled collection contracts and assured offtake will take share as the market grows from USD 230.0 million through 2035. The 2025 rules give plants a legal supply of debris from April 2026, yet weak public buying, with only about 13% of the 2025-26 use target met by February 2026, still holds back product income. Plants that wash fines into sand and make pavers earn more per metric ton than those selling fill. Private plants grow fastest at 6.91% a year, so builder-led demand becomes a larger part of income by 2035.
How the plant revenue model was built
The report uses 2025 as the base year and forecasts to 2035. Market values come from the Credence Research model, built bottom-up from an estimate of operating plant capacity, utilization, tipping and processing fees, and the value of recycled products sold. Regional, output, model and city splits are Credence Research estimates. Inputs include national rules and their reported targets, municipal contract awards and tenders reported in the press, World Bank urban population data, government press releases, company announcements and local news. The report did not conduct interviews or surveys, and it relies only on published sources.
Reuse targets carry plant growth through 2035
Through 2035 the C&D waste recycling market grows at a 6.00% CAGR to reach USD 411.9 million, as reuse targets climb to 25% by 2030-31 and large cities sign long processing concessions. North India keeps the lead on Delhi's plant network, while Central and Northeast India grow fastest from small bases. By 2035, M-sand and precast products will take a larger share of output as wet plants spread. Code revisions that allow more recycled aggregate in structural concrete would lift product prices, and digital tracking should move more debris from open dumps into licensed plants.
Frequently Asked Questions
How big is the India construction demolition waste recycling market?
Which region leads the market?
Which output holds the largest share?
Which output grows fastest?
What do the 2025 C&D waste rules require?
Which companies are active in the market?
What are the main challenges for recyclers?
How much do cities pay recyclers?
Table of Content
Chapter 1 Market Segmentation
- 1.1 Segmentation Framework
- 1.1.1 Product and Service Classification
- 1.1.2 Application and End-Use Classification
- 1.1.3 Technology and Solution Classification
- 1.1.4 Customer and Distribution Channel Classification
- 1.1.5 Geographic Segmentation
- 1.1.6 Market Segment Definitions and Boundaries
- 1.2 By Output
- 1.2.1 Recycled Aggregates
- 1.2.2 M-Sand
- 1.2.3 Bricks and Pavers
- 1.3 By Model
- 1.3.1 Municipal PPP
- 1.3.2 Private
- 1.4 By City
- 1.4.1 Delhi
- 1.4.2 Ahmedabad
- 1.4.3 Bengaluru
- 1.4.4 Others
Chapter 2 Introduction
- 2.1 Report Objectives and Scope
- 2.2 Product Definition and Industry Terminology
- 2.3 Market Inclusions and Exclusions
- 2.4 Research Process
- 2.4.1 Primary Research and Expert Interviews
- 2.4.2 Secondary Research and Source Review
- 2.4.3 Top-Down and Bottom-Up Estimation
- 2.4.4 Data Triangulation and Verification
- 2.5 Market Size Measurement Basis
- 2.5.1 2025: USD 230.0 million → 2035: USD 411.9 million
- 2.6 Historical and Forecast Reference Periods
- 2.6.1 Historical Period: 2018-2025
- 2.6.2 Base Year: 2025
- 2.6.3 Forecast Period: 2025-2035
- 2.7 Research Assumptions and Limitations
Chapter 3 Executive Summary
- 3.1 Market Snapshot and Key Findings
- 3.2 Base-Year Market Size, 2025
- 3.3 Forecast Market Size, 2035
- 3.4 Revenue and Volume Growth Outlook
- 3.5 Key Demand and Supply Indicators
- 3.6 Leading Market Segments
- 3.7 Fastest-Growing Market Opportunities
- 3.8 Regional Performance Highlights
- 3.9 Technology and Industry Transformation
- 3.10 Competitive Landscape Summary
- 3.11 Analyst View and Strategic Implications
Chapter 4 India Construction Demolition Waste Recycling Market Trends and Developments
- 4.1 Historical Industry Development, 2018-2025
- 4.2 Recent Market Trends and Developments
- 4.3 Demand and Customer Behavior Trends
- 4.4 Technology and Product Innovation
- 4.5 Artificial Intelligence, Automation and Digitalization
- 4.6 Local Manufacturing and Supply Chain Realignment
- 4.7 Industry Partnerships, Mergers and Acquisitions
- 4.8 Sustainability and Circular Economy Developments
- 4.9 Government and Private Sector Investment Trends
- 4.10 Emerging Business Models and Commercialization
- 4.11 Industry Developments and Announcements
Chapter 5 India Construction Demolition Waste Recycling Market Production, Supply and Demand Analysis
- 5.1 Demand Trend and Consumption Analysis, 2018-2025
- 5.2 Demand Forecast, 2025-2035
- 5.3 Production and Output Trend, 2018-2025
- 5.4 Production and Output Forecast, 2025-2035
- 5.5 Installed Capacity and Capacity Utilization
- 5.6 Company-Wise Production Plants and Statistics
- 5.6.1 Installed Production Capacity
- 5.6.2 Actual Production
- 5.6.3 Planned Capacity and Expansion Targets
- 5.7 Supply Chain Structure and Procurement Trends
- 5.8 Supply-Demand Gap and Bottlenecks
- 5.9 Import Dependence and Sourcing Structure
- 5.10 Contract Manufacturing and Outsourcing
- 5.11 Regional Supply and Demand Concentration
Chapter 6 India Construction Demolition Waste Recycling Market Pricing Analysis
- 6.1 Pricing Structure and Measurement
- 6.2 Historical Pricing Trends, 2018-2025
- 6.3 Pricing Outlook, 2025-2035
- 6.4 Average Selling Price and Unit Economics
- 6.5 Pricing by Product and Market Segment
- 6.6 Geographic Pricing Differences
- 6.7 Key Input, Energy, Labor and Logistics Costs
- 6.8 Contract Pricing and Purchasing Models
- 6.9 Pricing Sensitivity and Competitive Positioning
- 6.10 Price, Margin and Profitability Implications
Chapter 7 India Construction Demolition Waste Recycling Market Dynamics
- 7.1 Market Growth Drivers
- 7.1.1 Demand-Side Drivers
- 7.1.2 Technology and Innovation Drivers
- 7.1.3 Infrastructure and Investment Drivers
- 7.1.4 Regulatory and Policy Drivers
- 7.2 Market Restraints
- 7.2.1 Cost and Affordability Constraints
- 7.2.2 Technology and Adoption Barriers
- 7.2.3 Supply Chain and Operational Constraints
- 7.3 Market Challenges
- 7.3.1 Competitive Pressure and Margin Erosion
- 7.3.2 Skills, Infrastructure and Implementation Gaps
- 7.4 Emerging Market Opportunities
- 7.5 Market Dynamics Impact and Time-Horizon Assessment
Chapter 8 India Construction Demolition Waste Recycling Value Chain Analysis
- 8.1 Industry Value Chain Overview
- 8.2 Upstream Suppliers and Critical Inputs
- 8.3 Technology and Component Providers
- 8.4 Manufacturing or Service Delivery
- 8.5 Distribution, Channel Partners and Integrators
- 8.6 Downstream Applications and End Users
- 8.7 Value Addition and Profit Pools
- 8.8 Vertical Integration and Outsourcing
- 8.9 Supplier Concentration and Risk
- 8.10 Supply Chain Localization and Resilience
Chapter 9 India Construction Demolition Waste Recycling Market Regulations and Policies
- 9.1 Relevant Laws, Standards and Compliance Frameworks
- 9.2 Product, Service, Safety and Quality Requirements
- 9.3 Government Policies, Incentives and Subsidies
- 9.4 Imports, Exports and Trade Barriers
- 9.5 Public Procurement and Local Content Requirements
- 9.6 Environmental and Sustainability Compliance
- 9.7 Upcoming Policy Changes and Market Implications
Chapter 10 India Construction Demolition Waste Recycling Market Hotspots and Opportunities
- 10.1 Market Opportunity Mapping and Growth Hotspots
- 10.2 High-Growth Applications and Customer Groups
- 10.3 Underserved Markets and White-Space Opportunities
- 10.4 Emerging Technology and Product Opportunities
- 10.5 New Capacity and Investment Hotspots
- 10.6 Market Entry and Expansion Opportunities
- 10.7 Distribution and Partnership Opportunities
- 10.8 Near-Term and Long-Term Commercial Potential
- 10.9 Opportunity Attractiveness and Execution Risks
Chapter 11 India Construction Demolition Waste Recycling Market Outlook, 2025-2035
- 11.1 Market Size and Analysis
- 11.1.1 Revenue (Market Measurement: 2025: USD 230.0 million → 2035: USD 411.9 million)
- 11.1.2 Market Volume and Quantity Sold
- 11.1.3 Historical Market Size, 2018-2025
- 11.1.4 Base-Year Market Size, 2025
- 11.2 Market Forecast, 2025-2035
- 11.2.1 Revenue Forecast to 2035
- 11.2.2 Volume Forecast to 2035
- 11.2.3 CAGR and Year-on-Year Growth
- 11.2.4 Incremental Revenue Opportunity
- 11.3 Forecast Assumptions and Scenario Analysis
- 11.3.1 Base-Case Forecast
- 11.3.2 Optimistic and Conservative Scenarios
- 11.3.3 Technology, Pricing and Policy Sensitivities
- 11.4 Market Attractiveness and Growth Outlook
Chapter 12 India Construction Demolition Waste Recycling Market Segmentation and Outlook
- 12.1 Segmentation Summary and Market Shares, 2025
- 12.2 Largest and Fastest-Growing Segments
- 12.3 By Output - Market Size and Forecast, 2025-2035
- 12.3.1 Segment Definition and Scope
- 12.3.2 Historical Market Size, 2018-2025
- 12.3.3 Revenue Forecast, 2025-2035
- 12.3.4 Volume Forecast, 2025-2035
- 12.3.5 Base-Year Market Share, 2025
- 12.3.6 Segment CAGR and Growth Drivers
- 12.3.7 Subsegment Market Size and Forecast
- 12.3.7.1 Recycled Aggregates
- 12.3.7.2 M-Sand
- 12.3.7.3 Bricks and Pavers
- 12.3.8 Subsegment Pricing and Adoption Trends
- 12.3.9 Leading Suppliers and Competition
- 12.3.10 Regional Demand and Opportunities
- 12.4 By Model - Market Size and Forecast, 2025-2035
- 12.4.1 Segment Definition and Scope
- 12.4.2 Historical Market Size, 2018-2025
- 12.4.3 Revenue Forecast, 2025-2035
- 12.4.4 Volume Forecast, 2025-2035
- 12.4.5 Base-Year Market Share, 2025
- 12.4.6 Segment CAGR and Growth Drivers
- 12.4.7 Subsegment Market Size and Forecast
- 12.4.7.1 Municipal PPP
- 12.4.7.2 Private
- 12.4.8 Subsegment Pricing and Adoption Trends
- 12.4.9 Leading Suppliers and Competition
- 12.4.10 Regional Demand and Opportunities
- 12.5 By City - Market Size and Forecast, 2025-2035
- 12.5.1 Segment Definition and Scope
- 12.5.2 Historical Market Size, 2018-2025
- 12.5.3 Revenue Forecast, 2025-2035
- 12.5.4 Volume Forecast, 2025-2035
- 12.5.5 Base-Year Market Share, 2025
- 12.5.6 Segment CAGR and Growth Drivers
- 12.5.7 Subsegment Market Size and Forecast
- 12.5.7.1 Delhi
- 12.5.7.2 Ahmedabad
- 12.5.7.3 Bengaluru
- 12.5.7.4 Others
- 12.5.8 Subsegment Pricing and Adoption Trends
- 12.5.9 Leading Suppliers and Competition
- 12.5.10 Regional Demand and Opportunities
- 12.6 Segment Growth Comparison
- 12.7 Segment Attractiveness and Priority Matrix
Chapter 13 India Construction Demolition Waste Recycling Geographic Market Outlook, 2025-2035
- 13.1 Domestic Market Distribution and Demand Clusters
- 13.2 State- or Province-Wise Market Size and Forecast, 2025-2035
- 13.3 City and Metropolitan Market Outlook
- 13.4 Industrial, Manufacturing and Commercial Clusters
- 13.5 Geographic Concentration of Key End Users
- 13.6 Local Pricing and Purchasing Differences
- 13.7 Domestic Production Facilities and Capacity Map
- 13.8 Local Infrastructure and Project Pipeline
- 13.9 State-Level Policy and Incentive Differences
- 13.10 Subnational Investment Hotspots and Opportunities
- 13.11 Distribution and Logistics Networks
- 13.12 Domestic Competitive Footprint
Chapter 14 India Construction Demolition Waste Recycling Technology, Innovation and Sustainability Outlook
- 14.1 Technology Landscape and Maturity
- 14.2 Product, Process and Service Innovation
- 14.3 AI, Automation and Digital Tools in the Industry
- 14.4 Technology Adoption and Performance Benchmarking
- 14.5 Innovation Pipeline and R&D Investment
- 14.6 Patent and Intellectual Property Trends
- 14.7 Energy Efficiency and Resource Management
- 14.8 Sustainability, Recycling and Circularity
- 14.9 Technology Roadmap, 2025-2035
- 14.10 Risks of Obsolescence and Technology Substitution
Chapter 15 India Construction Demolition Waste Recycling Market Key Strategic Imperatives
- 15.1 Growth and Market Entry Priorities
- 15.2 High-Return Products and Segments
- 15.3 Pricing, Profitability and Cost Optimization
- 15.4 Technology Investment and Product Differentiation
- 15.5 Supply Chain Localization and Resilience
- 15.6 Distribution and Customer Acquisition
- 15.7 Partnership, Acquisition and Capacity Strategy
- 15.8 Regional Expansion Priorities
- 15.9 Short-, Medium- and Long-Term Actions
Chapter 16 Competition Outlook
- 16.1 Industry Competition Characteristics
- 16.2 Market Structure and Concentration
- 16.3 Market Share and Competitive Positioning, 2025
- 16.4 Company-Wise Revenue and Product Benchmarking
- 16.5 Production and Service Capacity Benchmarking
- 16.6 Technology, Pricing and Differentiation
- 16.7 Regional Footprint and Distribution Strength
- 16.8 Mergers, Acquisitions and Strategic Alliances
- 16.9 New Entrants and Competitive Threats
- 16.10 Porter's Five Forces and Industry Attractiveness
- 16.11 Competitive Outlook, 2025-2035
Chapter 17 Company Profiles
- 17.1 Company Coverage and Selection Criteria
- 17.2 Re Sustainability
- 17.2.1 Business Description
- 17.2.2 Company Ownership and Geographic Presence
- 17.2.3 Product and Service Portfolio
- 17.2.4 Manufacturing and Operating Footprint
- 17.2.5 Production Capacity and Expansion Plans
- 17.2.6 Financial Performance and Investment
- 17.2.7 Market Share and Competitive Position
- 17.2.8 Technology and Innovation Capabilities
- 17.2.9 Strategic Alliances or Partnerships
- 17.2.10 Recent Developments
- 17.2.11 Growth Strategy and Outlook
- 17.3 IL&FS Environmental Infrastructure & Services
- 17.4 EverEnviro Resource Management
- 17.5 Chaitra Civil Ventures
- 17.6 CDE Asia
- 17.7 Municipal operators
- 17.8 Other Relevant Market Participants
Note: Every listed company is profiled on the structure shown under the first company. The company list is preliminary and may change based on research findings, market developments, data availability and client requirements.
Chapter 18 Disclaimer
- 18.1 Research and Forecast Disclaimer
- 18.2 Data Source and Estimation Limitations
Note: The depth of individual sections depends on data availability for this market. Volume, capacity, trade and other unit-based metrics are included where applicable.

