
Leased plants and care contracts bring nature indoors
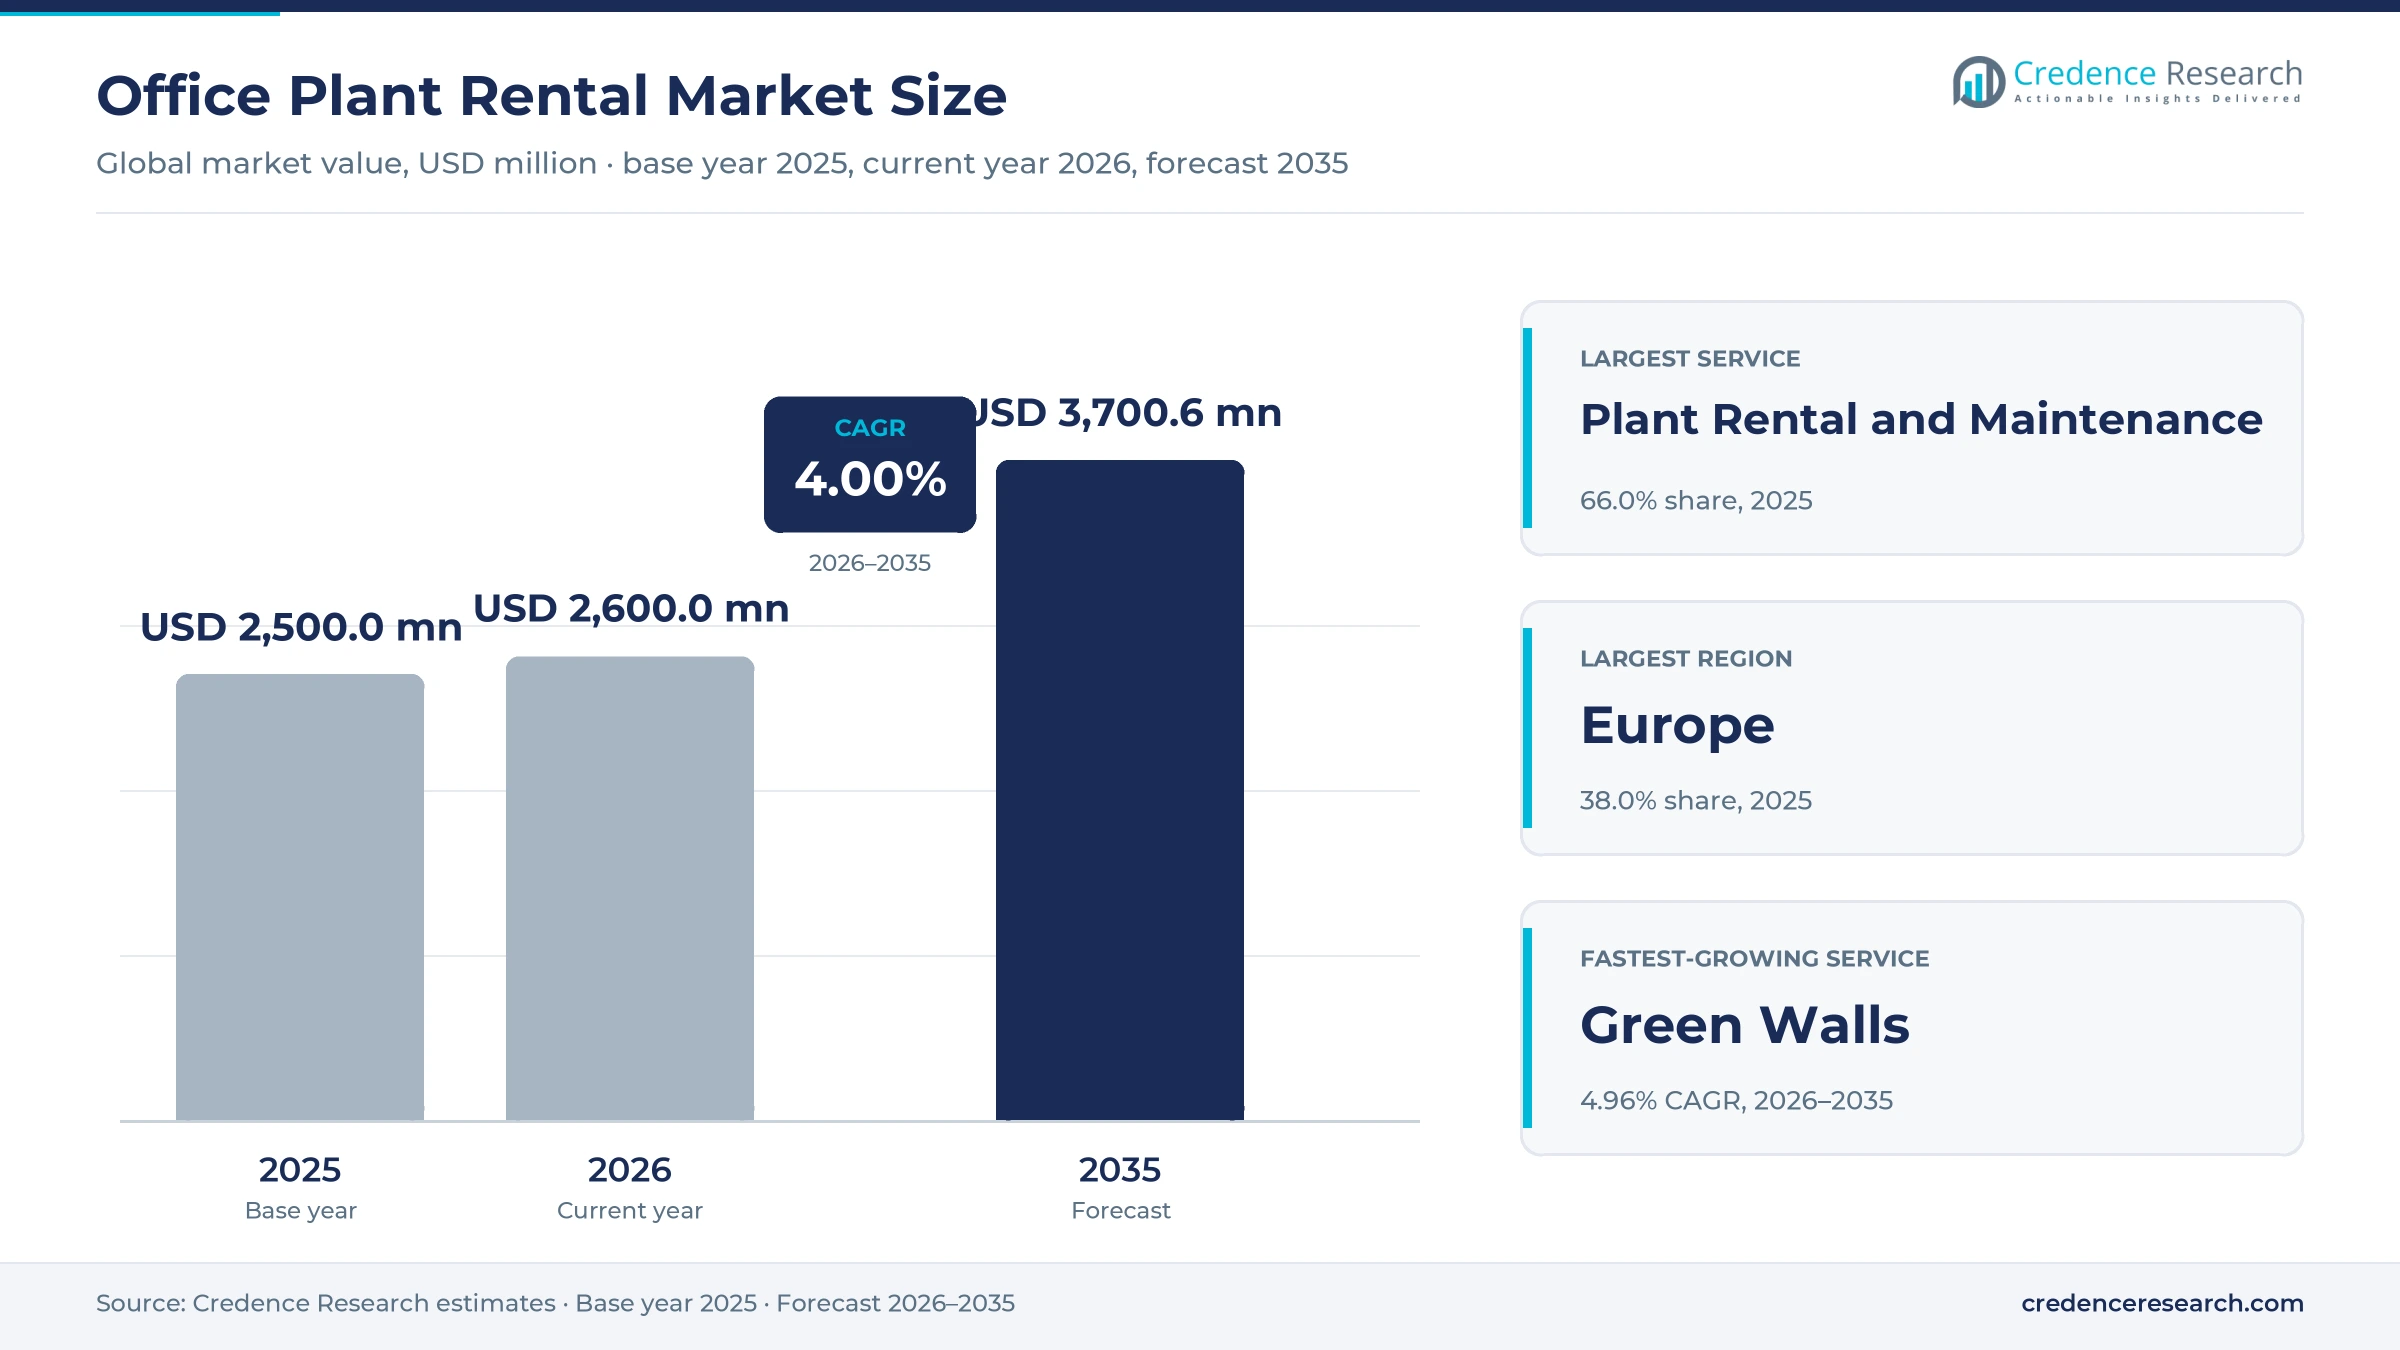
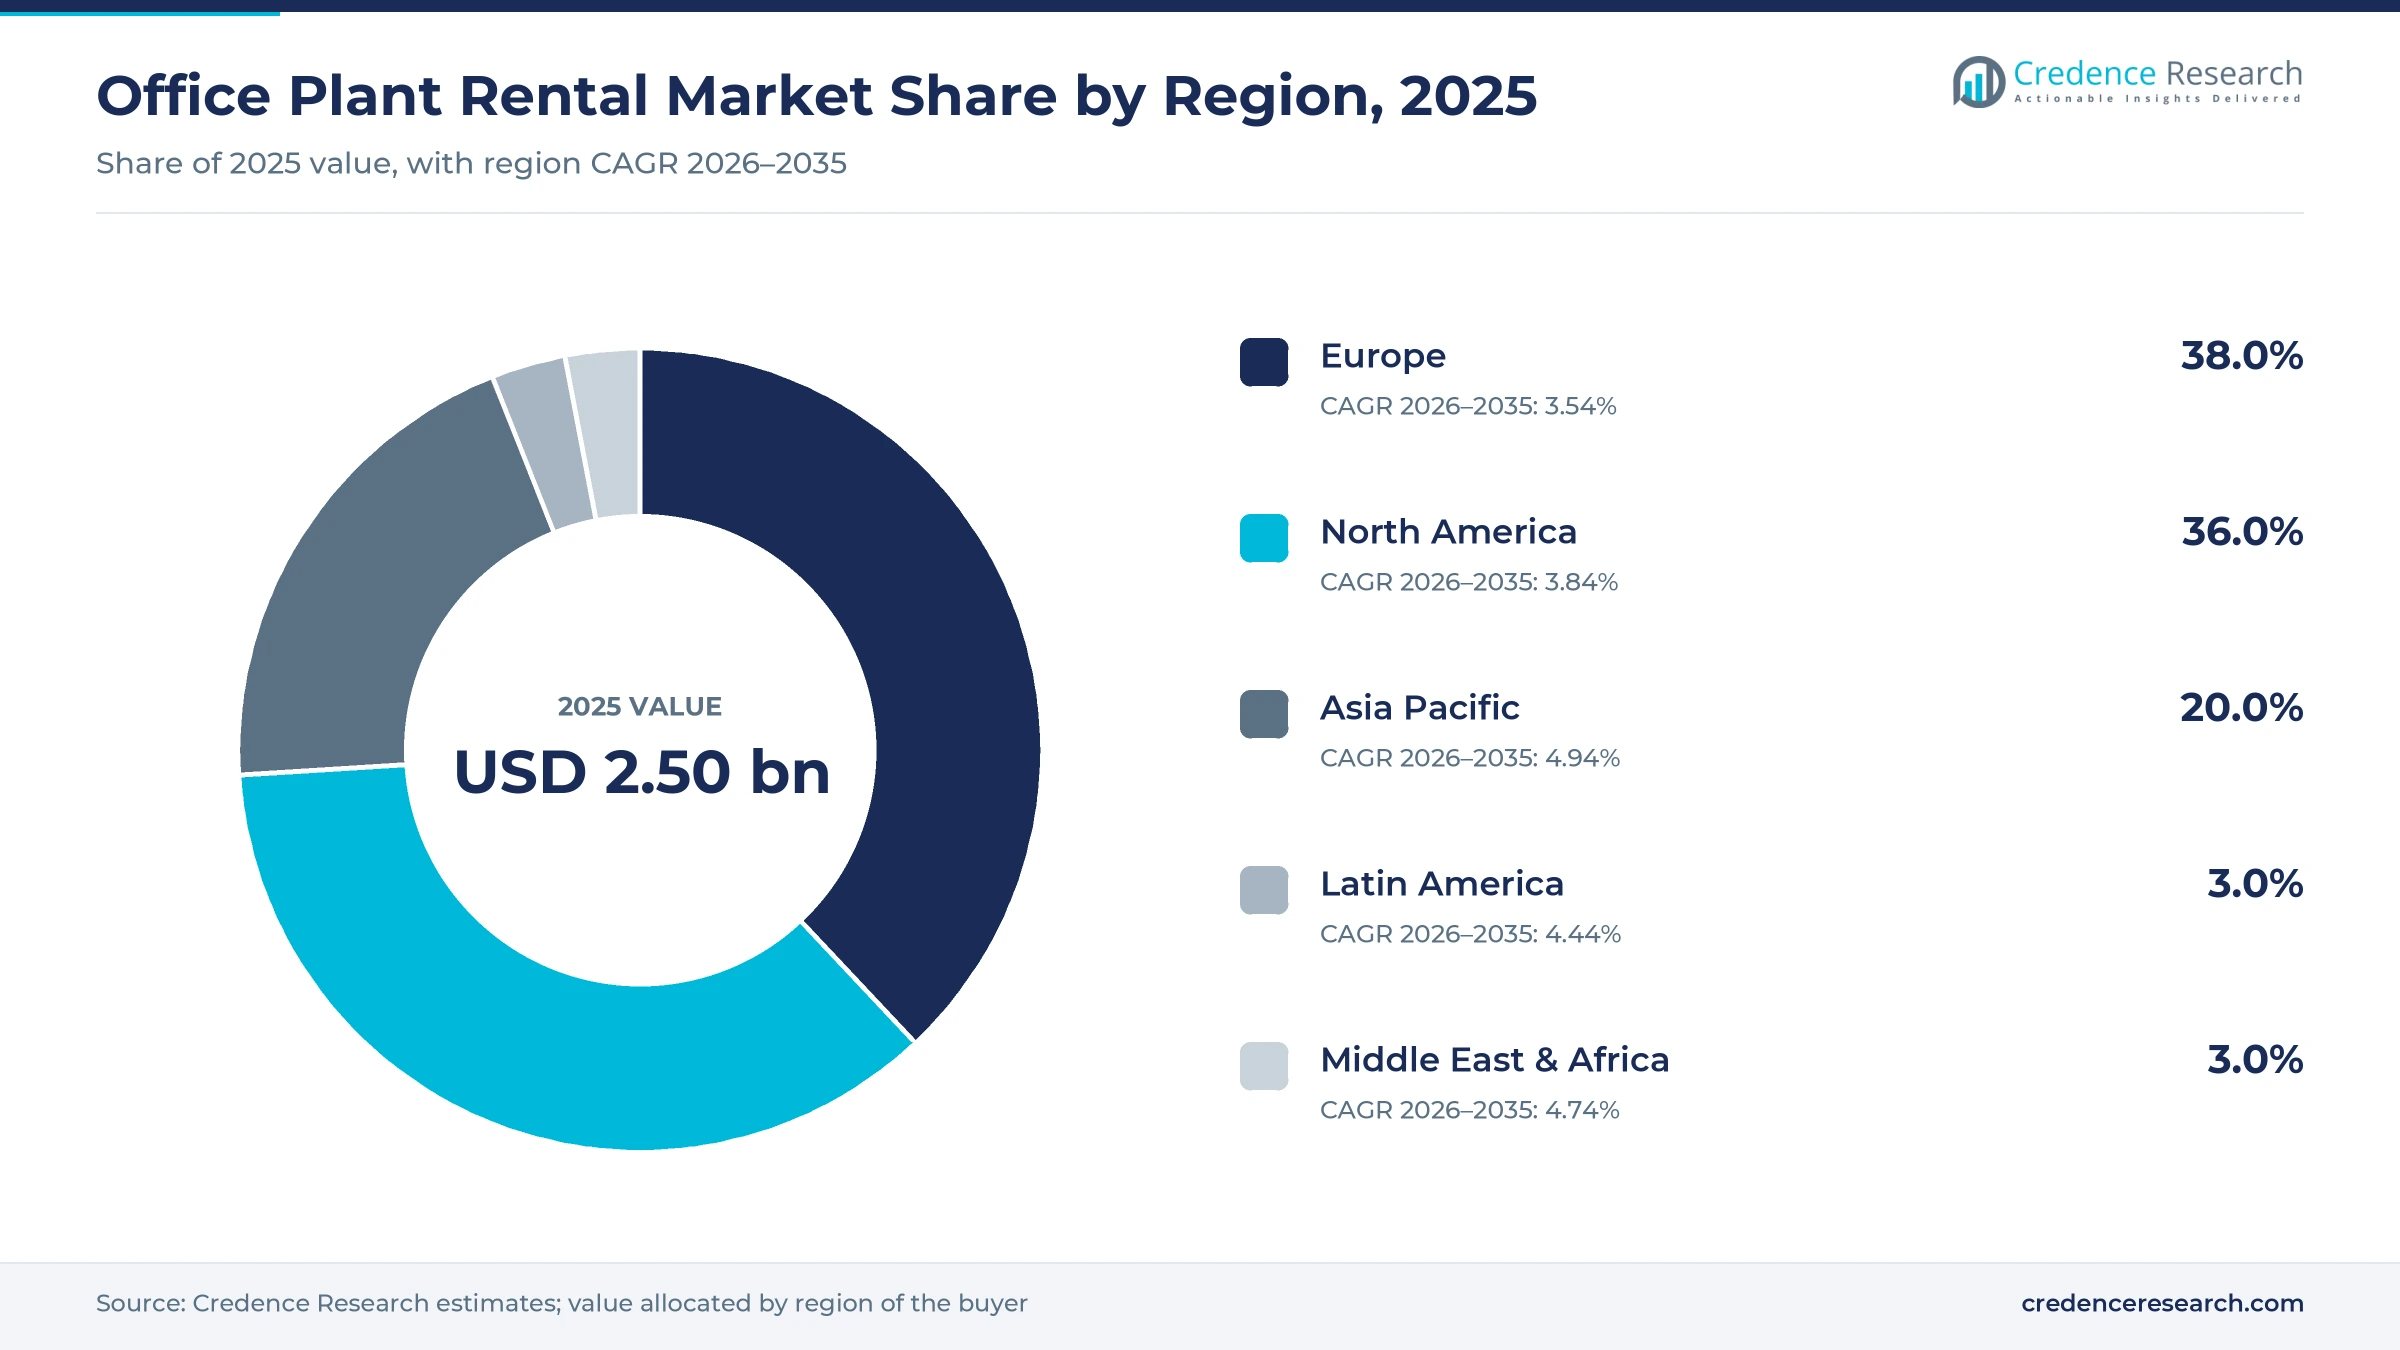
The global office plant rental market was valued at USD 2.50 billion in 2025 and is projected to increase from USD 2.60 billion in 2026 to USD 3.70 billion by 2035, registering a CAGR of 4.00% during 2026–2035. Spending comes from employers, hotel owners and retailers that lease live plants, planters and moss or living walls under contracts that include regular watering, cleaning, pruning and plant swaps by trained technicians. Europe held the largest regional share, 38.0% in 2025, because long-established interior landscaping firms serve dense office districts in the U.K., the Netherlands, France and Germany. Asia Pacific is the fastest-growing region at 4.94% a year, as record office leasing in India and very low vacancy in central Tokyo add new fitted floors. On the commercial side, leading providers are buying local interiorscape firms to add route density, and green walls are moving from one-off projects into multiyear maintenance contracts that also cover seasonal holiday decor.
What does the office plant rental market count, and what does it leave out?
The market counts fees paid for leased interior plants and planters, scheduled plant care, replacement guarantees, installed and maintained green or moss walls, and rented seasonal decor such as holiday trees and displays. Buyers are offices, hotels and retail sites that sign annual or multiyear service agreements, and the provider usually keeps ownership of the plants.
The scope excludes plants sold outright through garden centers or online shops, exterior grounds maintenance, artificial plants bought without a service contract and the scenting services some providers also sell. The value chain runs from growers and auctions through interiorscape firms and their technicians to facility managers and workplace teams.
Office Plant Rental Market Insights
- The office plant rental market grows from USD 2.50 billion in 2025 to USD 3.70 billion by 2035 at a 4.00% CAGR, as employers and hotels lease living walls.
- Europe held 38.0% of 2025 value, and Rentokil Initial said in its 2025 annual report that its U.K. growth was driven by its pest control and plants businesses.
- Plant Rental and Maintenance led with 66.0% of 2025 value, because most providers keep ownership of the plants and bill clients through annual service contracts.
- Ambius bought two Austin, Texas, plantscape firms in September 2025, Creative Plant Designs and Plant Management Associates, adding rental and seasonal decorating programs.
- London asks predominantly commercial schemes to reach an Urban Greening Factor score of 0.3, and it scores a green wall at 0.6 per square meter.
Rental and care lead while green walls grow fastest
Why do rental and care contracts lead spending?
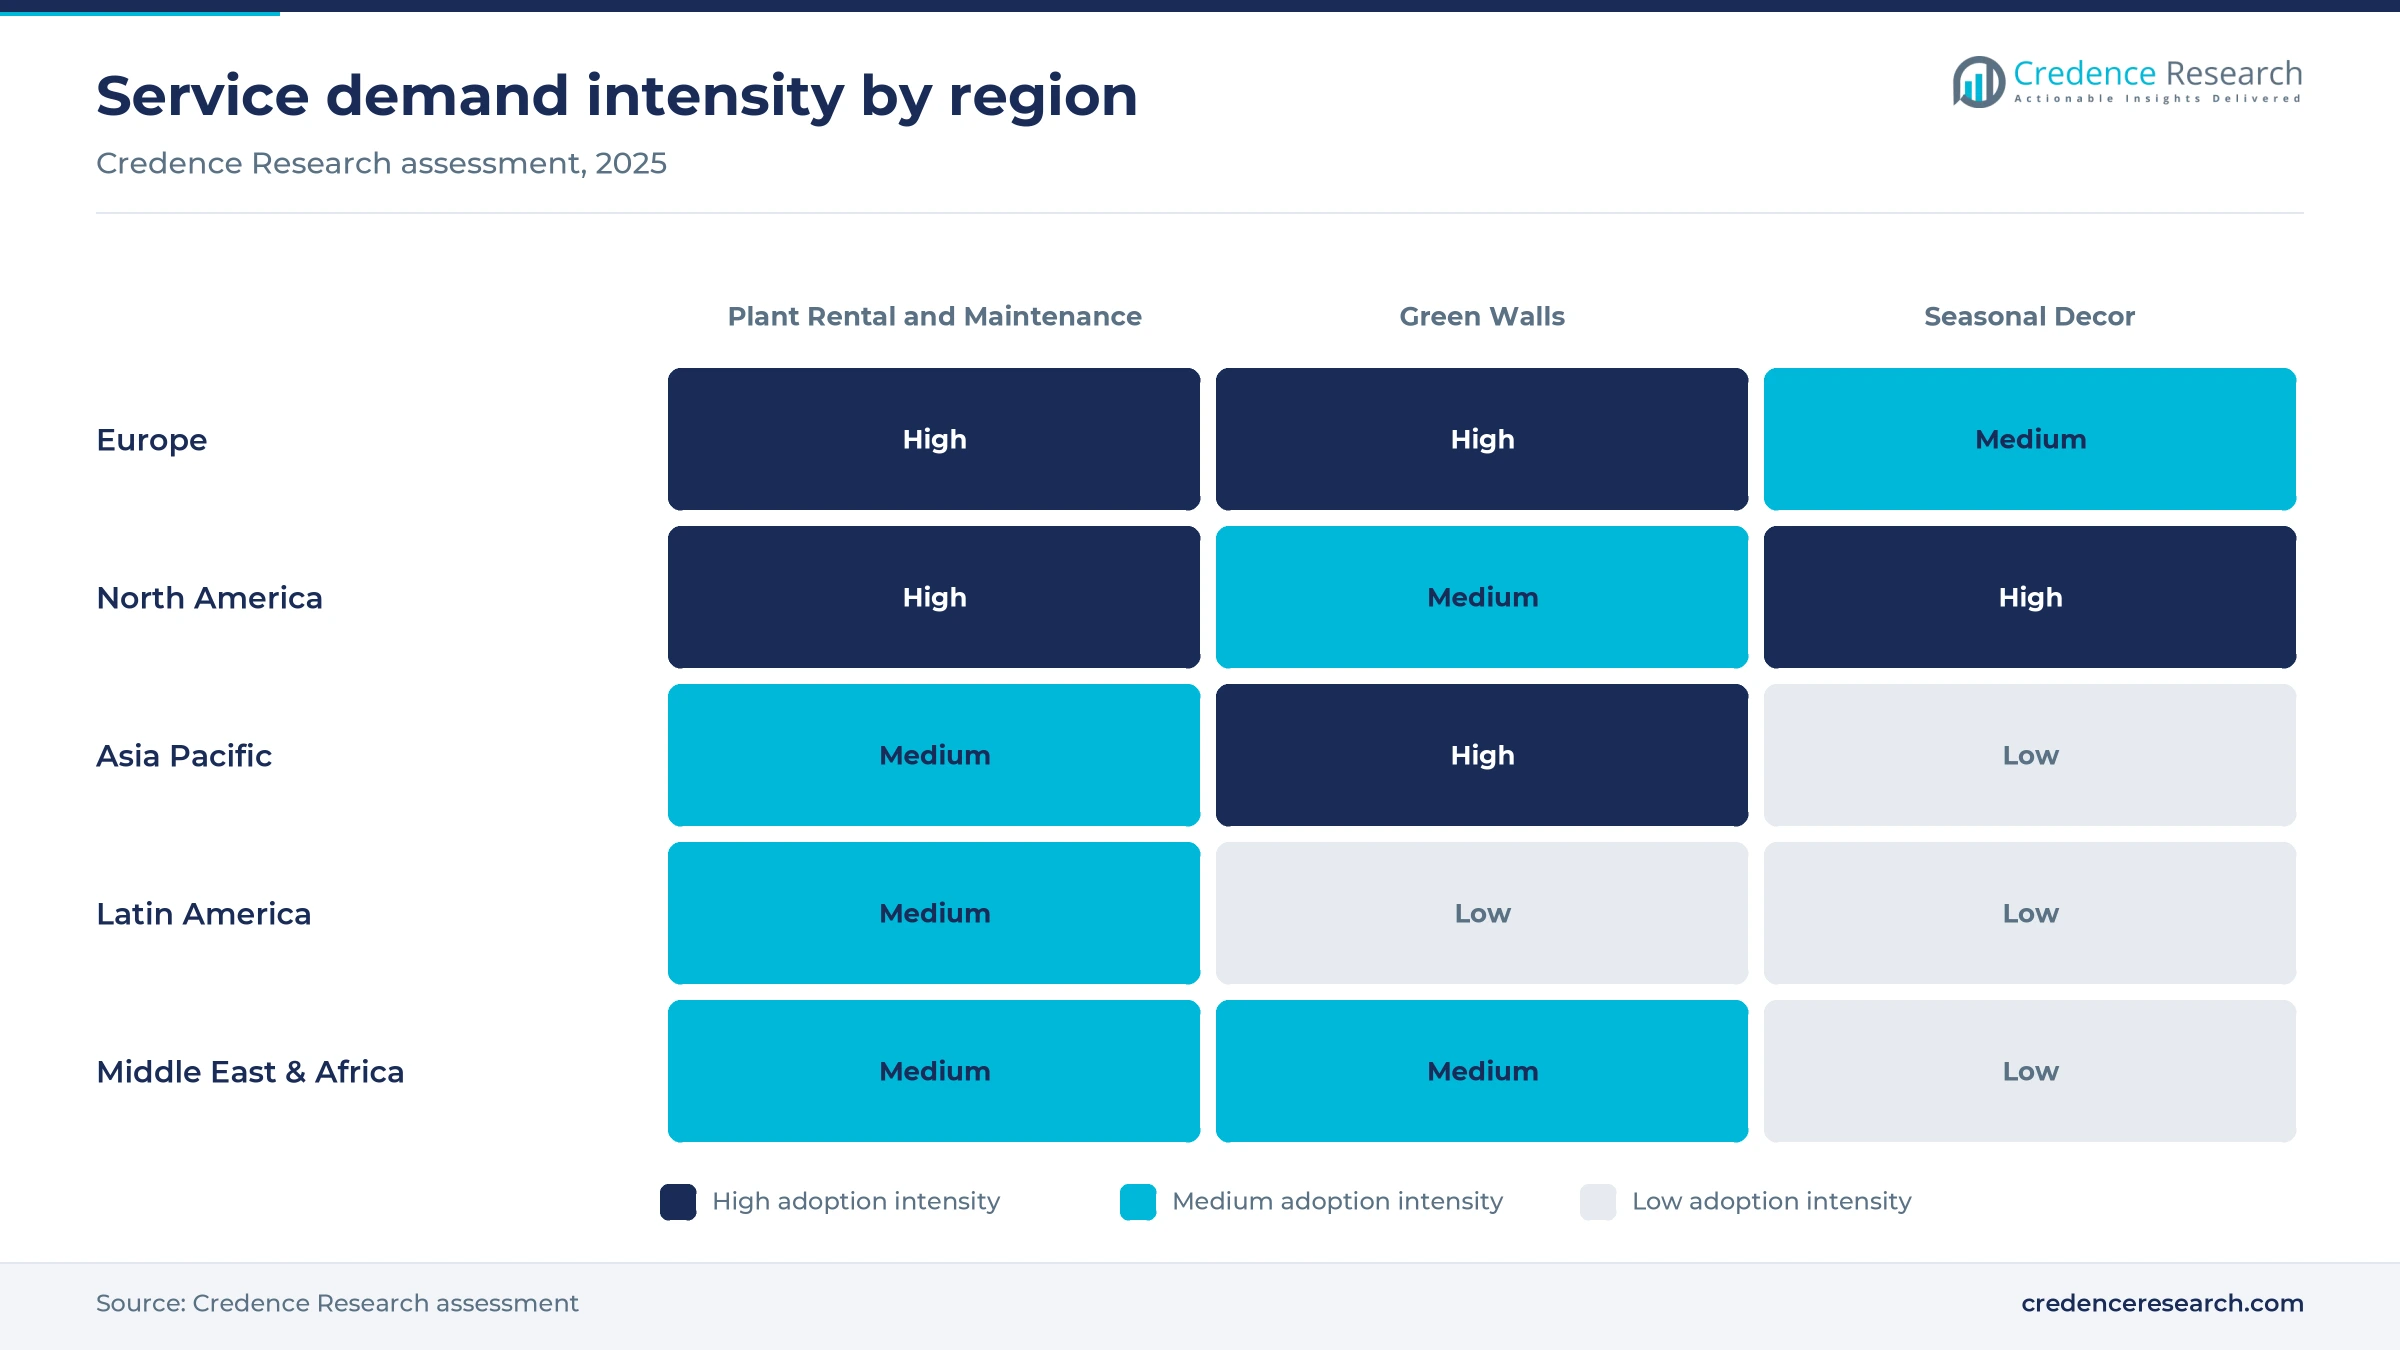
Based on service, the market is categorized into plant rental and maintenance, green walls and seasonal decor. Plant Rental and Maintenance led with 66.0% of 2025 value because providers keep the plants on their own books and bill a recurring fee, and Rentokil Initial's 2025 annual report describes interior landscaping contracts as the supply and maintenance of plants that stay under its control. Green Walls grow fastest at 4.96% a year, as London's Urban Greening Factor guidance scores a green wall at 0.6 per square meter and Pure DC began a 7,400-square-meter living wall in North London in January 2025. Seasonal decor adds winter income through rented holiday trees and displays.
Why do offices remain the core client group?
Based on client, the market is categorized into offices, hotels and retail. Offices led with 61.0% of 2025 value because workplace standards now reward greenery, and the International WELL Building Institute counted more than 5 billion square feet of space using WELL in 130 countries in March 2024. Hotels grow fastest at 4.69% a year, as hotel pipeline data forecasts 2,617 new hotel openings with 389,175 rooms worldwide in 2026, and each new lobby and restaurant needs a plant scheme. Retail clients buy mainly holiday displays, which Ambius packages as standard programs for chains with multiple locations.
| Segment Group | Leading Sub-segment | Share, 2025 | Fastest-growing Sub-segment | CAGR, 2026–2035 |
|---|---|---|---|---|
| By Service | Plant Rental and Maintenance | 66.0% | Green Walls | 4.96% |
| By Client | Offices | 61.0% | Hotels | 4.69% |
Request a Free Sample
Fill in your details and we'll send you a free sample report.
- Sample data tables & charts
- Research methodology
Wellness budgets and care contracts lift spending
Employers fund workplace greenery and interior wellness
Employers are paying for greenery as part of workplace wellness programs, which turns plants from decoration into a budgeted facilities line. The International WELL Building Institute said in March 2024 that WELL was used across more than 5 billion square feet of space in 130 countries. Its streamlined LEED and WELL pathway reached nearly 250 million square feet across 766 projects in 47 countries by June 2025, according to Green Plants for Green Buildings. Attendance is also recovering, as the Kastle Systems barometer put New York City at 72.2% in the week of Oct. 27, 2026, its highest since March 2020. Spending on corporate wellness therefore reaches the plants on each floor, and in the Credence Research model this adds about 1.56 percentage points to annual growth to 2035.
Outsourced plant care contracts lock in recurring income
Outsourced care contracts give providers recurring income, because clients pay for the plants, their upkeep and their replacement in one fee. Rentokil Initial's 2025 annual report states that most customers contract on an annual basis, and it adds that Ambius maintains only plants it supplied, so the service and the asset stay together. The same report credits its U.K. plants business with part of the region's growth in 2025. Ambius bought Creative Plant Designs and Plant Management Associates in Austin on Sept. 22, 2025, both firms with leasing and rental programs built over more than 35 years. These contracts sit inside wider facility management services budgets, and in the Credence Research model they add about 1.08 percentage points to annual growth.
Biophilic redesigns and green walls widen the service scope
Biophilic redesigns are widening each contract from floor plants to living walls, moss panels and planted dividers that need specialist care. London Plan guidance sets an Urban Greening Factor target of 0.3 for predominantly commercial schemes and scores a modular green wall at 0.6, which pushes developers toward vertical planting. Singapore's Skyrise Greenery Incentive Scheme covers up to 50% of installation costs, capped at S$500 per square meter for vertical greenery, and was extended in March 2023 to the end of March 2026. Pure DC began a 7,400-square-meter wall with more than 750,000 plants in January 2025. In the Credence Research model this adds about 0.72 percentage points to annual growth to 2035.
Record hotel pipelines add new lobbies to plant
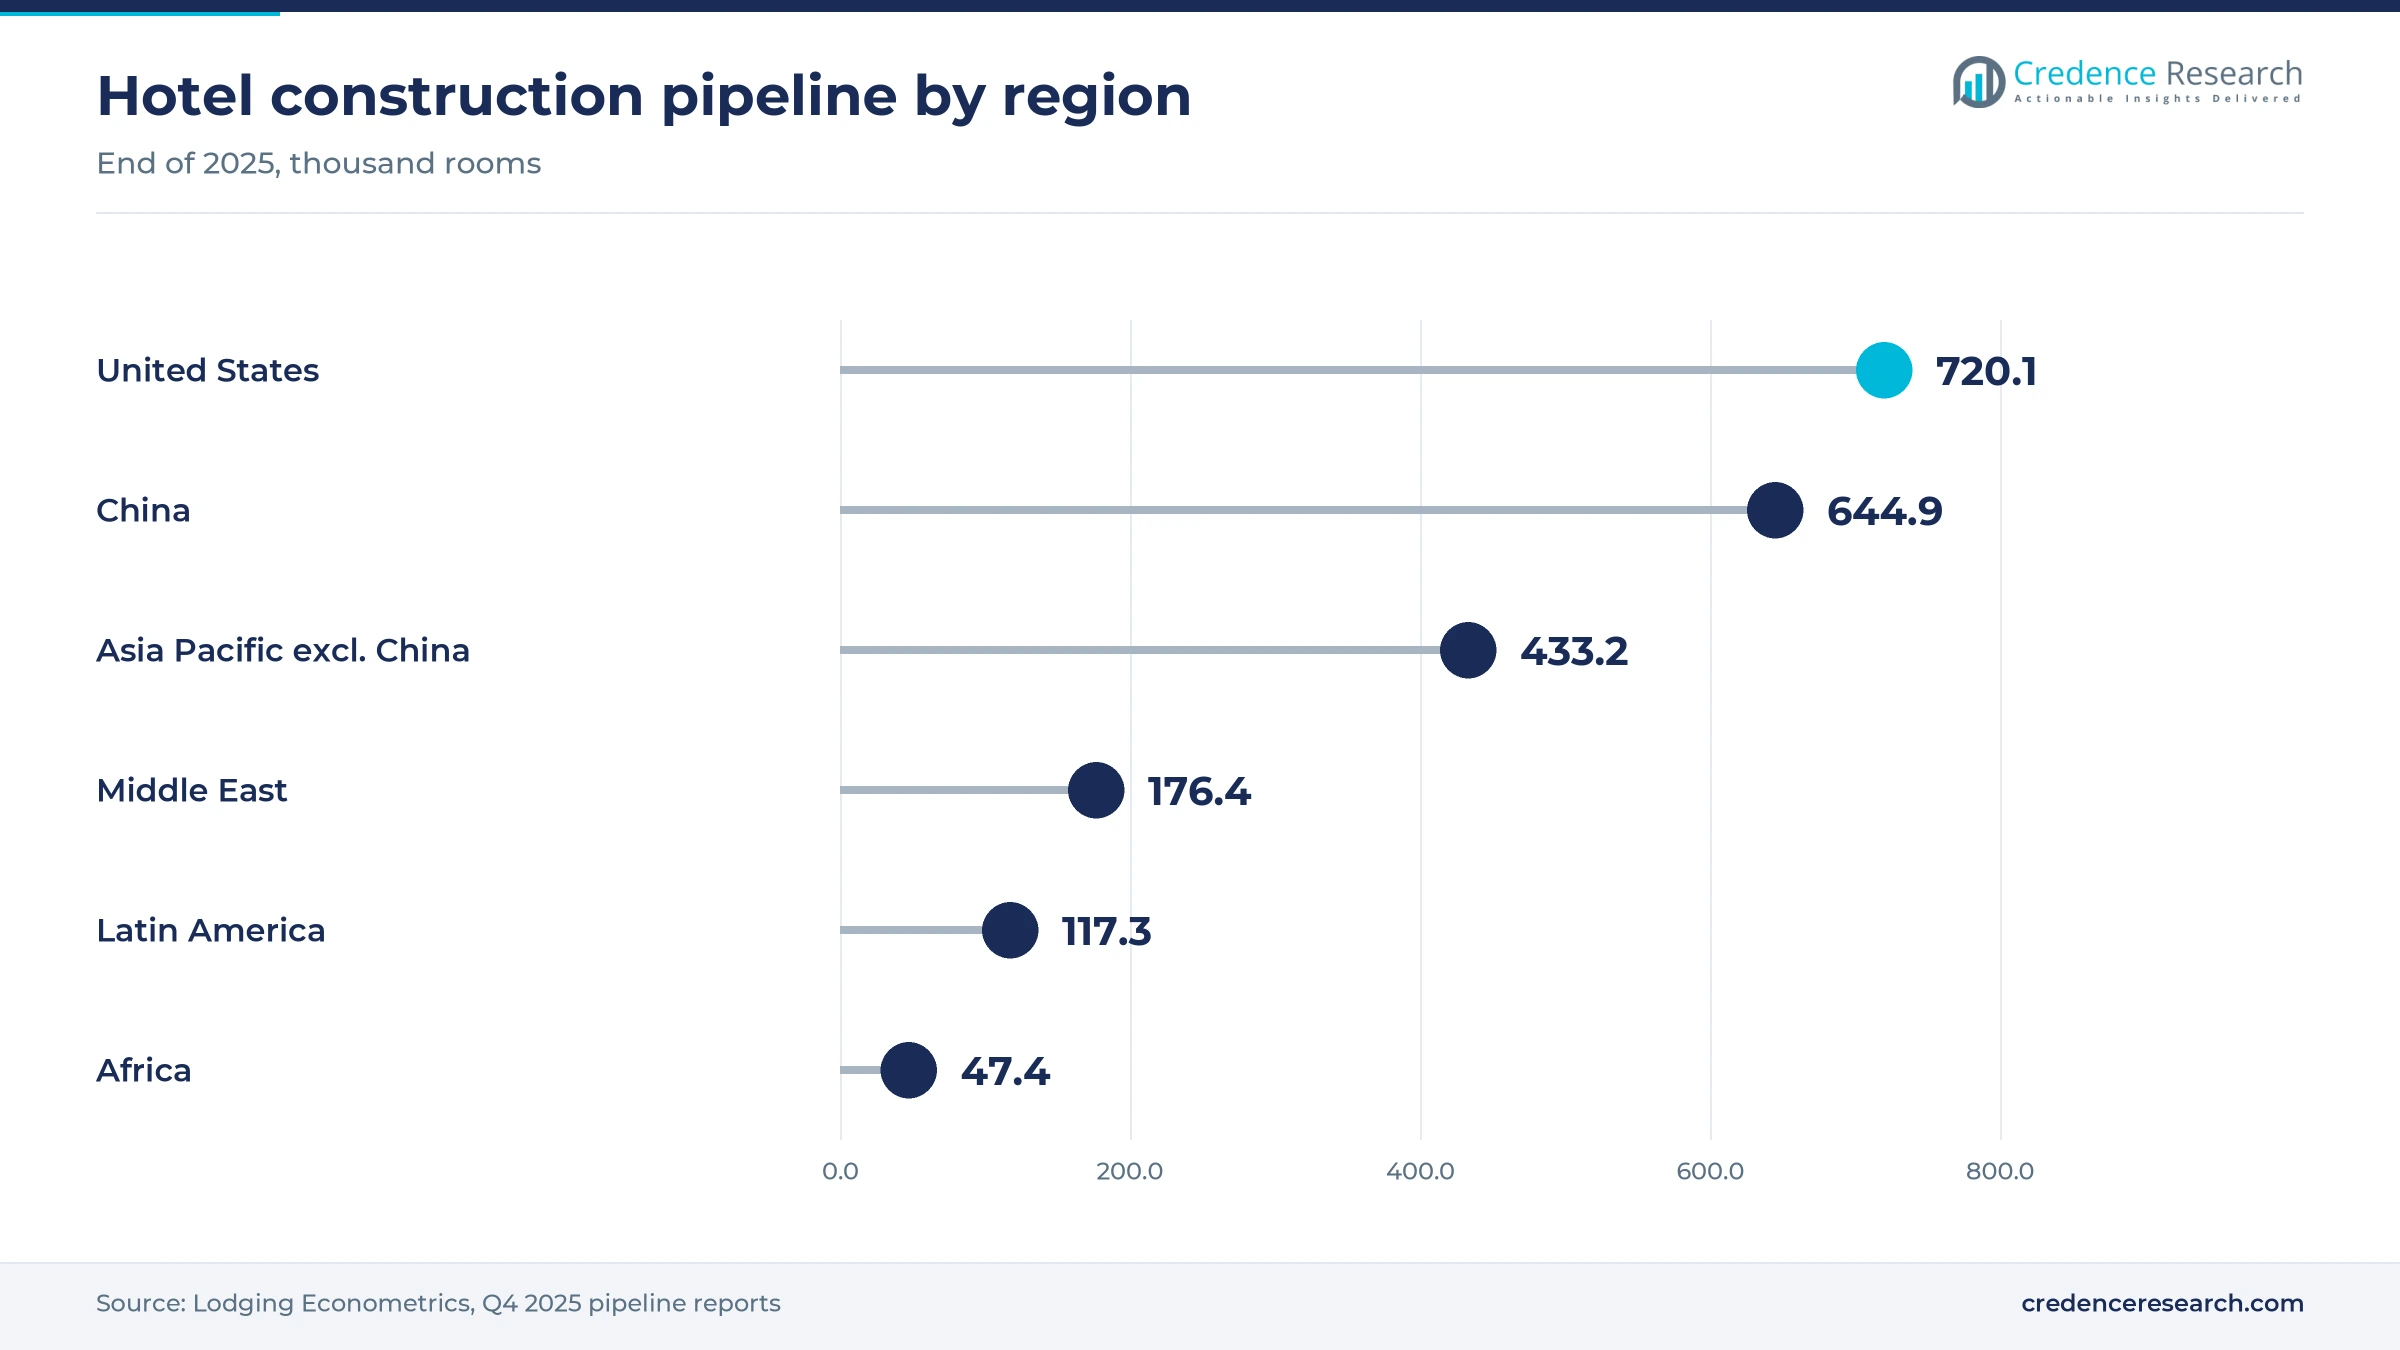
New hotel construction adds lobbies, atriums and restaurants that owners now plant from opening day, which widens the client base beyond offices. Hotel pipeline data reported by Lodging Magazine counted a record 15,922 hotel projects with 2,437,354 rooms in the global pipeline at the end of 2025, a new all-time high for the project count. It recorded 2,371 hotel openings in 2025 and forecasts 2,617 openings with 389,175 rooms in 2026. The United States alone held 6,146 projects, while China held 3,608, so demand spreads across the two largest building markets. As a result, Hotels grow fastest at 4.69% a year, and many hotel owners add holiday trees and lobby decor to the same plant contract.
Consolidation and biophilic credentials reshape the field
Consolidation rises as large firms buy local interiorscapers
Consolidation is rising as large service groups buy local interiorscape firms to gain clients and technician routes in new cities. Landscape Management reported in March 2026 that Ambius operates in about 16 countries and was built through acquisitions, including TruGreen's interior plant care division in 2000. Yellowstone Landscape partnered with Greenery NYC in 2024, while Planterra in Detroit serves national contracts through a network of owner-operated firms. Ambius added two Austin firms in September 2025, and Nurture Landscapes bought London-based Indoor Garden Design, a 50-person team serving Sky, WeWork and Apple, in August 2021. This shift favors providers with dense routes, because one technician can then serve more sites each day.
Biophilic design credentials emerge as a selling point
Formal biophilic design credentials are emerging as a way for interiorscapers to win design-led projects instead of pure maintenance bids. Plant Solutions, based in Scottsdale, Arizona, said in April 2025 that Jessica Buhr and Keeli McKae became the first interiorscape professionals to earn the Biophilic Design Certified Practitioner title from the Biophilic Design Institute. Rentokil Initial's 2025 annual report notes that Ambius won 20 honors, including 17 design awards, at the 2025 International Plantscape Awards. Ambius research with the University of Technology Sydney found that indoor plants removed up to 97% of petrol-related volatile organic compounds in eight hours. In turn, firms use these credentials to work with interior design teams at the concept stage.
Holiday programs for multisite chains open winter revenue
Seasonal holiday programs are an opening for providers, because they fill technician schedules in winter and reach retail and hotel clients that do not lease plants all year. Ambius published seven commercial holiday design themes for 2026 in August 2026, aimed at retail, hospitality and workplace sites in its 16 countries. It offers design, installation, maintenance and off-season storage, plus standard programs for businesses with many locations. Its tree rental service covers artificial trees from 6 to 12 feet, with setup, takedown and storage included in the fee. Creative Plant Designs, in business since 1978 and acquired by Ambius in September 2025, already sold seasonal decorating in Austin. Green Walls remain the fastest line, but holiday decor broadens the client list.
Fitted offices in India and Japan open new contract pools
Office growth in India and Japan is an opening for providers that can build technician teams in new cities, since freshly fitted floors are planted first. CBRE reported on Jan. 6, 2026, that India's office leasing reached a record of about 82.6 million square feet in 2025, with global capability centers taking 39% of fourth-quarter leasing. CBRE also reported that Grade A vacancy in Tokyo fell to 0.7% in the fourth quarter of 2025, down 0.3 percentage points in one quarter. Singapore's Skyrise Greenery Incentive Scheme supported vertical planting through March 2026, adding to regional green wall work. Asia Pacific is the fastest-growing region in the Credence Research model, ahead of Middle East & Africa.
Vacancy, border checks and labor costs weigh on margins
Record office vacancy cuts the number of planted floors
High office vacancy reduces the floor area that clients are willing to plant and maintain. Moody's reported that U.S. office vacancy reached a record 21% in the first quarter of 2026, up 60 basis points from a year earlier. As a result, contract growth slows as landlords consolidate tenants and some clients cut plant counts at renewal. Providers respond by targeting high-occupancy Class A buildings, where Kastle Systems recorded a 94.8% Tuesday peak in the week of Oct. 27, 2026.
Post-brexit border checks raise U.K. plant import costs
Border checks on plant imports raise the cost of stock for U.K. providers that source tropical foliage from Dutch growers. Euronews reported in July 2024 that trade bodies expected import costs to rise by more than 25% after checks began in April 2024. A single lorry with 12 plant batches could face added vetting costs of £1,740, and one firm had three vehicles held for 44 hours at a border post. As a result, providers hold more stock in their own nurseries.
Technician wages and turnover lift service costs
Plant care depends on trained technicians, so wage growth and turnover raise the cost of every scheduled visit. The U.S. Bureau of Labor Statistics put median pay for grounds maintenance workers at $19.27 an hour in May 2025. It also projects about 162,500 openings a year in the occupation over the decade, mostly to replace workers who leave. Providers respond with route software, sub-irrigated planters and longer visit intervals.
Lower auction volumes tighten supply of quality foliage
Supply of quality plants is tightening, which raises replacement costs under guaranteed care contracts. Royal FloraHolland reported in March 2026 that the number of flowers and plants sold through it fell 2% in 2025, while average plant prices rose 1%. Fewer units at higher prices therefore raise the cost of every replacement plant that providers owe under guarantee. This cost risk constrains margins, so providers plan swaps earlier and extend plant life through better light and watering.
Europe leads as Asia Pacific grows fastest
| Region | Value, 2025 (USD billion) | Share, 2025 | CAGR, 2026–2035 |
|---|---|---|---|
| Europe | 0.95 | 38.0% | 3.54% |
| North America | 0.90 | 36.0% | 3.84% |
| Asia Pacific | 0.50 | 20.0% | 4.94% |
| Latin America | 0.07 | 3.0% | 4.44% |
| Middle East & Africa | 0.07 | 3.0% | 4.74% |
Europe leads on dense office districts and old contracts
Europe held 38.0% of 2025 value and grows at 3.54% a year, the slowest pace among the five regions because most large offices already have plant contracts. Rentokil Initial runs Ambius companies in Belgium, France and the Netherlands, according to its 2025 annual report, and it cited its U.K. plants business as a source of 2025 growth. EU Regulation 2024/1991, in force since Aug. 18, 2024, requires no net loss of urban green space by the end of 2030, which supports green wall work in cities.
North America grows on care contracts and acquisitions
North America held 36.0% of 2025 value and grows at 3.84% a year, supported by long-running care contracts in large office markets. Ambius bought two Austin firms in September 2025, and Plant Solutions in Scottsdale and Planterra in Detroit also serve multistate clients. Office attendance is improving, since Kastle Systems measured a 56.5% national weekly average in late October 2026, yet record vacancy still limits new floor area.
Asia Pacific grows fastest on new fitted office floors
Asia Pacific held 20.0% of 2025 value and grows at 4.94% a year, the fastest pace among the five regions. India leased a record of about 82.6 million square feet of offices in 2025, according to CBRE, while Tokyo Grade A vacancy fell to 0.7% at the end of the year. Singapore subsidized vertical greenery at up to S$500 per square meter through March 2026, and Ambius serves Australian offices with plant hire and green walls.
Mexico and Brazil hotel projects lift Latin America
Latin America held 3.0% of 2025 value and grows at 4.44% a year, led by hotel and office clients in the largest cities. Hospitality Net reported in February 2026 that the Latin American hotel pipeline held 774 projects with 117,260 rooms at the end of 2025, up 13% in projects. Mexico held 257 of those projects and Brazil held 133, so new lobbies and resorts add plant contracts mainly in those two countries.
Middle East & Africa grows on Gulf hotel projects
Middle East & Africa held 3.0% of 2025 value and grows at 4.74% a year, the second-fastest regional pace. Hotel pipeline data reported by Lodging Magazine counted 710 projects with 176,402 rooms in the Middle East pipeline at the end of 2025, plus 312 projects in Africa. Hot climates keep many plant schemes indoors, and Rentokil Initial reported good 2025 growth in its Asia and MENAT region.
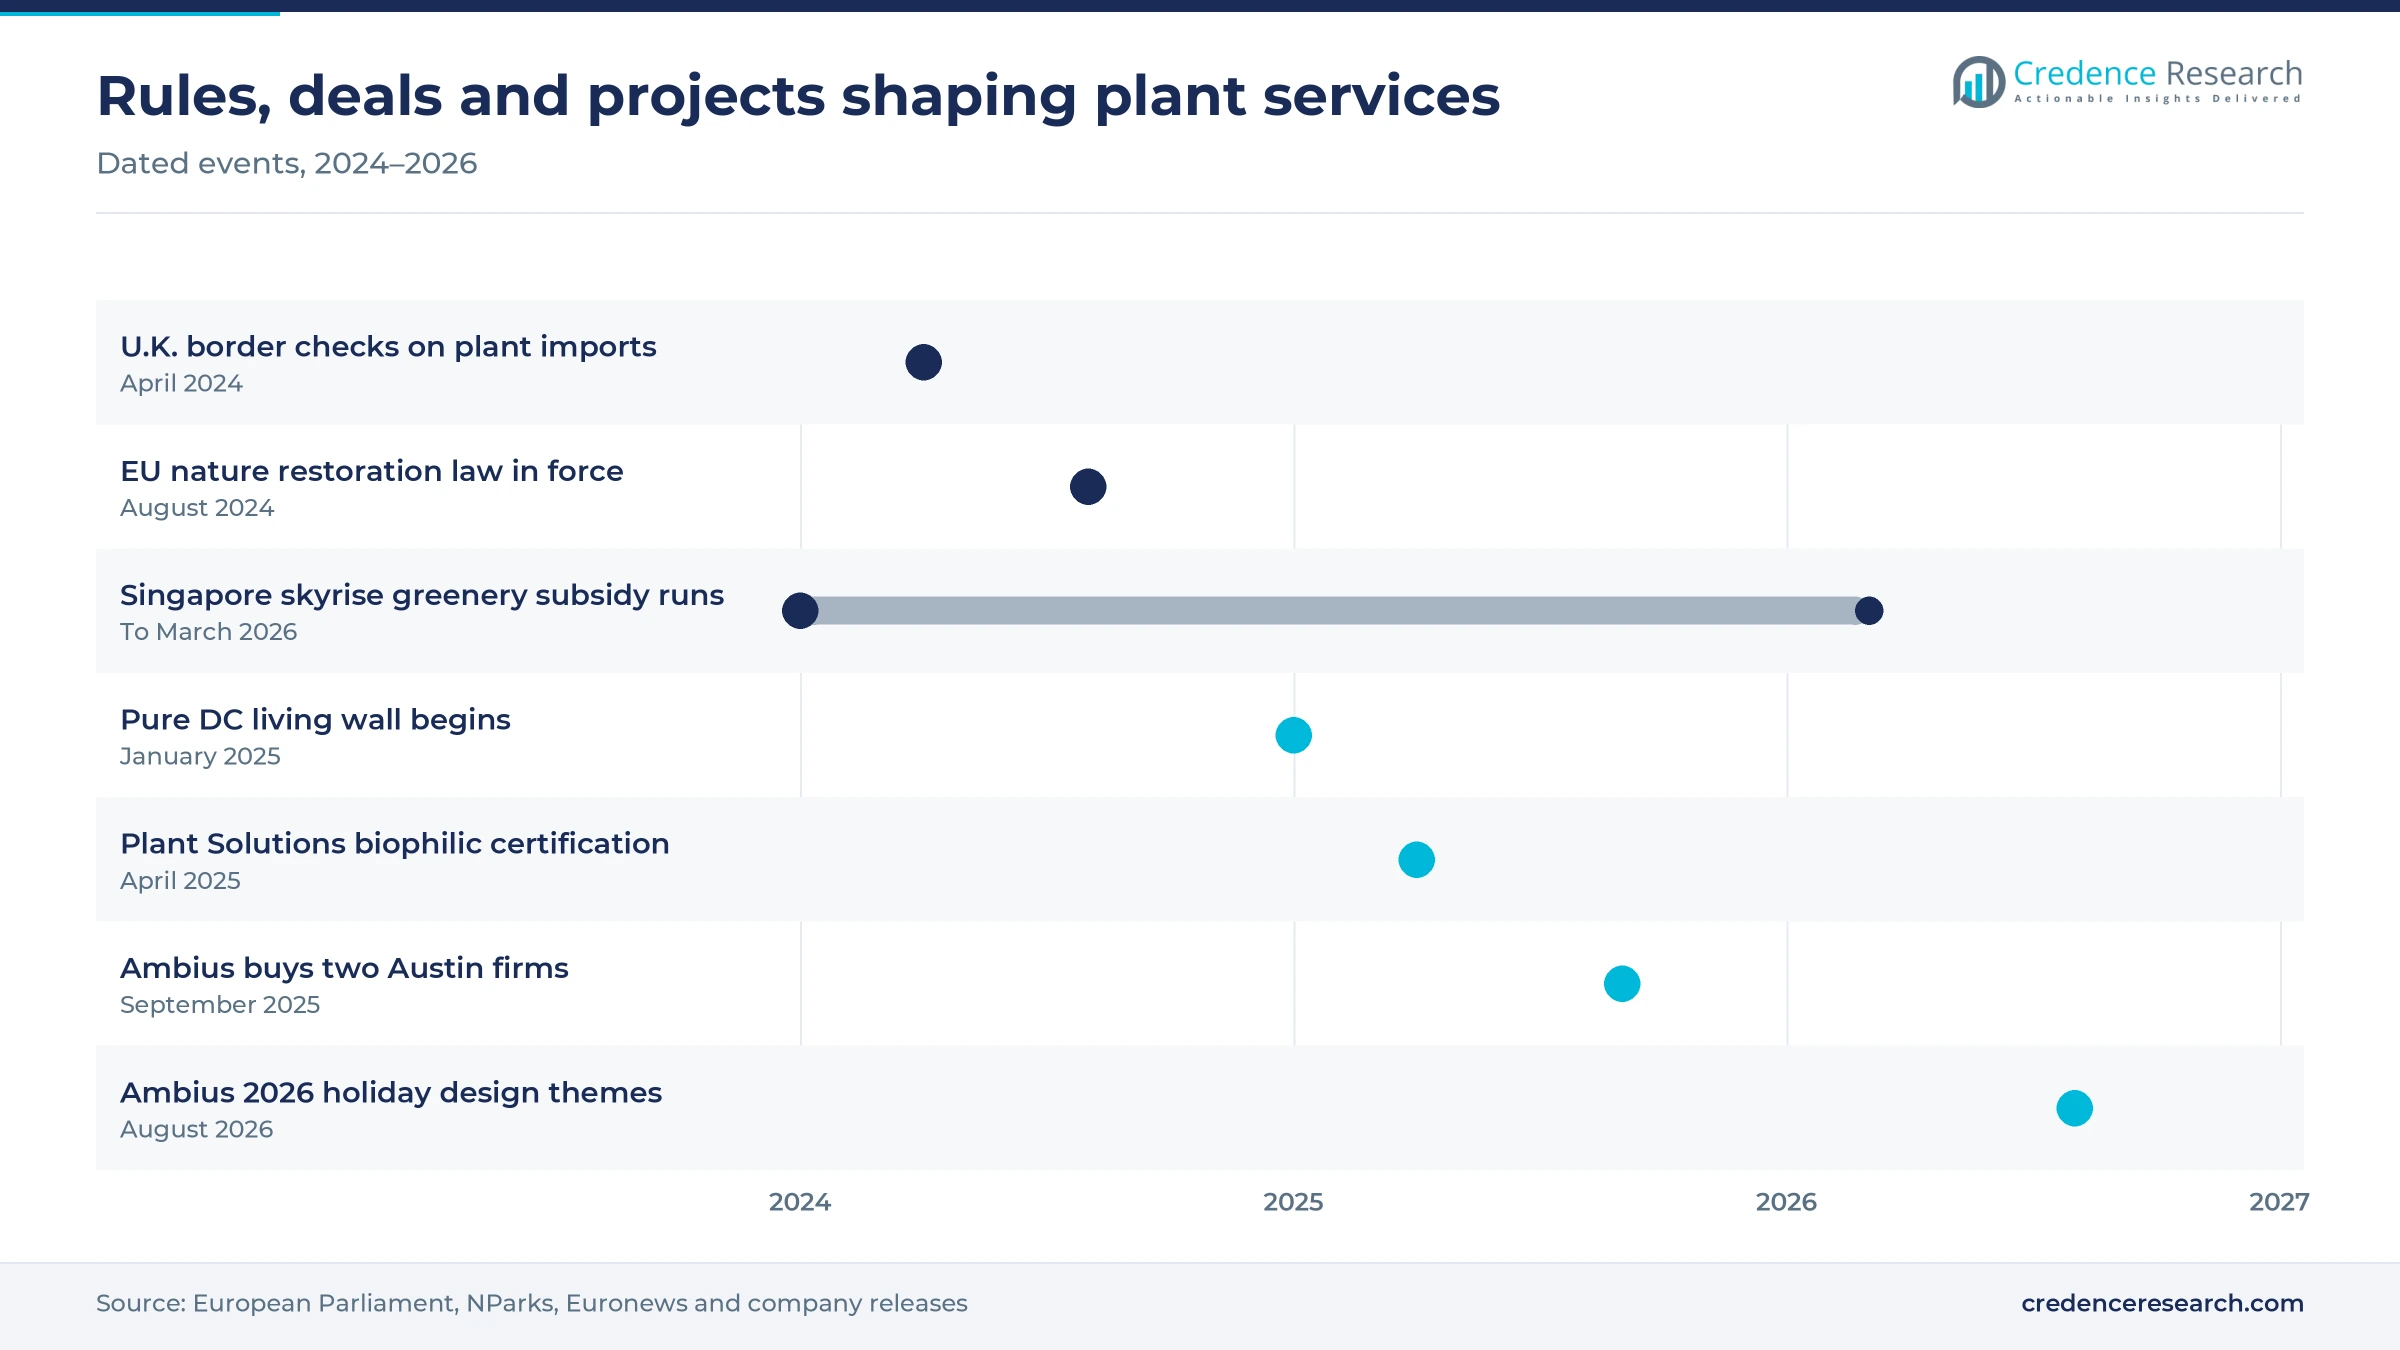
Deals, rules and green wall projects, 2024–2026
| Development | Status and market relevance |
|---|---|
| In August 2024, EU Regulation 2024/1991 on nature restoration entered into force, requiring no net loss of urban green space by 2030. | In force, supports urban greening and green wall projects in Europe |
| In January 2025, Pure DC began a 7,400-square-meter living wall with more than 750,000 plants at its London campus. | Under construction, one of the largest planted walls in Europe |
| In April 2025, Plant Solutions said two of its staff became the first interiorscapers certified as Biophilic Design Certified Practitioners. | Completed, adds formal design credentials to plant services |
| In September 2025, Ambius acquired Creative Plant Designs and Plant Management Associates in Austin, Texas. | Completed, adds rental, leasing and seasonal decor clients in Texas |
| In August 2026, Ambius published seven commercial holiday design themes for retail, hospitality and workplace clients. | Live, supports the 2026 holiday decor season |
Sensors, sub-irrigation and modular living walls
- Moisture sensors report soil conditions to technicians, and Plant Solutions uses sensors and irrigation that it can monitor and control remotely.
- Sub-irrigated planters hold water reserves at the base of each container, which lets providers stretch visit intervals as technician pay reaches $19.27 an hour in the U.S.
- Modular living wall panels let installers build large planted walls, such as the 7,400-square-meter wall Pure DC began in London in January 2025.
- Air quality testing links plant schemes to wellness claims, as Ambius and the University of Technology Sydney found plants removed up to 97% of petrol-related compounds.
Need a Custom Version of This Report?
Tailor the scope, geography, or segments to your exact requirements.
- Custom geography or segment scope
- Direct access to our analyst team
Route density and design skill decide share
Competition centers on route density, horticultural skill and design capability, because a provider earns its margin when one technician can serve many nearby sites. Ambius, part of Rentokil Initial, is the largest operator, working in about 16 countries and adding local firms such as the two Austin businesses bought in September 2025. Plant Solutions competes on biophilic design and remote moisture monitoring, while Planterra wins national accounts through a network of owner-operated partners. Greenery NYC works with Yellowstone Landscape, and Nurture Landscapes added interior work in London through Indoor Garden Design. Many smaller firms still serve a single metro area, often after starting in landscaping and gardening services or in growing for floriculture. Rivalry now turns on green wall skills, holiday programs and the ability to serve multisite clients under one contract.
Who are the leading office plant rental providers?
| Company | Type | Role in the market |
|---|---|---|
| Ambius (Rentokil Initial) | Global provider | Plant rental and care, green walls and holiday decor in about 16 countries |
| Plant Solutions | Regional provider | Scottsdale-based biophilic design, plant rental and moss walls |
| Planterra | National network | Detroit-based firm serving national contracts through partner interiorscapers |
| Greenery NYC (Yellowstone Landscape) | Regional provider | New York interiorscape brand partnered with Yellowstone since 2024 |
| Nurture Landscapes | Regional provider | U.K. landscaper that added London interior work through Indoor Garden Design |
| Good Earth Plant Company | Regional provider | San Diego interior plantscaping, joined by Botanika in 2023 |
Recurring care contracts matter more than new sites
Credence Research's view is that recurring care contracts will matter more than new site wins to 2035. Office vacancy reached a record 21% in the U.S. in early 2026, so providers cannot rely on growing floor area alone. Instead, value comes from adding green walls, holiday decor and hotel lobbies to existing clients under one service agreement. Providers with dense technician routes and their own nursery stock are best placed, because border checks and auction prices raise the cost of replacing plants under guarantee.
Model built from filings, statistics and trade data
The report uses 2025 as the base year and forecasts to 2035. Market values come from the Credence Research model, which combines company filings, published operator footprints and public statistics on office occupancy, hotel construction, wages and plant trade. Regional and segment splits are Credence Research estimates based on operator presence, office and hotel stock and green building policy by region. Sources include SEC filings, the U.S. Bureau of Labor Statistics, the Greater London Authority, the European Parliament, Singapore's National Parks Board, auction reports and trade press.
Green walls and hotels carry growth to 2035
The market is set to grow from USD 2.60 billion in 2026 to USD 3.70 billion by 2035 at a 4.00% CAGR. Green Walls will gain share as city greening rules and biophilic redesigns move planted walls into standard fit-outs. Asia Pacific will add the most new office floors, while Europe keeps the largest share through mature care contracts. Hotels will widen the client base as record pipelines open new lobbies. Risks to the outlook include high office vacancy, higher import costs for live plants and rising technician wages.
Frequently Asked Questions
How big is the office plant rental market?
How do office plant rental contracts work?
Which service leads the market?
Which region holds the largest share?
Which region grows fastest?
Why are green walls growing fastest?
What are the main challenges for providers?
Who are the leading office plant rental providers?
Table of Content
Chapter 1 Market Segmentation
- 1.1 Segmentation Framework
- 1.1.1 Product and Service Classification
- 1.1.2 Application and End-Use Classification
- 1.1.3 Technology and Solution Classification
- 1.1.4 Customer and Distribution Channel Classification
- 1.1.5 Geographic Segmentation
- 1.1.6 Market Segment Definitions and Boundaries
- 1.2 By Service
- 1.2.1 Plant Rental and Maintenance
- 1.2.2 Green Walls
- 1.2.3 Seasonal Decor
- 1.3 By Client
- 1.3.1 Offices
- 1.3.2 Hotels
- 1.3.3 Retail
Chapter 2 Introduction
- 2.1 Report Objectives and Scope
- 2.2 Product Definition and Industry Terminology
- 2.3 Market Inclusions and Exclusions
- 2.4 Research Process
- 2.4.1 Primary Research and Expert Interviews
- 2.4.2 Secondary Research and Source Review
- 2.4.3 Top-Down and Bottom-Up Estimation
- 2.4.4 Data Triangulation and Verification
- 2.5 Market Size Measurement Basis
- 2.5.1 2025: USD 2.50 billion → 2035: USD 3.70 billion
- 2.6 Historical and Forecast Reference Periods
- 2.6.1 Historical Period: 2018-2025
- 2.6.2 Base Year: 2025
- 2.6.3 Forecast Period: 2025-2035
- 2.7 Research Assumptions and Limitations
Chapter 3 Executive Summary
- 3.1 Market Snapshot and Key Findings
- 3.2 Base-Year Market Size, 2025
- 3.3 Forecast Market Size, 2035
- 3.4 Revenue and Volume Growth Outlook
- 3.5 Key Demand and Supply Indicators
- 3.6 Leading Market Segments
- 3.7 Fastest-Growing Market Opportunities
- 3.8 Regional Performance Highlights
- 3.9 Technology and Industry Transformation
- 3.10 Competitive Landscape Summary
- 3.11 Analyst View and Strategic Implications
Chapter 4 Global Office Plant Rental Market Trends and Developments
- 4.1 Historical Industry Development, 2018-2025
- 4.2 Recent Market Trends and Developments
- 4.3 Demand and Customer Behavior Trends
- 4.4 Technology and Product Innovation
- 4.5 Artificial Intelligence, Automation and Digitalization
- 4.6 Local Manufacturing and Supply Chain Realignment
- 4.7 Industry Partnerships, Mergers and Acquisitions
- 4.8 Sustainability and Circular Economy Developments
- 4.9 Government and Private Sector Investment Trends
- 4.10 Emerging Business Models and Commercialization
- 4.11 Industry Developments and Announcements
Chapter 5 Global Office Plant Rental Market Production, Supply and Demand Analysis
- 5.1 Demand Trend and Consumption Analysis, 2018-2025
- 5.2 Demand Forecast, 2025-2035
- 5.3 Production and Output Trend, 2018-2025
- 5.4 Production and Output Forecast, 2025-2035
- 5.5 Installed Capacity and Capacity Utilization
- 5.6 Company-Wise Production Plants and Statistics
- 5.6.1 Installed Production Capacity
- 5.6.2 Actual Production
- 5.6.3 Planned Capacity and Expansion Targets
- 5.7 Supply Chain Structure and Procurement Trends
- 5.8 Supply-Demand Gap and Bottlenecks
- 5.9 Import Dependence and Sourcing Structure
- 5.10 Contract Manufacturing and Outsourcing
- 5.11 Regional Supply and Demand Concentration
Chapter 6 Global Office Plant Rental Market Pricing Analysis
- 6.1 Pricing Structure and Measurement
- 6.2 Historical Pricing Trends, 2018-2025
- 6.3 Pricing Outlook, 2025-2035
- 6.4 Average Selling Price and Unit Economics
- 6.5 Pricing by Product and Market Segment
- 6.6 Geographic Pricing Differences
- 6.7 Key Input, Energy, Labor and Logistics Costs
- 6.8 Contract Pricing and Purchasing Models
- 6.9 Pricing Sensitivity and Competitive Positioning
- 6.10 Price, Margin and Profitability Implications
Chapter 7 Global Office Plant Rental Market Dynamics
- 7.1 Market Growth Drivers
- 7.1.1 Demand-Side Drivers
- 7.1.2 Technology and Innovation Drivers
- 7.1.3 Infrastructure and Investment Drivers
- 7.1.4 Regulatory and Policy Drivers
- 7.2 Market Restraints
- 7.2.1 Cost and Affordability Constraints
- 7.2.2 Technology and Adoption Barriers
- 7.2.3 Supply Chain and Operational Constraints
- 7.3 Market Challenges
- 7.3.1 Competitive Pressure and Margin Erosion
- 7.3.2 Skills, Infrastructure and Implementation Gaps
- 7.4 Emerging Market Opportunities
- 7.5 Market Dynamics Impact and Time-Horizon Assessment
Chapter 8 Global Office Plant Rental Value Chain Analysis
- 8.1 Industry Value Chain Overview
- 8.2 Upstream Suppliers and Critical Inputs
- 8.3 Technology and Component Providers
- 8.4 Manufacturing or Service Delivery
- 8.5 Distribution, Channel Partners and Integrators
- 8.6 Downstream Applications and End Users
- 8.7 Value Addition and Profit Pools
- 8.8 Vertical Integration and Outsourcing
- 8.9 Supplier Concentration and Risk
- 8.10 Supply Chain Localization and Resilience
Chapter 9 Global Office Plant Rental Market Regulations and Policies
- 9.1 Relevant Laws, Standards and Compliance Frameworks
- 9.2 Product, Service, Safety and Quality Requirements
- 9.3 Government Policies, Incentives and Subsidies
- 9.4 Imports, Exports and Trade Barriers
- 9.5 Public Procurement and Local Content Requirements
- 9.6 Environmental and Sustainability Compliance
- 9.7 Upcoming Policy Changes and Market Implications
Chapter 10 Global Office Plant Rental Market Hotspots and Opportunities
- 10.1 Market Opportunity Mapping and Growth Hotspots
- 10.2 High-Growth Applications and Customer Groups
- 10.3 Underserved Markets and White-Space Opportunities
- 10.4 Emerging Technology and Product Opportunities
- 10.5 New Capacity and Investment Hotspots
- 10.6 Market Entry and Expansion Opportunities
- 10.7 Distribution and Partnership Opportunities
- 10.8 Near-Term and Long-Term Commercial Potential
- 10.9 Opportunity Attractiveness and Execution Risks
Chapter 11 Global Office Plant Rental Market Outlook, 2025-2035
- 11.1 Market Size and Analysis
- 11.1.1 Revenue (Market Measurement: 2025: USD 2.50 billion → 2035: USD 3.70 billion)
- 11.1.2 Market Volume and Quantity Sold
- 11.1.3 Historical Market Size, 2018-2025
- 11.1.4 Base-Year Market Size, 2025
- 11.2 Market Forecast, 2025-2035
- 11.2.1 Revenue Forecast to 2035
- 11.2.2 Volume Forecast to 2035
- 11.2.3 CAGR and Year-on-Year Growth
- 11.2.4 Incremental Revenue Opportunity
- 11.3 Forecast Assumptions and Scenario Analysis
- 11.3.1 Base-Case Forecast
- 11.3.2 Optimistic and Conservative Scenarios
- 11.3.3 Technology, Pricing and Policy Sensitivities
- 11.4 Market Attractiveness and Growth Outlook
Chapter 12 Global Office Plant Rental Market Segmentation and Outlook
- 12.1 Segmentation Summary and Market Shares, 2025
- 12.2 Largest and Fastest-Growing Segments
- 12.3 By Service - Market Size and Forecast, 2025-2035
- 12.3.1 Segment Definition and Scope
- 12.3.2 Historical Market Size, 2018-2025
- 12.3.3 Revenue Forecast, 2025-2035
- 12.3.4 Volume Forecast, 2025-2035
- 12.3.5 Base-Year Market Share, 2025
- 12.3.6 Segment CAGR and Growth Drivers
- 12.3.7 Subsegment Market Size and Forecast
- 12.3.7.1 Plant Rental and Maintenance
- 12.3.7.2 Green Walls
- 12.3.7.3 Seasonal Decor
- 12.3.8 Subsegment Pricing and Adoption Trends
- 12.3.9 Leading Suppliers and Competition
- 12.3.10 Regional Demand and Opportunities
- 12.4 By Client - Market Size and Forecast, 2025-2035
- 12.4.1 Segment Definition and Scope
- 12.4.2 Historical Market Size, 2018-2025
- 12.4.3 Revenue Forecast, 2025-2035
- 12.4.4 Volume Forecast, 2025-2035
- 12.4.5 Base-Year Market Share, 2025
- 12.4.6 Segment CAGR and Growth Drivers
- 12.4.7 Subsegment Market Size and Forecast
- 12.4.7.1 Offices
- 12.4.7.2 Hotels
- 12.4.7.3 Retail
- 12.4.8 Subsegment Pricing and Adoption Trends
- 12.4.9 Leading Suppliers and Competition
- 12.4.10 Regional Demand and Opportunities
- 12.5 Segment Growth Comparison
- 12.6 Segment Attractiveness and Priority Matrix
Chapter 13 Global Office Plant Rental Geographic Market Outlook, 2025-2035
- 13.1 Regional Market Size and Share, 2025
- 13.2 Regional Market Forecast, 2025-2035
- 13.3 Regional Pricing, Production and Demand Differences
- 13.4 North America
- 13.4.1 United States
- 13.4.2 Canada
- 13.4.3 Mexico
- 13.5 Europe
- 13.5.1 Germany
- 13.5.2 France
- 13.5.3 Italy
- 13.5.4 United Kingdom
- 13.5.5 Spain
- 13.5.6 Poland
- 13.5.7 Russia
- 13.5.8 Netherlands
- 13.5.9 Belgium
- 13.5.10 Sweden
- 13.5.11 Denmark
- 13.5.12 Norway
- 13.5.13 Rest of Europe
- 13.6 Asia Pacific
- 13.6.1 China
- 13.6.2 India
- 13.6.3 Japan
- 13.6.4 South Korea
- 13.6.5 Thailand
- 13.6.6 Indonesia
- 13.6.7 Vietnam
- 13.6.8 Malaysia
- 13.6.9 Australia
- 13.6.10 Rest of Asia Pacific
- 13.7 Latin America
- 13.7.1 Brazil
- 13.7.2 Argentina
- 13.7.3 Colombia
- 13.7.4 Chile
- 13.7.5 Rest of Latin America
- 13.8 Middle East
- 13.8.1 Saudi Arabia
- 13.8.2 United Arab Emirates
- 13.8.3 Turkey
- 13.8.4 Israel
- 13.8.5 Iran
- 13.8.6 Rest of the Middle East
- 13.9 Africa
- 13.9.1 South Africa
- 13.9.2 Egypt
- 13.9.3 Nigeria
- 13.9.4 Morocco
- 13.9.5 Rest of Africa
- 13.10 Regional Investment, Policy and Supply Chain Differences
- 13.11 Regional Competitive Landscape
- 13.12 Geographic Growth Hotspots
Chapter 14 Global Office Plant Rental Technology, Innovation and Sustainability Outlook
- 14.1 Technology Landscape and Maturity
- 14.2 Product, Process and Service Innovation
- 14.3 AI, Automation and Digital Tools in the Industry
- 14.4 Technology Adoption and Performance Benchmarking
- 14.5 Innovation Pipeline and R&D Investment
- 14.6 Patent and Intellectual Property Trends
- 14.7 Energy Efficiency and Resource Management
- 14.8 Sustainability, Recycling and Circularity
- 14.9 Technology Roadmap, 2025-2035
- 14.10 Risks of Obsolescence and Technology Substitution
Chapter 15 Global Office Plant Rental Market Key Strategic Imperatives
- 15.1 Growth and Market Entry Priorities
- 15.2 High-Return Products and Segments
- 15.3 Pricing, Profitability and Cost Optimization
- 15.4 Technology Investment and Product Differentiation
- 15.5 Supply Chain Localization and Resilience
- 15.6 Distribution and Customer Acquisition
- 15.7 Partnership, Acquisition and Capacity Strategy
- 15.8 Regional Expansion Priorities
- 15.9 Short-, Medium- and Long-Term Actions
Chapter 16 Competition Outlook
- 16.1 Industry Competition Characteristics
- 16.2 Market Structure and Concentration
- 16.3 Market Share and Competitive Positioning, 2025
- 16.4 Company-Wise Revenue and Product Benchmarking
- 16.5 Production and Service Capacity Benchmarking
- 16.6 Technology, Pricing and Differentiation
- 16.7 Regional Footprint and Distribution Strength
- 16.8 Mergers, Acquisitions and Strategic Alliances
- 16.9 New Entrants and Competitive Threats
- 16.10 Porter's Five Forces and Industry Attractiveness
- 16.11 Competitive Outlook, 2025-2035
Chapter 17 Company Profiles
- 17.1 Company Coverage and Selection Criteria
- 17.2 Ambius (Rentokil Initial)
- 17.2.1 Business Description
- 17.2.2 Company Ownership and Geographic Presence
- 17.2.3 Product and Service Portfolio
- 17.2.4 Manufacturing and Operating Footprint
- 17.2.5 Production Capacity and Expansion Plans
- 17.2.6 Financial Performance and Investment
- 17.2.7 Market Share and Competitive Position
- 17.2.8 Technology and Innovation Capabilities
- 17.2.9 Strategic Alliances or Partnerships
- 17.2.10 Recent Developments
- 17.2.11 Growth Strategy and Outlook
- 17.3 Plant Solutions
- 17.4 Planterra
- 17.5 Greenery NYC (Yellowstone Landscape)
- 17.6 Nurture Landscapes
- 17.7 Good Earth Plant Company
- 17.8 Other Relevant Market Participants
Note: Every listed company is profiled on the structure shown under the first company. The company list is preliminary and may change based on research findings, market developments, data availability and client requirements.
Chapter 18 Disclaimer
- 18.1 Research and Forecast Disclaimer
- 18.2 Data Source and Estimation Limitations
Note: The depth of individual sections depends on data availability for this market. Volume, capacity, trade and other unit-based metrics are included where applicable.

