
| REPORT ATTRIBUTE | DETAILS |
|---|---|
| Historical Period | 2019-2022 |
| Base Year | 2023 |
| Forecast Period | 2024-2032 |
| Environmental Remediation Services Market Size 2024 | USD 128,605 Million |
| Environmental Remediation Services Market, CAGR | 8.30% |
| Environmental Remediation Services Market Size 2032 | USD 243,379.4 Million |
Market Overview
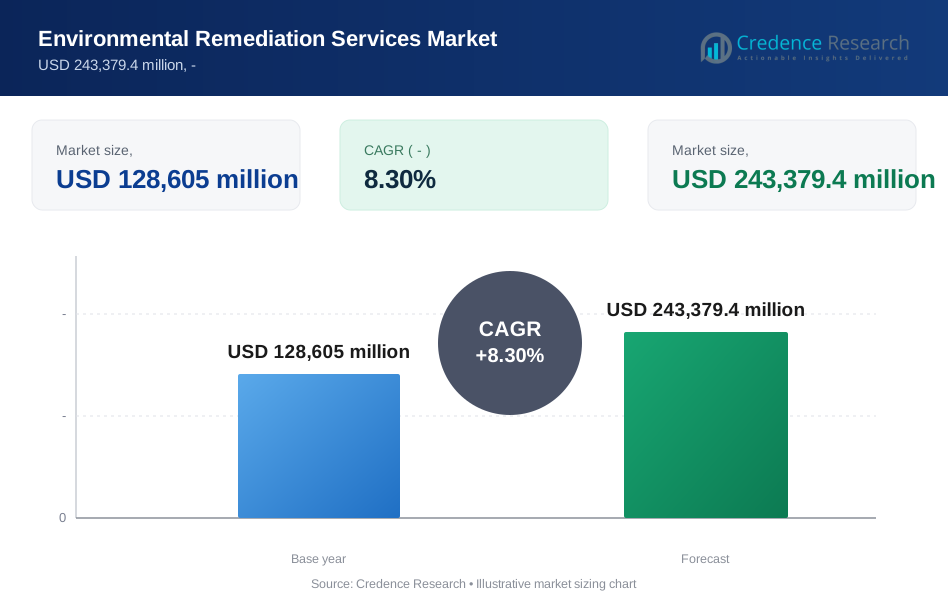
The Environmental Remediation Services Market is projected to grow from USD 128,605 million in 2024 to USD 243,379.4 million by 2032, at a compound annual growth rate (CAGR) of 8.30%.
The environmental remediation services market is driven by increasing awareness of environmental pollution, stringent government regulations, and growing industrialization. Rising concerns over soil contamination, groundwater pollution, and hazardous waste management are prompting companies and governments to invest in remediation solutions. Additionally, advancements in remediation technologies, such as bioremediation and nanotechnology, are enhancing the effectiveness of cleanup efforts. The global shift towards sustainability and corporate responsibility further accelerates the demand for these services. As industries and urban areas expand, the need for efficient, eco-friendly remediation solutions continues to rise, shaping market growth trends.
The geographical analysis of Environmental Remediation Services reveals significant market activity in North America and Europe, which collectively hold substantial market shares due to stringent regulations and heightened environmental awareness. Key players such as Fluor Corporation, Golder Associates Corporation, and HEPACO are pivotal in driving growth through innovative remediation solutions. Additionally, emerging markets in Asia-Pacific are witnessing increased demand for these services, fueled by rapid industrialization and urbanization. The combined efforts of these key players, alongside evolving environmental policies, are essential for addressing contamination challenges globally and promoting sustainable development in the sector.
Market Drivers
Stringent Government Regulations
Governments across the globe are enacting stricter environmental regulations to protect public health and the environment, making remediation services a crucial component in compliance. For instance, the Biden-Harris Administration in the United States has finalized a critical rule to clean up PFAS contamination, designating two widely used PFAS chemicals as hazardous substances under the Superfund law. These regulations often mandate the cleanup of contaminated sites, especially in industries known for pollution. As enforcement intensifies, companies face increasing pressure to ensure their operations meet environmental standards. Failure to comply with these regulations can result in significant penalties, legal consequences, and reputational damage. As a result, the demand for environmental remediation services continues to grow, driven by the need to comply with these stringent laws and avoid costly fines.
Growing Public Awareness and Industrial Expansion
Public awareness of the health risks associated with environmental contamination has surged in recent years. For instance, communities have become increasingly concerned about pollution’s long-term effects on air quality, water resources, and public health, as highlighted by various public awareness campaigns. This heightened environmental consciousness puts pressure on businesses and governments to prioritize remediation efforts and address contamination issues. Moreover, rapid industrial growth and urbanization have contributed to higher levels of pollution, further driving the need for remediation. With the expansion of industries, the contamination of land and water resources requires significant efforts to ensure safe environments for development projects.
Legacy Contamination and Technological Advancements
Many industrial sites face legacy contamination issues due to decades of previous operations, necessitating specialized remediation services to address past environmental harm. Programs like the Superfund in the United States, aimed at cleaning up hazardous waste sites, are key drivers of demand for environmental remediation services. Additionally, advancements in remediation technologies have made it easier and more cost-effective to tackle complex contamination. Innovative solutions, such as bioremediation and soil vapor extraction, improve the efficiency of remediation efforts, reducing the time and resources needed for cleanups while encouraging broader adoption by businesses and governments.
Brownfield Redevelopment and Climate Change
The remediation of brownfields offers significant economic benefits, transforming contaminated sites into valuable real estate and promoting sustainable land use. This process not only revitalizes communities but also prevents further development on untouched land. Furthermore, environmental remediation can contribute to climate change mitigation by integrating sustainable practices. Techniques such as soil bioremediation also aid in carbon sequestration, helping reduce the environmental impact of industrial activities. These combined efforts align with global sustainability goals, making remediation an essential part of responsible development strategies.
Market Trends
Increased Focus on Sustainable Remediation
The environmental remediation industry is witnessing a significant shift towards sustainable practices that minimize ecological impact and promote resource conservation. For instance, the U.S. Environmental Protection Agency (EPA) has outlined best management practices for green remediation, including the use of biodiesel in equipment, solar panels for power, and water recycling technologies. The adoption of green technologies is becoming prevalent, with companies increasingly utilizing sustainable remediation techniques that align with environmental goals. These methods not only address contamination but also work within the principles of a circular economy, where waste and contaminated materials are repurposed or recycled rather than disposed of. This innovative approach reduces the overall environmental footprint of remediation projects and supports sustainability initiatives. By integrating these sustainable practices, the industry is not only improving its environmental performance but also responding to consumer demands for greener solutions.
Technological Advancements Driving Efficiency
Technological advancements are revolutionizing the remediation landscape, introducing methods that enhance efficiency and effectiveness. Bioremediation, which leverages microorganisms to degrade pollutants, is gaining traction due to its cost-effectiveness and environmental friendliness. Additionally, nanotechnology-based remediation techniques provide targeted solutions for complex contamination scenarios, allowing for more precise interventions. The rise of robotics and automation further contributes to the industry’s transformation by increasing efficiency while minimizing human exposure to hazardous materials. These technological innovations not only streamline remediation processes but also reduce the time and costs associated with cleanup efforts, making them attractive options for both businesses and regulatory bodies.
Market Challenges Analysis
Complex Regulatory Landscape and Financial Constraints
Navigating the complex and often evolving landscape of environmental regulations presents a significant challenge for businesses involved in remediation services. These regulations can be intricate and subject to frequent changes, making compliance a moving target that complicates long-term planning and investment strategies. For instance, a survey conducted by the Environmental Protection Agency (EPA) revealed that many remediation companies reported difficulties in keeping up with regulatory changes. The uncertainty surrounding future regulatory frameworks adds another layer of difficulty, as companies may struggle to allocate resources effectively while anticipating potential shifts in compliance requirements. In addition to regulatory challenges, the high costs associated with remediation technologies can be prohibitive. Many advanced technologies, while effective, come with substantial price tags, leading businesses to grapple with justifying these expenses. Furthermore, remediation projects often carry significant financial risks, including the potential for unexpected costs and delays that can strain budgets and profitability. These financial pressures necessitate careful financial planning and risk assessment, which can be daunting in an unpredictable regulatory environment.
Technical and Public Perception Challenges
Technical challenges also loom large in the environmental remediation landscape, particularly when addressing sites with complex contamination patterns. Such intricacies often make remediation efforts both difficult and costly, with the risk that suitable technologies may be unavailable or still under development. This technical uncertainty can hinder project timelines and increase costs, exacerbating financial strain on businesses. Additionally, public perception of remediation projects can present formidable barriers. Negative attitudes towards remediation efforts, often fueled by a lack of understanding or fear of potential environmental impacts, can lead to community opposition and project delays. The "Not In My Backyard" (NIMBY) phenomenon is particularly pronounced in densely populated areas, where local communities may resist remediation initiatives despite their broader environmental benefits. These social dynamics complicate engagement efforts and can result in prolonged negotiation processes with stakeholders. Ultimately, addressing these challenges requires not only technical and financial acumen but also effective communication and community engagement strategies to foster public support for necessary remediation projects.
Market Segmentation Analysis:
By Service Type:
The environmental remediation services market is categorized primarily by service type, encompassing both ex situ and in situ methods. Ex situ remediation involves techniques such as excavation and product recovery, where contaminated materials are removed from their original locations for treatment. Excavation allows for direct access to pollutants, facilitating more thorough remediation, while product recovery focuses on reclaiming valuable resources from waste. On the other hand, in situ remediation employs methods like bioremediation, chemical blending, and pump-and-treat techniques, enabling treatment without the need for excavation. Bioremediation leverages microorganisms to degrade contaminants, while chemical blending integrates chemical agents to neutralize pollutants, and pump-and-treat systems extract and treat contaminated groundwater.
By Application:
The application segments of environmental remediation services include diverse industries such as mining and forestry, oil and gas, and agriculture. Additionally, the automotive, food and beverage, chemical and pharmaceutical, and construction sectors also contribute significantly to the market. Each of these industries faces unique contamination challenges, driving demand for tailored remediation solutions. The growing emphasis on environmental sustainability and compliance with stringent regulations further propels the need for effective remediation services across these applications, ensuring the protection of ecosystems and public health.
Segments:
Based on Service Type:
- Ex situ
- Excavation
- Product Recovery
- In situ
- Bioremediation
- Chemical Blending
- Pump-and-Treat
- Other
Based on Application:
- Mining and Forestry
- Oil and Gas
- Agriculture
- Automotive
- Food and Beverage
- Chemical and Pharmaceutical
- Construction and Land Development
- Others
Based on the Geography:
- North America
- U.S.
- Canada
- Mexico
- Europe
- Germany
- France
- U.K.
- Italy
- Spain
- Rest of Europe
- Asia Pacific
- China
- Japan
- India
- South Korea
- South-east Asia
- Rest of Asia Pacific
- Latin America
- Brazil
- Argentina
- Rest of Latin America
- Middle East & Africa
- GCC Countries
- South Africa
- Rest of the Middle East and Africa
Regional Analysis
North America
In the North American region, the environmental remediation services market holds a significant share, accounting for approximately 45% of the global market. This dominance can be attributed to stringent government regulations and a robust focus on environmental sustainability. The United States, in particular, has established comprehensive frameworks, such as the Comprehensive Environmental Response, Compensation, and Liability Act (CERCLA), which drives demand for remediation services. For instance, the U.S. International Trade Commission (USITC) highlights that the environmental services industry has grown due to population growth, economic activity, and new government regulations. The presence of advanced technology and a well-developed infrastructure further enhances service delivery in this region. Industries such as oil and gas, mining, and agriculture are major contributors to the need for remediation, as they often face challenges related to contamination and pollution.
Asia-Pacific
In contrast, the Asia-Pacific region is rapidly emerging as a significant player in the environmental remediation services market, currently holding about 25% of the global share. This growth is primarily driven by increasing industrialization and urbanization, particularly in countries like China and India. As these nations face heightened pollution levels, the demand for effective remediation services is surging. Furthermore, the region is witnessing a rise in public awareness regarding environmental issues, prompting governments to implement stricter regulations and standards. The ongoing investments in infrastructure and the development of innovative remediation technologies are expected to further boost the market in this region. Additionally, collaboration between public and private sectors aims to address historical pollution and enhance the overall effectiveness of remediation efforts, positioning the Asia-Pacific region for substantial growth in the coming years.
Key Player Analysis
- ENVIRONMENTAL WORKS, INC.
- Environmental Remediation Services, Inc.
- Fluor Corporation
- GEO Inc.
- Golder Associates Corporation
- Haz Mat Special Services, LLC
- HEPACO
- In-Situ Oxidative Technologies Inc.
- MICROBIAL INSIGHTS
- NewTerra Ltd.
- NorthStar Group Services Inc.
- Sequoia Environmental Remediation Inc.
- Sprint Sanierung GmbH
Competitive Analysis
The competitive landscape of Environmental Remediation Services is characterized by the presence of several leading players, including Environmental Works, Inc., Environmental Remediation Services, Inc., Fluor Corporation, GEO Inc., Golder Associates Corporation, Haz Mat Special Services, LLC, HEPACO, In-Situ Oxidative Technologies Inc., MICROBIAL INSIGHTS, NewTerra Ltd., NorthStar Group Services Inc., Sequoia Environmental Remediation Inc., and Sprint Sanierung GmbH. These companies leverage advanced technologies and innovative solutions to address complex environmental challenges effectively. Key players differentiate themselves through their comprehensive service offerings, including both ex situ and in situ remediation techniques, catering to various sectors such as oil and gas, mining, and construction. Strategic partnerships, mergers, and acquisitions are common strategies employed by these firms to enhance their market presence and expand their service capabilities. As regulatory pressures intensify, these leading players are well-positioned to capitalize on emerging opportunities in the growing environmental remediation market.
Recent Developments
- In April 2024, Environmental Works, Inc. achieved “No Further Action” status for one of Missouri’s oldest petroleum release sites.
- In July 2024, Fluor Corporation was awarded a contract for the next phase of engineering and design for a small modular reactor power plant in Romania.
- In June 2023, Haz Mat Special Services announced the promotion of Telisa Peden to the role of Chief Operating Officer.
- In June 2023, Haz Mat Special Services announced the promotion of Telisa Peden to the role of Chief Operating Officer.
Market Concentration & Characteristics
The market concentration of Environmental Remediation Services is characterized by a mix of both large multinational corporations and specialized local firms, creating a diverse competitive landscape. While major players like Fluor Corporation and Golder Associates dominate the market with extensive resources and technological capabilities, numerous smaller companies provide niche services tailored to specific regional needs or specialized remediation techniques. This dual structure enables a broad spectrum of service offerings, ranging from traditional excavation and bioremediation to innovative technologies such as in-situ chemical oxidation and advanced microbial treatments. Market characteristics also reflect increasing consolidation through mergers and acquisitions, allowing companies to expand their geographic reach and service portfolios. Furthermore, as regulatory frameworks become more stringent, firms with established reputations and proven expertise gain a competitive edge, fostering a trend towards greater market consolidation. This dynamic ensures that the industry can effectively respond to evolving environmental challenges and the growing demand for sustainable remediation solutions.Top of Form
Report Coverage
The research report offers an in-depth analysis based on Service Type, Application and Geography. It details leading market players, providing an overview of their business, product offerings, investments, revenue streams, and key applications. Additionally, the report includes insights into the competitive environment, SWOT analysis, current market trends, as well as the primary drivers and constraints. Furthermore, it discusses various factors that have driven market expansion in recent years. The report also explores market dynamics, regulatory scenarios, and technological advancements that are shaping the industry. It assesses the impact of external factors and global economic changes on market growth. Lastly, it provides strategic recommendations for new entrants and established companies to navigate the complexities of the market.
Future Outlook
- The Environmental Remediation Services market is expected to grow significantly due to increasing regulatory pressure and public awareness of environmental issues.
- Technological advancements will drive the adoption of innovative remediation techniques, improving efficiency and effectiveness.
- The integration of sustainable practices in remediation projects will become a priority, aligning with global sustainability goals.
- The demand for brownfield redevelopment will rise as urbanization accelerates, necessitating the remediation of previously contaminated sites.
- Increased investment in infrastructure and industrial development in emerging markets will lead to greater demand for remediation services.
- The focus on long-term monitoring and maintenance will strengthen to ensure the effectiveness of remediation efforts over time.
- Collaboration between governments, private companies, and communities will enhance the effectiveness of remediation initiatives.
- The use of digital tools and data analytics will improve decision-making processes in remediation projects.
- The industry's workforce will increasingly require specialized skills, driving the need for training and development programs.
- The market will likely see continued consolidation as companies seek to expand their capabilities and geographic reach.
Request a Free Sample
Fill in your details and we'll send you a free sample report.
- Sample data tables & charts
- Research methodology
Need a Custom Version of This Report?
Tailor the scope, geography, or segments to your exact requirements.
- Custom geography or segment scope
- Direct access to our analyst team
Table of Content
Chapter 1. Report Introduction
- 1.1 Report Description & Purpose
- 1.1.1 Report Title & Market Definition
- 1.1.2 Unique Selling Propositions (USP) & Key Differentiators
- 1.1.3 Value Proposition for Stakeholders
- 1.2 Research Objectives
- 1.2.1 Market Sizing Objectives (Volume & Revenue)
- 1.2.2 Segmentation Objectives
- 1.2.3 Competitive Intelligence Objectives
- 1.2.4 Forecast & Scenario Objectives
- 1.3 Report Scope
- 1.3.1 Environmental Remediation Services Scope – Types & Subtypes Covered
- 1.3.2 Geographic Scope – Regions & Countries Covered
- 1.3.3 Historical Period, Base Year & Forecast Period (the historical period; forecast to the forecast period)
- 1.3.4 Inclusions & Exclusions
- 1.4 HS Code & Classification Framework
- 1.5 Currency, Units & Pricing Basis
- 1.6 Target Stakeholders
- 1.7 Limitations & Assumptions
Chapter 2. Executive Summary
- 2.1 Global Environmental Remediation Services Market Snapshot
- 2.1.1 Market Size – Historical (the historical period) & Forecast (the forecast period) (base year: USD 128,605 million → forecast year: USD 243,379.4 million)
- 2.1.2 Volume & Revenue – Global Totals
- 2.1.3 Key Market Highlights – Top Five Facts
- 2.2 Environmental Remediation Services Market Segmentation Snapshot
- 2.2.1 Market Split by Region – vs.
- 2.3 Competitive Snapshot
- 2.3.1 Top 10 Players by Revenue Share –
- 2.3.2 Top 10 Players by Volume Share –
- 2.3.3 Recent Strategic Developments (18-Month Summary)
- 2.4 Key Investment Highlights & Strategic Conclusions
Chapter 3. Environmental Remediation Services Market Dynamics & Industry Analysis
- 3.1 Market Overview & Context
- 3.1.1 Environmental Remediation Services Market Position in the Broader Automotive Value Chain
- 3.1.2 OEM vs. Replacement Market Dynamics
- 3.1.3 Market Maturity & Development Stage by Region
- 3.2 Environmental Remediation Services Market Drivers
- 3.3 Environmental Remediation Services Market Restraints & Challenges
- 3.4 Environmental Remediation Services Market Opportunities
- 3.5 Porter's Five Forces Analysis
- 3.5.1 Threat of New Entrants
- 3.5.2 Bargaining Power of Suppliers
- 3.5.3 Bargaining Power of Buyers
- 3.5.4 Threat of Substitutes
- 3.5.5 Competitive Rivalry – Intensity Assessment
- 3.6 Environmental Remediation Services Value Chain Analysis
- 3.6.1 Upstream – Raw Material/Input Suppliers
- 3.6.1.1 Raw Material/Input 1
- 3.6.1.2 Raw Material/Input 2
- 3.6.1.3 Raw Material/Input 3
- 3.6.2 Midstream – Production/Manufacturing/Service Delivery
- 3.6.2.1 Production/Process Overview
- 3.6.2.2 Key Facility Locations & Capacity by Manufacturer
- 3.6.3 Downstream – Distribution & End Consumer
- 3.6.3.1 Primary Channel – B2B/OEM
- 3.6.3.2 Secondary Channels – Dealer, Retail, Online, Direct
- 3.6.4 Value Chain Profitability Analysis
- 3.6.1 Upstream – Raw Material/Input Suppliers
- 3.7 PESTEL Analysis
- 3.7.1 Political Factors
- 3.7.2 Economic Factors
- 3.7.3 Social Factors
- 3.7.4 Technological Factors
- 3.7.5 Environmental Factors
- 3.7.6 Legal Factors
- 3.8 Environmental Remediation Services Supply Chain Analysis
- 3.8.1 Raw Material/Input Supply Risk Assessment
- 3.8.2 Manufacturing Concentration Risk (Geographic Exposure)
- 3.8.3 Trade Disruption Impact Analysis
- 3.9 Regulatory & Policy Landscape
Note: The regulatory and policy landscape section covers regulations based on their applicability to the market, Environmental Remediation Services category, geography, and scope of the study. Only regulatory frameworks with a material impact on operations, compliance, trade, sustainability, or market access are analyzed in detail.
Chapter 4. Key Investment Pockets & Opportunity Analysis
- 4.1 Environmental Remediation Services Market Attractiveness Analysis
- 4.1.1 By Region – Investment Attractiveness Matrix (Volume × CAGR)
- 4.2 Absolute Revenue Growth Opportunity
- 4.2.1 By Region – Absolute USD Growth Through the forecast period
- 4.3 Incremental Volume Opportunity
- 4.3.1 By Region – Incremental Volume Through the forecast period
- 4.3.2 Segment – Incremental Volume
- 4.4 Emerging Submarket Opportunity Deep Dive (Subject to Applicability)
- 4.5 Emerging Market Opportunity Scorecards
- 4.5.1 United States
- 4.5.2 Europe
- 4.5.3 Asia
- 4.5.4 Middle East & Africa
Note: Emerging Market Opportunity Scorecards will be included based on relevance and strategic importance. Regions listed are indicative and may vary depending on data availability and market dynamics.
Chapter 5. Environmental Remediation Services Import-Export Analysis & Trade Flows
- 5.1 Global Trade Overview
- 5.1.1 Global Export Value by Country (the historical period)
- 5.1.2 Global Export Volume by Country (the historical period)
- 5.1.3 Global Import Value by Country (the historical period)
- 5.1.4 Global Import Volume by Country (the historical period)
- 5.1.5 Net Trade Balance by Country (the historical period)
- 5.2 Export Analysis – Segment
- 5.2.1 Type 1 (HS Code)
- 5.2.2 Type 2 (HS Code)
- 5.2.3 Type 3 (HS Code)
- 5.2.4 Type 4 (HS Code)
- 5.2.5 Type 5 (HS Code)
- 5.3 Import Analysis – Segment
- 5.3.1 Type 1 (HS Code)
- 5.3.2 Type 2 (HS Code)
- 5.3.3 Type 3 (HS Code)
- 5.3.4 Type 4 (HS Code)
- 5.3.5 Type 5 (HS Code)
- 5.4 Average Unit Trade Prices
- 5.4.1 Average Export Price – Segment & Country
- 5.4.2 Average Import Price – Segment & Source Country
- 5.4.3 Price Trends (the historical period)
- 5.5 Key Trade Route Analysis
- 5.5.1 Trade Route 1
- 5.5.2 Trade Route 2
- 5.5.3 Trade Route 3
- 5.5.4 Trade Route 4
- 5.5.5 Trade Route 5
- 5.6 Trade Policy Impact Assessment
- 5.6.1 US Anti-Dumping & Section 301 Tariffs
- 5.6.2 EU Customs Union Impact
- 5.6.3 Major Free Trade Agreements
- 5.6.4 USMCA Rules of Origin
Note: Trade policy analysis will be included only where relevant to the Environmental Remediation Services market.
Chapter 6. Competitive Landscape & Company Benchmarking
- 6.1 Environmental Remediation Services Market Concentration & Structure
- 6.1.1 Herfindahl-Hirschman Index (HHI) – vs.
- 6.1.2 Tier 1, Tier 2 & Tier 3 Market Structure
- 6.1.3 Global, Regional & Local Player Dynamics
- 6.2 Environmental Remediation Services Market Share Analysis –
- 6.2.1 Global Revenue Share by Company
- 6.2.2 Global Volume Share by Company
- 6.2.3 Regional Revenue Share
- 6.2.4 Market Share Evolution ( vs. )
- 6.2.5 OEM Segment Share by Company
- 6.2.6 Replacement Segment Share by Company
- 6.3 Production/Delivery Capacity & Facility Analysis
- 6.3.1 Global Installed Capacity
- 6.3.2 Capacity Utilization Rates
- 6.3.3 Production/Output Volume
- 6.3.4 Facility Locations & Capacity Map
- 6.3.5 Planned Capacity Additions
- 6.4 Environmental Remediation Services Competitive Benchmarking Matrix
- 6.4.1 Revenue, Volume, CAGR & Profitability Comparison
- 6.4.2 Channel Revenue Mix
- 6.4.3 Geographic Revenue Exposure
- 6.4.4 R&D Intensity
- 6.4.5 Sustainability Maturity
- 6.5 Strategic Developments in Environmental Remediation Services (Last 24 Months)
- 6.5.1 Mergers, Acquisitions & Divestments
- 6.5.2 New Environmental Remediation Services Launches
- 6.5.3 Facility Expansions
- 6.5.4 Strategic Alliances, Joint Ventures & Partnerships
- 6.5.5 Distribution Expansion & Market Entry
- 6.5.6 Sustainability & ESG Initiatives
- 6.6 Competitive Strategy Mapping
- 6.6.1 Leader, Challenger, Follower & Niche Classification
- 6.6.2 Pricing Strategy Comparison
- 6.6.3 Channel Strategy Matrix
Note: Strategic developments are included based on their materiality and the availability of reliable information.
Chapter 7. Global Environmental Remediation Services Market – By Distribution Channel
- 7.1 Segment Overview
- 7.1.1 Volume & Revenue Split by Channel ( & )
- 7.1.2 Channel Mix Evolution (the forecast period)
Chapter 8. Regional Market Analysis – Global Overview
- 8.1 Global Regional Overview
- 8.1.1 Regional Volume Share
- 8.1.2 Regional Revenue Share
- 8.1.3 Regional Volume by Region
- 8.1.4 Regional Revenue by Region
- 8.1.5 Regional Forecast Through the forecast period
- 8.2 Cross-Regional Segment Analysis
- 8.2.1 By Distribution Channel
- 8.2.2 By Brand/Price Tier
Chapter 9. North America Environmental Remediation Services Market
- 9.1 United States
- 9.2 Canada
- 9.3 Mexico
Chapter 10. Europe Environmental Remediation Services Market
- 10.1 Germany
- 10.2 France
- 10.3 Italy
- 10.4 United Kingdom
- 10.5 Spain
- 10.6 Poland
- 10.7 Russia
- 10.8 Netherlands
- 10.9 Belgium
- 10.10 Sweden
- 10.11 Denmark
- 10.12 Norway
- 10.13 Rest of Europe
Chapter 11. Asia Pacific Environmental Remediation Services Market
- 11.1 China
- 11.2 India
- 11.3 Japan
- 11.4 South Korea
- 11.5 Thailand
- 11.6 Indonesia
- 11.7 Vietnam
- 11.8 Malaysia
- 11.9 Australia
- 11.10 Rest of Asia Pacific
Chapter 12. Latin America Environmental Remediation Services Market
- 12.1 Brazil
- 12.2 Argentina
- 12.3 Colombia
- 12.4 Chile
- 12.5 Rest of Latin America
Chapter 13. Middle East Environmental Remediation Services Market
- 13.1 Saudi Arabia
- 13.2 United Arab Emirates
- 13.3 Turkey
- 13.4 Israel
- 13.5 Iran
- 13.6 Rest of the Middle East
Chapter 14. Africa Environmental Remediation Services Market
- 14.1 South Africa
- 14.2 Egypt
- 14.3 Nigeria
- 14.4 Morocco
- 14.5 Rest of Africa
Chapter 15. Environmental Remediation Services Company Profiles
- 15.1 [Company 01]
- 15.1.1 Company Overview
- 15.1.2 Key Management Personnel
- 15.1.3 Products & Services Portfolio
- 15.1.4 Financial Performance
- 15.1.5 Key Market Focus & Geographic Presence
- 15.1.6 Recent Developments & Strategic Initiatives
Note: The company profile list is preliminary and may change based on research findings, market developments, data availability, and client requirements.
Chapter 16. Appendices
- Appendix A – List of Abbreviations & Acronyms
- Appendix B – Industry Classification Code Reference – Full Series
- Appendix C – Production & Capacity Data Tables
- Appendix D – End-Use & Demand Base Tables
- Appendix E – Consumption & Replacement Rate Assumptions
- Appendix F – ASP Reference Tables
- Appendix G – Manufacturing & Facility Database
- Appendix H – Import-Export Data Tables
- Appendix I – Regulatory Summary Tables
- Appendix J – Primary Research Participant List (Anonymized)
- Appendix K – Primary Research Questionnaire Framework
- Appendix L – Data Sources & Bibliography
- Appendix M – Market Size Divergence & Source Comparison
Chapter 17. Research Methodology
- 17.1 Research Framework & Philosophy
- 17.2 Secondary Research – Sources, Hierarchy & Data Extraction
- 17.3 Data Modeling – Bottom-Up & Top-Down Market Sizing
- 17.4 Primary Research – Stakeholder Framework, LOI & Sample Sizes
- 17.5 Forecast Methodology – Regression, Scenario & Sensitivity Analysis
- 17.6 Quality Control – Four-Layer Validation Framework
- 17.7 Limitations & Standard Assumptions
- 17.8 Disclaimer
