
Australia coal value contracts as thermal demand fades
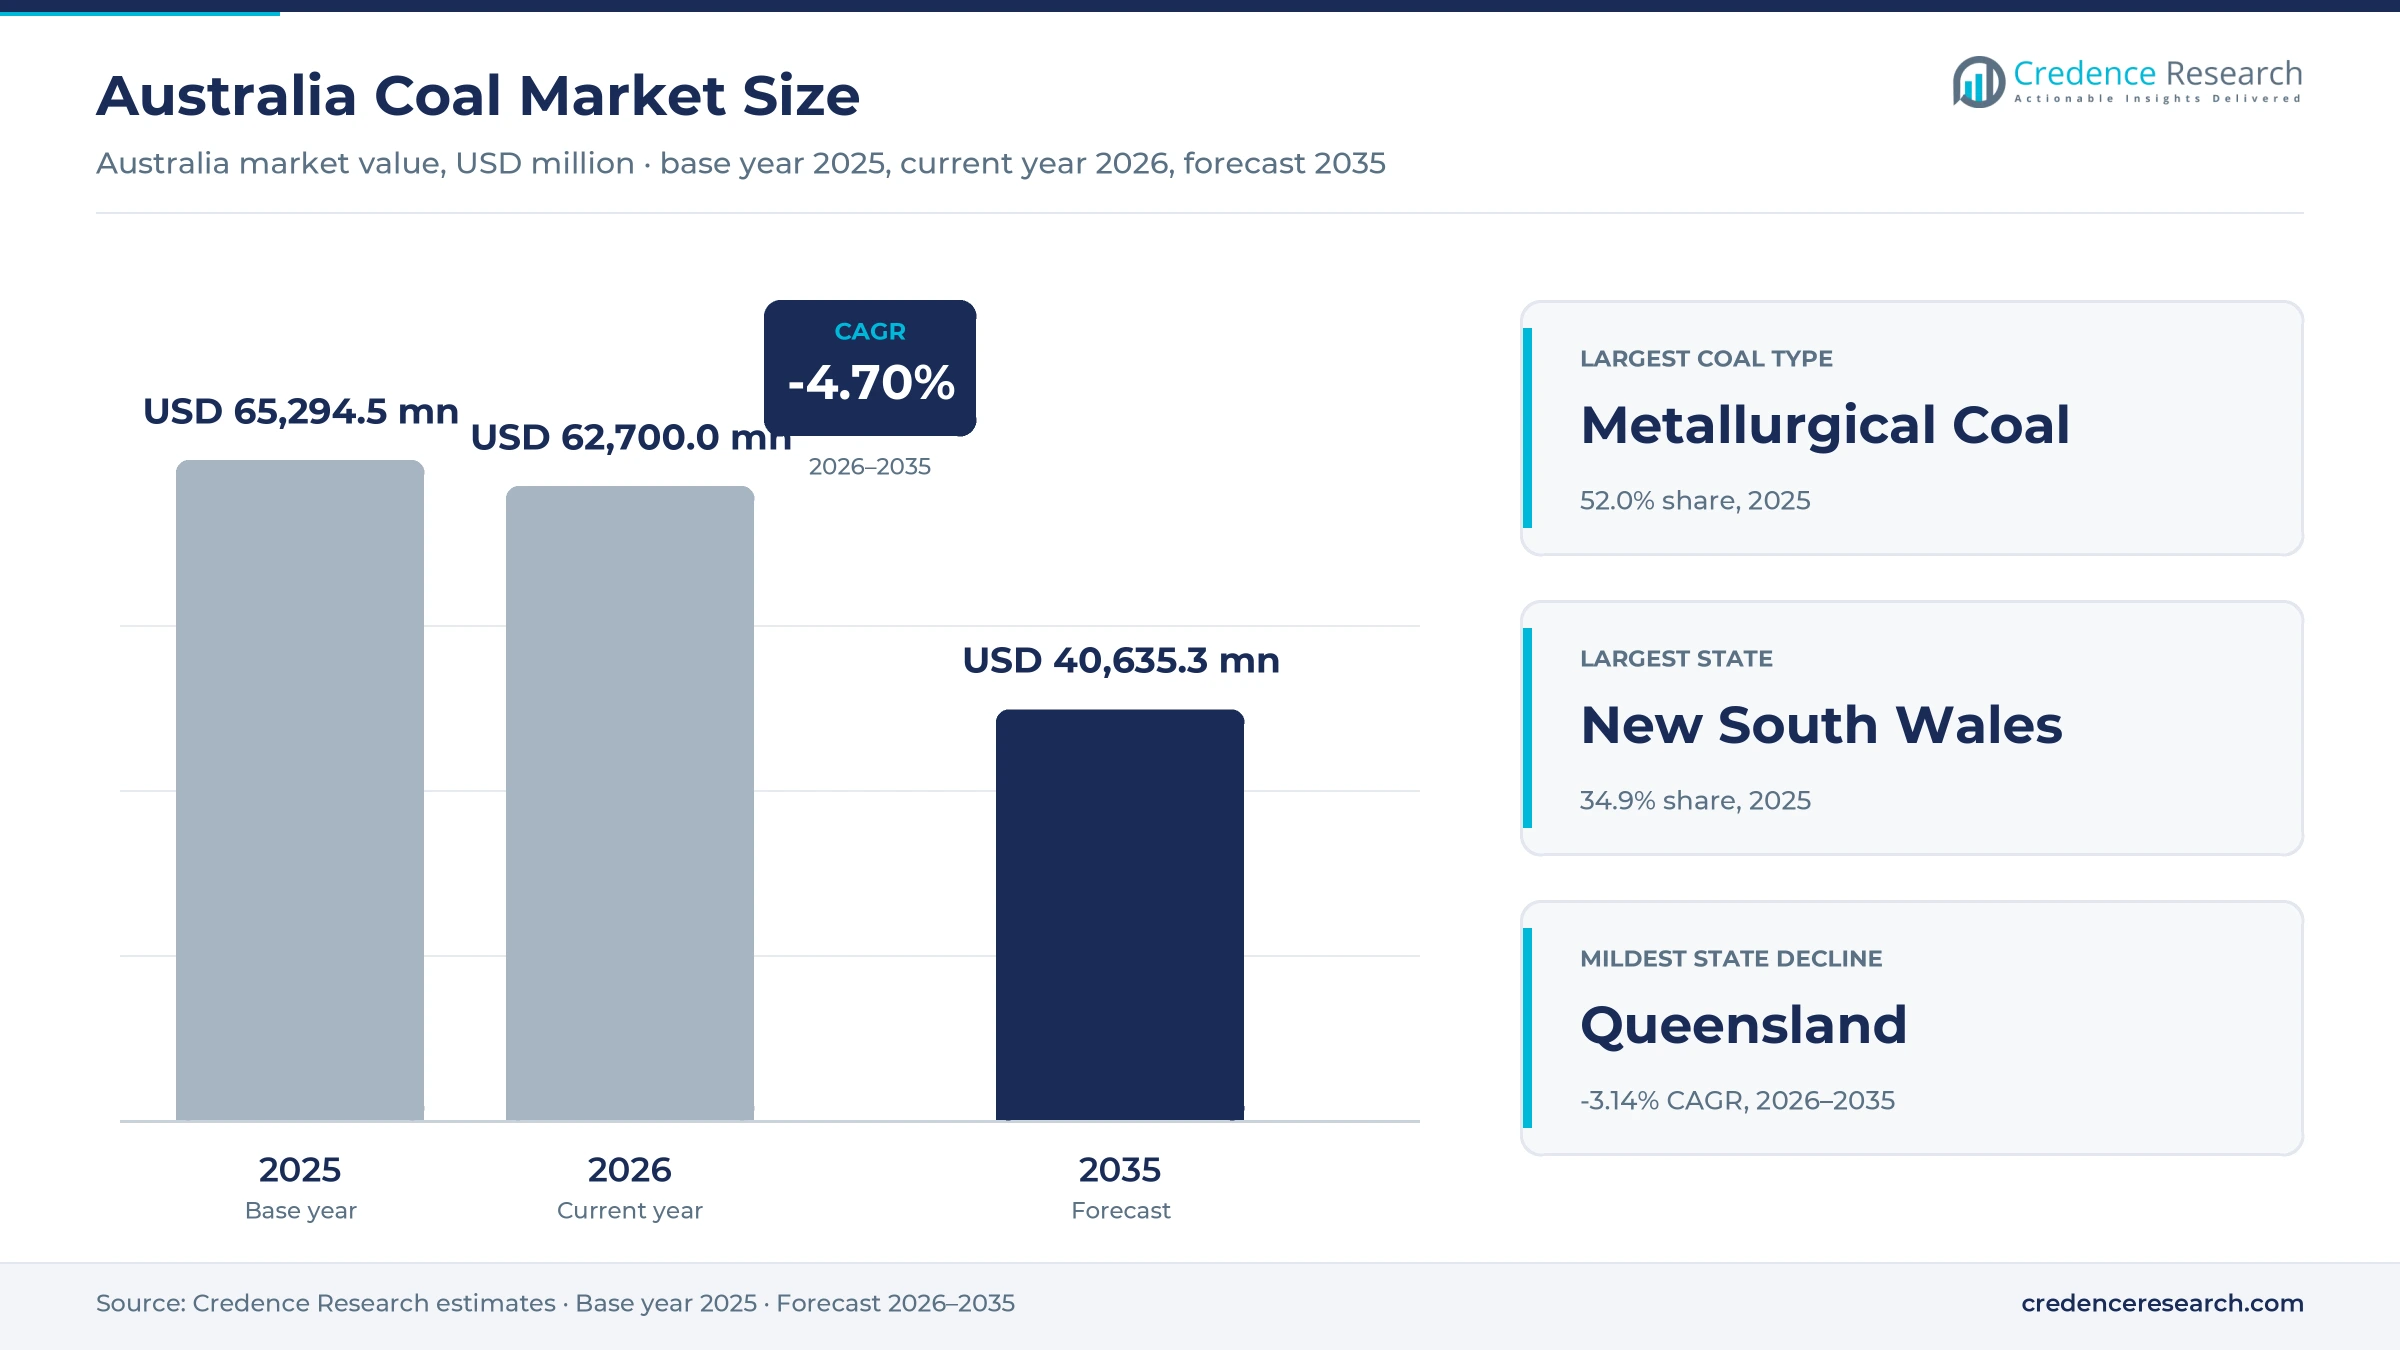
The Australia coal market was valued at USD 65.29 billion in 2025 and is projected to decline from USD 62.70 billion in 2026 to USD 40.64 billion by 2035, registering a CAGR of -4.70% during 2026–2035. Value falls because thermal coal export volumes are easing and domestic coal-fired stations are moving toward retirement dates set between 2028 and 2040. Metallurgical coal holds up better, because blast furnaces across Asia still rely on Bowen Basin coking grades that have few practical substitutes. New South Wales held the largest state share, 34.9% in 2025, reflecting thermal export and domestic power station contracts written in the state. Queensland records the mildest contraction, a CAGR of -3.14% during 2026–2035, as steelmaking coal sales cushion the decline. Tighter emissions baselines under the reformed Safeguard Mechanism and higher Queensland royalty tiers are also reshaping mine investment decisions across the forecast period.
What does the Australia coal market count and leave out?
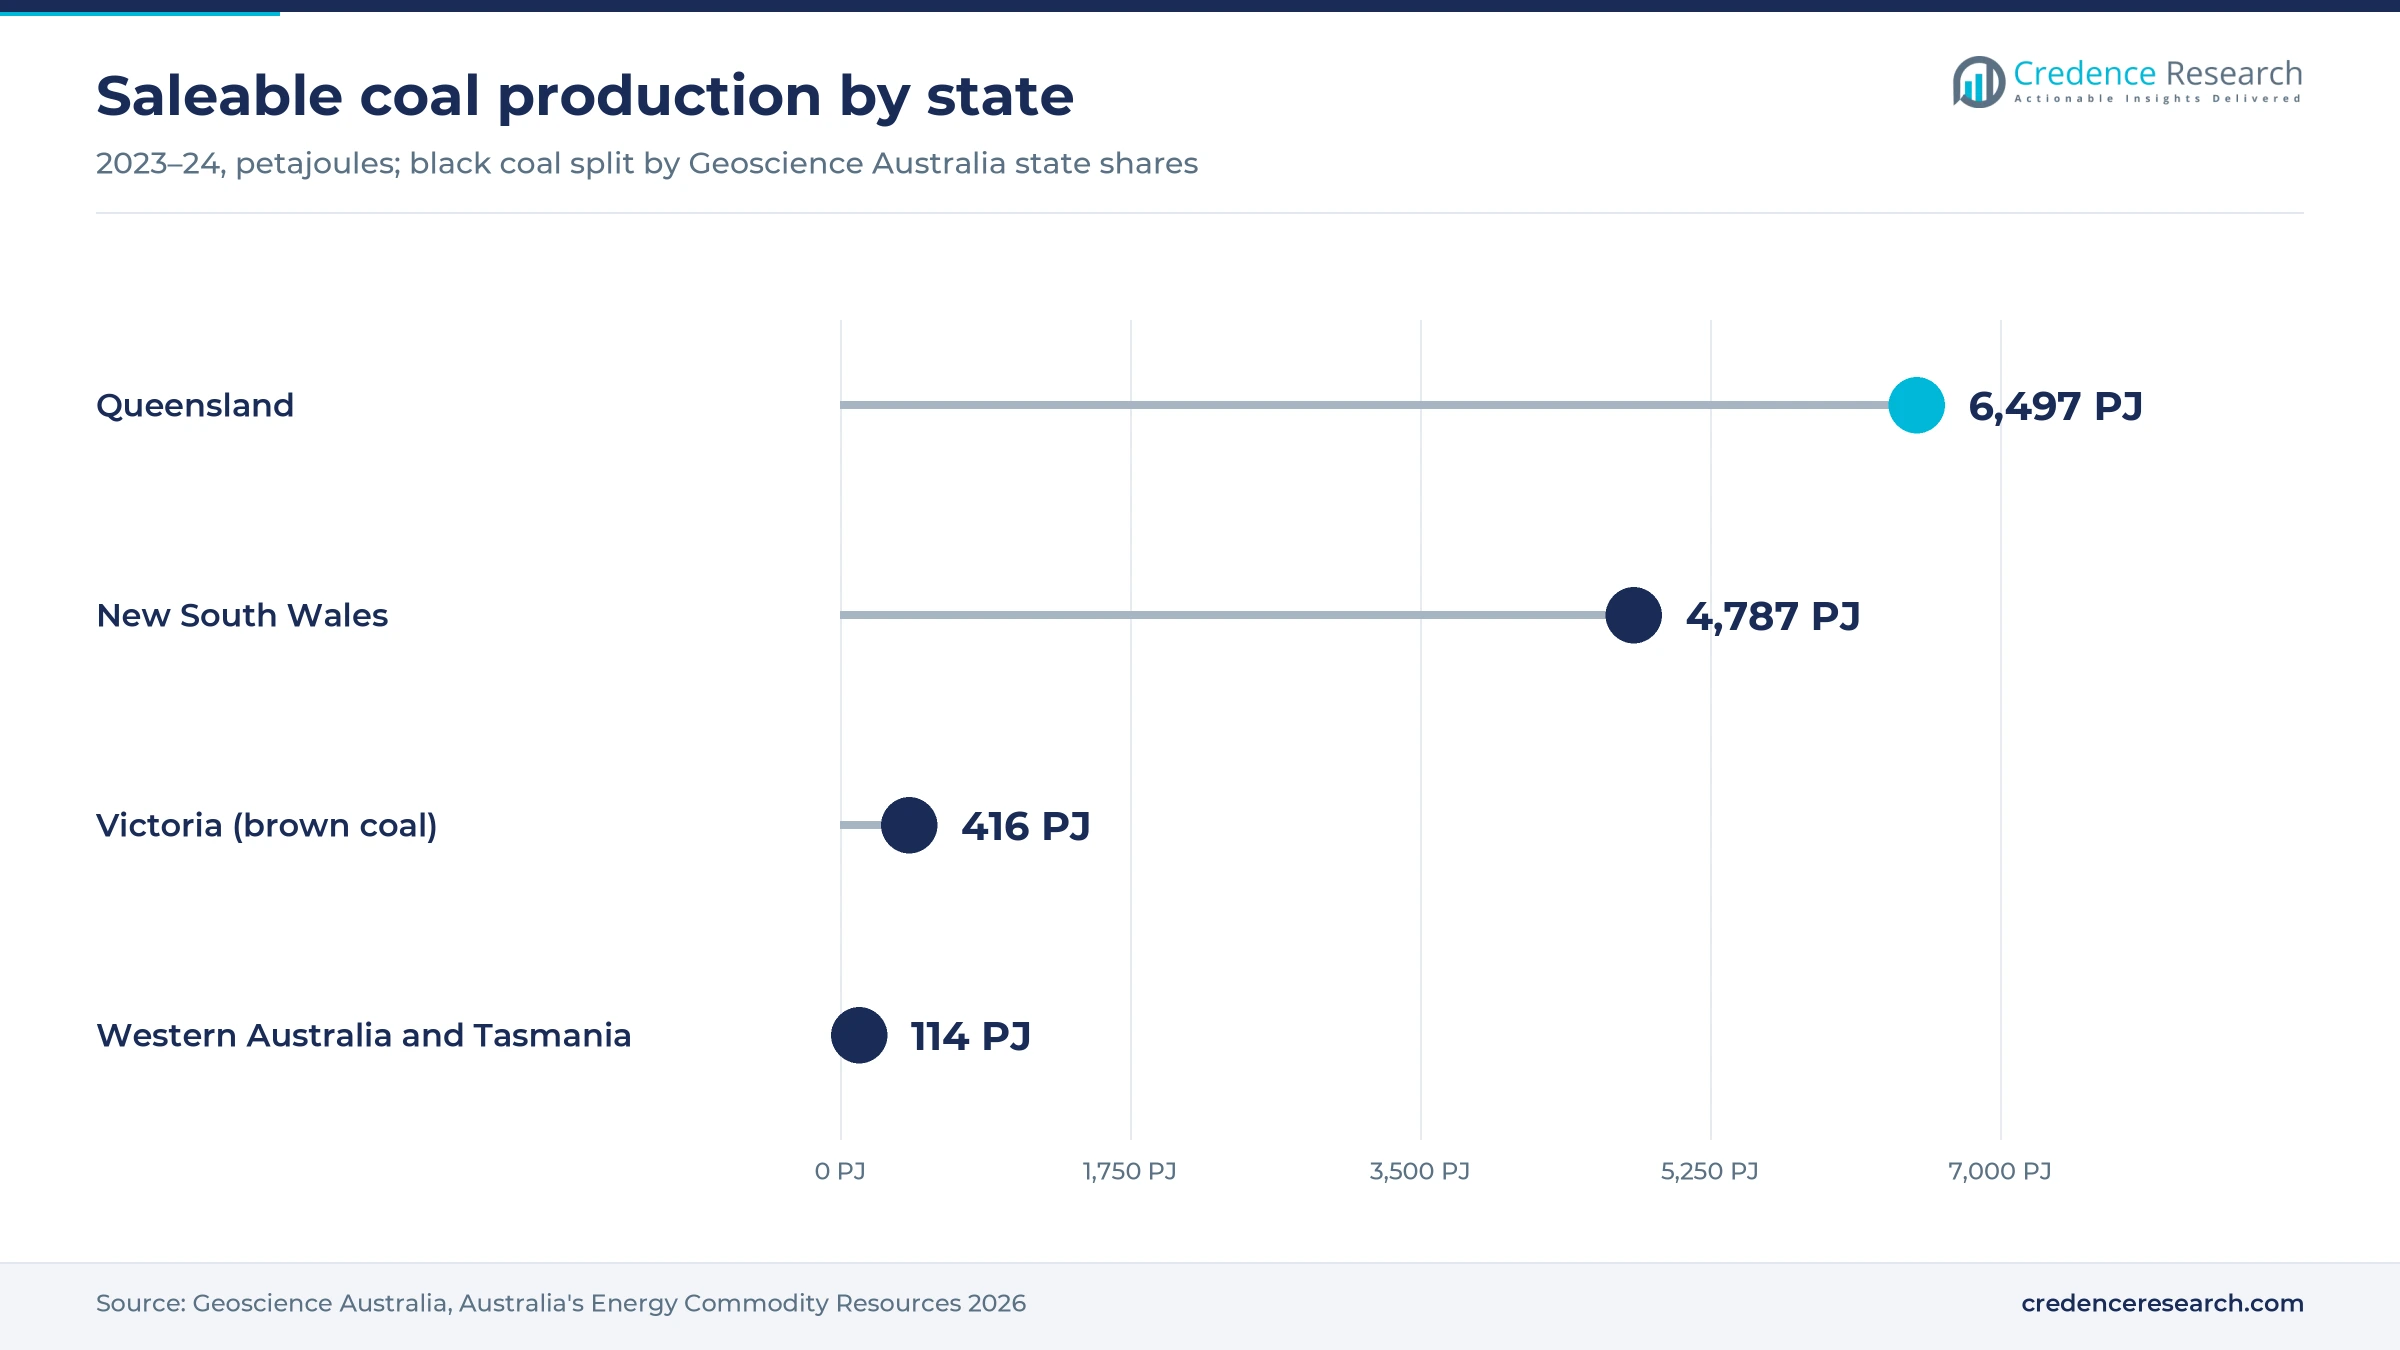
The estimate counts the value of saleable thermal, metallurgical and brown coal produced and sold in Australia, whether it is shipped abroad under term or spot contracts or delivered to domestic power stations, steel mills and industrial boilers. Value is measured at the point of sale, so it reflects both tons sold and the realized price for each coal grade in each year. State shares allocate national sales value by the state in which each sale is contracted, so they differ from mine output, where Queensland produced 57% of black coal and New South Wales 42%, according to Geoscience Australia.
The estimate leaves out freight beyond the loading port, coal bed methane, coke made from coal and imported coal. Upstream mining equipment, rail haulage contracts and port services are treated as supplier markets rather than coal sales, because their value is already embedded in the delivered price of each ton.
Australia Coal Market Insights
- The Australia coal market is projected to decline from USD 62.70 billion in 2026 to USD 40.64 billion by 2035, a CAGR of -4.70%, as thermal coal demand fades.
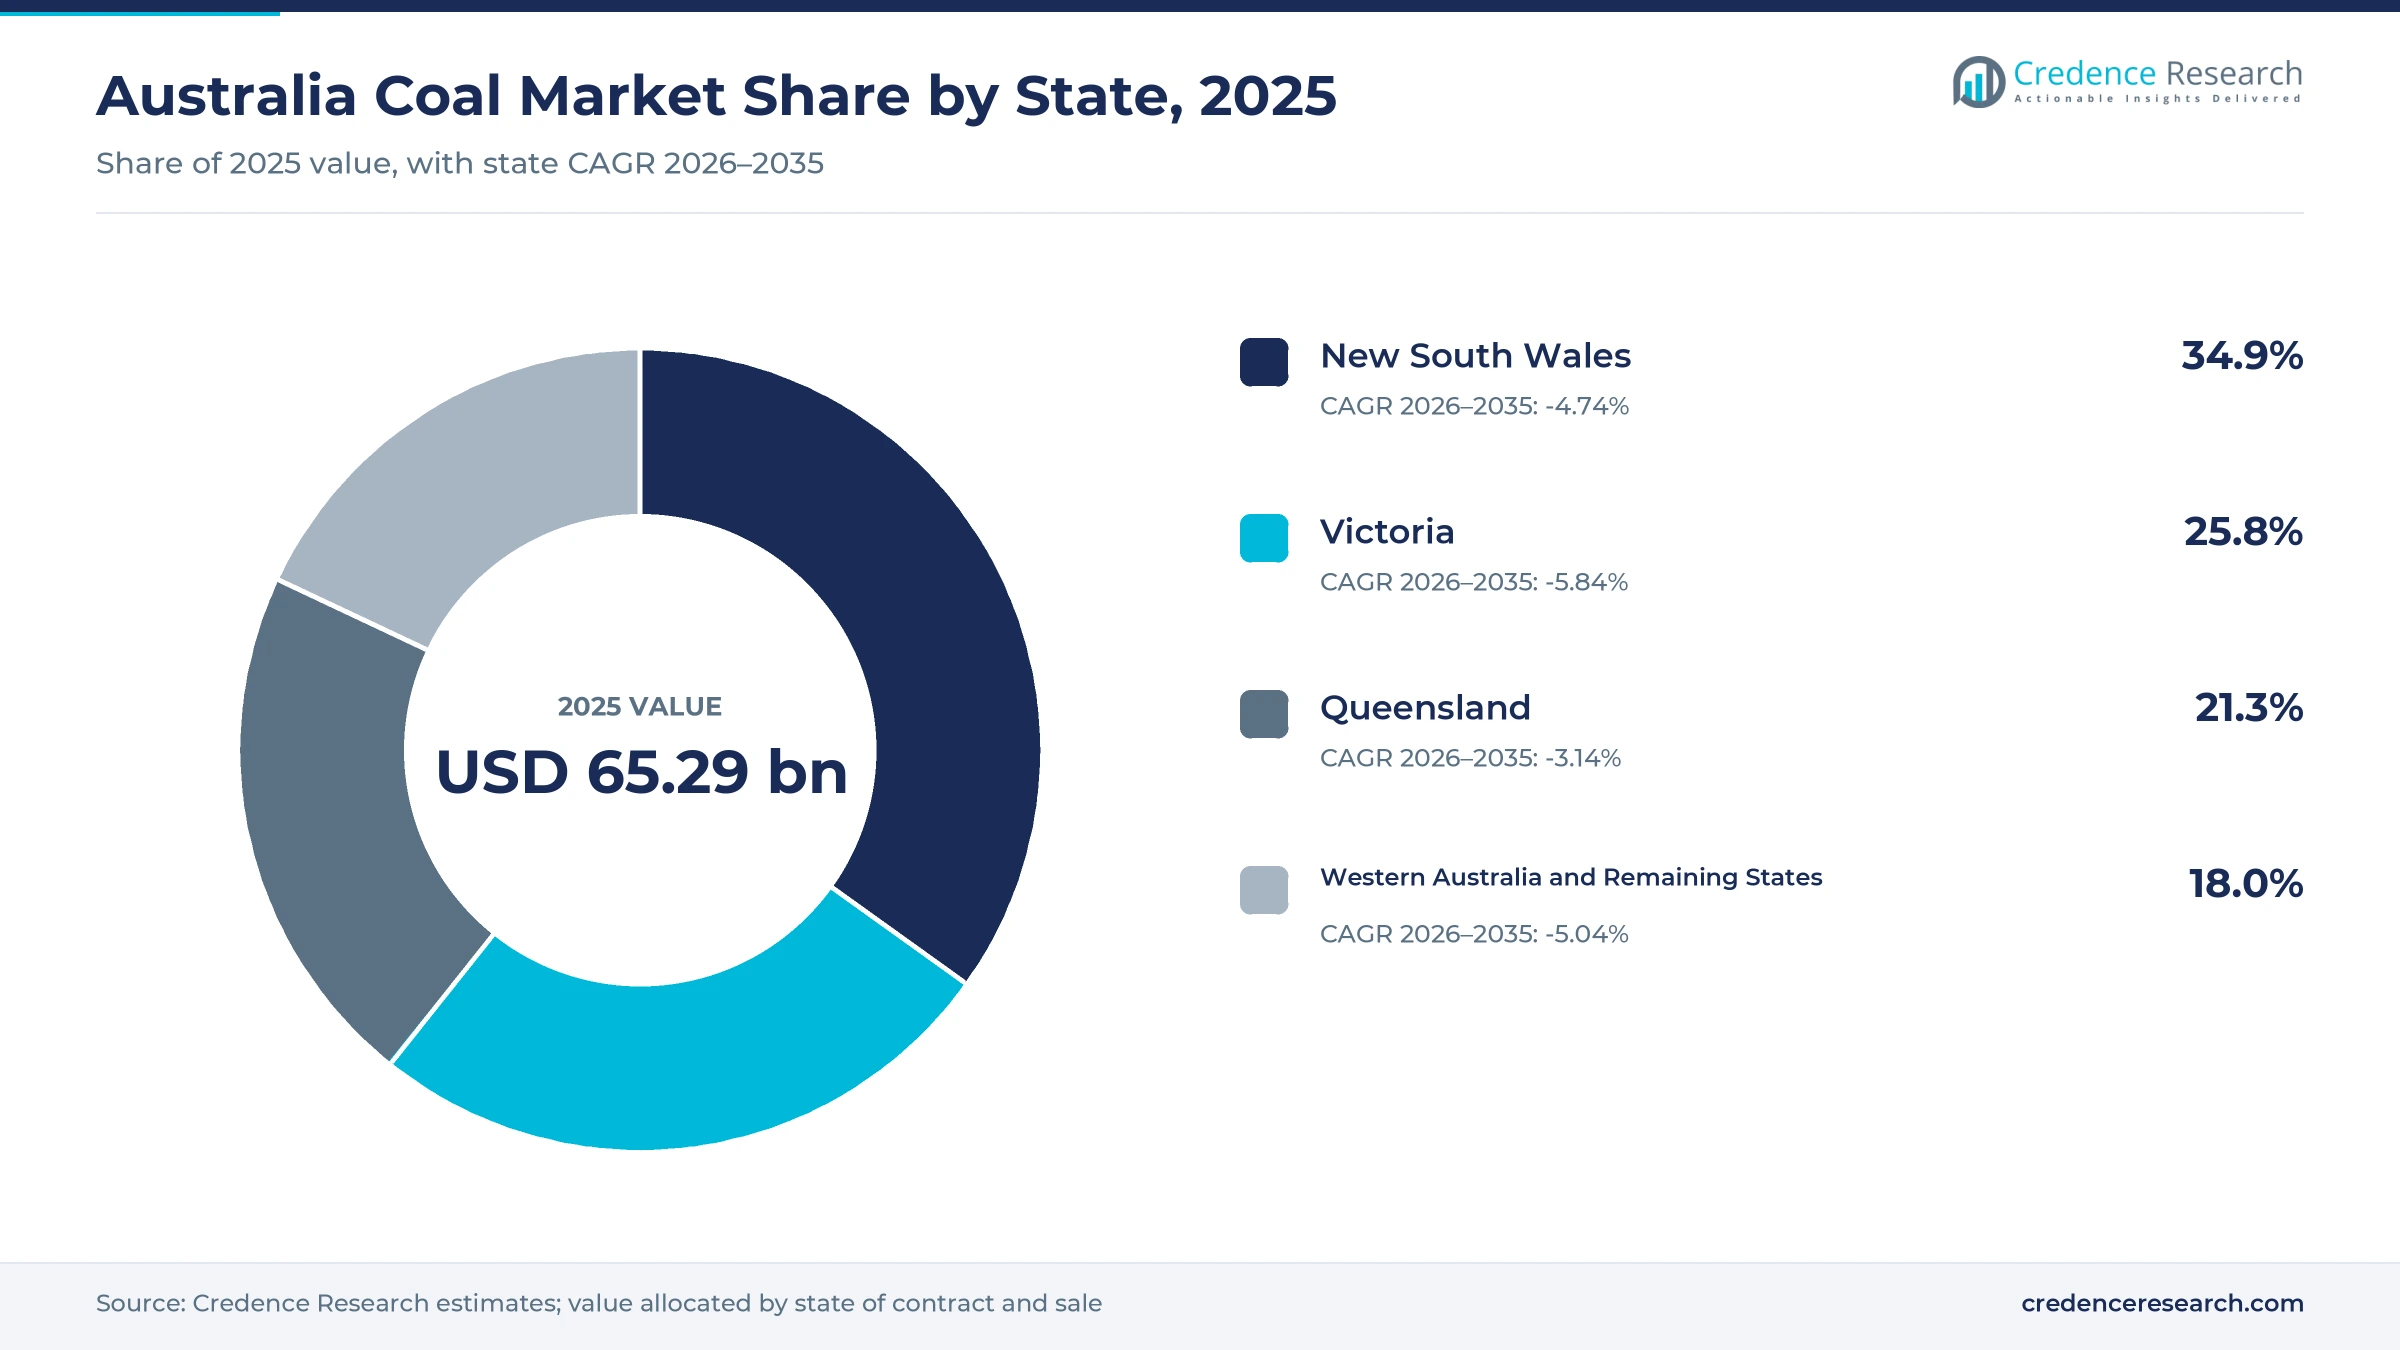
- New South Wales held the largest state share at 34.9% in 2025, reflecting thermal export and domestic power station contracts written in the state.
- Metallurgical coal led coal types with 52.0% of 2025 value, because Asian blast furnaces still rely on Bowen Basin coking grades.
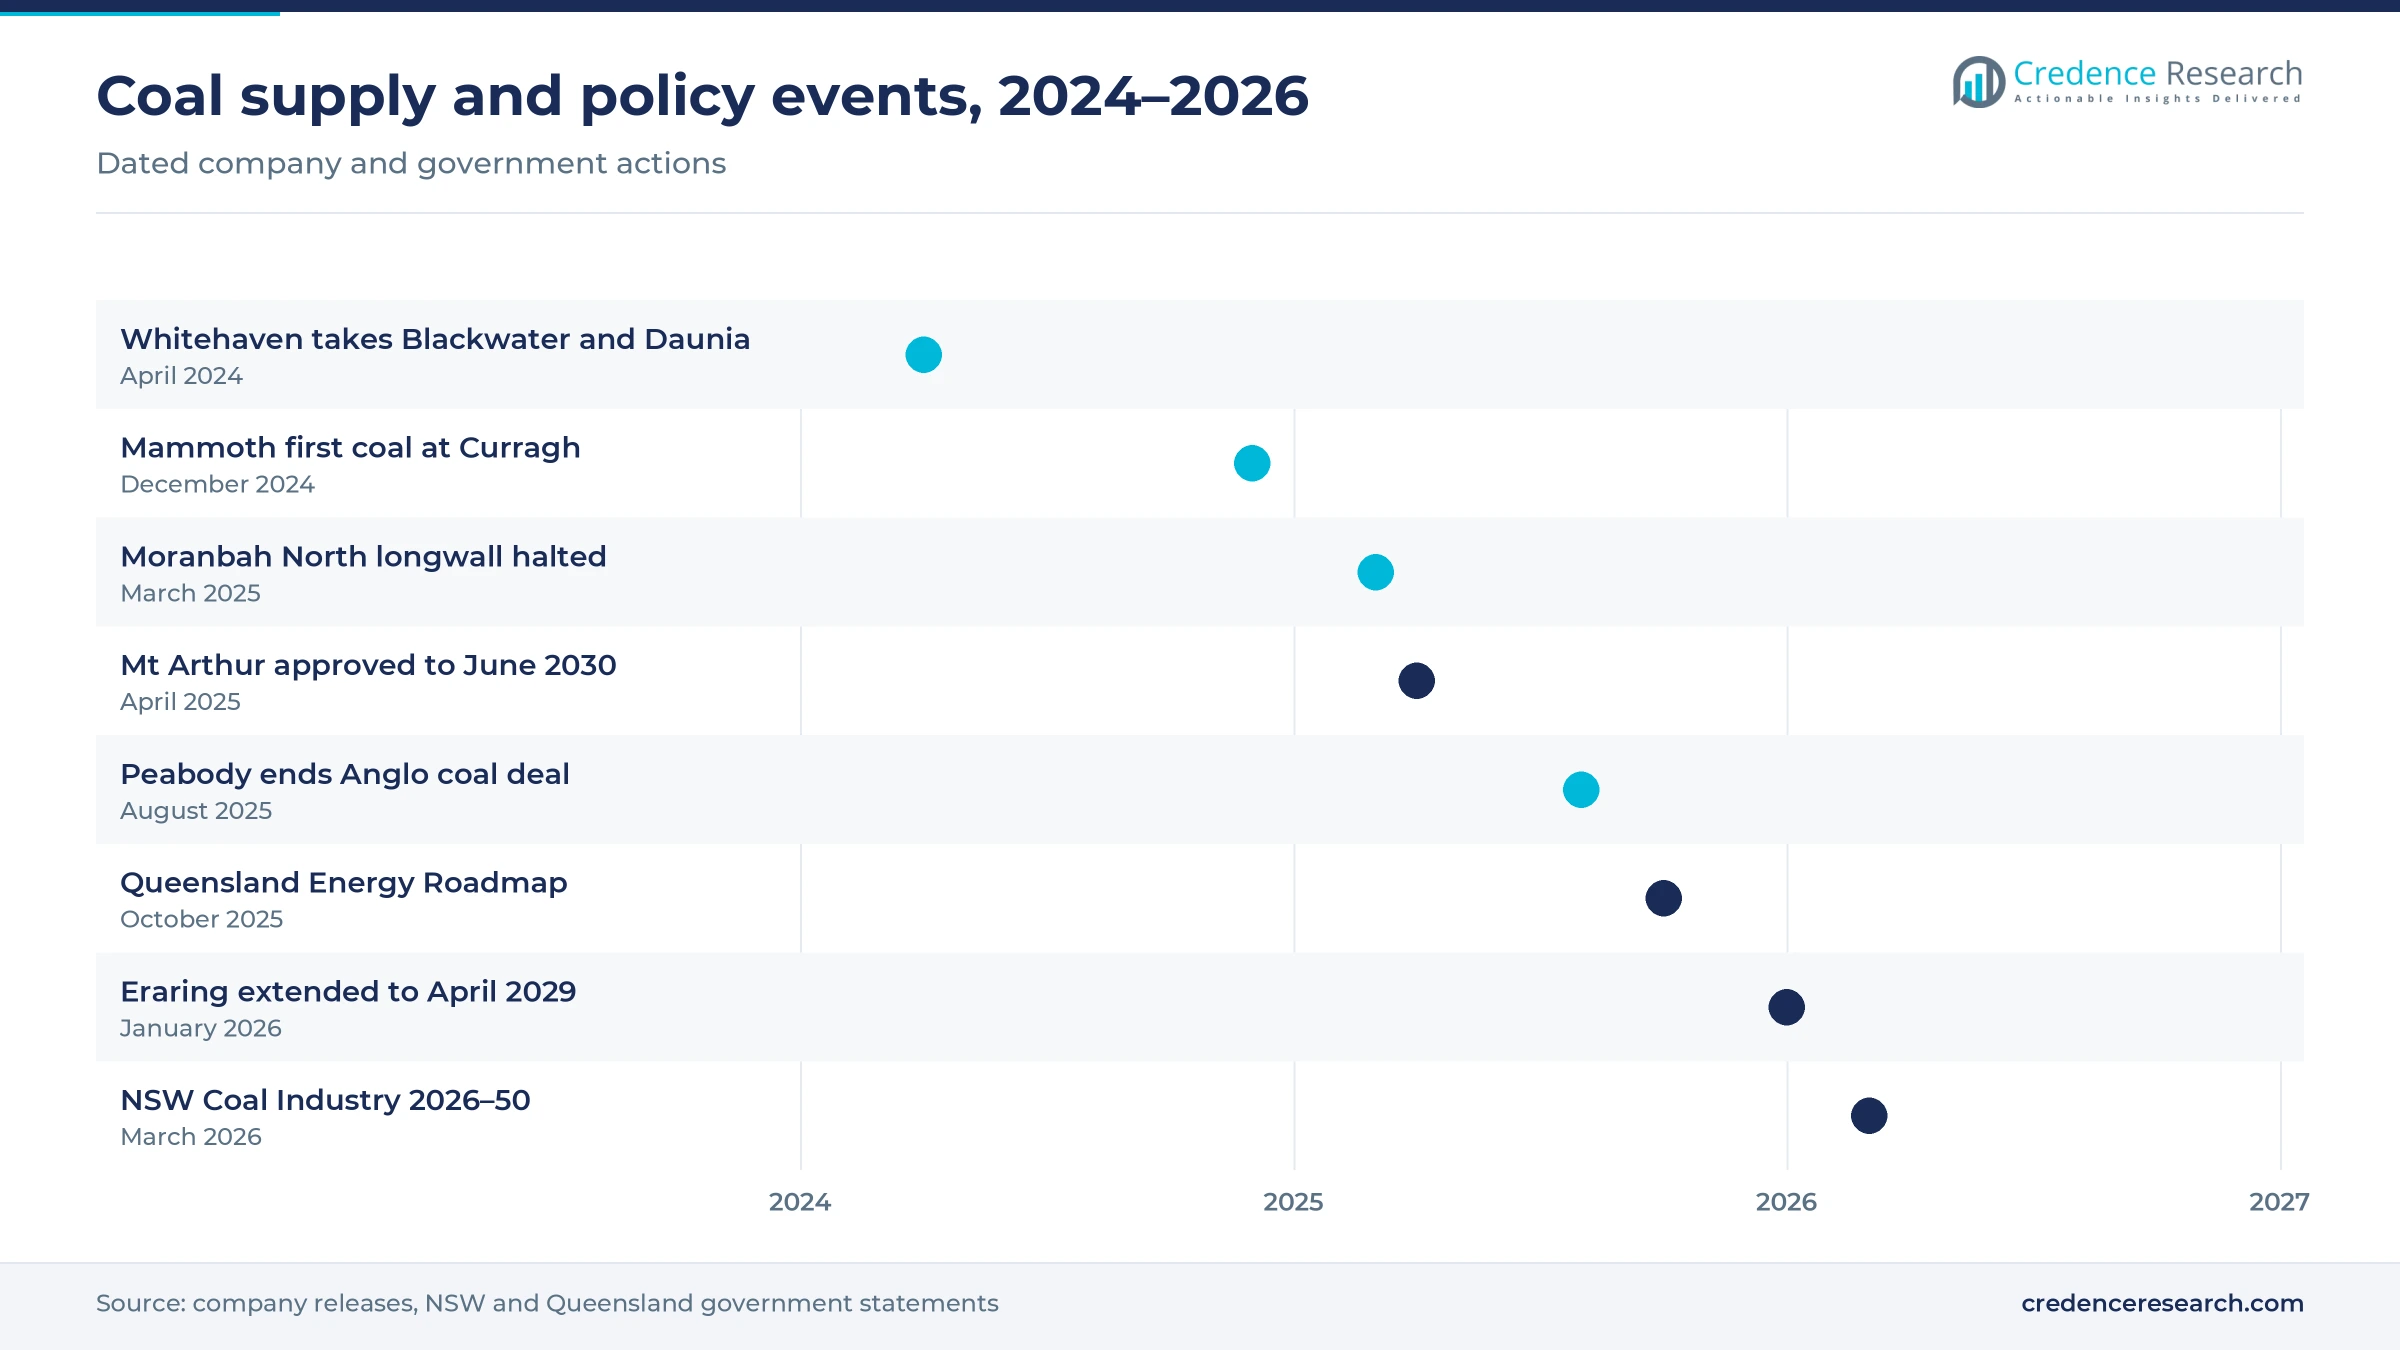
- Origin Energy decided in January 2026 to run Eraring until April 2029, which stretches domestic coal supply contracts beyond earlier closure plans.
- Ownership is shifting, as Whitehaven took over Blackwater and Daunia in April 2024 while Anglo American prepares to remarket its steelmaking coal assets.
Metallurgical coal holds the largest share of value
Why does coking coal outweigh thermal coal in value?
Based on coal type, the market is categorized into thermal coal, metallurgical coal and brown coal. Metallurgical Coal led with 52.0% of 2025 value, because hard coking and PCI grades sell at a premium to energy coal per ton. The same type also posts the mildest contraction, a CAGR of -3.74% during 2026–2035, since steel mills have few substitutes. Brown coal value shrinks fastest as Victorian generators approach their scheduled closure dates.
Which end use keeps coal demand most stable?
Based on application, the market is categorized into electricity generation, steelmaking and non-steel process heat. Steelmaking led with 51.0% of 2025 value, because hard coking and PCI grades sold to blast furnaces across Asia earn the highest prices per ton. Steelmaking also records the mildest decline, a CAGR of -3.74% during 2026–2035. Electricity generation contracts faster because export buyers and domestic generators both plan lower coal burn over the decade.
How do power generators and steel producers differ as buyers?
Based on customer type, the market is categorized into power generators, steel producers, process-heat users and trading intermediaries. Power Generators led with 44.0% of 2025 value, because domestic stations and North Asian utilities buy large volumes under term contracts. Steel producers decline least, a CAGR of -3.70%, as integrated mills keep sourcing premium coking coal. Specialist commodity trading houses remain important for smaller mines that lack direct offtake ties.
Why do term export contracts dominate coal sales?
Based on sales channel, the market is categorized into direct export contracts, export spot sales and domestic supply agreements. Direct Export Contracts led with 62.0% of 2025 value, because large producers sell most tons under annual or multi-year terms linked to index prices. The same channel also shows the mildest decline, a CAGR of -4.29% during 2026–2035. Domestic supply agreements contract fastest as coal-fired stations in New South Wales and Victoria approach retirement.
| Segment Group | Leading Sub-segment | Share, 2025 | Fastest-growing Sub-segment | CAGR, 2026–2035 |
|---|---|---|---|---|
| By Coal Type | Metallurgical Coal | 52.0% | Metallurgical Coal | -3.74% |
| By Application | Steelmaking | 51.0% | Steelmaking | -3.74% |
| By Customer Type | Power Generators | 44.0% | Steel Producers | -3.70% |
| By Sales Channel | Direct Export Contracts | 62.0% | Direct Export Contracts | -4.29% |
Request a Free Sample
Fill in your details and we'll send you a free sample report.
- Sample data tables & charts
- Research methodology
Steel demand and port capacity slow the decline
Steelmaking supply security keeps coking coal in demand
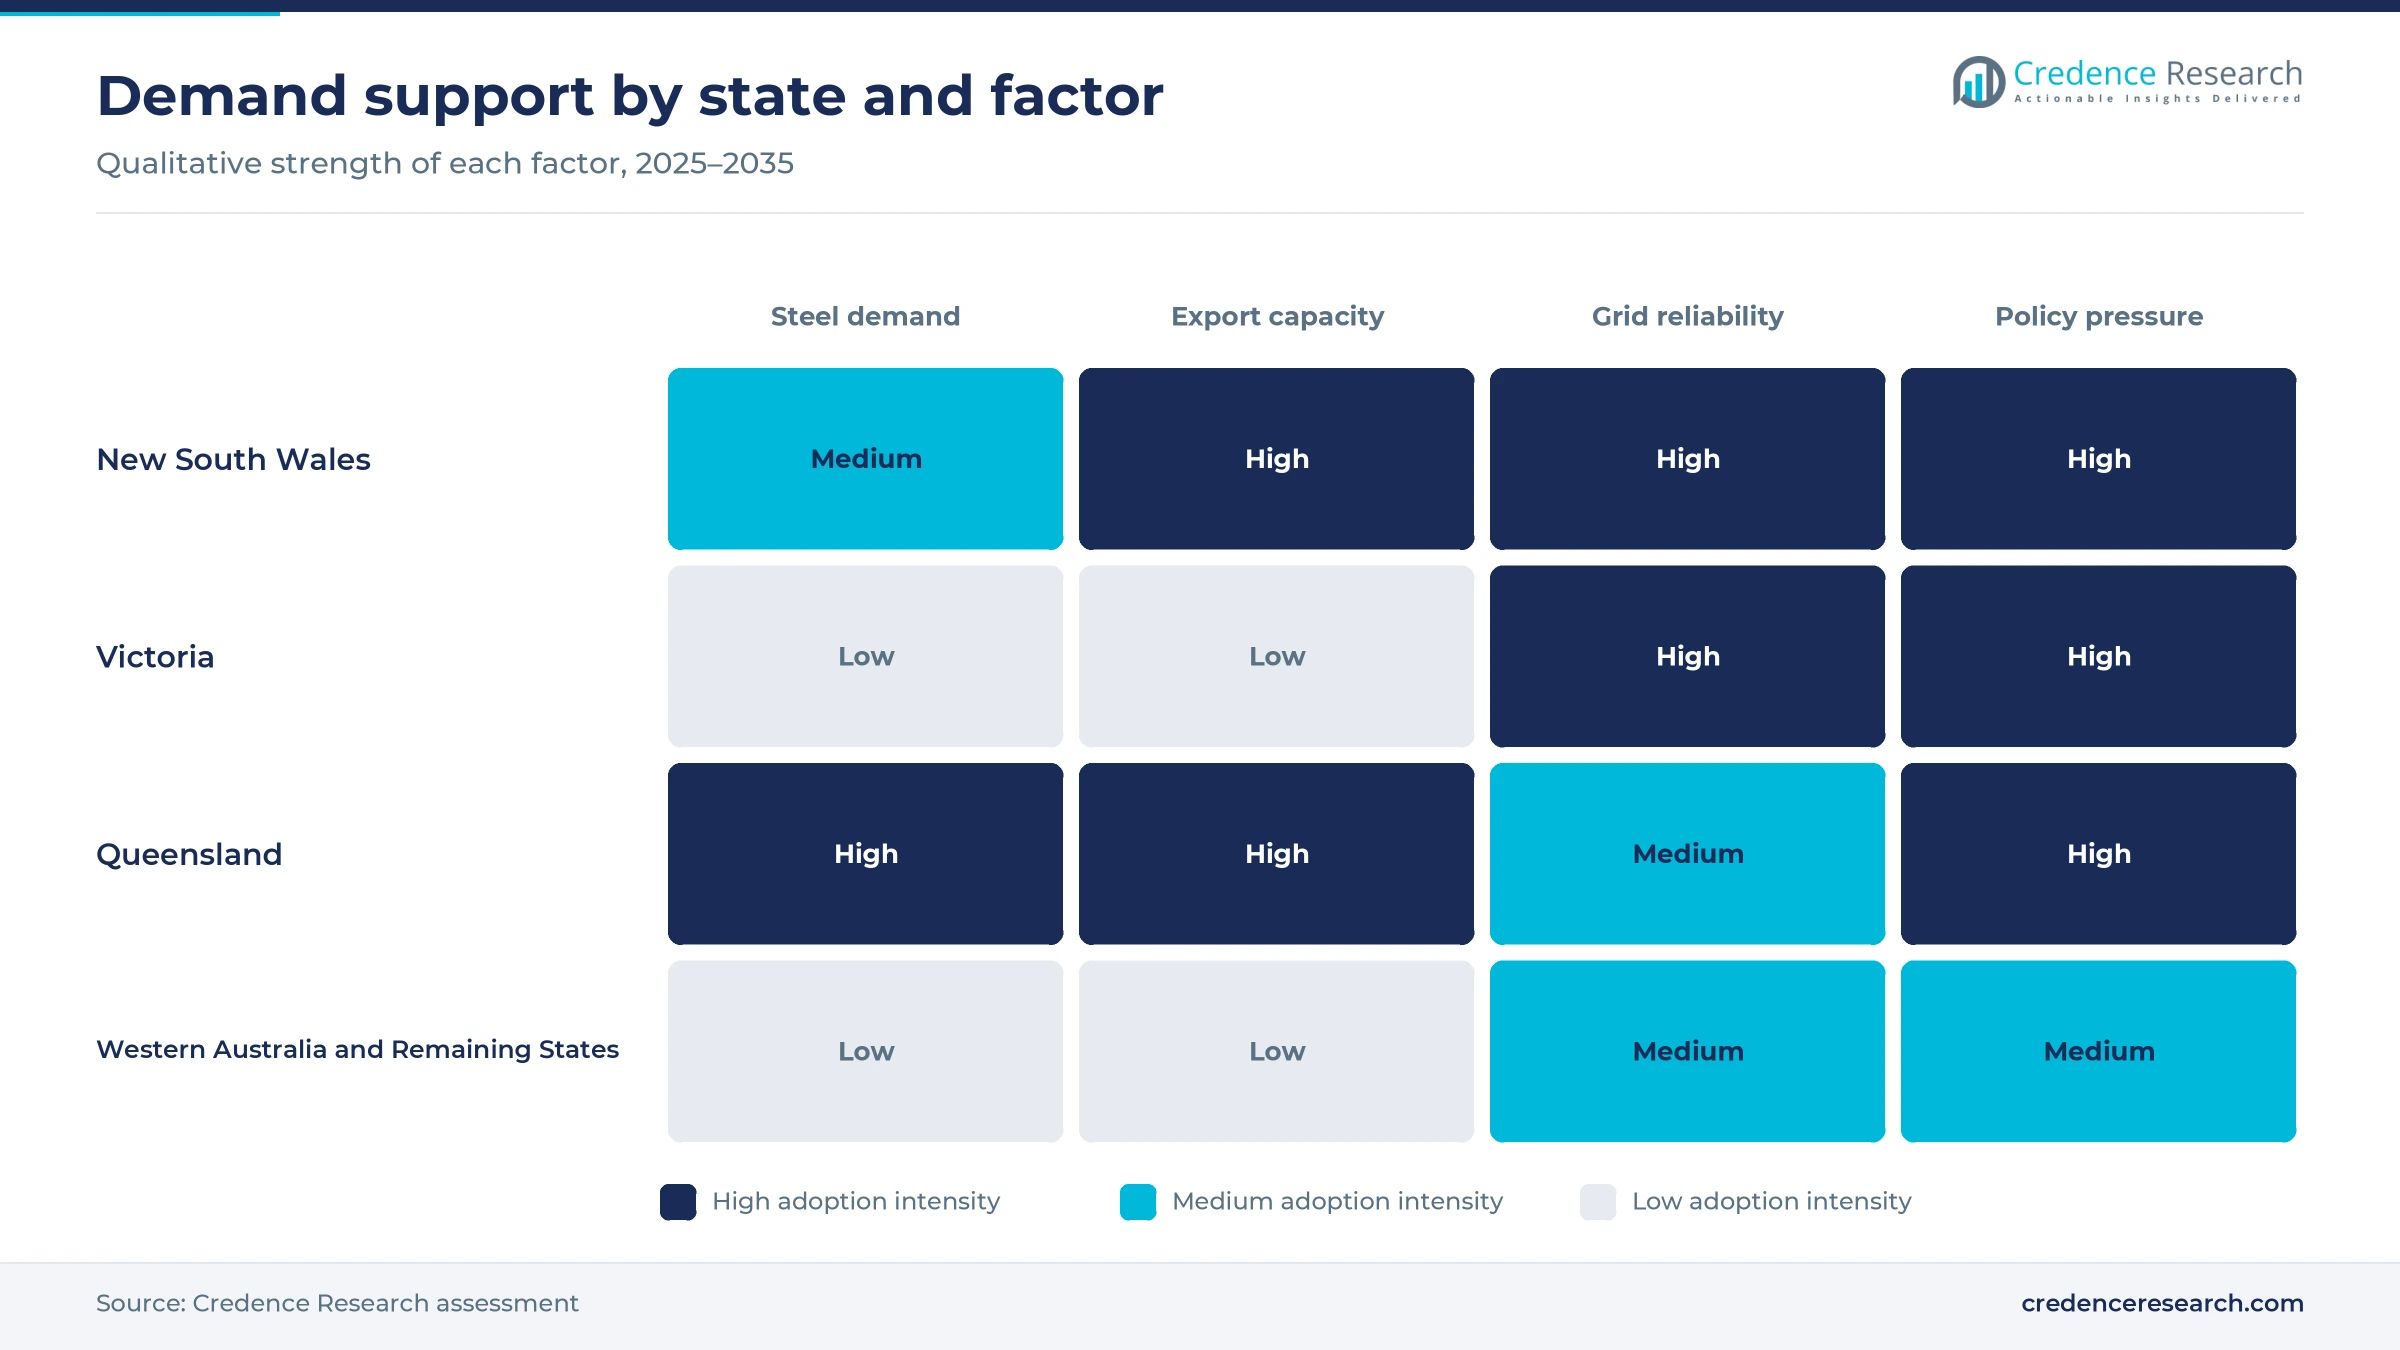
Steel producers across Asia keep buying Australian metallurgical grades because blast furnace output cannot switch quickly to other reductants, and this demand sustains the largest share of value. The IEA describes Australia as the largest exporter of metallurgical coal and reports that export volumes held stable at 153 Mt in 2024, according to its Coal Mid-Year Update 2025. The same agency expects Australian metallurgical exports to regain 5 Mt in 2026 after weather-related losses in 2025. As a result, steelmaking held 51.0% of 2025 value and records the mildest decline of any application. Stanmore Resources reported record saleable output of 14.0 Mt in 2025, which shows how much Bowen Basin capacity still serves this demand.
Existing export infrastructure keeps shipping costs low
Sunk investment in rail corridors and coal terminals lets producers keep shipping at a low marginal cost even as prices soften, which slows the decline in value. Geoscience Australia reports that the country had 96 operating black coal mines in 2024 and supplied about 25% of world coal exports, according to its energy commodity resources assessment. The Port of Newcastle shipped more than 149 million tons of coal in 2025, the Newcastle Herald reported, which keeps Hunter Valley mines connected to buyers across Asia. Because this terminal and rail capacity is already built, direct export contracts held 62.0% of 2025 value and show the mildest channel decline across the forecast.
Domestic reliability requirements extend coal supply
Grid operators and state governments still need coal-fired stations to cover evening peaks while transmission and storage projects are completed, and this demand supports domestic supply agreements. Coal-fired generation supplied 57% of grid electricity in New South Wales in 2024–25, according to the NSW Government's industry statement for 2026 to 2050. In January 2026, Origin Energy announced it would run all four units of the 2,880 MW Eraring station until April 2029. In Queensland, the Energy Roadmap released in October 2025 keeps state-owned coal plants running to their technical life, which is at least 2046 for some units. These decisions slow the contraction of generator demand, although power generators still decline faster than steel producers through 2035.
Brownfield extensions and new owners sustain output
Approvals for brownfield extensions and the entry of focused coal owners keep production capacity in place, even as the long-term demand outlook softens. In April 2025, New South Wales planning authorities approved a four-year extension that lets BHP run Mt Arthur until June 2030 at about 25 million tons of thermal coal a year. In September 2025, the federal government approved Glencore's Ulan extension, which adds 18.8 million tons and two more years of mining to 2035. Whitehaven Coal took operational control of the Blackwater and Daunia mines on April 3, 2024. Coronado delivered first coal from the Mammoth underground mine at Curragh in December 2024, a project designed for up to 3.6 Mtpa of run-of-mine coal.
Ownership changes and export shifts reshape supply
Thermal export volumes shift into gradual decline
Thermal coal exports are shifting from a plateau into gradual decline as buyers in North Asia burn less coal and domestic plants move toward closure. The IEA reports that Australian thermal coal exports rose 3% to 209 Mt in 2024 but projects a further fall of 1 Mt in 2026. The NSW Government notes that thermal export volumes fell about 4% between 2018–19 and 2024–25, while 93% of the state's coal exports are thermal grades. As a result, thermal coal declines faster than metallurgical coal across the forecast, and New South Wales contracts at a CAGR of -4.74% during 2026–2035. Producers with lower-cost open-cut mines are best placed to keep their term contracts as volumes ease.
Steelmaking coal assets shift to new owners
Ownership of Queensland steelmaking coal assets is shifting as diversified miners exit and focused producers step in. Peabody terminated its planned purchase of Anglo American's steelmaking coal business on Aug. 19, 2025, after an ignition event at Moranbah North on March 31, 2025, halted longwall production. Peabody said Moranbah North had been targeted for 5.3 million tons of saleable output in 2025, which made it the most significant mine in that deal. Anglo American's chief executive said in October 2025 that the business would be remarketed once coal flows again at Moranbah North. In September 2025, BHP and Mitsubishi announced that Saraji South would enter care and maintenance in November 2025.
Opportunity in firm supply deals for life-extended plants
Mines located near domestic power stations have an opening to sign longer supply agreements as generators extend operating lives to protect reliability. The NSW Coal Industry 2026–50 statement says that three of the four remaining coal-fired stations in the state are due to close by 2033 and that secure coal supply to existing generators remains vital until then. Centennial, owned by Banpu, runs five mines and says its coal fuels around 20% of the state's coal-fired generating capacity. Because Eraring now runs until April 2029, nearby suppliers gain added years of contracted volume. Domestic supply agreements still decline across 2026–2035, yet these extensions give suppliers predictable cash flow that can fund rehabilitation and closure planning.
Opportunity in methane cuts under Safeguard baselines
Producers that cut fugitive methane and diesel use can protect margins and approvals as emissions rules tighten on large mines. The Clean Energy Regulator explains that reformed Safeguard Mechanism baselines commenced on July 1, 2023, and decline at a default rate of 4.9% for covered facilities. The scheme applies to facilities that emit more than 100,000 tons of carbon dioxide equivalent, a threshold that captures many large coal mines. The NSW Government reports that the coal sector accounted for 11% of state emissions in 2022, so verified abatement can ease approval risk for extensions. Suppliers of gas drainage, flaring and electrified haulage therefore gain steady work at operating mines.
Royalties, closures and outages pressure producers
Royalty tiers squeeze Queensland mine margins
Queensland's progressive royalty scheme, introduced in 2022, applies rates of 20% above A$175 a ton, 30% above A$225 and 40% above A$300. BHP Mitsubishi Alliance cited these royalties and weak metallurgical coal prices when it moved Saraji South toward care and maintenance in November 2025. Higher-cost underground mines feel the pressure first, because their margins are thinner when prices fall. Producers are responding with cost reviews, deferred expansions and closer scrutiny of marginal pits across the Bowen Basin.
Retirement dates shrink domestic power demand
EnergyAustralia said in March 2021 that its 1,450 MW Yallourn brown coal station would close in mid-2028, four years earlier than planned. The NSW Government also expects coal use for power generation in that state to be phased out by 2040. These retirement schedules remove the largest domestic buyers within the forecast period, which hits brown coal and domestic supply agreements hardest. Mines tied to a single power station therefore face stranded reserves unless they find export or process-heat buyers.
Weather and mine incidents disrupt export supply
Heavy rain, flooding and underground incidents interrupt production and shipments, and these interruptions weaken contract reliability for buyers. The IEA expects Australian metallurgical coal exports to fall by 5 Mt in 2025 because of repeated weather-related disruptions. Moranbah North stopped longwall production after the March 2025 ignition event, while Tahmoor and Dartbrook in New South Wales suspended operations during 2025. Each outage raises unit costs and pushes buyers toward alternative suppliers from other exporting countries.
Limits on greenfield mines narrow future supply
The NSW Government will not consider new standalone greenfield coal mines and assesses extensions of existing mines case by case. This policy limits new supply to brownfield projects near existing infrastructure, which restricts options for smaller producers. The same statement cites IEA projections that global coal consumption could fall between 8% and 60% by 2035. Financiers and insurers weigh these risks, so capital for new pits is becoming more expensive and harder to secure for most producers.
New South Wales leads while Queensland declines least
| State | Value, 2025 (USD billion) | Share, 2025 | CAGR, 2026–2035 |
|---|---|---|---|
| New South Wales | 22.79 | 34.9% | -4.74% |
| Victoria | 16.85 | 25.8% | -5.84% |
| Queensland | 13.91 | 21.3% | -3.14% |
| Western Australia and Remaining States | 11.75 | 18.0% | -5.04% |
New South Wales leads on thermal exports and local supply
New South Wales held 34.9% of 2025 value, the largest state share, and contracts at a CAGR of -4.74% during 2026–2035. The state had 35 producing mines in 2025, 19 of them in the Hunter, and about 85% of its output was exported, mainly to Japan, South Korea, China and Taiwan. Domestic demand remains material because coal-fired stations still supply most of the state's grid electricity. However, Mt Arthur is approved only until June 2030, and new standalone greenfield mines will not be considered.
Victoria shows the steepest decline as generators retire
Victoria held 25.8% of 2025 value and shows the steepest decline, a CAGR of -5.84% during 2026–2035, because its allocated value combines sales contracted from Melbourne with brown coal supply to Latrobe Valley power stations. Brown coal, a form of lignite, is burned at mine-mouth stations rather than exported. Geoscience Australia reports that Victoria produced 40.3 Mt of brown coal in 2023–24, mainly in the Gippsland Basin, and had three operating brown coal mines in 2024. Yallourn's planned mid-2028 closure therefore removes a large buyer early in the forecast period.
Queensland declines least on steelmaking coal demand
Queensland held 21.3% of 2025 value and records the mildest decline among states, a CAGR of -3.14% during 2026–2035, because Bowen Basin mines supply coking coal to steel mills across Asia. Whitehaven, Stanmore, Coronado and the BHP Mitsubishi Alliance all run metallurgical operations in the basin. At home, the Energy Roadmap released in October 2025 keeps state-owned coal plants running to their technical life. Royalty tiers and the suspension of Saraji South show, however, that high-cost mines remain exposed.
Western Australia and smaller states hold residual demand
Western Australia and Remaining States held 18.0% of 2025 value and decline at a CAGR of -5.04% during 2026–2035. Geoscience Australia reports that Western Australia and Tasmania produce the small balance of black coal outside Queensland and New South Wales, while South Australia holds black coal resources. This zone's allocated value includes sales contracted outside the three eastern states, while local mines mainly supply power stations and industrial users that face retirement dates.
Acquisitions, extensions and closures since 2024
| Development | Status and market relevance |
|---|---|
| In April 2024, Whitehaven Coal completed its acquisition of the Blackwater and Daunia metallurgical coal mines in the Bowen Basin. | Completed; adds steelmaking coal to a thermal-led portfolio |
| In December 2024, Coronado Global Resources delivered first coal from the Mammoth underground mine, expanding Curragh capacity by up to 3.6 Mtpa. | Ramped up through 2025; supports metallurgical exports |
| In August 2025, Peabody Energy terminated its planned acquisition of Anglo American's steelmaking coal assets after the Moranbah North incident. | Terminated; Anglo American plans to remarket the business |
| In September 2025, BHP Mitsubishi Alliance announced that Saraji South would enter care and maintenance in November 2025. | Suspended; cited royalties and weak metallurgical prices |
| In January 2026, Origin Energy announced that all four Eraring units would keep operating until April 2029. | Extended; supports domestic thermal coal supply in New South Wales |
Mining technology shifts toward automation and abatement
- Longwall automation lets underground mines hold output with fewer people at the face, which matters for high-cost Bowen Basin operations.
- Gas drainage and flaring reduce fugitive methane, helping mines stay within declining Safeguard Mechanism baselines.
- Electrified haulage and trolley-assist trucks cut diesel use, and suppliers of underground mining equipment are adapting machines for battery power.
- Product blending at mines and ports lets sellers combine seams to meet buyer quality limits on ash, sulfur and energy content.
Need a Custom Version of This Report?
Tailor the scope, geography, or segments to your exact requirements.
- Custom geography or segment scope
- Direct access to our analyst team
Producers compete on coking quality and port access
Competition centers on coal quality, cost position and secure access to rail and port capacity rather than on price alone. Through BMA, BHP runs large Bowen Basin metallurgical operations alongside Whitehaven Coal, while BHP and Glencore hold major thermal mines in the Hunter and Western coalfields. Yancoal Australia reported record saleable production of 50.8 Mt on a 100% basis in 2025, which makes it one of the largest New South Wales suppliers. Stanmore Resources and Coronado Global Resources focus on Queensland coking coal, and New Hope Corporation runs Bengalla and the restarted New Acland mine. Centennial Coal serves New South Wales power stations from five mines. Anglo American is preparing to remarket its steelmaking coal assets after its sale to Peabody Energy was terminated, which could change ownership in the Bowen Basin again.
Companies profiled and their roles in this market
| Company | Type | Role in the market |
|---|---|---|
| BHP | Diversified miner | Runs BMA coking coal mines and the Mt Arthur thermal mine to 2030 |
| Glencore | Diversified miner and trader | Runs thermal mines including Ulan, approved to 2035 |
| Yancoal Australia | Coal producer | Produced 50.8 Mt saleable coal in 2025 on a 100% basis |
| Whitehaven Coal | Coal producer | Runs Blackwater and Daunia coking coal mines since April 2024 |
| Stanmore Resources | Coal producer | Produced 14.0 Mt saleable coal in 2025 at Bowen Basin mines |
| Anglo American | Diversified miner | Owns Moranbah North and plans to remarket its coal assets |
| Peabody Energy | Coal producer | Terminated its Anglo American coal purchase in August 2025 |
| Coronado Global Resources | Coal producer | Runs Curragh and the Mammoth underground mine |
| New Hope Corporation | Coal producer | Runs Bengalla in New South Wales and New Acland in Queensland |
| Centennial Coal | Domestic coal supplier | Runs five mines that fuel about 20% of NSW coal generating capacity |
Credence Research view on a shrinking coal market
Credence Research's view is that the Australia coal market is entering a managed decline rather than a sudden collapse, with value falling by roughly a third between 2026 and 2035. Metallurgical coal remains the anchor because Asian steelmakers have few substitutes, so Queensland and term export contracts keep the mildest declines. Thermal coal faces a steeper fall as domestic stations retire and North Asian buyers burn less coal. Producers with low-cost open-cut mines, secure port allocations and credible methane plans should keep their contracts longest, while high-cost underground operations face suspension risk whenever prices fall.
How the state and segment estimates were built
The report uses 2025 as the base year on a calendar basis, and market values come from the Credence Research model. That model draws on Geoscience Australia resource data, state government industry statements, IEA trade forecasts, regulator pages, company releases and stock exchange reports. Segment splits and state growth rates are Credence Research estimates, while state shares follow an allocation of value by contracting state rather than by mine location. Sources used are government pages, agency reports, company filings and trade media, and no interviews or surveys were used.
Coal value falls to 2035 as power demand retires
The Australia coal market is expected to decline to USD 40.64 billion by 2035, a -4.70% CAGR during 2026–2035, as thermal coal demand fades at home and abroad. Metallurgical coal, steelmaking customers and direct export contracts decline least, because blast furnace demand across Asia changes more slowly than power demand. Victoria and domestic supply agreements fall fastest as brown coal and black coal stations retire. Royalty costs, weather disruptions and limits on greenfield mines will keep pressure on margins, while brownfield extensions keep supply available until the early 2030s.
Frequently Asked Questions
How big is the Australia coal market?
Which coal type holds the largest share of value?
Which state holds the largest share of coal value?
Which state declines least over the forecast?
Why is the market declining?
How do domestic reliability needs affect coal demand?
Which sales channel leads coal sales?
Which companies are active in the Australia coal market?
Table of Content
Chapter 1 Market Segmentation
- 1.1 Segmentation Framework
- 1.1.1 Product and Service Classification
- 1.1.2 Application and End-Use Classification
- 1.1.3 Technology and Solution Classification
- 1.1.4 Customer and Distribution Channel Classification
- 1.1.5 Geographic Segmentation
- 1.1.6 Market Segment Definitions and Boundaries
- 1.2 By Coal Type
- 1.2.1 Metallurgical Coal
- 1.2.2 Thermal Coal
- 1.2.3 Brown Coal
- 1.3 By Application
- 1.3.1 Steelmaking
- 1.3.2 Electricity Generation
- 1.3.3 Non-steel Process Heat
- 1.4 By Customer Type
- 1.4.1 Power Generators
- 1.4.2 Steel Producers
- 1.4.3 Trading Intermediaries
- 1.4.4 Process-heat Users
- 1.5 By Sales Channel
- 1.5.1 Direct Export Contracts
- 1.5.2 Export Spot Sales
- 1.5.3 Domestic Supply Agreements
- 1.6 By State
- 1.6.1 Queensland
- 1.6.2 New South Wales
- 1.6.3 Victoria
- 1.6.4 Western Australia and Remaining States
Chapter 2 Introduction
- 2.1 Report Objectives and Scope
- 2.2 Product Definition and Industry Terminology
- 2.3 Market Inclusions and Exclusions
- 2.4 Research Process
- 2.4.1 Primary Research and Expert Interviews
- 2.4.2 Secondary Research and Source Review
- 2.4.3 Top-Down and Bottom-Up Estimation
- 2.4.4 Data Triangulation and Verification
- 2.5 Market Size Measurement Basis
- 2.5.1 2025: USD 65.29 billion → 2035: USD 40.64 billion
- 2.6 Historical and Forecast Reference Periods
- 2.6.1 Historical Period: 2018-2025
- 2.6.2 Base Year: 2025
- 2.6.3 Forecast Period: 2025-2035
- 2.7 Research Assumptions and Limitations
Chapter 3 Executive Summary
- 3.1 Market Snapshot and Key Findings
- 3.2 Base-Year Market Size, 2025
- 3.3 Forecast Market Size, 2035
- 3.4 Revenue and Volume Growth Outlook
- 3.5 Key Demand and Supply Indicators
- 3.6 Leading Market Segments
- 3.7 Fastest-Growing Market Opportunities
- 3.8 Regional Performance Highlights
- 3.9 Technology and Industry Transformation
- 3.10 Competitive Landscape Summary
- 3.11 Analyst View and Strategic Implications
Chapter 4 Australia Coal Market Trends and Developments
- 4.1 Historical Industry Development, 2018-2025
- 4.2 Recent Market Trends and Developments
- 4.3 Demand and Customer Behavior Trends
- 4.4 Technology and Product Innovation
- 4.5 Artificial Intelligence, Automation and Digitalization
- 4.6 Local Manufacturing and Supply Chain Realignment
- 4.7 Industry Partnerships, Mergers and Acquisitions
- 4.8 Sustainability and Circular Economy Developments
- 4.9 Government and Private Sector Investment Trends
- 4.10 Emerging Business Models and Commercialization
- 4.11 Industry Developments and Announcements
Chapter 5 Australia Coal Market Production, Supply and Demand Analysis
- 5.1 Demand Trend and Consumption Analysis, 2018-2025
- 5.2 Demand Forecast, 2025-2035
- 5.3 Production and Output Trend, 2018-2025
- 5.4 Production and Output Forecast, 2025-2035
- 5.5 Installed Capacity and Capacity Utilization
- 5.6 Company-Wise Production Plants and Statistics
- 5.6.1 Installed Production Capacity
- 5.6.2 Actual Production
- 5.6.3 Planned Capacity and Expansion Targets
- 5.7 Supply Chain Structure and Procurement Trends
- 5.8 Supply-Demand Gap and Bottlenecks
- 5.9 Import Dependence and Sourcing Structure
- 5.10 Contract Manufacturing and Outsourcing
- 5.11 Regional Supply and Demand Concentration
Chapter 6 Australia Coal Market Pricing Analysis
- 6.1 Pricing Structure and Measurement
- 6.2 Historical Pricing Trends, 2018-2025
- 6.3 Pricing Outlook, 2025-2035
- 6.4 Average Selling Price and Unit Economics
- 6.5 Pricing by Product and Market Segment
- 6.6 Geographic Pricing Differences
- 6.7 Key Input, Energy, Labor and Logistics Costs
- 6.8 Contract Pricing and Purchasing Models
- 6.9 Pricing Sensitivity and Competitive Positioning
- 6.10 Price, Margin and Profitability Implications
Chapter 7 Australia Coal Market Dynamics
- 7.1 Market Growth Drivers
- 7.1.1 Demand-Side Drivers
- 7.1.2 Technology and Innovation Drivers
- 7.1.3 Infrastructure and Investment Drivers
- 7.1.4 Regulatory and Policy Drivers
- 7.2 Market Restraints
- 7.2.1 Cost and Affordability Constraints
- 7.2.2 Technology and Adoption Barriers
- 7.2.3 Supply Chain and Operational Constraints
- 7.3 Market Challenges
- 7.3.1 Competitive Pressure and Margin Erosion
- 7.3.2 Skills, Infrastructure and Implementation Gaps
- 7.4 Emerging Market Opportunities
- 7.5 Market Dynamics Impact and Time-Horizon Assessment
Chapter 8 Australia Coal Value Chain Analysis
- 8.1 Industry Value Chain Overview
- 8.2 Upstream Suppliers and Critical Inputs
- 8.3 Technology and Component Providers
- 8.4 Manufacturing or Service Delivery
- 8.5 Distribution, Channel Partners and Integrators
- 8.6 Downstream Applications and End Users
- 8.7 Value Addition and Profit Pools
- 8.8 Vertical Integration and Outsourcing
- 8.9 Supplier Concentration and Risk
- 8.10 Supply Chain Localization and Resilience
Chapter 9 Australia Coal Market Regulations and Policies
- 9.1 Relevant Laws, Standards and Compliance Frameworks
- 9.2 Product, Service, Safety and Quality Requirements
- 9.3 Government Policies, Incentives and Subsidies
- 9.4 Imports, Exports and Trade Barriers
- 9.5 Public Procurement and Local Content Requirements
- 9.6 Environmental and Sustainability Compliance
- 9.7 Upcoming Policy Changes and Market Implications
Chapter 10 Australia Coal Market Hotspots and Opportunities
- 10.1 Market Opportunity Mapping and Growth Hotspots
- 10.2 High-Growth Applications and Customer Groups
- 10.3 Underserved Markets and White-Space Opportunities
- 10.4 Emerging Technology and Product Opportunities
- 10.5 New Capacity and Investment Hotspots
- 10.6 Market Entry and Expansion Opportunities
- 10.7 Distribution and Partnership Opportunities
- 10.8 Near-Term and Long-Term Commercial Potential
- 10.9 Opportunity Attractiveness and Execution Risks
Chapter 11 Australia Coal Market Outlook, 2025-2035
- 11.1 Market Size and Analysis
- 11.1.1 Revenue (Market Measurement: 2025: USD 65.29 billion → 2035: USD 40.64 billion)
- 11.1.2 Market Volume and Quantity Sold
- 11.1.3 Historical Market Size, 2018-2025
- 11.1.4 Base-Year Market Size, 2025
- 11.2 Market Forecast, 2025-2035
- 11.2.1 Revenue Forecast to 2035
- 11.2.2 Volume Forecast to 2035
- 11.2.3 CAGR and Year-on-Year Growth
- 11.2.4 Incremental Revenue Opportunity
- 11.3 Forecast Assumptions and Scenario Analysis
- 11.3.1 Base-Case Forecast
- 11.3.2 Optimistic and Conservative Scenarios
- 11.3.3 Technology, Pricing and Policy Sensitivities
- 11.4 Market Attractiveness and Growth Outlook
Chapter 12 Australia Coal Market Segmentation and Outlook
- 12.1 Segmentation Summary and Market Shares, 2025
- 12.2 Largest and Fastest-Growing Segments
- 12.3 By Coal Type - Market Size and Forecast, 2025-2035
- 12.3.1 Segment Definition and Scope
- 12.3.2 Historical Market Size, 2018-2025
- 12.3.3 Revenue Forecast, 2025-2035
- 12.3.4 Volume Forecast, 2025-2035
- 12.3.5 Base-Year Market Share, 2025
- 12.3.6 Segment CAGR and Growth Drivers
- 12.3.7 Subsegment Market Size and Forecast
- 12.3.7.1 Metallurgical Coal
- 12.3.7.2 Thermal Coal
- 12.3.7.3 Brown Coal
- 12.3.8 Subsegment Pricing and Adoption Trends
- 12.3.9 Leading Suppliers and Competition
- 12.3.10 Regional Demand and Opportunities
- 12.4 By Application - Market Size and Forecast, 2025-2035
- 12.4.1 Segment Definition and Scope
- 12.4.2 Historical Market Size, 2018-2025
- 12.4.3 Revenue Forecast, 2025-2035
- 12.4.4 Volume Forecast, 2025-2035
- 12.4.5 Base-Year Market Share, 2025
- 12.4.6 Segment CAGR and Growth Drivers
- 12.4.7 Subsegment Market Size and Forecast
- 12.4.7.1 Steelmaking
- 12.4.7.2 Electricity Generation
- 12.4.7.3 Non-steel Process Heat
- 12.4.8 Subsegment Pricing and Adoption Trends
- 12.4.9 Leading Suppliers and Competition
- 12.4.10 Regional Demand and Opportunities
- 12.5 By Customer Type - Market Size and Forecast, 2025-2035
- 12.5.1 Segment Definition and Scope
- 12.5.2 Historical Market Size, 2018-2025
- 12.5.3 Revenue Forecast, 2025-2035
- 12.5.4 Volume Forecast, 2025-2035
- 12.5.5 Base-Year Market Share, 2025
- 12.5.6 Segment CAGR and Growth Drivers
- 12.5.7 Subsegment Market Size and Forecast
- 12.5.7.1 Power Generators
- 12.5.7.2 Steel Producers
- 12.5.7.3 Trading Intermediaries
- 12.5.7.4 Process-heat Users
- 12.5.8 Subsegment Pricing and Adoption Trends
- 12.5.9 Leading Suppliers and Competition
- 12.5.10 Regional Demand and Opportunities
- 12.6 By Sales Channel - Market Size and Forecast, 2025-2035
- 12.6.1 Segment Definition and Scope
- 12.6.2 Historical Market Size, 2018-2025
- 12.6.3 Revenue Forecast, 2025-2035
- 12.6.4 Volume Forecast, 2025-2035
- 12.6.5 Base-Year Market Share, 2025
- 12.6.6 Segment CAGR and Growth Drivers
- 12.6.7 Subsegment Market Size and Forecast
- 12.6.7.1 Direct Export Contracts
- 12.6.7.2 Export Spot Sales
- 12.6.7.3 Domestic Supply Agreements
- 12.6.8 Subsegment Pricing and Adoption Trends
- 12.6.9 Leading Suppliers and Competition
- 12.6.10 Regional Demand and Opportunities
- 12.7 By State - Market Size and Forecast, 2025-2035
- 12.7.1 Segment Definition and Scope
- 12.7.2 Historical Market Size, 2018-2025
- 12.7.3 Revenue Forecast, 2025-2035
- 12.7.4 Volume Forecast, 2025-2035
- 12.7.5 Base-Year Market Share, 2025
- 12.7.6 Segment CAGR and Growth Drivers
- 12.7.7 Subsegment Market Size and Forecast
- 12.7.7.1 Queensland
- 12.7.7.2 New South Wales
- 12.7.7.3 Victoria
- 12.7.7.4 Western Australia and Remaining States
- 12.7.8 Subsegment Pricing and Adoption Trends
- 12.7.9 Leading Suppliers and Competition
- 12.7.10 Regional Demand and Opportunities
- 12.8 Segment Growth Comparison
- 12.9 Segment Attractiveness and Priority Matrix
Chapter 13 Australia Coal End-Use and Application Market Outlook
- 13.1 End-Use Industry and Customer Demand Structure
- 13.2 Leading Applications and Customer Groups
- 13.3 End-Use Market Size, Share and Forecast
- 13.4 Major End-Use Industry Deep Dives
- 13.4.1 Customer Requirements and Use Cases
- 13.4.2 Demand and Replacement Cycles
- 13.4.3 Technical and Regulatory Considerations
- 13.4.4 Purchasing and Procurement Models
- 13.4.5 Leading Vendors and Distribution Channels
- 13.4.6 Forecast and Commercial Opportunities
- 13.5 Emerging Applications and Cross-Segment Demand
- 13.6 End-Use Industry Investment Priorities
Chapter 14 Australia Coal Geographic Market Outlook, 2025-2035
- 14.1 Domestic Market Distribution and Demand Clusters
- 14.2 State- or Province-Wise Market Size and Forecast, 2025-2035
- 14.3 City and Metropolitan Market Outlook
- 14.4 Industrial, Manufacturing and Commercial Clusters
- 14.5 Geographic Concentration of Key End Users
- 14.6 Local Pricing and Purchasing Differences
- 14.7 Domestic Production Facilities and Capacity Map
- 14.8 Local Infrastructure and Project Pipeline
- 14.9 State-Level Policy and Incentive Differences
- 14.10 Subnational Investment Hotspots and Opportunities
- 14.11 Distribution and Logistics Networks
- 14.12 Domestic Competitive Footprint
Chapter 15 Australia Coal Technology, Innovation and Sustainability Outlook
- 15.1 Technology Landscape and Maturity
- 15.2 Product, Process and Service Innovation
- 15.3 AI, Automation and Digital Tools in the Industry
- 15.4 Technology Adoption and Performance Benchmarking
- 15.5 Innovation Pipeline and R&D Investment
- 15.6 Patent and Intellectual Property Trends
- 15.7 Energy Efficiency and Resource Management
- 15.8 Sustainability, Recycling and Circularity
- 15.9 Technology Roadmap, 2025-2035
- 15.10 Risks of Obsolescence and Technology Substitution
Chapter 16 Australia Coal Market Key Strategic Imperatives
- 16.1 Growth and Market Entry Priorities
- 16.2 High-Return Products and Segments
- 16.3 Pricing, Profitability and Cost Optimization
- 16.4 Technology Investment and Product Differentiation
- 16.5 Supply Chain Localization and Resilience
- 16.6 Distribution and Customer Acquisition
- 16.7 Partnership, Acquisition and Capacity Strategy
- 16.8 Regional Expansion Priorities
- 16.9 Short-, Medium- and Long-Term Actions
Chapter 17 Competition Outlook
- 17.1 Industry Competition Characteristics
- 17.2 Market Structure and Concentration
- 17.3 Market Share and Competitive Positioning, 2025
- 17.4 Company-Wise Revenue and Product Benchmarking
- 17.5 Production and Service Capacity Benchmarking
- 17.6 Technology, Pricing and Differentiation
- 17.7 Regional Footprint and Distribution Strength
- 17.8 Mergers, Acquisitions and Strategic Alliances
- 17.9 New Entrants and Competitive Threats
- 17.10 Porter's Five Forces and Industry Attractiveness
- 17.11 Competitive Outlook, 2025-2035
Chapter 18 Company Profiles
- 18.1 Company Coverage and Selection Criteria
- 18.2 BHP
- 18.2.1 Business Description
- 18.2.2 Company Ownership and Geographic Presence
- 18.2.3 Product and Service Portfolio
- 18.2.4 Manufacturing and Operating Footprint
- 18.2.5 Production Capacity and Expansion Plans
- 18.2.6 Financial Performance and Investment
- 18.2.7 Market Share and Competitive Position
- 18.2.8 Technology and Innovation Capabilities
- 18.2.9 Strategic Alliances or Partnerships
- 18.2.10 Recent Developments
- 18.2.11 Growth Strategy and Outlook
- 18.3 Glencore
- 18.4 Yancoal Australia
- 18.5 Whitehaven Coal
- 18.6 Stanmore Resources
- 18.7 Anglo American
- 18.8 Peabody Energy
- 18.9 Coronado Global Resources
- 18.10 New Hope Corporation
- 18.11 Centennial Coal
- 18.12 Other Relevant Market Participants
Note: Every listed company is profiled on the structure shown under the first company. The company list is preliminary and may change based on research findings, market developments, data availability and client requirements.
Chapter 19 Disclaimer
- 19.1 Research and Forecast Disclaimer
- 19.2 Data Source and Estimation Limitations
Note: The depth of individual sections depends on data availability for this market. Volume, capacity, trade and other unit-based metrics are included where applicable.

