
Routine aerial data becomes a scheduled mine service
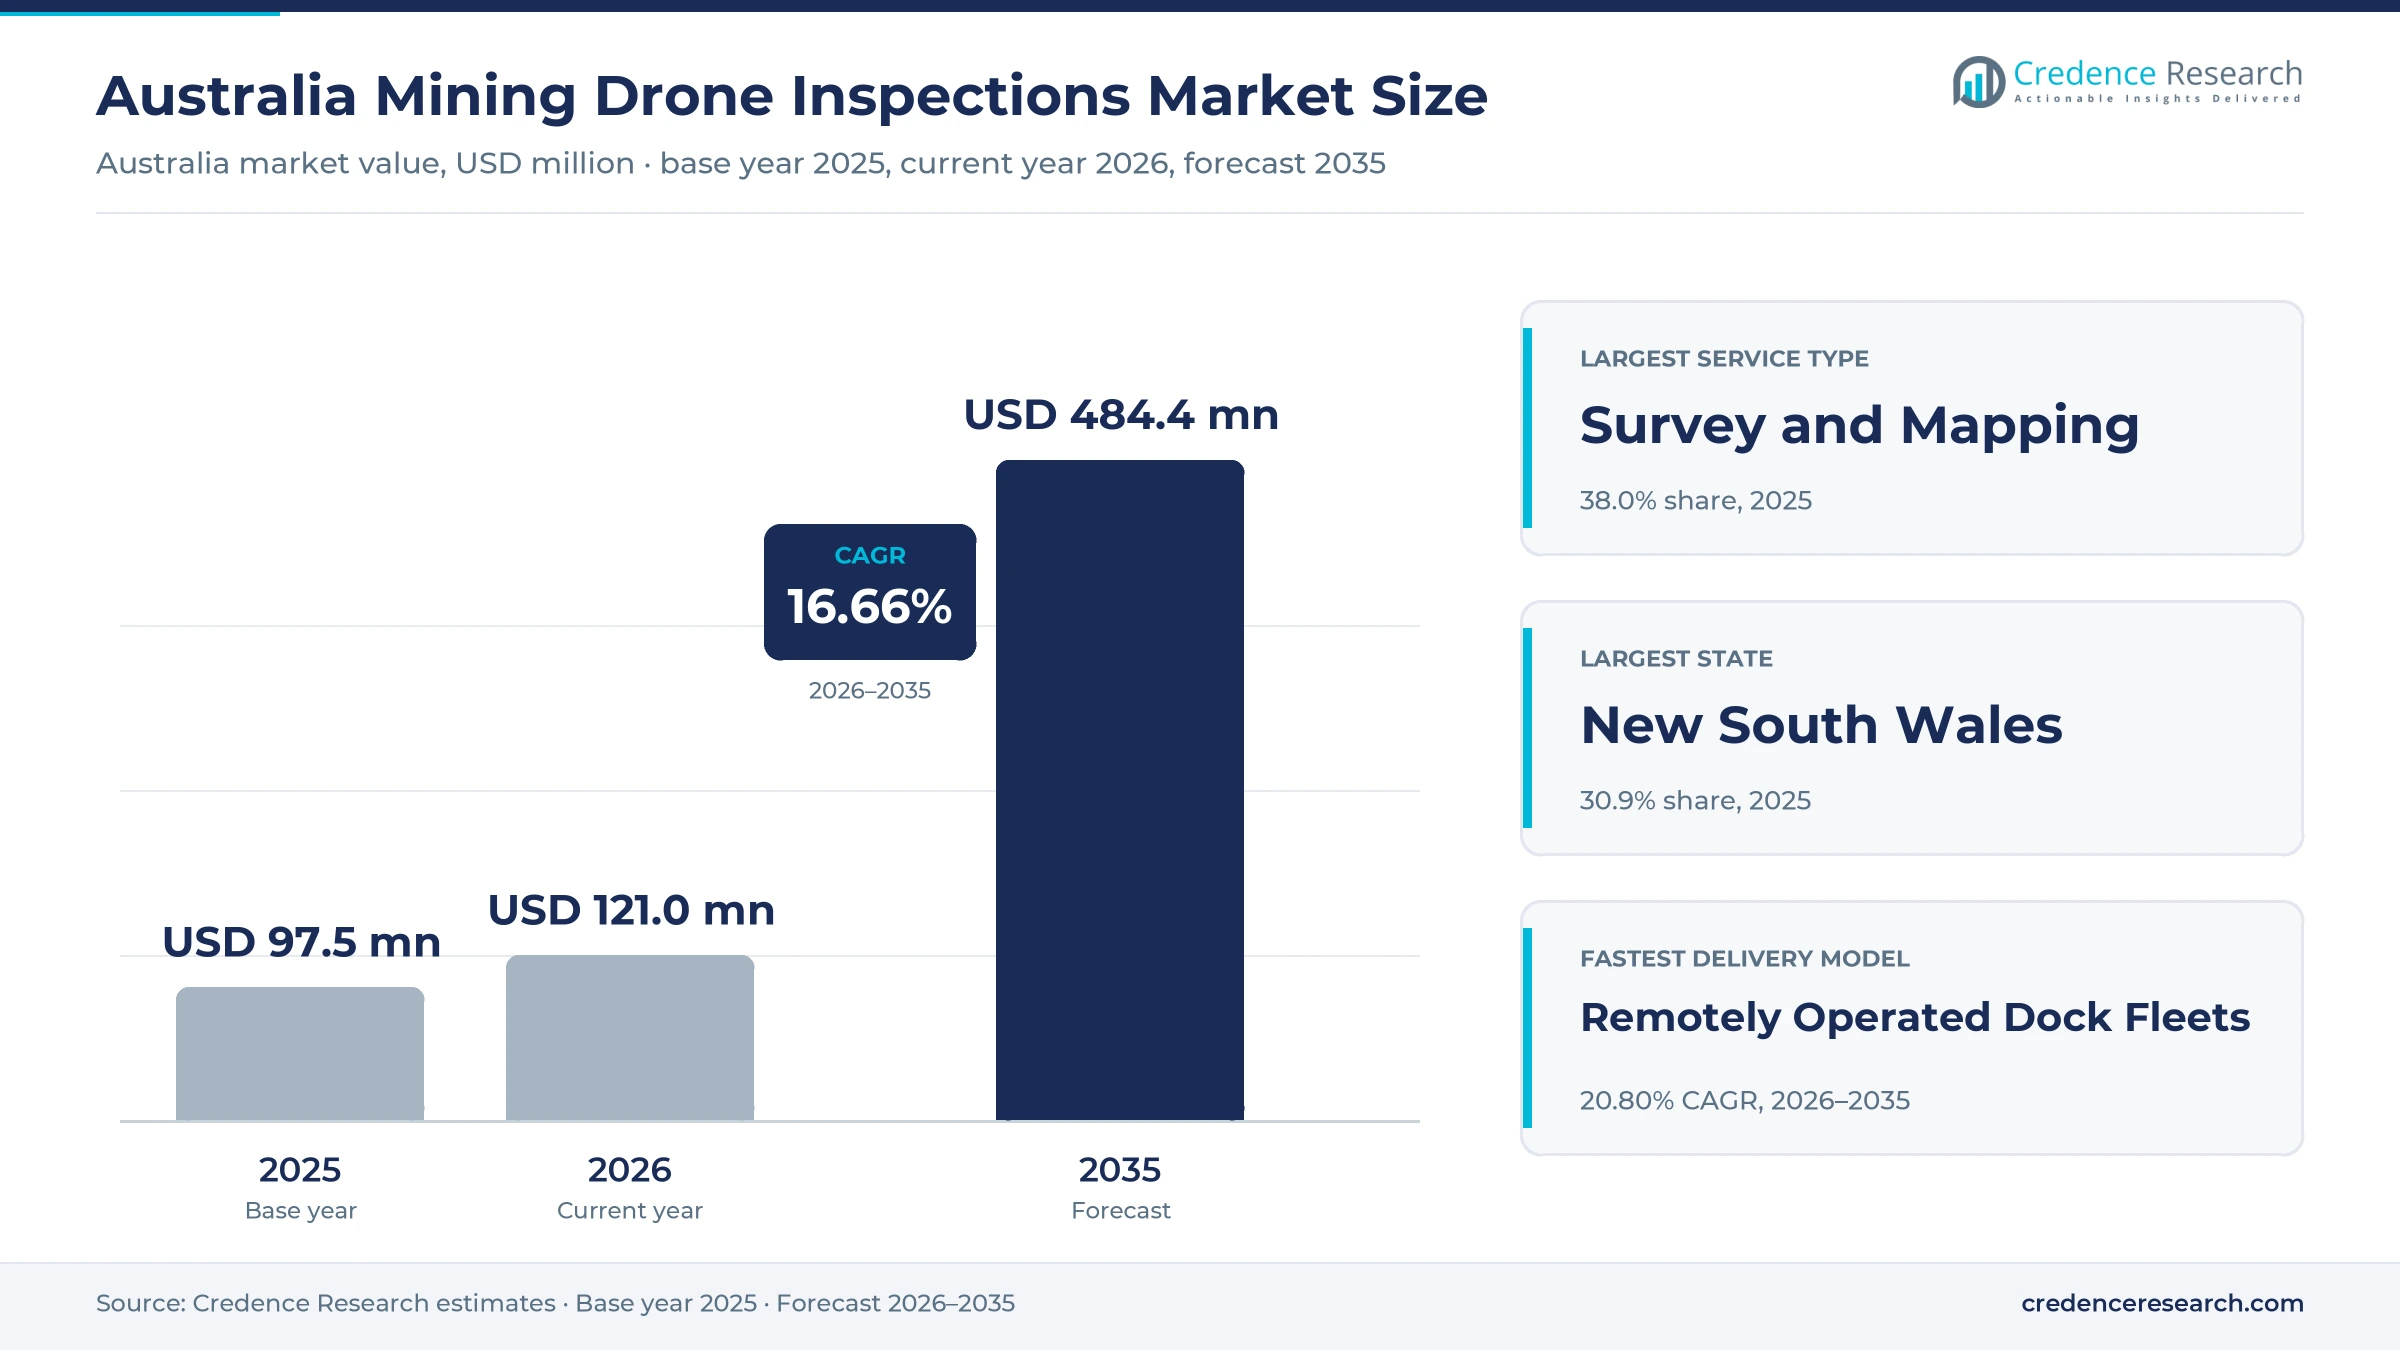
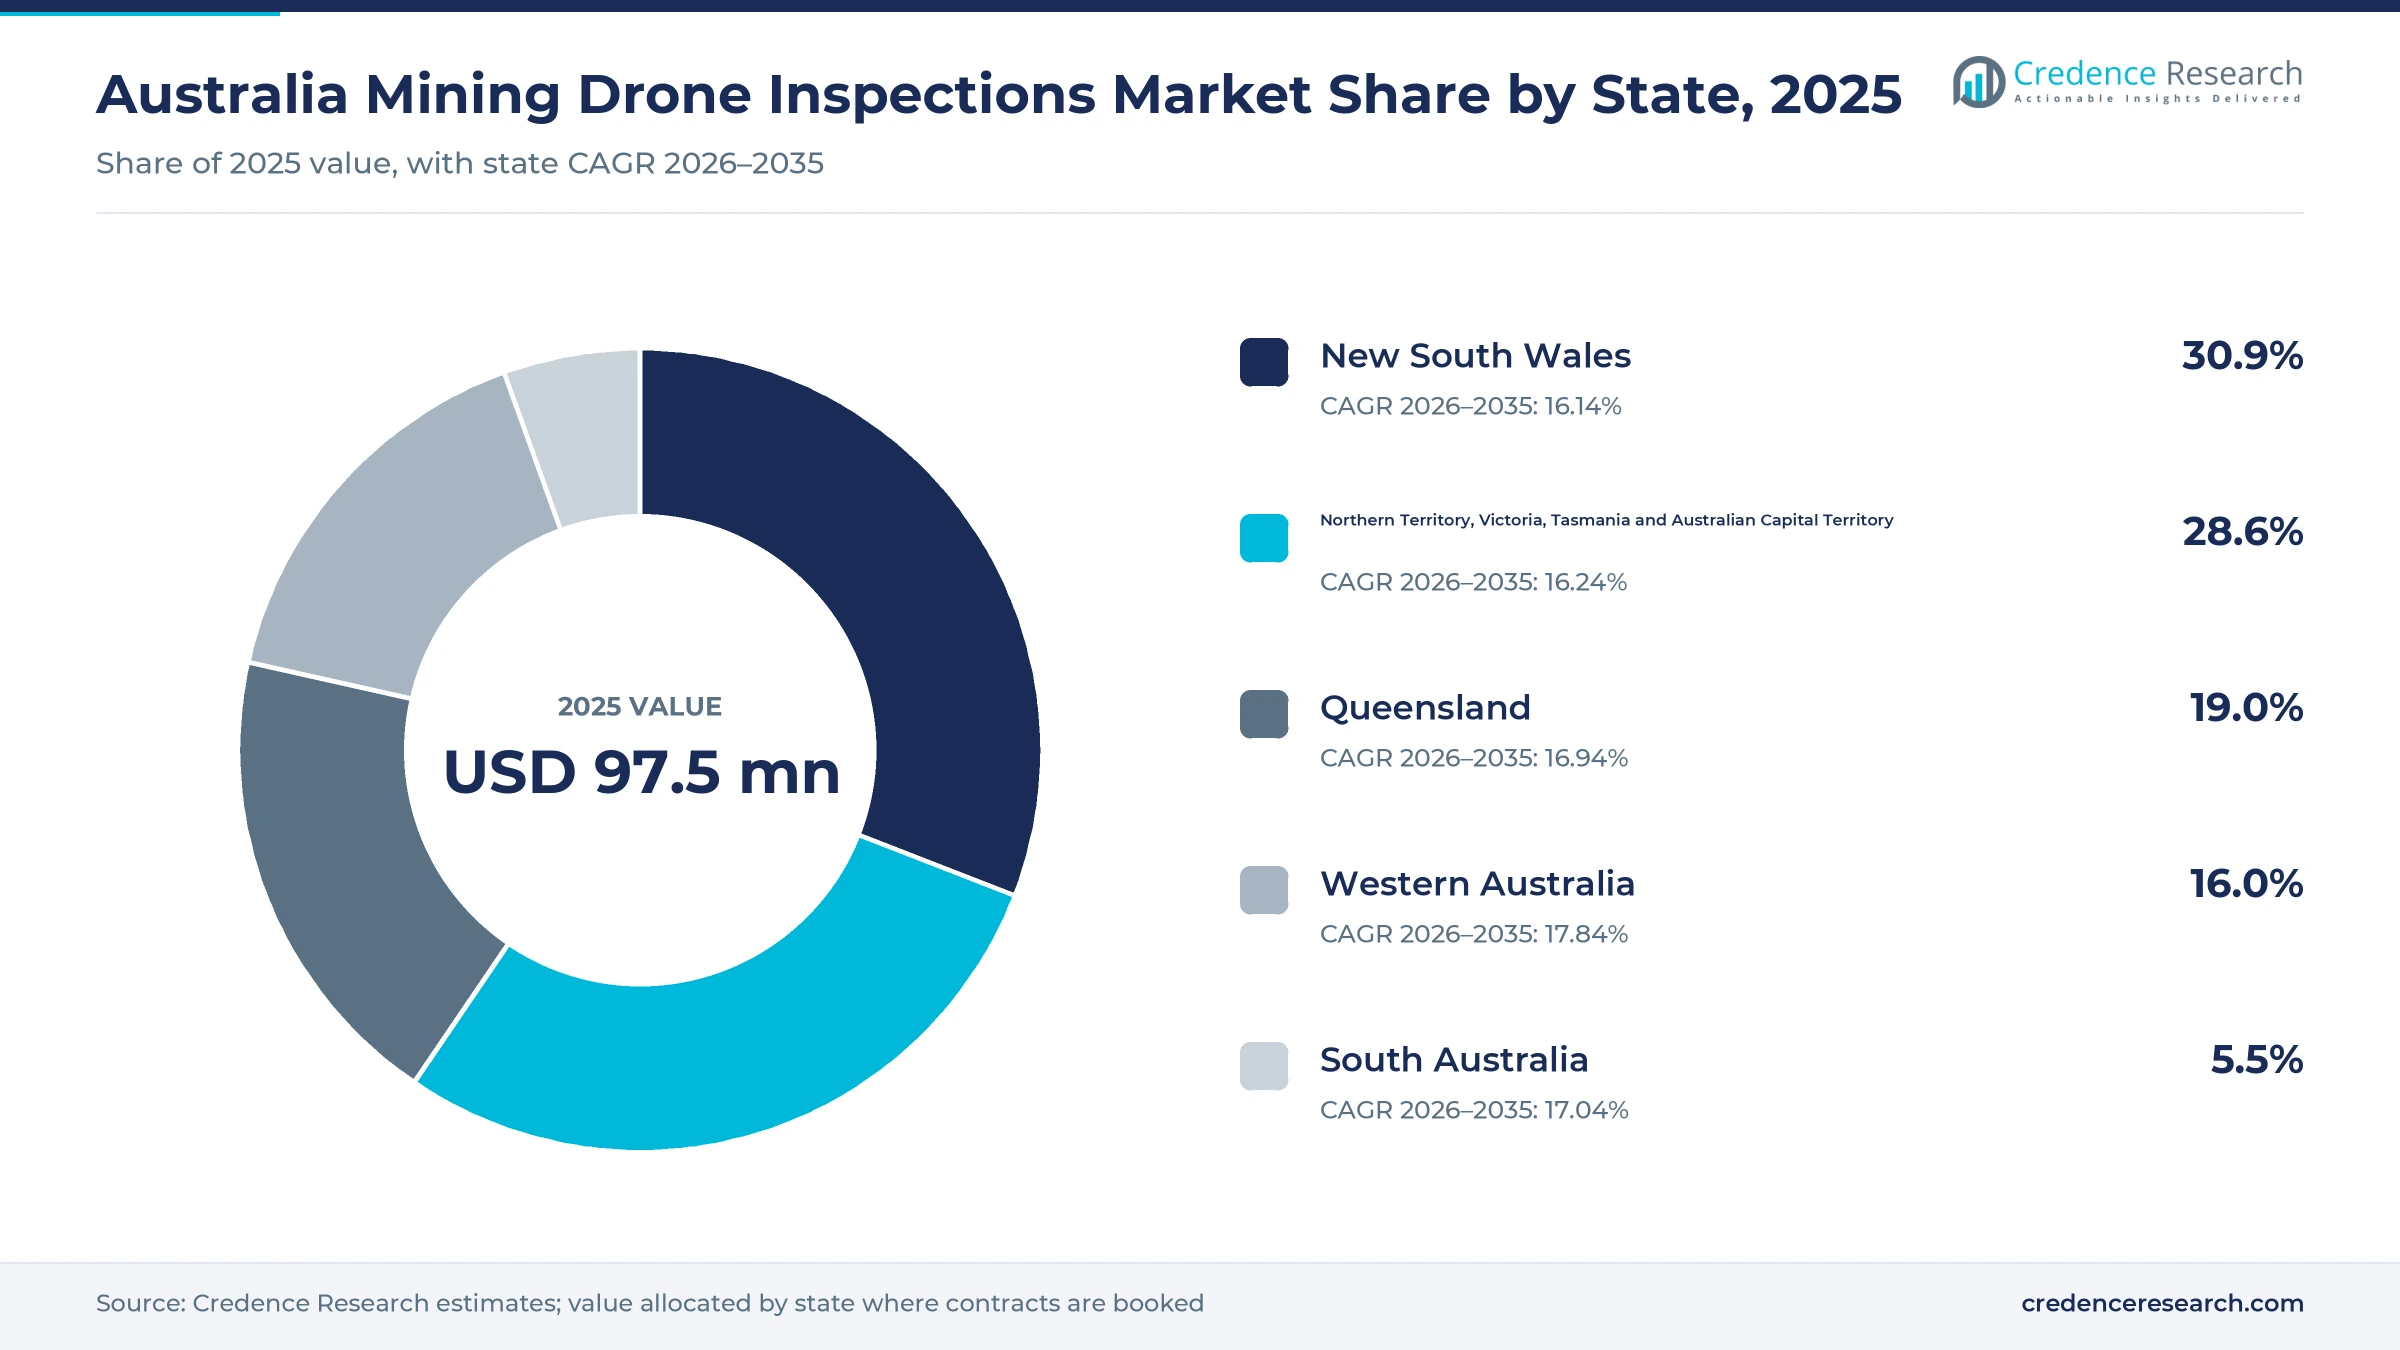
The Australia mining drone inspections market was valued at USD 97.5 million in 2025 and is projected to increase from USD 121.0 million in 2026 to USD 484.4 million by 2035, registering a CAGR of 16.66% during 2026–2035. Demand comes from repeat survey cycles at open pits, coal stockpiles and tailings facilities, where operators now buy aerial data as a scheduled service rather than as a one-off job. New South Wales held the largest state share, 30.9% in 2025, because value is allocated to the state where each contract is booked, which captures head contracts let from Sydney offices as well as Hunter Valley coal work. Western Australia is the fastest-growing state at 17.84% a year during 2026–2035, as remotely operated dock fleets spread across Goldfields and Pilbara sites. CASA opened a broad area trial for flights beyond visual line of sight in October 2025, and its AusSORA assessment method became mandatory for complex operations in May 2026, which shortens the path to automated flying.
Which paid aerial data services does this estimate include?
The estimate counts fees paid by mine owners, exploration companies and mining contractors in Australia for drone-based data capture, processing and reporting. This covers survey and mapping, inspection of plant and structures, underground lidar mapping, environmental monitoring and bundled analytics, whether the work is done by visiting crews, resident teams or docked aircraft flown from a remote center. State shares allocate value to the state where each contract is booked and invoiced, so they differ from where the flying happens, since Western Australia accounted for about 70% of national mineral exploration spending in 2025–26, according to the Australian Bureau of Statistics.
The estimate leaves out drones and sensors that mining companies buy outright for in-house survey teams, standalone software licenses, crewed aircraft surveys and satellite imagery. Hardware and software value is counted only when it is bundled inside a service contract, because that is how most buyers in the sector now purchase docked systems and processing platforms.
Australia Mining Drone Inspections Market Insights
- The Australia mining drone inspections market is projected to grow from USD 121.0 million in 2026 to USD 484.4 million by 2035, a CAGR of 16.66%, as automated dock fleets replace visiting crews.
- New South Wales held the largest state share at 30.9% in 2025, reflecting contracts booked through Sydney offices and Hunter Valley coal operations.
- Survey and mapping led service types with 38.0% of 2025 value, because stockpile, pit and haul road surveys repeat on fixed weekly or monthly cycles.
- CASA started a 12-month broad area trial for small drones flying beyond visual line of sight on Oct. 13, 2025, removing site-by-site approvals for qualifying operators.
- RocketDNA expanded docked systems to four BHP Mitsubishi Alliance sites in Queensland, showing how diversified groups are moving to fleet contracts.
Survey and mapping holds the largest share of spend
Why does survey and mapping lead service spending?
Based on service type, the market is categorized into survey and mapping, infrastructure inspection, underground mapping, environmental monitoring and bundled analytics. Survey and Mapping led with a 38.0% share of 2025 value across all five service types. This reflects how stockpile volumes, pit progress and haul road conditions must be measured on fixed reporting cycles. Bundled Analytics is the fastest-growing segment at 18.08% a year, as buyers pay for processed reports and dashboards rather than raw imagery.
Which mine activity uses aerial data most often?
Based on application, the market is categorized into resource development, production operations, asset integrity and closure compliance. Production Operations led with 46.0% of 2025 value, because operating pits and coal stockpiles need repeat surveys for reconciliation and planning. Closure Compliance grows fastest at 17.70% a year, as rehabilitation milestones in Queensland and closure plans elsewhere require repeated, auditable evidence of landform and vegetation change.
How do diversified groups and smaller operators buy?
Based on customer type, the market is categorized into diversified mining groups, single-commodity mine operators, exploration developers and mining contractors. Diversified Mining Groups led with 41.0% of 2025 value, because large groups run many sites and sign multi-site frame agreements. The same customer type also grows fastest, at 17.01% a year, as these groups convert trials into fleet-wide automated flying across coal, iron ore and gold operations.
Why are docked fleets the fastest-growing delivery model?
Based on delivery model, the market is categorized into mobilised field crews, resident outsourced teams and remotely operated dock fleets. Mobilised Field Crews led with 58.0% of 2025 value, because most surveys still need a pilot to travel to site. Remotely Operated Dock Fleets grow fastest at 20.80% a year, since a docked aircraft flown from a remote center can repeat missions daily without travel or camp costs.
| Segment Group | Leading Sub-segment | Share, 2025 | Fastest-growing Sub-segment | CAGR, 2026–2035 |
|---|---|---|---|---|
| By Service Type | Survey and Mapping | 38.0% | Bundled Analytics | 18.08% |
| By Application | Production Operations | 46.0% | Closure Compliance | 17.70% |
| By Customer Type | Diversified Mining Groups | 41.0% | Diversified Mining Groups | 17.01% |
| By Delivery Model | Mobilised Field Crews | 58.0% | Remotely Operated Dock Fleets | 20.80% |
Request a Free Sample
Fill in your details and we'll send you a free sample report.
- Sample data tables & charts
- Research methodology
Repeat surveys and risk budgets lift contract volumes
Repeat production surveys make flying a routine service
Production surveys are the steady base of demand, because every operating pit must measure stockpiles, excavation progress and haul roads on a fixed cycle. Australia produced an estimated 980 million tons of usable iron ore in 2025, out of a world total of about 2.6 billion tons, according to USGS mineral commodity data. Each of these tons passes through pits and stockpiles that need regular volume checks. In New South Wales, the Resources Regulator's mine survey policy of May 2026 requires survey plans certified by a registered mine surveyor on a gazetted schedule. As a result, production operations held 46.0% of 2025 value, and buyers increasingly ask providers to fly the same areas weekly so surveyors can certify volumes faster.
Risk-led inspection budgets move people out of hazard zones
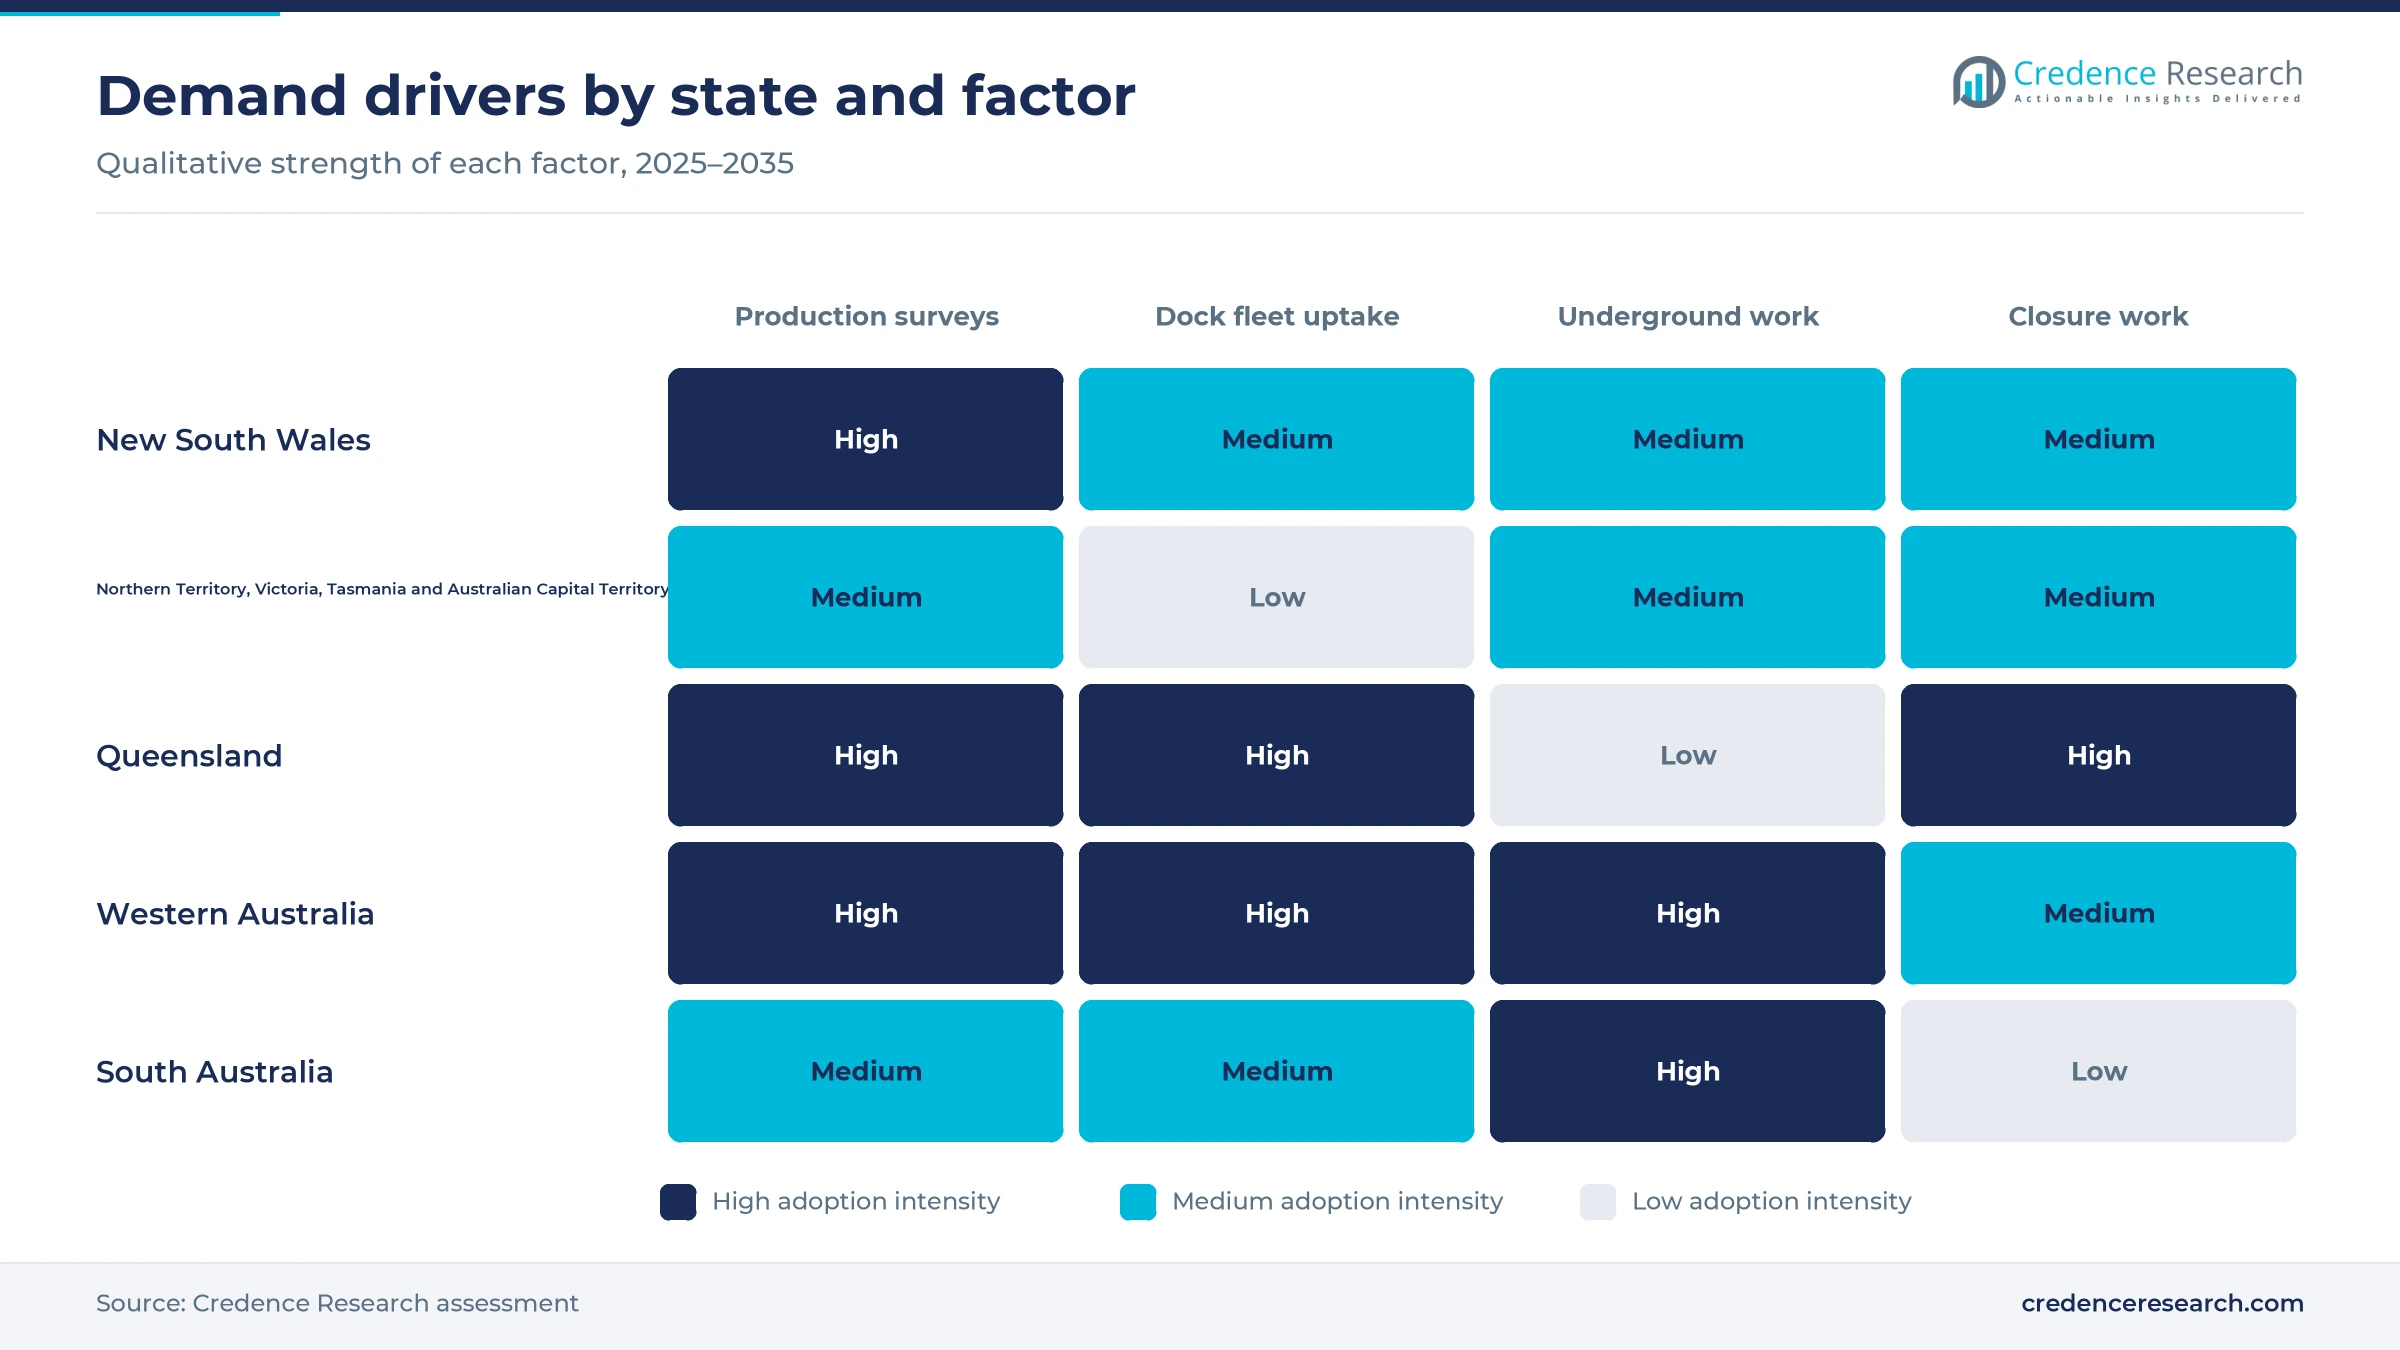
Mine operators are directing inspection budgets toward methods that keep people away from pit walls, tailings embankments and open stopes. The Work Health and Safety (Mines) Regulations 2022 took effect in Western Australia on March 31, 2022, placing the duty for a safe workplace on mine operators and site senior executives, according to WorkSafe WA. ICMM reported in November 2025 that only 67% of its members' 836 tailings facilities were in full conformance with the global tailings standard, according to its progress report. CSIRO says Hovermap can scan a stope in about 15 minutes, compared with up to three hours for a traditional cavity monitoring system. These pressures lift spending on infrastructure inspection and underground mapping across most states.
Autonomous dock fleets lower the cost of each flight
Regulatory changes now let docked drones fly beyond visual line of sight across wide areas, which cuts the cost of each mission. CASA began a 12-month trial of four broad area approval pathways for drones of 25 kg or less on Oct. 13, 2025, under its broad area BVLOS trial. RocketDNA said each BVLOS site previously needed an individual assessment of three to six months, while trial approval lets new deployments fly within days. From May 11, 2026, CASA also required all new complex operation applications to use the AusSORA method. Because of these changes, remotely operated dock fleets grow fastest among delivery models, at 20.80% a year during 2026–2035.
Record exploration spending lifts early-stage survey work
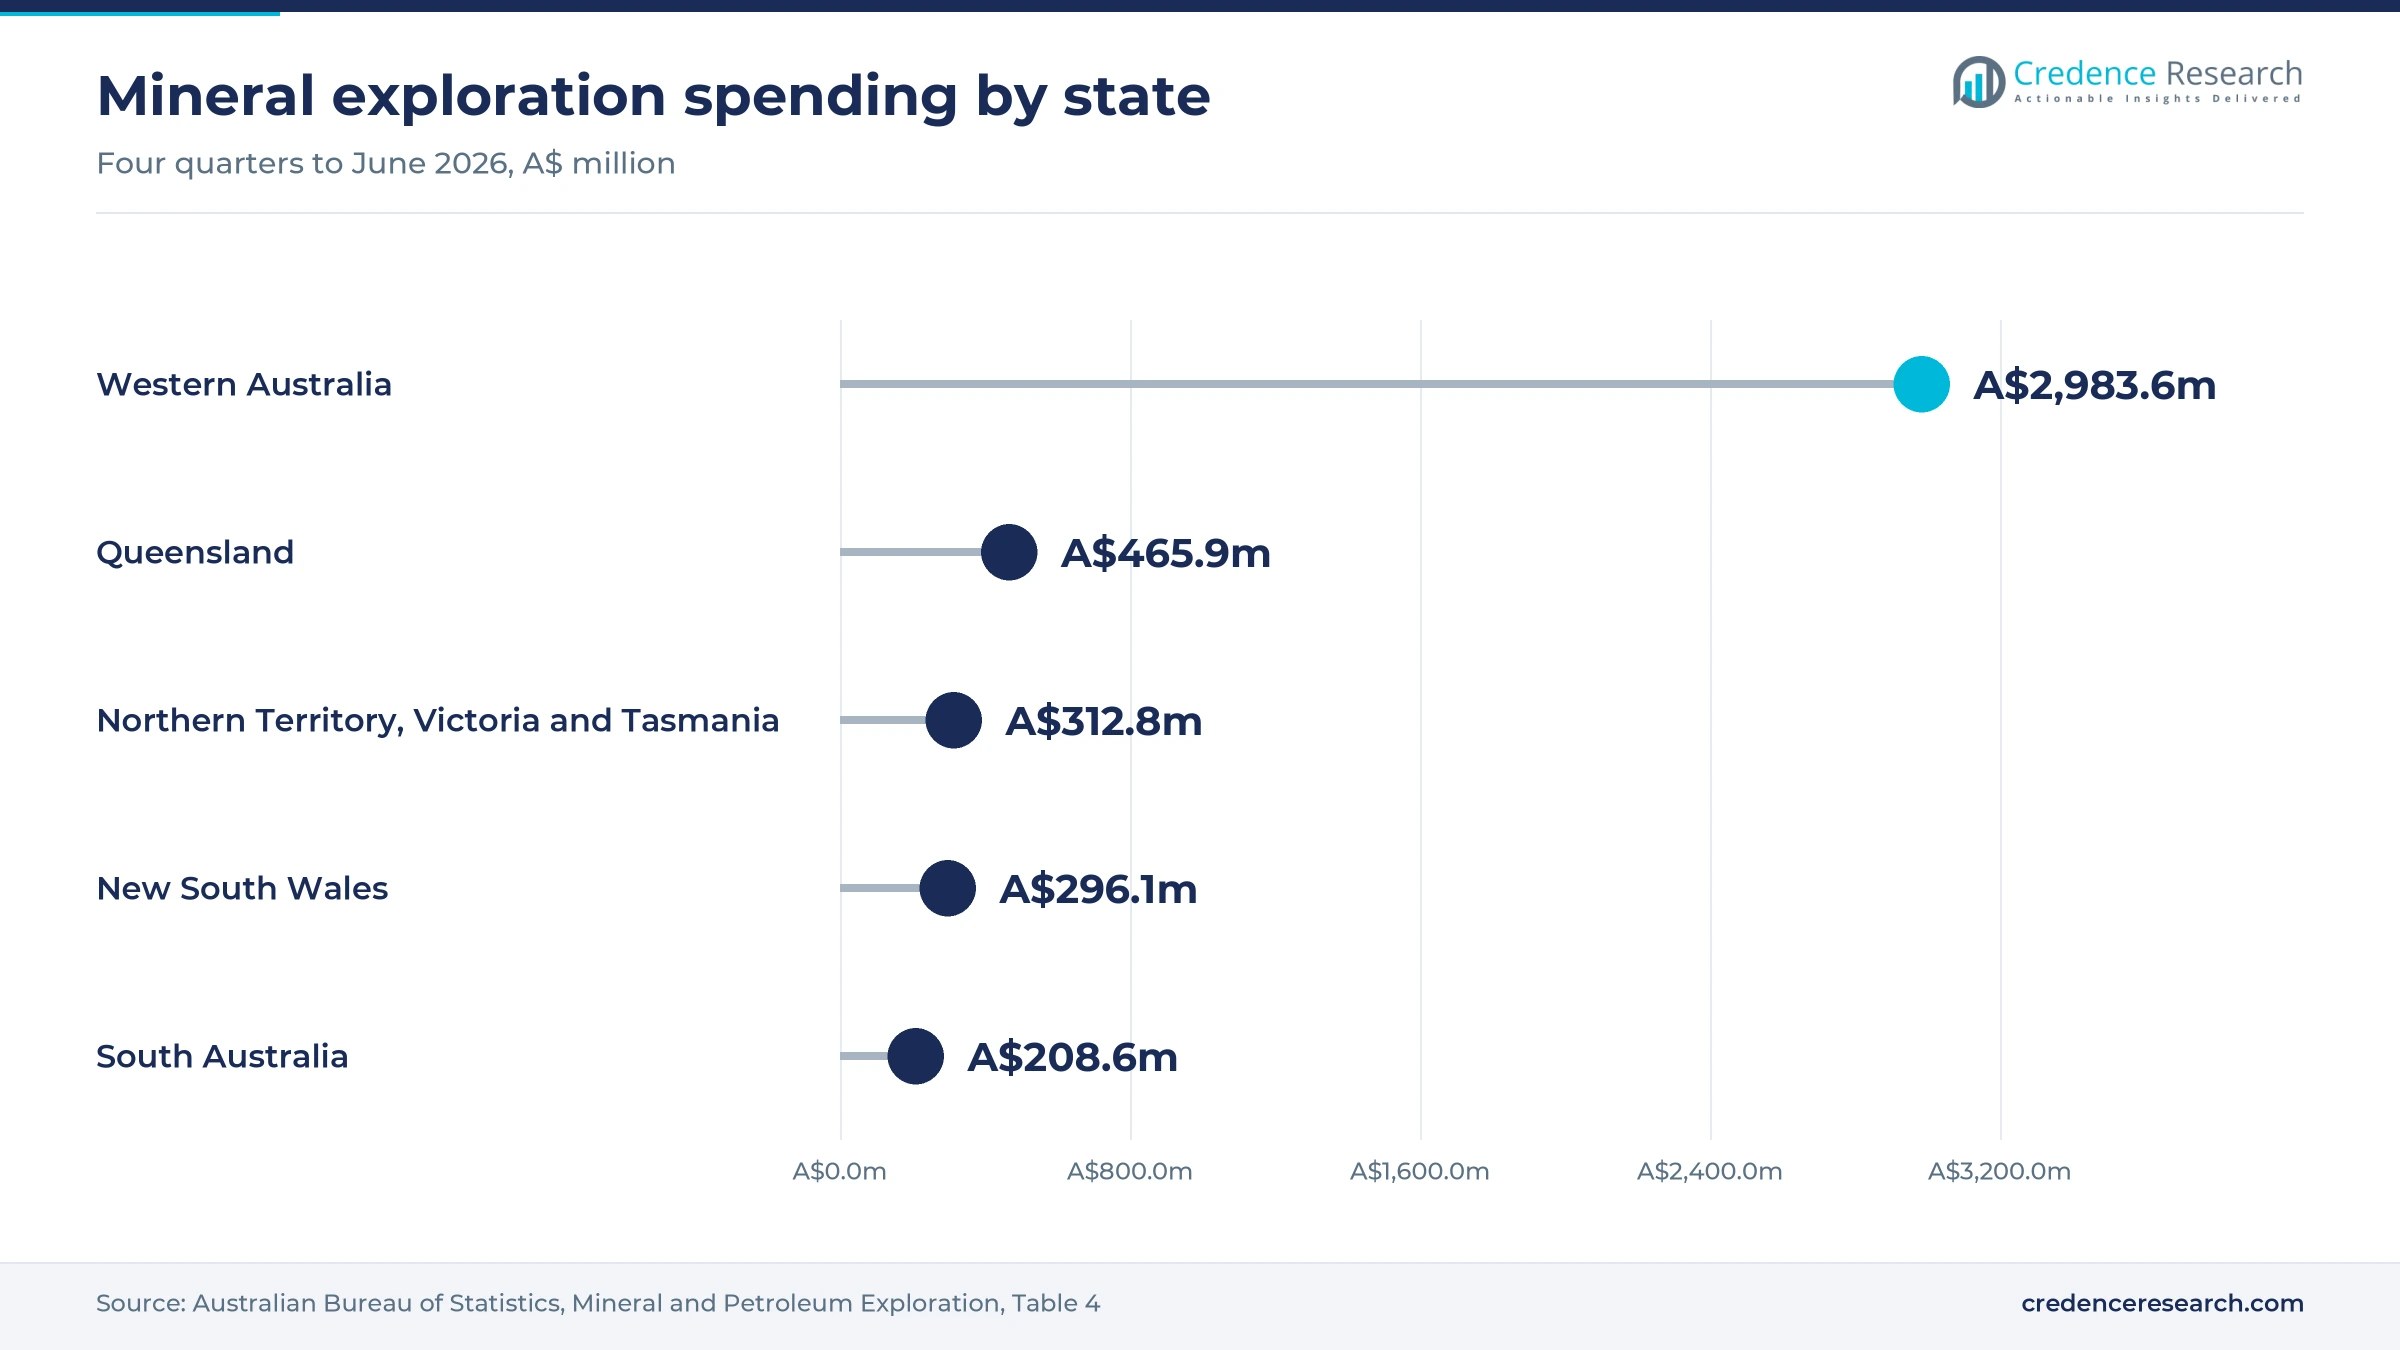
Higher exploration budgets add early-stage work, because explorers fly drones for terrain models, geophysics and access planning before drilling. Mineral exploration spending reached A$1,189.8 million in the June quarter of 2026, and gold rose 23.6% to A$565.6 million, according to the Australian Bureau of Statistics. Western Australia alone accounted for A$843.6 million of that quarter's spending, which signals strong survey demand in the state. BlueCap says a single helicopter drone system can fly about 10,500 line kilometers of magnetic survey a week, which brings airborne geophysics within reach of junior explorers. Resource development work therefore stays a steady source of contracts, even though its growth trails production and closure work.
Subscriptions and fleet software reshape buying
Shift from project fees to multi-year managed services
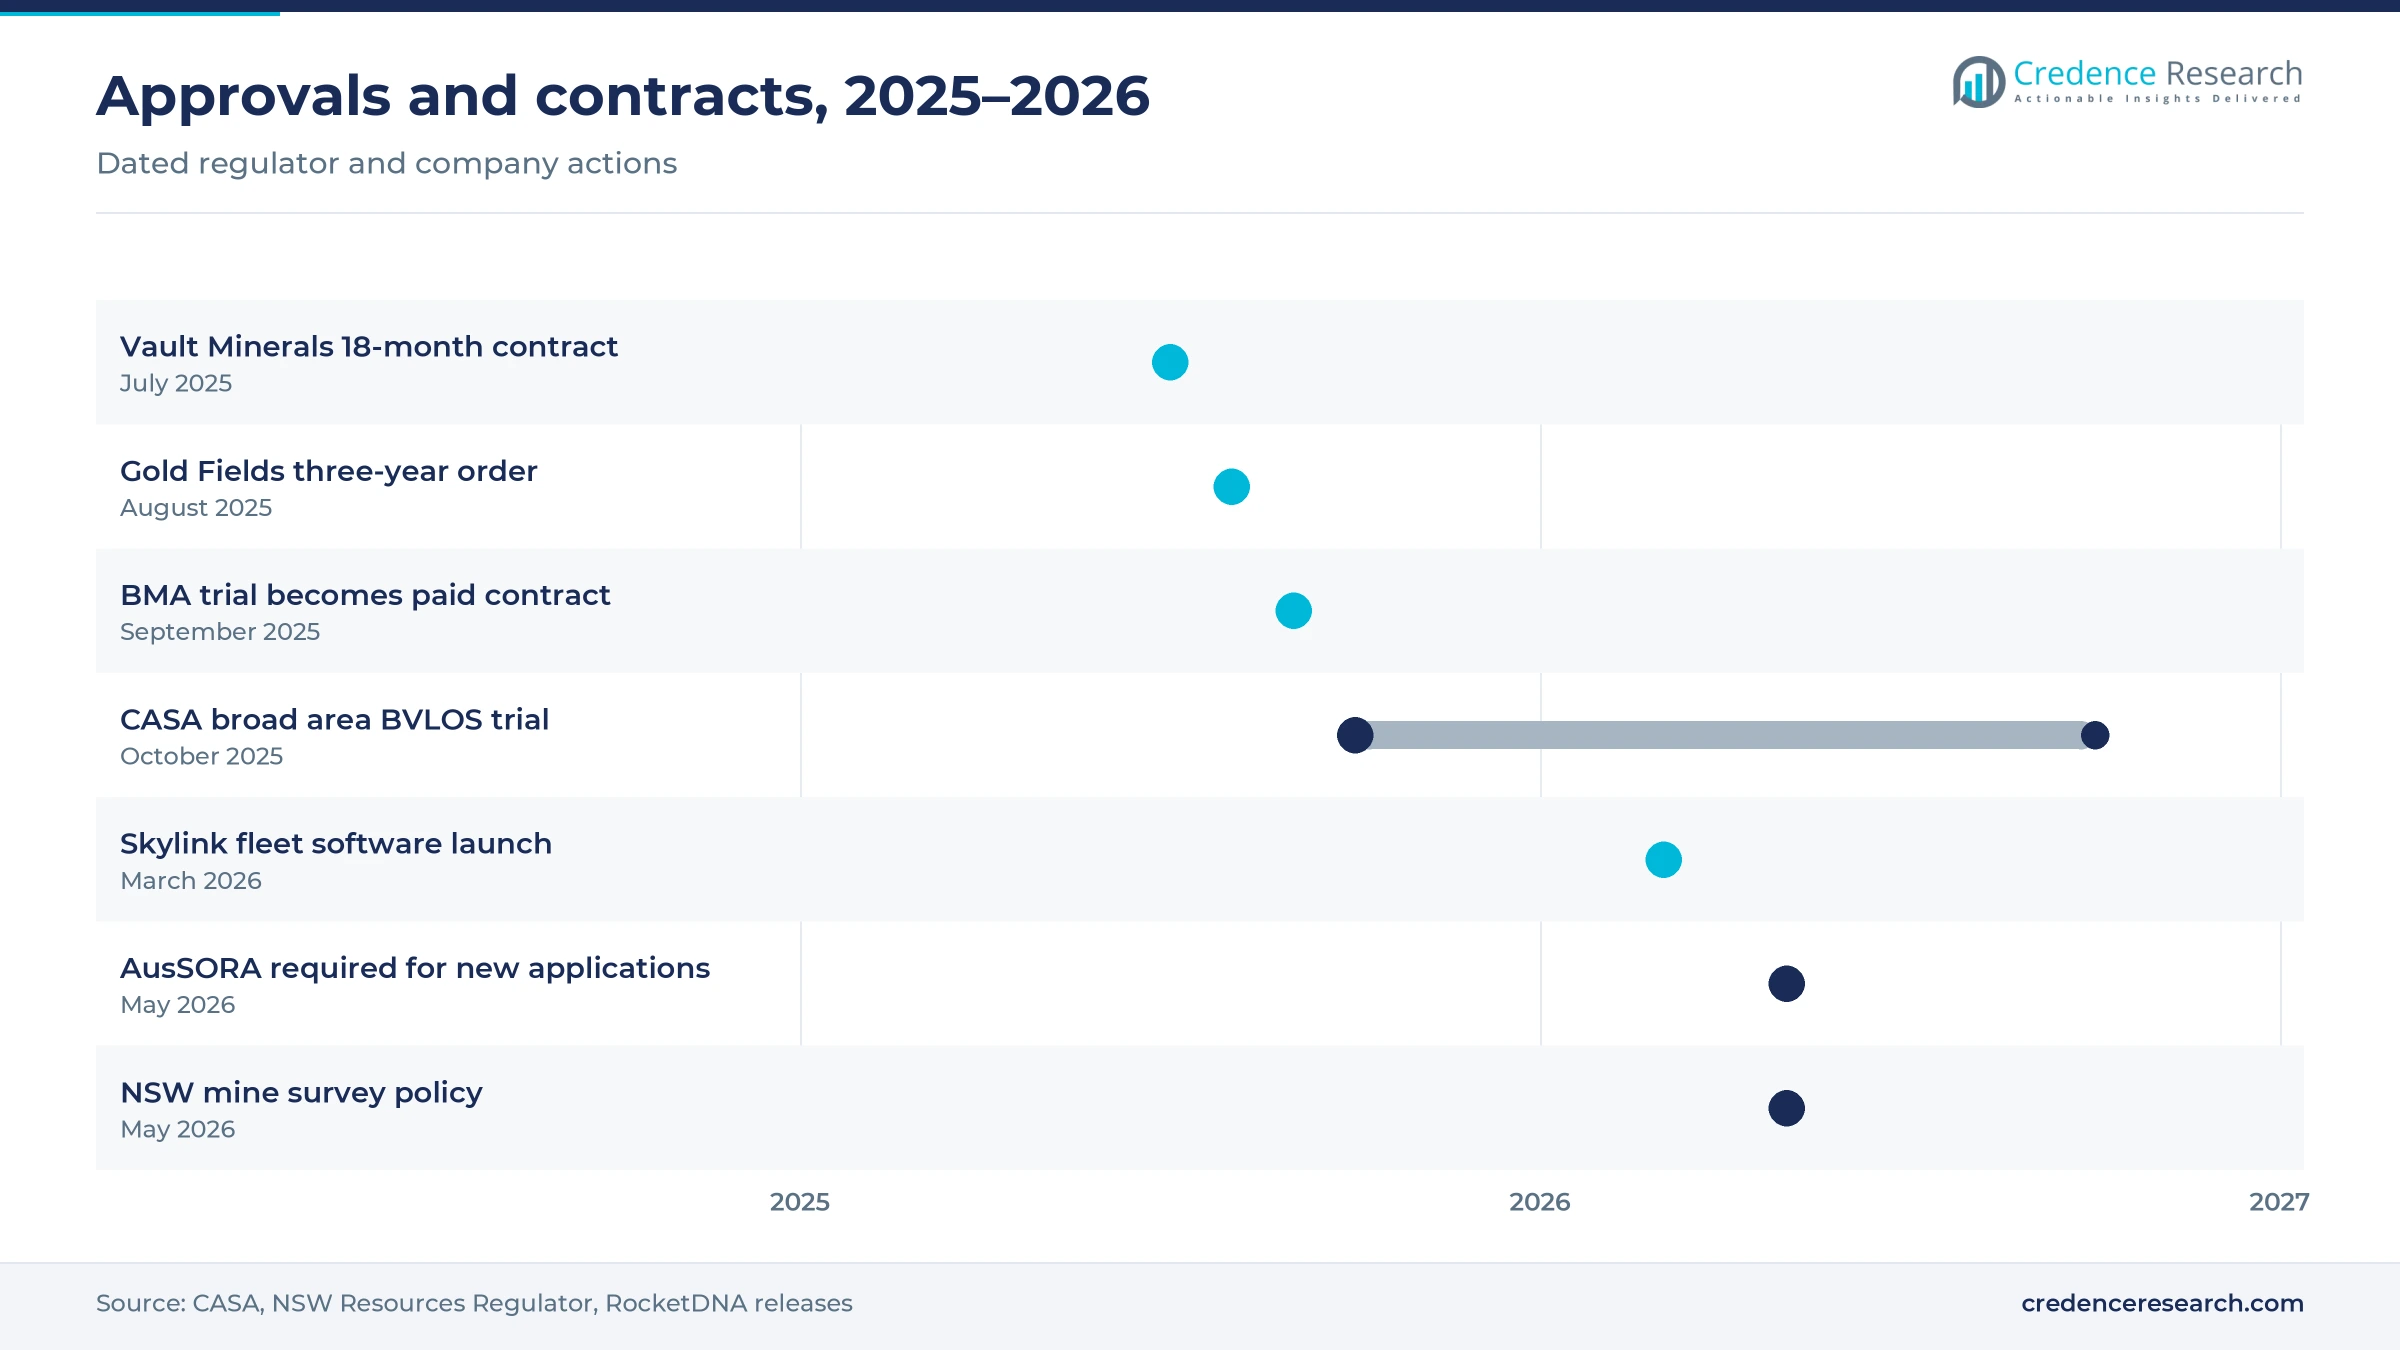
Buyers are shifting from one-off survey jobs toward multi-year managed services that bundle aircraft, pilots and processing. In July 2025, Vault Minerals extended its drone work at King of the Hills in Western Australia with an 18-month contract that adds RocketDNA's xBot remote operations and automated processing. In August 2025, Gold Fields issued RocketDNA a three-year purchase order for a drone-in-a-box system at the Gruyere gold mine. The BHP Mitsubishi Alliance converted its trial into a paid contract in September 2025 and expanded to six dual xBot units by October, according to RocketDNA's 2026 chairman's address. These moves favor annual managed-service subscriptions over fixed project fees.
Rise of fleet software and automated reporting
Value is moving from flight hours toward software that schedules missions and turns data into reports for site teams. RocketDNA launched Skylink, its own fleet management operating system, in March 2026, and it went live with a Tier 1 mining customer. The company also integrated its SiteTube platform across every xBot deployment for mapping and automated reporting. AUAV delivers inspection data through inSite, a 3D GIS cloud platform that keeps defect records and historical comparisons. Many buyers now link these outputs to AI-based safety monitoring systems. As a result, bundled analytics grows fastest among service types, at 18.08% a year.
Opportunity in closure and rehabilitation evidence
Closure and rehabilitation rules create an opening for providers that can document landform and vegetation change over many years. Queensland's progressive rehabilitation and closure plan framework took effect on Nov. 1, 2019, and every mine with a site-specific environmental authority must prepare a plan, according to the Queensland Government. Failing to meet a condition of the plan's milestone schedule is an offense, so operators need defensible evidence. MINELiDAR lists erosion mapping, rehabilitation monitoring and vegetation mapping among its above-ground services. Closure compliance therefore grows fastest among applications, at 17.70% a year. Queensland, which held a 19.0% share of 2025 value, is the main early buyer of this work.
Opportunity in lidar mapping of GPS-denied workings
Underground mines offer an opening for providers that can map stopes, shafts and ore passes without GPS signals. CSIRO reports that Hovermap enabled the first fully autonomous beyond-line-of-sight drone flight in an underground mine, 600 meters below the surface in Western Australia. The same CSIRO page says Hovermap has been used at more than 30 mine sites worldwide, including sites run by BHP, Newmont and Glencore. Emesent, the CSIRO spin-out that commercializes Hovermap, launched with A$4.5 million in funding at the end of 2018. MINELiDAR, based in Perth, describes itself as the first service provider in Australia to use the Hovermap platform. Underground gold and base metal mines in Western Australia and South Australia are the most likely early buyers.
Approvals, site conditions and data rules slow uptake
AusSORA raises the paperwork for complex operations
From May 11, 2026, new applications for BVLOS and other complex drone operations must follow CASA's AusSORA method, which formally scores ground risk, air risk and containment. Smaller providers with few safety staff find this documentation costly to prepare for each new type of operation. As a result, approvals may take longer for firms new to automated flying, while operators with established safety cases win more work. Some buyers now ask providers to show their approvals before tendering.
Heat, dust and weak links limit dock uptime
Docked aircraft at remote pits must cope with extreme heat, dust, wind and patchy communications that interrupt automated missions. Each failed or cancelled flight reduces the data that site surveyors expect on a fixed schedule, which weakens confidence in subscription contracts. Providers respond with redundant docks, local spare parts and on-site technicians. These measures raise the cost of each deployment, so smaller single-site operators often keep using visiting crews instead.
Survey certification rules shape how data is used
Drone outputs only replace ground surveys when they fit the legal process for certified mine plans. In New South Wales, survey plans must be certified by a registered mine surveyor and lodged with ESRI-compatible spatial files, according to the Resources Regulator. Providers therefore need accuracy checks, metadata and file formats that a surveyor can sign off. Where this integration is weak, buyers keep paying for parallel ground surveys, which limits the savings from flying.
A fragmented provider base keeps day rates under pressure
Many small operators hold remote operator certificates and bid for simple mapping jobs on price, especially for exploration and contractor work. This competition keeps day rates for mobilised field crews under pressure and squeezes margins for firms without proprietary software. Buyers also hesitate to commit to one provider for many years. Larger providers respond by bundling analytics and approvals, which raises switching costs but requires steady investment in staff.
Contract booking favors New South Wales over mine location
| State | Value, 2025 (USD million) | Share, 2025 | CAGR, 2026–2035 |
|---|---|---|---|
| New South Wales | 30.1 | 30.9% | 16.14% |
| Northern Territory, Victoria, Tasmania and Australian Capital Territory | 27.9 | 28.6% | 16.24% |
| Queensland | 18.5 | 19.0% | 16.94% |
| Western Australia | 15.6 | 16.0% | 17.84% |
| South Australia | 5.4 | 5.5% | 17.04% |
New South Wales leads on booked contracts and coal work
New South Wales held 30.9% of 2025 value, the largest state share, and grows at 16.14% a year. Its share reflects head contracts and survey consultancy subcontracts booked through Sydney offices, plus regular stockpile and pit surveys at coal mines across the Hunter Valley region. The Resources Regulator's May 2026 mine survey policy keeps certified survey plans on a gazetted schedule, which sustains demand. Growth trails the national rate because coal work matures while dock fleets spread faster elsewhere.
Remaining states and territories hold a large booked share
Northern Territory, Victoria, Tasmania and Australian Capital Territory together held a 28.6% share of 2025 value and grow at 16.24% a year. This large share reflects contracts booked through Melbourne corporate and engineering offices, together with work at Northern Territory and Tasmanian mines. RocketDNA said its xBot systems were operating in every Australian state except Tasmania by December 2025. Growth stays close to the national rate, because booked contracts move only gradually as procurement is centralized.
Queensland grows on fleet contracts in the Bowen Basin
Queensland held a 19.0% share of 2025 value and grows at 16.94% a year, slightly above the national rate. The BHP Mitsubishi Alliance runs docked xBot systems at Saraji, Peak Downs, Goonyella and Caval Ridge in the Bowen Basin, with more than 8,500 autonomous missions since June 2025. Coal stockpile and pit surveys provide most of the volume. Queensland's rehabilitation and closure plan rules add steady demand for repeat landform and vegetation surveys at older sites.
Western Australia grows fastest as dock fleets spread
Western Australia held a 16.0% share of 2025 value and grows fastest among states, at 17.84% a year. The share is smaller than the state's mining output suggests, because much of the flying at Pilbara and Goldfields sites is billed under frame agreements booked in other states. Locally booked work is rising quickly, with docked systems at Gruyere, King of the Hills and Gudai-Darri. Perth also hosts specialist providers such as Sensorem and MINELiDAR, which serve mine sites across the state.
South Australia builds on underground and copper work
South Australia held a 5.5% share of 2025 value and grows at 17.04% a year, above the national rate. Underground copper and gold mines in the state need lidar scans of stopes and shafts, which favors specialist mapping providers. RocketDNA has staff in Adelaide as well as Perth, according to its 2026 chairman's address. Exploration spending in the state reached A$208.6 million across the four quarters to June 2026, which supports early-stage survey contracts.
Dock contracts and BVLOS approvals since 2025
| Development | Status and market relevance |
|---|---|
| In July 2025, Vault Minerals awarded RocketDNA an 18-month aerial data contract at King of the Hills that adds remote xBot operations. | Active; extends earlier drone services at the Leonora hub |
| In August 2025, Gold Fields issued RocketDNA a three-year purchase order for a drone-in-a-box system at the Gruyere gold mine. | Active; daily autonomous flights with cloud data delivery |
| In October 2025, RocketDNA became the first operator approved under CASA's broad area BVLOS self-assessment trial. | Approved; new sites can start flying within days |
| In March 2026, RocketDNA launched Skylink, its fleet management operating system, with a Tier 1 mining customer. | Live; adds software value to dock contracts |
| In May 2026, the NSW Resources Regulator published its mine survey policy for certified survey plans and spatial files. | In force; sets data standards that drone surveys must meet |
Docks, SLAM lidar and cloud GIS change the work
- Docked multirotors charge and launch automatically, and automated docking stations now let a remote pilot repeat missions daily across a mine.
- SLAM lidar payloads map stopes and shafts without GPS, and laser scanning sensors also feed pit wall and stockpile models.
- Towed magnetometers hang below helicopter drones on long cables, giving explorers airborne geophysics at a lower cost per survey line.
- Cloud GIS platforms store imagery, defect records and change history, so engineers can compare surveys without handling raw files.
Need a Custom Version of This Report?
Tailor the scope, geography, or segments to your exact requirements.
- Custom geography or segment scope
- Direct access to our analyst team
Providers compete on approvals, uptime and data quality
Competition centers on regulatory approvals, aircraft uptime and the quality of processed data rather than on flight price alone. RocketDNA leads automated flying, with xBot dock fleets at BHP Mitsubishi Alliance sites in Queensland and at Gruyere and King of the Hills in Western Australia, supported by a Perth remote operating center. Sensorem, a Perth remote sensing firm backed by Aerodyne Group since December 2020, focuses on asset inspection and aerial survey for mining clients. AUAV, part of CWL Group, has offered inspection, mapping and lidar services from offices across Australia since 2013. MINELiDAR specializes in underground lidar scanning with Hovermap, while BlueCap builds its own helicopter drones for magnetic, radiometric and lidar surveys. Providers that combine approvals, software and certified outputs are best placed to win multi-year contracts.
Companies profiled and their roles in this market
| Company | Type | Role in the market |
|---|---|---|
| RocketDNA | Autonomous drone operator | Runs xBot dock fleets at BMA, Gruyere and King of the Hills |
| Sensorem | Inspection and survey provider | Perth remote sensing firm backed by Aerodyne Group since 2020 |
| AUAV | National drone services provider | CWL Group business offering inspection, mapping and lidar since 2013 |
| MINELiDAR | Underground lidar specialist | Perth firm using Hovermap for stope, shaft and pit wall scans |
| BlueCap | Airborne geophysics operator | Flies its own helicopter drones for magnetic and lidar surveys |
Credence Research view on autonomous mine flying
Credence Research's view is that the Australia mining drone inspections market is moving from visiting crews to automated fleets, which roughly quadruples value between 2026 and 2035. Survey and mapping remains the base of spending, yet docked aircraft and bundled analytics capture most new value as CASA approvals become faster to obtain. Diversified groups will keep setting the pace through multi-site contracts, while Western Australia grows fastest as local fleets expand. Providers that hold broad approvals, keep docks running in harsh conditions and deliver outputs that surveyors can certify should win the longest contracts.
How the state and segment estimates were built
The report uses 2025 as the base year on a calendar basis, and market values come from the Credence Research model. That model draws on CASA regulatory pages, Australian Bureau of Statistics exploration data, USGS production data, state regulator policies, ICMM reporting, company releases and stock exchange announcements. Segment splits and state growth rates are Credence Research estimates, while state shares follow an allocation of value by the state where each contract is booked rather than by mine location. Sources used are government pages, agency reports, company filings and trade media, and no interviews or surveys were used.
Dock fleets and analytics drive growth to 2035
The Australia mining drone inspections market is expected to reach USD 484.4 million by 2035, rising at a 16.66% CAGR during 2026–2035, as mines replace visiting crews with docked aircraft flown from remote centers. Survey and mapping keeps the largest share, while bundled analytics, closure compliance work and dock fleets grow fastest. Western Australia gains share from a small booked base as Goldfields and Pilbara sites add local fleets. AusSORA paperwork, harsh site conditions and survey certification rules will slow smaller buyers, yet steady production surveys keep demand resilient through the forecast period.
Frequently Asked Questions
How big is the Australia mining drone inspections market?
Which service type holds the largest share?
Which state holds the largest share of value?
Why is the Western Australia share lower than its mining output?
How are CASA rules changing automated flying?
Which delivery model grows fastest?
Why does closure compliance work grow quickly?
Which companies are active in the Australia mining drone inspections market?
Table of Content
Chapter 1 Market Segmentation
- 1.1 Segmentation Framework
- 1.1.1 Product and Service Classification
- 1.1.2 Application and End-Use Classification
- 1.1.3 Technology and Solution Classification
- 1.1.4 Customer and Distribution Channel Classification
- 1.1.5 Geographic Segmentation
- 1.1.6 Market Segment Definitions and Boundaries
- 1.2 By Service Type
- 1.2.1 Survey and Mapping
- 1.2.2 Infrastructure Inspection
- 1.2.3 Underground Mapping
- 1.2.4 Environmental Monitoring
- 1.2.5 Bundled Analytics
- 1.3 By Application
- 1.3.1 Production Operations
- 1.3.2 Asset Integrity
- 1.3.3 Resource Development
- 1.3.4 Closure Compliance
- 1.4 By Customer Type
- 1.4.1 Diversified Mining Groups
- 1.4.2 Single-Commodity Mine Operators
- 1.4.3 Mining Contractors
- 1.4.4 Exploration Developers
- 1.5 By Delivery Model
- 1.5.1 Mobilised Field Crews
- 1.5.2 Resident Outsourced Teams
- 1.5.3 Remotely Operated Dock Fleets
- 1.6 By State
- 1.6.1 Western Australia
- 1.6.2 Queensland
- 1.6.3 New South Wales
- 1.6.4 South Australia
- 1.6.5 Northern Territory, Victoria, Tasmania and Australian Capital Territory
Chapter 2 Introduction
- 2.1 Report Objectives and Scope
- 2.2 Product Definition and Industry Terminology
- 2.3 Market Inclusions and Exclusions
- 2.4 Research Process
- 2.4.1 Primary Research and Expert Interviews
- 2.4.2 Secondary Research and Source Review
- 2.4.3 Top-Down and Bottom-Up Estimation
- 2.4.4 Data Triangulation and Verification
- 2.5 Market Size Measurement Basis
- 2.5.1 2025: USD 97.5 million → 2035: USD 484.4 million
- 2.6 Historical and Forecast Reference Periods
- 2.6.1 Historical Period: 2018-2025
- 2.6.2 Base Year: 2025
- 2.6.3 Forecast Period: 2025-2035
- 2.7 Research Assumptions and Limitations
Chapter 3 Executive Summary
- 3.1 Market Snapshot and Key Findings
- 3.2 Base-Year Market Size, 2025
- 3.3 Forecast Market Size, 2035
- 3.4 Revenue and Volume Growth Outlook
- 3.5 Key Demand and Supply Indicators
- 3.6 Leading Market Segments
- 3.7 Fastest-Growing Market Opportunities
- 3.8 Regional Performance Highlights
- 3.9 Technology and Industry Transformation
- 3.10 Competitive Landscape Summary
- 3.11 Analyst View and Strategic Implications
Chapter 4 Australia Mining Drone Inspections Market Trends and Developments
- 4.1 Historical Industry Development, 2018-2025
- 4.2 Recent Market Trends and Developments
- 4.3 Demand and Customer Behavior Trends
- 4.4 Technology and Product Innovation
- 4.5 Artificial Intelligence, Automation and Digitalization
- 4.6 Local Manufacturing and Supply Chain Realignment
- 4.7 Industry Partnerships, Mergers and Acquisitions
- 4.8 Sustainability and Circular Economy Developments
- 4.9 Government and Private Sector Investment Trends
- 4.10 Emerging Business Models and Commercialization
- 4.11 Industry Developments and Announcements
Chapter 5 Australia Mining Drone Inspections Market Production, Supply and Demand Analysis
- 5.1 Demand Trend and Consumption Analysis, 2018-2025
- 5.2 Demand Forecast, 2025-2035
- 5.3 Production and Output Trend, 2018-2025
- 5.4 Production and Output Forecast, 2025-2035
- 5.5 Installed Capacity and Capacity Utilization
- 5.6 Company-Wise Production Plants and Statistics
- 5.6.1 Installed Production Capacity
- 5.6.2 Actual Production
- 5.6.3 Planned Capacity and Expansion Targets
- 5.7 Supply Chain Structure and Procurement Trends
- 5.8 Supply-Demand Gap and Bottlenecks
- 5.9 Import Dependence and Sourcing Structure
- 5.10 Contract Manufacturing and Outsourcing
- 5.11 Regional Supply and Demand Concentration
Chapter 6 Australia Mining Drone Inspections Market Pricing Analysis
- 6.1 Pricing Structure and Measurement
- 6.2 Historical Pricing Trends, 2018-2025
- 6.3 Pricing Outlook, 2025-2035
- 6.4 Average Selling Price and Unit Economics
- 6.5 Pricing by Product and Market Segment
- 6.6 Geographic Pricing Differences
- 6.7 Key Input, Energy, Labor and Logistics Costs
- 6.8 Contract Pricing and Purchasing Models
- 6.9 Pricing Sensitivity and Competitive Positioning
- 6.10 Price, Margin and Profitability Implications
Chapter 7 Australia Mining Drone Inspections Market Dynamics
- 7.1 Market Growth Drivers
- 7.1.1 Demand-Side Drivers
- 7.1.2 Technology and Innovation Drivers
- 7.1.3 Infrastructure and Investment Drivers
- 7.1.4 Regulatory and Policy Drivers
- 7.2 Market Restraints
- 7.2.1 Cost and Affordability Constraints
- 7.2.2 Technology and Adoption Barriers
- 7.2.3 Supply Chain and Operational Constraints
- 7.3 Market Challenges
- 7.3.1 Competitive Pressure and Margin Erosion
- 7.3.2 Skills, Infrastructure and Implementation Gaps
- 7.4 Emerging Market Opportunities
- 7.5 Market Dynamics Impact and Time-Horizon Assessment
Chapter 8 Australia Mining Drone Inspections Value Chain Analysis
- 8.1 Industry Value Chain Overview
- 8.2 Upstream Suppliers and Critical Inputs
- 8.3 Technology and Component Providers
- 8.4 Manufacturing or Service Delivery
- 8.5 Distribution, Channel Partners and Integrators
- 8.6 Downstream Applications and End Users
- 8.7 Value Addition and Profit Pools
- 8.8 Vertical Integration and Outsourcing
- 8.9 Supplier Concentration and Risk
- 8.10 Supply Chain Localization and Resilience
Chapter 9 Australia Mining Drone Inspections Market Regulations and Policies
- 9.1 Relevant Laws, Standards and Compliance Frameworks
- 9.2 Product, Service, Safety and Quality Requirements
- 9.3 Government Policies, Incentives and Subsidies
- 9.4 Imports, Exports and Trade Barriers
- 9.5 Public Procurement and Local Content Requirements
- 9.6 Environmental and Sustainability Compliance
- 9.7 Upcoming Policy Changes and Market Implications
Chapter 10 Australia Mining Drone Inspections Market Hotspots and Opportunities
- 10.1 Market Opportunity Mapping and Growth Hotspots
- 10.2 High-Growth Applications and Customer Groups
- 10.3 Underserved Markets and White-Space Opportunities
- 10.4 Emerging Technology and Product Opportunities
- 10.5 New Capacity and Investment Hotspots
- 10.6 Market Entry and Expansion Opportunities
- 10.7 Distribution and Partnership Opportunities
- 10.8 Near-Term and Long-Term Commercial Potential
- 10.9 Opportunity Attractiveness and Execution Risks
Chapter 11 Australia Mining Drone Inspections Market Outlook, 2025-2035
- 11.1 Market Size and Analysis
- 11.1.1 Revenue (Market Measurement: 2025: USD 97.5 million → 2035: USD 484.4 million)
- 11.1.2 Market Volume and Quantity Sold
- 11.1.3 Historical Market Size, 2018-2025
- 11.1.4 Base-Year Market Size, 2025
- 11.2 Market Forecast, 2025-2035
- 11.2.1 Revenue Forecast to 2035
- 11.2.2 Volume Forecast to 2035
- 11.2.3 CAGR and Year-on-Year Growth
- 11.2.4 Incremental Revenue Opportunity
- 11.3 Forecast Assumptions and Scenario Analysis
- 11.3.1 Base-Case Forecast
- 11.3.2 Optimistic and Conservative Scenarios
- 11.3.3 Technology, Pricing and Policy Sensitivities
- 11.4 Market Attractiveness and Growth Outlook
Chapter 12 Australia Mining Drone Inspections Market Segmentation and Outlook
- 12.1 Segmentation Summary and Market Shares, 2025
- 12.2 Largest and Fastest-Growing Segments
- 12.3 By Service Type - Market Size and Forecast, 2025-2035
- 12.3.1 Segment Definition and Scope
- 12.3.2 Historical Market Size, 2018-2025
- 12.3.3 Revenue Forecast, 2025-2035
- 12.3.4 Volume Forecast, 2025-2035
- 12.3.5 Base-Year Market Share, 2025
- 12.3.6 Segment CAGR and Growth Drivers
- 12.3.7 Subsegment Market Size and Forecast
- 12.3.7.1 Survey and Mapping
- 12.3.7.2 Infrastructure Inspection
- 12.3.7.3 Underground Mapping
- 12.3.7.4 Environmental Monitoring
- 12.3.7.5 Bundled Analytics
- 12.3.8 Subsegment Pricing and Adoption Trends
- 12.3.9 Leading Suppliers and Competition
- 12.3.10 Regional Demand and Opportunities
- 12.4 By Application - Market Size and Forecast, 2025-2035
- 12.4.1 Segment Definition and Scope
- 12.4.2 Historical Market Size, 2018-2025
- 12.4.3 Revenue Forecast, 2025-2035
- 12.4.4 Volume Forecast, 2025-2035
- 12.4.5 Base-Year Market Share, 2025
- 12.4.6 Segment CAGR and Growth Drivers
- 12.4.7 Subsegment Market Size and Forecast
- 12.4.7.1 Production Operations
- 12.4.7.2 Asset Integrity
- 12.4.7.3 Resource Development
- 12.4.7.4 Closure Compliance
- 12.4.8 Subsegment Pricing and Adoption Trends
- 12.4.9 Leading Suppliers and Competition
- 12.4.10 Regional Demand and Opportunities
- 12.5 By Customer Type - Market Size and Forecast, 2025-2035
- 12.5.1 Segment Definition and Scope
- 12.5.2 Historical Market Size, 2018-2025
- 12.5.3 Revenue Forecast, 2025-2035
- 12.5.4 Volume Forecast, 2025-2035
- 12.5.5 Base-Year Market Share, 2025
- 12.5.6 Segment CAGR and Growth Drivers
- 12.5.7 Subsegment Market Size and Forecast
- 12.5.7.1 Diversified Mining Groups
- 12.5.7.2 Single-Commodity Mine Operators
- 12.5.7.3 Mining Contractors
- 12.5.7.4 Exploration Developers
- 12.5.8 Subsegment Pricing and Adoption Trends
- 12.5.9 Leading Suppliers and Competition
- 12.5.10 Regional Demand and Opportunities
- 12.6 By Delivery Model - Market Size and Forecast, 2025-2035
- 12.6.1 Segment Definition and Scope
- 12.6.2 Historical Market Size, 2018-2025
- 12.6.3 Revenue Forecast, 2025-2035
- 12.6.4 Volume Forecast, 2025-2035
- 12.6.5 Base-Year Market Share, 2025
- 12.6.6 Segment CAGR and Growth Drivers
- 12.6.7 Subsegment Market Size and Forecast
- 12.6.7.1 Mobilised Field Crews
- 12.6.7.2 Resident Outsourced Teams
- 12.6.7.3 Remotely Operated Dock Fleets
- 12.6.8 Subsegment Pricing and Adoption Trends
- 12.6.9 Leading Suppliers and Competition
- 12.6.10 Regional Demand and Opportunities
- 12.7 By State - Market Size and Forecast, 2025-2035
- 12.7.1 Segment Definition and Scope
- 12.7.2 Historical Market Size, 2018-2025
- 12.7.3 Revenue Forecast, 2025-2035
- 12.7.4 Volume Forecast, 2025-2035
- 12.7.5 Base-Year Market Share, 2025
- 12.7.6 Segment CAGR and Growth Drivers
- 12.7.7 Subsegment Market Size and Forecast
- 12.7.7.1 Western Australia
- 12.7.7.2 Queensland
- 12.7.7.3 New South Wales
- 12.7.7.4 South Australia
- 12.7.7.5 Northern Territory, Victoria, Tasmania and Australian Capital Territory
- 12.7.8 Subsegment Pricing and Adoption Trends
- 12.7.9 Leading Suppliers and Competition
- 12.7.10 Regional Demand and Opportunities
- 12.8 Segment Growth Comparison
- 12.9 Segment Attractiveness and Priority Matrix
Chapter 13 Australia Mining Drone Inspections End-Use and Application Market Outlook
- 13.1 End-Use Industry and Customer Demand Structure
- 13.2 Leading Applications and Customer Groups
- 13.3 End-Use Market Size, Share and Forecast
- 13.4 Major End-Use Industry Deep Dives
- 13.4.1 Customer Requirements and Use Cases
- 13.4.2 Demand and Replacement Cycles
- 13.4.3 Technical and Regulatory Considerations
- 13.4.4 Purchasing and Procurement Models
- 13.4.5 Leading Vendors and Distribution Channels
- 13.4.6 Forecast and Commercial Opportunities
- 13.5 Emerging Applications and Cross-Segment Demand
- 13.6 End-Use Industry Investment Priorities
Chapter 14 Australia Mining Drone Inspections Geographic Market Outlook, 2025-2035
- 14.1 Domestic Market Distribution and Demand Clusters
- 14.2 State- or Province-Wise Market Size and Forecast, 2025-2035
- 14.3 City and Metropolitan Market Outlook
- 14.4 Industrial, Manufacturing and Commercial Clusters
- 14.5 Geographic Concentration of Key End Users
- 14.6 Local Pricing and Purchasing Differences
- 14.7 Domestic Production Facilities and Capacity Map
- 14.8 Local Infrastructure and Project Pipeline
- 14.9 State-Level Policy and Incentive Differences
- 14.10 Subnational Investment Hotspots and Opportunities
- 14.11 Distribution and Logistics Networks
- 14.12 Domestic Competitive Footprint
Chapter 15 Australia Mining Drone Inspections Technology, Innovation and Sustainability Outlook
- 15.1 Technology Landscape and Maturity
- 15.2 Product, Process and Service Innovation
- 15.3 AI, Automation and Digital Tools in the Industry
- 15.4 Technology Adoption and Performance Benchmarking
- 15.5 Innovation Pipeline and R&D Investment
- 15.6 Patent and Intellectual Property Trends
- 15.7 Energy Efficiency and Resource Management
- 15.8 Sustainability, Recycling and Circularity
- 15.9 Technology Roadmap, 2025-2035
- 15.10 Risks of Obsolescence and Technology Substitution
Chapter 16 Australia Mining Drone Inspections Market Key Strategic Imperatives
- 16.1 Growth and Market Entry Priorities
- 16.2 High-Return Products and Segments
- 16.3 Pricing, Profitability and Cost Optimization
- 16.4 Technology Investment and Product Differentiation
- 16.5 Supply Chain Localization and Resilience
- 16.6 Distribution and Customer Acquisition
- 16.7 Partnership, Acquisition and Capacity Strategy
- 16.8 Regional Expansion Priorities
- 16.9 Short-, Medium- and Long-Term Actions
Chapter 17 Competition Outlook
- 17.1 Industry Competition Characteristics
- 17.2 Market Structure and Concentration
- 17.3 Market Share and Competitive Positioning, 2025
- 17.4 Company-Wise Revenue and Product Benchmarking
- 17.5 Production and Service Capacity Benchmarking
- 17.6 Technology, Pricing and Differentiation
- 17.7 Regional Footprint and Distribution Strength
- 17.8 Mergers, Acquisitions and Strategic Alliances
- 17.9 New Entrants and Competitive Threats
- 17.10 Porter's Five Forces and Industry Attractiveness
- 17.11 Competitive Outlook, 2025-2035
Chapter 18 Company Profiles
- 18.1 Company Coverage and Selection Criteria
- 18.2 Sensorem
- 18.2.1 Business Description
- 18.2.2 Company Ownership and Geographic Presence
- 18.2.3 Product and Service Portfolio
- 18.2.4 Manufacturing and Operating Footprint
- 18.2.5 Production Capacity and Expansion Plans
- 18.2.6 Financial Performance and Investment
- 18.2.7 Market Share and Competitive Position
- 18.2.8 Technology and Innovation Capabilities
- 18.2.9 Strategic Alliances or Partnerships
- 18.2.10 Recent Developments
- 18.2.11 Growth Strategy and Outlook
- 18.3 RocketDNA
- 18.4 AUAV
- 18.5 MINELiDAR
- 18.6 BlueCap
- 18.7 Other Relevant Market Participants
Note: Every listed company is profiled on the structure shown under the first company. The company list is preliminary and may change based on research findings, market developments, data availability and client requirements.
Chapter 19 Disclaimer
- 19.1 Research and Forecast Disclaimer
- 19.2 Data Source and Estimation Limitations
Note: The depth of individual sections depends on data availability for this market. Volume, capacity, trade and other unit-based metrics are included where applicable.

