Market Overview
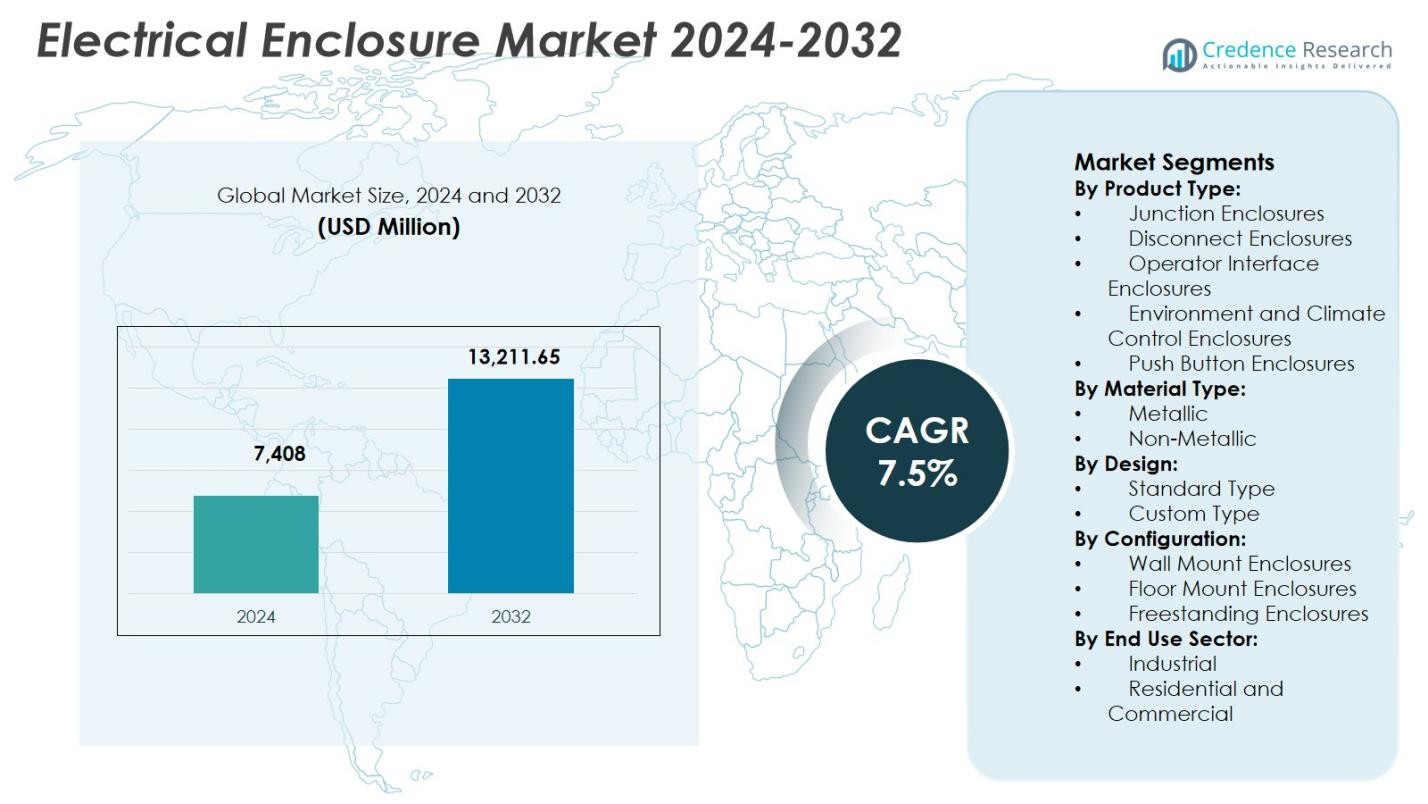
The Electrical Enclosure Market size was valued at USD 7,408 million in 2024 and is anticipated to reach USD 13,211.65 million by 2032, growing at a CAGR of 7.5% during the forecast period.
| REPORT ATTRIBUTE |
DETAILS |
| Historical Period |
2020-2023 |
| Base Year |
2024 |
| Forecast Period |
2025-2032 |
| Electrical Enclosure Market Size 2024 |
USD 7,408 Million |
| Electrical Enclosure Market, CAGR |
7.5% |
| Electrical Enclosure Market Size 2032 |
USD 13,211.65 Million |
The Electrical Enclosure Market features a strong presence of established global manufacturers including Schneider Electric SE, ABB Ltd., Siemens AG, Eaton Corporation, Legrand SA, Emerson Electric Co., Hubbell Inc., AZZ Inc., Eldon Holding AB, and Austin Electrical Enclosures. These companies focus on product reliability, compliance with international safety standards, and expanded customization to serve industrial, infrastructure, energy, and commercial applications. Asia-Pacific emerged as the leading region, accounting for 32.9% of the Electrical Enclosure Market in 2024, driven by rapid industrialization, large-scale infrastructure development, and expanding power generation capacity. North America and Europe follow, supported by automation investments, grid modernization, and strict regulatory frameworks. Continuous innovation, regional manufacturing presence, and broad distribution networks support sustained market positioning across key geographies.
Access crucial information at unmatched prices!
Request your sample report today & start making informed decisions powered by Credence Research Inc.!
Download Sample
Market Insights
- The Electrical Enclosure Market was valued at USD 7,408 million in 2024 and is projected to grow at a CAGR of 7.5% through 2032, supported by steady demand across industrial, infrastructure, and energy applications.
- Market growth is driven by expanding industrial automation, electrification of manufacturing facilities, and rising deployment of control panels and power distribution systems across utilities and process industries.
- Key market trends include rising adoption of non-metallic and corrosion-resistant enclosures and increasing demand for customized, application-specific designs, while junction enclosures led the market with a 34.6% segment share in 2024.
- Market structure is shaped by global players focusing on safety compliance, modular designs, and thermal management solutions to address diverse industrial and infrastructure requirements.
- Asia-Pacific dominated the market with a 32.9% regional share in 2024, followed by North America at 31.4% and Europe at 28.7%, reflecting strong industrial activity, infrastructure development, and regulatory enforcement.
 Market Segmentation Analysis:
By Product Type:
By product type, junction enclosures dominated the Electrical Enclosure Market with a 34.6% market share in 2024, supported by their extensive use in power distribution, industrial automation, and building infrastructure. Junction enclosures provide reliable protection for electrical connections against dust, moisture, and mechanical damage, making them essential across manufacturing, utilities, and commercial facilities. Growth is further driven by rising investments in smart grids, renewable energy installations, and industrial expansion. Their cost-effectiveness, ease of installation, and compatibility with multiple voltage levels continue to reinforce strong adoption across both developed and emerging markets.
- For instance, Emerson’s PlexPower Fiber Panels connect hybrid power and fiber cables from up to 24 field junction boxes to a central enclosure, reducing cable trays from four 24-inch units to one 12-inch unit in a project with over 2,200 I/O points.
By Material Type:
By material type, metallic enclosures accounted for the largest share at 62.8% of the Electrical Enclosure Market in 2024, driven by superior durability, impact resistance, and electromagnetic shielding capabilities. Steel and aluminum enclosures are widely preferred in heavy industries, oil & gas, power generation, and transportation infrastructure where harsh operating conditions prevail. Increasing safety regulations and the need for robust protection of critical electrical components support sustained demand. Metallic enclosures also offer longer service life and enhanced fire resistance, strengthening their position in industrial and high-voltage applications globally.
- For instance, Hudson Technologies produces deep-drawn steel enclosures for oil and gas exploration, designed to withstand corrosive chemicals, extreme temperatures, moisture, and vibration at drilling sites and refineries.
By Design:
By design, standard-type enclosures held a dominant 58.9% share of the Electrical Enclosure Market in 2024, owing to their widespread availability, standardized dimensions, and faster deployment timelines. Standard enclosures are extensively used in commercial buildings, factories, and utility projects where uniform specifications reduce procurement and installation complexity. Demand is driven by large-scale infrastructure development and cost-sensitive projects requiring proven, compliant designs. Their compatibility with mass production, established certification standards, and broad application range continues to sustain strong adoption across multiple end-use industries.
Key Growth Drivers
Expansion of Industrial Automation and Electrification
The Electrical Enclosure Market benefits significantly from the accelerating adoption of industrial automation and electrification across manufacturing, utilities, and process industries. Increasing deployment of control panels, PLC systems, and automated machinery requires secure and compliant housing for sensitive electrical components. Rising investments in smart factories, Industry 4.0 initiatives, and energy-efficient production lines further support enclosure demand. Electrical enclosures ensure operational safety, minimize downtime, and protect equipment from harsh industrial environments, reinforcing their essential role in modern automated infrastructure across both developed and emerging economies.
- For instance, Rittal’s Automation Systems (RAS) suite automates machining, assembly, wire processing, and wiring for industrial control panels. This enables up to 85% higher efficiency in control panel building by reducing manual interventions.
Growth in Power Generation and Renewable Energy Infrastructure
Rapid expansion of power generation capacity, particularly in renewable energy projects, strongly drives the Electrical Enclosure Market. Solar, wind, and energy storage installations require durable enclosures to protect inverters, switchgear, and monitoring systems from environmental exposure. Grid modernization initiatives and rising electricity demand further increase installation of substations and distribution networks. Electrical enclosures play a critical role in ensuring safety, weather resistance, and regulatory compliance, making them indispensable components in both centralized and distributed energy infrastructure developments worldwide.
- For instance, Fluence’s Gridstack Pro energy storage deploys 5-6 MWh capacity in single enclosures for grid services and renewable integration. These configurable units protect battery modules and monitoring systems, with verified fire safety preventing propagation in dense layouts.
Rising Construction and Infrastructure Development Activities
Ongoing growth in commercial, residential, and public infrastructure construction significantly supports the Electrical Enclosure Market. Urbanization, smart city initiatives, and transportation infrastructure upgrades increase demand for electrical distribution systems and control cabinets. Enclosures are essential for safeguarding wiring, circuit breakers, and control devices in buildings, metros, airports, and data centers. Stringent electrical safety codes and building regulations further reinforce enclosure adoption, driving consistent demand across new construction projects and large-scale renovation activities globally.
Key Trends & Opportunities
Increasing Demand for Non-Metallic and Corrosion-Resistant Enclosures
A notable trend in the Electrical Enclosure Market is the growing preference for non-metallic and corrosion-resistant materials such as fiberglass and polycarbonate. These enclosures offer lightweight construction, chemical resistance, and superior performance in humid or corrosive environments. Demand is rising from wastewater treatment, food processing, and coastal infrastructure projects. This shift creates opportunities for manufacturers to innovate with advanced materials, improve ingress protection ratings, and expand product portfolios tailored to harsh and specialized operating conditions.
- For instance, Eaton’s B-Line series fiberglass-reinforced polyester enclosures protect controls in wastewater plants against chemicals, water exposure, and extreme conditions with NEMA 4X ratings.
Customization and Application-Specific Enclosure Solutions
Rising demand for customized electrical enclosures presents a strong opportunity within the Electrical Enclosure Market. End users increasingly require application-specific designs to accommodate unique layouts, thermal management needs, and compliance standards. Industries such as data centers, renewable energy, and industrial automation seek tailored solutions that enhance performance and space efficiency. This trend enables suppliers to differentiate through engineering capabilities, value-added services, and faster design-to-deployment cycles, strengthening long-term customer relationships and revenue potential.
- For instance, IP Enclosures supplied powder-coated steel enclosures for LV distribution and SCADA systems at a utility-scale solar farm, addressing extreme solar loading, dust, and temperature swings.
Key Challenges
High Raw Material and Manufacturing Cost Volatility
Fluctuating prices of raw materials such as steel, aluminum, and specialty polymers pose a key challenge for the Electrical Enclosure Market. Cost volatility impacts manufacturing margins and pricing strategies, particularly for metallic enclosures. Rising energy and labor costs further increase production expenses. Manufacturers face pressure to balance cost efficiency with quality and regulatory compliance, which can limit profitability and delay project timelines, especially in price-sensitive infrastructure and industrial applications.
Compliance with Stringent Safety and Certification Standards
Meeting diverse and evolving safety, ingress protection, and industry certification standards remains a major challenge in the Electrical Enclosure Market. Regulatory requirements vary across regions and end-use industries, increasing design complexity and testing costs. Non-compliance can lead to project delays, penalties, or product rejection. Manufacturers must continuously invest in certification, testing, and quality assurance processes, which can strain resources and slow product launches, particularly for customized and application-specific enclosure solutions.
Regional Analysis
North America
North America accounted for 31.4% of the Electrical Enclosure Market in 2024, driven by strong investments in industrial automation, power infrastructure upgrades, and data center expansion. The region benefits from strict electrical safety regulations that mandate certified and high-performance enclosures across industrial, commercial, and utility applications. Growth in renewable energy projects and grid modernization initiatives further supports enclosure demand. The presence of advanced manufacturing facilities and widespread adoption of smart factory technologies reinforces sustained demand for both standard and customized electrical enclosures across the United States and Canada.
Europe
Europe held a 28.7% share of the Electrical Enclosure Market in 2024, supported by robust industrial activity, renewable energy deployment, and stringent compliance with IEC and IP standards. Expansion of wind and solar power installations across Germany, France, and the Nordics drives demand for durable and weather-resistant enclosures. Increasing focus on electrified transportation infrastructure and smart buildings also contributes to market growth. Additionally, Europe’s strong emphasis on sustainability and energy efficiency encourages adoption of advanced enclosure materials and designs across industrial and commercial sectors.
Asia-Pacific
Asia-Pacific dominated the Electrical Enclosure Market with a 32.9% market share in 2024, driven by rapid industrialization, urbanization, and large-scale infrastructure development. Strong manufacturing growth in China, India, Japan, and Southeast Asia fuels high demand for electrical distribution and control systems. Expansion of power generation capacity, including renewables, and rising investments in smart cities further support enclosure adoption. Cost-effective manufacturing, expanding construction activities, and increasing enforcement of electrical safety standards position Asia-Pacific as the fastest-growing and most influential regional market.
Latin America
Latin America accounted for 4.2% of the Electrical Enclosure Market in 2024, supported by gradual growth in construction, energy, and industrial sectors. Investments in power transmission, renewable energy projects, and mining operations drive steady demand for electrical enclosures across Brazil, Mexico, and Chile. Infrastructure modernization and expansion of commercial facilities contribute to market development. However, economic volatility and uneven regulatory enforcement moderate growth rates. Increasing focus on grid reliability and industrial safety is expected to strengthen long-term demand for compliant enclosure solutions.
Middle East & Africa
The Middle East & Africa region captured 2.8% of the Electrical Enclosure Market in 2024, driven by infrastructure expansion, oil and gas projects, and power generation investments. Harsh environmental conditions create strong demand for rugged, corrosion-resistant, and climate-controlled enclosures. Growth in renewable energy initiatives and urban development across the Gulf countries supports adoption. In Africa, electrification programs and industrial development contribute to gradual market expansion. Demand remains focused on durable solutions that ensure safety and reliability in extreme operating environments.
Market Segmentations:
By Product Type:
- Junction Enclosures
- Disconnect Enclosures
- Operator Interface Enclosures
- Environment and Climate Control Enclosures
- Push Button Enclosures
By Material Type:
By Design:
- Standard Type
- Custom Type
By Configuration:
- Wall Mount Enclosures
- Floor Mount Enclosures
- Freestanding Enclosures
By End Use Sector:
- Industrial
- Residential and Commercial
By Geography
- North America
- Europe
- Germany
- France
- U.K.
- Italy
- Spain
- Rest of Europe
- Asia Pacific
- China
- Japan
- India
- South Korea
- South-east Asia
- Rest of Asia Pacific
- Latin America
- Brazil
- Argentina
- Rest of Latin America
- Middle East & Africa
- GCC Countries
- South Africa
- Rest of the Middle East and Africa
Competitive Landscape
The Electrical Enclosure Market is characterized by the presence of global and regional manufacturers such as Schneider Electric SE, ABB Ltd., Siemens AG, Eaton Corporation, Legrand SA, Emerson Electric Co., Hubbell Inc., AZZ Inc., Eldon Holding AB, and Austin Electrical Enclosures. Market participants focus on expanding product portfolios, strengthening compliance with international safety and ingress protection standards, and enhancing customization capabilities. Companies increasingly invest in advanced materials, thermal management solutions, and modular designs to address diverse industrial and infrastructure applications. Strategic initiatives include capacity expansion, technology upgrades, and partnerships to support growing demand from renewable energy, data centers, and industrial automation. Strong distribution networks and localized manufacturing enable players to serve regional requirements efficiently. Continuous innovation, reliability, and adherence to regulatory standards remain key factors shaping competitive positioning in the global Electrical Enclosure Market.
Key Player Analysis
- AZZ Inc.
- Siemens AG
- Eldon Holding AB
- Hubbell Inc.
- Eaton Corporation
- Austin Electrical Enclosures
- ABB Ltd.
- Schneider Electric SE
- Emerson Electric Co.
- Legrand SA
Recent Developments
- In September 2025, Schneider Electric announced a global strategic partnership with NVIDIA to advance infrastructure for AI data center workloads, enhancing digital and power management capabilities.
- In March 2025, nVent Electric plc entered into a definitive agreement to acquire the Electrical Products Group (including electrical enclosures, switchgear, and bus systems) from Avail Infrastructure Solutions, strengthening its product portfolio.
- In November 2024, Eaton partnered with Treehouse to integrate digitally enabled electrical solutions, including enclosures, for residential electrification projects like EV charging and energy storage.
Shape Your Report to Specific Countries or Regions & Enjoy 30% Off!
Report Coverage
The research report offers an in-depth analysis based on Product Type, Material Type, Design, Configuration, End Use Sector and Geography. It details leading market players, providing an overview of their business, product offerings, investments, revenue streams, and key applications. Additionally, the report includes insights into the competitive environment, SWOT analysis, current market trends, as well as the primary drivers and constraints. Furthermore, it discusses various factors that have driven market expansion in recent years. The report also explores market dynamics, regulatory scenarios, and technological advancements that are shaping the industry. It assesses the impact of external factors and global economic changes on market growth. Lastly, it provides strategic recommendations for new entrants and established companies to navigate the complexities of the market.
Future Outlook
- The Electrical Enclosure Market is expected to benefit from sustained growth in industrial automation and electrification initiatives across manufacturing sectors.
- Increasing deployment of renewable energy and energy storage systems will drive long-term demand for durable and weather-resistant enclosure solutions.
- Smart infrastructure and smart city projects will accelerate adoption of advanced electrical distribution and control enclosures.
- Demand for non-metallic and corrosion-resistant enclosures will rise in harsh and outdoor operating environments.
- Custom-designed enclosures will gain traction as end users seek application-specific and space-optimized solutions.
- Stricter electrical safety, ingress protection, and fire-resistance regulations will continue to influence product development.
- Expansion of data centers and digital infrastructure will support demand for climate-controlled enclosure systems.
- Manufacturers will focus on lightweight materials and modular designs to improve installation efficiency.
- Integration of thermal management and monitoring features will enhance enclosure performance and reliability.
- Growth in emerging economies will create new opportunities through infrastructure development and industrial expansion.


