Home » Mining, Minerals and Metals » India Foundry Market

India Foundry Market By Casting Process (Sand Casting, Investment Casting, Die Casting, Permanent Mold Casting); By Foundry Size (Large Foundries [Automation, Digital Foundries], Small & Medium Foundries [Regional, Niche Casting]); By End-User (Automotive [Engine Blocks, Chassis, EV Parts], Aerospace, Construction & Infrastructure, Energy [Wind Turbines, Power Generation Components]); By Technology (Digital Foundries [IoT, AI, Predictive Maintenance], 3D Sand Printing [Complex Cores], Sustainable Casting [Low-Carbon Alloys, Recycling, Green Melting]); By Material (Ferrous [Cast Iron, Steel], Non-Ferrous [Aluminum, Magnesium]) – Growth, Share, Opportunities & Competitive Analysis, 2024 – 2032

Report ID: 94887 | Report Format : Excel, PDF

Market Overview:

The India Foundry Market size was valued at USD 1,546.95 million in 2018 to USD 1,753.70 million in 2024 and is anticipated to reach USD 2,800.83 million by 2032, at a CAGR of 6.03% during the forecast period.

REPORT ATTRIBUTE DETAILS
Historical Period 2020-2023
Base Year 2024
Forecast Period 2025-2032
India Foundry Market Size 2024 USD 1,753.70 million
India Foundry Market, CAGR 6.03%
India Foundry Market Size 2032 USD 2,800.83 million


Rising infrastructure development, stable automotive production, and wider adoption of precision cast parts drive steady demand in the India Foundry Market. Manufacturers upgrade melting capacity, molding lines, and quality systems to meet stricter performance needs. Strong investment in clean energy, railways, and construction equipment adds momentum across foundry clusters. Lightweight component demand grows as vehicle makers push fuel efficiency standards. Local suppliers adopt digital monitoring tools to improve cycle time, reduce waste, and support higher productivity. Export opportunities expand as global buyers seek reliable castings from cost-competitive Indian plants.

Regional growth in the India Foundry Market centers on major industrial belts such as Maharashtra, Gujarat, Tamil Nadu, and Karnataka, which lead due to dense automotive, engineering, and machinery bases. Northern states like Punjab and Haryana show steady growth supported by strong agricultural equipment manufacturing. Eastern regions including West Bengal and Odisha emerge as new corridors backed by steel availability and upcoming industrial parks. Southern clusters advance through strong supplier networks and skilled labor pools. Rural-adjacent districts expand capacity as new SMEs enter casting supply chains to serve regional manufacturing hubs.

India Foundry Market size

Market Insights:

  • The India Foundry Market increased from USD 1,546.95 million in 2018 to USD 1,753.70 million in 2024 and is expected to reach USD 2,800.83 million by 2032 at a 6.03% CAGR, reflecting steady expansion supported by automotive, machinery, and infrastructure demand.
  • Western and southern India together command about 58% of total share due to strong automotive clusters, dense supplier networks, and advanced foundry capabilities. Northern India holds roughly 24% share driven by agricultural machinery and engineering hubs, while eastern India contributes about 12% supported by steel availability and expanding industrial parks.
  • Central India is the fastest-growing region with a 6% share, gaining momentum from rising SME participation, new casting capacity, and improving connectivity that supports machinery and infrastructure-linked demand.
  • Ferrous materials account for roughly 40% of 2024 output in the chart, supported by high use in automotive engines, machinery components, and heavy equipment structures.
  • Non-ferrous materials capture about 60% of 2024 output, driven by growing aluminum demand in lightweight vehicles and precision applications highlighted in the chart.

Access crucial information at unmatched prices!

Request your sample report today & start making informed decisions powered by Credence Research Inc.!

Download Sample

Market Drivers:

Strong Demand Growth From Automotive, Machinery, And Infrastructure Expansion

The India Foundry Market gains strong momentum from rising demand across automotive, machinery, and infrastructure sectors. Vehicle makers need high-quality cast components for engines, braking modules, and structural systems. Heavy machinery producers seek durable castings that support higher loads and longer duty cycles. Infrastructure growth boosts orders for cast pipes, fittings, valves, and construction equipment parts. Government focus on transport projects increases supply obligations for medium and large foundries. Firms upgrade melting and molding units to meet these high-volume needs. Buyers prefer castings with stronger dimensional accuracy. Export opportunities grow as global firms outsource metal casting needs to India.

  • For instance, Brakes India operates over 200,000 tonnes per year of ferrous casting capacity for braking and automotive systems, supplying major OEMs with verified large-volume precision parts.

Rising Shift Toward Precision Casting And High-Performance Material Adoption

Higher adoption of precision casting supports new demand across defense, energy, and industrial equipment lines. Buyers look for cast components with tighter tolerance and improved surface quality. Manufacturers deploy automated molding and inspection tools to improve process stability. High-performance metals gain traction in sectors that need heat-resistant and corrosion-resistant parts. Growth in renewable energy equipment lifts demand for cast housings and turbine parts. Companies enhance metallurgical control to meet elevated performance needs. Automation raises consistency across production cycles. The India Foundry Market benefits from this shift toward advanced material capability.

  • For instance, Tata Advanced Systems uses precision investment-cast turbine and structural components in aerospace programs, supported by globally certified processes used across over 50 OEM-linked assemblies.

Expanding Investments In Modernization And Smart Production Technologies

Modernization expands capacity and helps foundries improve overall output efficiency. Companies adopt digital monitoring tools to track furnace cycles and casting patterns. Smart controls reduce defects and strengthen energy efficiency. Robotics support molding, fettling, and handling tasks to reduce manual load. Firms redesign layouts to support faster material flow and shorter production time. New emissions-control systems ensure compliance with rising standards. Industrial clusters encourage automation to stay competitive with global suppliers. Growth in plant upgrades drives stronger adoption of smart foundry practices across regions.

Growth In Export Potential Supported By Cost Competitiveness And Quality Enhancement

Growing export potential drives strong production gains across large and mid-size foundries. International buyers prefer suppliers that deliver consistent cast quality. India strengthens its position through cost-effective production and improved metallurgical capability. Firms align with global standards to access new customers in North America, Europe, and Asia. Strong transport networks support efficient movement of bulk cast components. Export buyers value shorter lead times offered by advanced clusters. Foundries improve documentation and traceability to strengthen trust. Increased global visibility supports deeper participation in long-term supply contracts.

Market Trends:

Shift Toward Automated Foundry Ecosystems And Integrated Production Intelligence

Automated ecosystems gain wider adoption across foundry clusters seeking higher efficiency. Firms introduce integrated controls that link melting, molding, and finishing units. Real-time tracking improves throughput and reduces downtime risks. Digital dashboards help supervisors manage casting cycles with better accuracy. Predictive tools identify material variation before defects occur. Automation supports higher worker safety by reducing direct contact with hot metal. The India Foundry Market adopts these intelligent systems to strengthen reliability. Investment in automated workflows increases competitive strength across global markets.

  • For instance, Tesla’s Gigafactory casting approach—using 6,000- to 9,000-ton Giga Press units from Idra for single-piece frames—demonstrates how automated casting ecosystems deliver measurable cycle-time and precision gains, influencing global automation standards adopted by Indian foundries.

Rising Use Of Sustainable Production Practices And Low-Emission Processes

Sustainable production trends shape operational strategies across domestic plants. Firms shift toward low-emission furnaces to meet stricter environmental rules. Energy recovery systems support stable temperature control and lower fuel use. Cleaner melting practices reduce waste generation and slag volume. Buyers demand eco-compliant castings for machinery and vehicle parts. Certification programs push producers toward greener operational models. Workers adopt better material-handling routines to reduce environmental impact. Sustainability practices gain acceptance as a long-term competitiveness tool.

Higher Adoption Of Advanced Simulation Tools For Faster Design And Prototyping Needs

Advanced simulation helps engineers design cast parts with fewer trial cycles. Digital models predict shrinkage, flow, and cooling patterns with high accuracy. Prototyping time reduces as software-driven insights guide tooling design. This improves success rates during first production runs. Engineering teams meet tight delivery targets with less rework. Firms use simulation platforms to serve global buyers with complex casting requirements. The India Foundry Market benefits from faster design cycles enabled by modern digital tools. Simulation use becomes standard across more mid-size plants.

Growing Integration Of Additive Manufacturing For Tooling And Low-Volume Cast Components

Additive manufacturing enters foundry operations as a support tool for pattern and mold production. 3D printing reduces development time for low-volume and customized cast parts. Complex shapes become easier to produce with hybrid approaches. Foundries use printed patterns to shorten cycle time in new product introduction. Tooling cost decreases for short-series orders. Buyers receive prototypes at faster speed without large investments. Integration expands across clusters that serve defense, aerospace, and premium machinery segments. Demand grows as additive workflows support more intricate cast part development.

India Foundry Market share

Market Challenges Analysis:

Rising Energy Costs, Emission Compliance Pressure, And Operational Inefficiencies

Rising energy costs challenge foundries that operate energy-intensive melting systems. Fuel price volatility affects cost forecasting for many plants. Emission standards push firms to upgrade furnaces and filtration units. Smaller units struggle to invest in compliant technology. Skilled workforce shortages limit the pace of modernization. Quality variation occurs when metallurgical control systems remain outdated. Firms monitor scrap ratio closely to maintain margins. The India Foundry Market continues to face cost pressure from energy-intensive operations.

Supply Chain Constraints, Raw Material Instability, And Technical Capability Gaps

Raw material supply faces uncertainty due to fluctuations in scrap metal availability. Such instability impacts alloy composition control in production units. Supply chain gaps delay delivery of key consumables and refractories. Smaller players face difficulty meeting complex casting needs from global buyers. Quality certification demands increase operational stress for mid-size plants. Machine downtime rises when old equipment needs frequent repair. Firms invest in reliability tools to manage these delays. Many clusters require long-term upgrades to close capability gaps.

Market Opportunities:

Expansion Of High-Value Casting Segments Supported By Industrial Growth Across New Sectors

High-value sectors create strong opportunity for foundries producing complex castings. Renewable energy, defense equipment, and precision machinery require advanced metal components. Such demand strengthens long-term investment interest in upgraded foundry lines. Aerospace suppliers explore Indian clusters for high-performance cast metals. Medical equipment makers prefer precision components with strong metallurgical stability. Export channels expand for firms producing high-specification components. The India Foundry Market gains visibility from such high-value opportunities. Local suppliers develop stronger capabilities to meet these needs.

Innovation In Clean Technologies And Automation Adoption Across New Foundry Clusters

Clean melting systems provide growth opportunities for plants shifting toward low-emission processes. Automation enables consistent output and reduces manual defects. Firms gain cost advantage through reduced rework and lower scrap percentage. Cleaner operations help clusters meet domestic and global compliance needs. Digital tools unlock better asset control and longer equipment life. Buyers appreciate improved reliability from modernized operations. Export potential increases for plants using advanced process technologies. Clusters attract new investors seeking sustainable and efficient production platforms.

Market Segmentation Analysis:

By Casting Process

The India Foundry Market grows across key casting segments driven by demand from automotive, engineering, and infrastructure projects. Sand casting holds strong use due to flexibility and lower tooling cost. Investment casting supports complex geometries required in aerospace and precision machinery. Die casting gains momentum with rising aluminum part use in lightweight vehicles. Permanent mold casting secures interest from buyers focused on consistent quality and longer tool life. Each process supports distinct performance needs across industrial supply chains. It benefits from wider adoption of automation and quality control tools.

  • For instance, Endurance Technologies has a large capacity for aluminum die-casting componentsand supplies parts for two-wheeler, three-wheeler, and four-wheeler OEMs in India and Europe. The company operates numerous plants globally, with 19 in India and 12 in Europe, focusing on high-pressure, low-pressure, and gravity die-casting processes.

By Foundry Size

Large foundries strengthen their role through high-volume output supported by automation and digital controls. These plants secure long-term contracts from automotive and machinery firms. Small and medium foundries expand through niche casting needs across regional clusters. Their flexibility supports custom orders and short-run projects. Many SMEs invest in improved melting and molding units to enhance capability. Competitive pressure pushes all sizes to upgrade inspection and testing systems. Buyers evaluate suppliers on reliability and tolerance accuracy. Market share shifts toward units that maintain strong production discipline.

  • For instance, Kirloskar Ferrous Industries operates across multiple units, including recent expansions and the acquisition of Oliver Engineering Private Limited, and utilizes high-pressure automated molding lines in its facilities.

By End-User

Automotive holds dominant demand due to strong use of cast iron and aluminum parts across vehicle platforms. Aerospace adopts precision castings for structural and propulsion systems. Construction and infrastructure drive steady orders for pipes, valves, and large structural components. Energy applications expand with demand for turbine housings and power generation parts. Each sector defines performance standards that influence material choice. Suppliers align production lines to meet high-spec requirements. Long-term projects provide consistent procurement flow for many clusters. It engages diverse industries seeking high-strength cast metal components.

By Technology And Material

Digital foundries integrate IoT and AI tools to enhance monitoring, predictive maintenance, and casting accuracy. 3D sand printing gains traction for producing complex cores with reduced lead time. Sustainable casting trends encourage low-carbon alloys and recycling practices. Ferrous materials maintain dominance due to strong mechanical properties. Non-ferrous options grow in lightweight vehicle and aerospace applications. Material choice impacts cost, corrosion resistance, and weight targets. Technology adoption shapes competitive advantage. Buyers prefer plants that combine modern systems with stable metallurgical capability.

India Foundry Market segmentation

Segmentation:

By Casting Process

  • Sand Casting
  • Investment Casting
  • Die Casting
  • Permanent Mold Casting

By Foundry Size

  • Large Foundries (automation, digital foundries)
  • Small & Medium Foundries (regional, niche casting)

By End-User

  • Automotive (engine blocks, chassis, EV parts)
  • Aerospace
  • Construction & Infrastructure
  • Energy (wind turbines, power generation components)

By Technology

  • Digital Foundries (IoT, AI, predictive maintenance)
  • 3D Sand Printing (complex cores)
  • Sustainable Casting (low-carbon alloys, recycling, green melting)

By Material

  • Ferrous (cast iron, steel)
  • Non-Ferrous (aluminum, magnesium)

By Region

  • North America
    • U.S.
    • Canada
    • Mexico
  • Europe
    • Germany
    • France
    • U.K.
    • Italy
    • Spain
    • Rest of Europe
  • Asia Pacific
    • China
    • Japan
    • India
    • South Korea
    • South-east Asia
    • Rest of Asia Pacific
  • Latin America
    • Brazil
    • Argentina
    • Rest of Latin America
  • Middle East & Africa
    • GCC Countries
    • South Africa
    • Rest of the Middle East and Africa

Regional Analysis:

Leading Industrial Belts With Strong Production Concentration

The India Foundry Market records its highest concentration in western and southern regions, which together hold close to 58% share. Maharashtra and Gujarat lead the western belt due to strong automotive, machinery, and engineering clusters. Tamil Nadu and Karnataka drive southern growth through dense supplier networks and advanced foundry capabilities. These states benefit from better logistics, skilled labor, and access to metallurgical inputs. Large foundries adopt automation to support high-volume contracts. Regional hubs develop stronger ecosystems for casting, machining, and finishing. It gains steady momentum from this established industrial base.

Expanding Northern And Eastern Corridors With Rising Industrial Participation

Northern India holds nearly 24% share driven by automotive, agricultural machinery, and heavy equipment demand. Haryana and Punjab support growth through strong equipment manufacturing hubs. Uttar Pradesh shows rising activity due to new engineering parks and proximity to major transport routes. Eastern India contributes about 12% share supported by steel availability in Odisha, Jharkhand, and West Bengal. These states attract mid-size foundries that target construction and infrastructure projects. Regional growth accelerates with government spending on logistics corridors. It continues to evolve as industrialisation spreads toward emerging districts.

Emerging Central And Regional SME Clusters Strengthening National Output

Central India accounts for close to 6% share driven by expanding SME networks in Madhya Pradesh and Chhattisgarh. These hubs support machinery and infrastructure demand from nearby industrial states. Many small and medium foundries develop niche capabilities that serve local buyers. Their flexibility helps them secure contracts in replacement parts and specialised castings. Regional growth remains steady due to improving connectivity and rising investor interest. Clusters adopt modern melting and molding equipment to match buyer expectations. The India Foundry Market gains wider national coverage through these emerging SME-driven corridors

Shape Your Report to Specific Countries or Regions & Enjoy 30% Off!

Key Player Analysis:

Competitive Analysis:

The India Foundry Market reflects strong competition among large integrated foundries, mid-size regional units, and specialized niche producers. Firms invest in automation, metallurgical control, and digital monitoring to strengthen quality and cycle-time performance. Leading companies expand casting capacity to secure long-term contracts from automotive, engineering, and energy sectors. Many players focus on precision components to meet demand from aerospace and premium machinery buyers. Supplier networks grow stronger through improved machining and finishing capabilities. Export-oriented units adopt global standards to attract international clients. It advances through firms that combine scale, technical strength, and operational efficiency to secure wider market presence.

Recent Developments:

  • In October 2024, JSW Steel and JFE Steel finalized an agreement to acquire 100% equity stake in thyssenkrupp Electrical Steel India Private Limited for approximately ₹482.1 million. The joint venture, known as JSW JFE Electrical Steel Private Limited (J2ES), which was established in February 2024 as a 50:50 partnership between JSW Steel and JFE Steel Corp, completed this acquisition in January 2025.
  • Larsen & Toubro made a strategic investment in India’s digital infrastructure space in November 2024, acquiring a 21% stake in E2E Networks, a Delhi-based cloud services company, for approximately ₹1,407 crores. This acquisition involved a 15% stake through preferential allotment for ₹1,079.27 crores and an additional 6% stake via secondary acquisition from the founder for ₹327.75 crores.

Report Coverage:

The research report offers an in-depth analysis based on casting process, foundry size, end-user, technology, and material segments. It details leading market players, providing an overview of their business, product offerings, investments, revenue streams, and key applications. Additionally, the report includes insights into the competitive environment, SWOT analysis, current market trends, as well as the primary drivers and constraints. Furthermore, it discusses various factors that have driven market expansion in recent years. The report also explores market dynamics, regulatory scenarios, and technological advancements that are shaping the industry. It assesses the impact of external factors and global economic changes on market growth. Lastly, it provides strategic recommendations for new entrants and established companies to navigate the complexities of the market.

Future Outlook:

  • Demand for precision cast components is set to rise across automotive and energy industries.
  • Digital foundry models using IoT and AI will gain broader acceptance.
  • Regional clusters will expand capability through upgraded melting and molding lines.
  • Export potential will grow as global buyers increase sourcing from competitive Indian units.
  • Adoption of sustainable casting practices will strengthen compliance strength.
  • Tooling and pattern development will advance through higher use of 3D sand printing.
  • Skill development programs will support workforce readiness for automated foundry floors.
  • Large plants will drive modernization through predictive maintenance systems.
  • SME clusters will scale through niche casting solutions and custom project delivery.
  • The India Foundry Market will benefit from strong demand across construction and infrastructure growth corridors.

CHAPTER NO. 1 : INTRODUCTION 18

1.1.1. Report Description 18

Purpose of the Report 18

USP & Key Offerings 18

1.1.2. Key Benefits for Stakeholders 18

1.1.3. Target Audience 19

1.1.4. Report Scope 19

CHAPTER NO. 2 : EXECUTIVE SUMMARY 20

2.1. India Foundry Market Snapshot 20

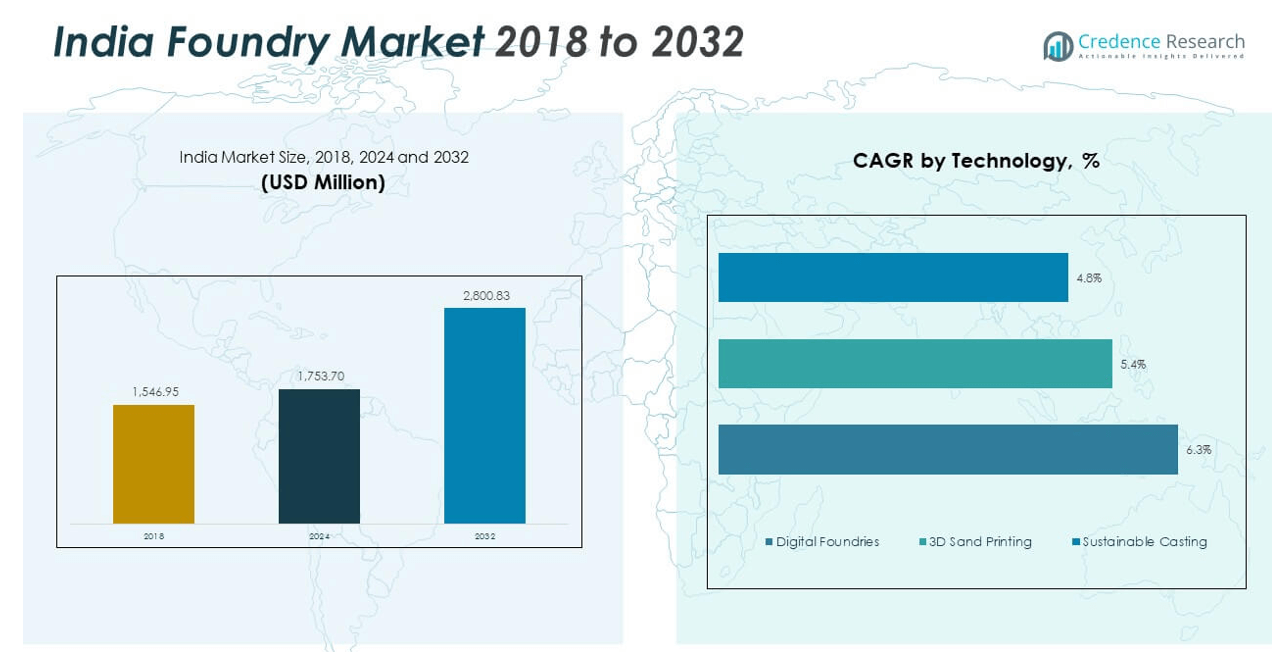
2.1.1. India Foundry Market, 2018 – 2032 (Unit) (USD Million) 22

2.2. Insights from Primary Respondents 23

CHAPTER NO. 3 : INDIA FOUNDRY MARKET – INDUSTRY ANALYSIS 24

3.1. Introduction 24

3.2. Market Drivers 25

3.2.1. Increasing Demand for Semiconductors across Multiple Sectors 25

3.2.2. Innovations in Technology 26

3.3. Market Restraints 27

3.3.1. High Energy Costs 27

3.4. Market Opportunities 28

3.4.1. Market Opportunity Analysis 28

3.5. Porter’s Five Forces Analysis 29

CHAPTER NO. 4 : ANALYSIS COMPETITIVE LANDSCAPE 30

4.1. Company Market Share Analysis – 2024 30

4.1.1. India Foundry Market: Company Market Share, by Volume, 2024 30

4.1.2. India Foundry Market: Company Market Share, by Revenue, 2024 31

4.1.3. India Foundry Market: Top 6 Company Market Share, by Revenue, 2024 31

4.1.4. India Foundry Market: Top 3 Company Market Share, by Revenue, 2024 32

4.2. India Foundry Market Company Volume Market Share, 2024 33

4.3. India Foundry Market Company Revenue Market Share, 2024 34

4.4. Company Assessment Metrics, 2024 35

4.4.1. Stars 35

4.4.2. Emerging Leaders 35

4.4.3. Pervasive Players 35

4.4.4. Participants 35

4.5. Start-ups /SMEs Assessment Metrics, 2024 35

4.5.1. Progressive Companies 35

4.5.2. Responsive Companies 35

4.5.3. Dynamic Companies 35

4.5.4. Starting Blocks 35

4.6. Strategic Developments 36

4.6.1. Acquisitions & Mergers 36

New Product Launch 36

Regional Expansion 36

4.7. Key Players Product Matrix 37

CHAPTER NO. 5 : PESTEL & ADJACENT MARKET ANALYSIS 38

5.1. PESTEL 38

5.1.1. Political Factors 38

5.1.2. Economic Factors 38

5.1.3. Social Factors 38

5.1.4. Technological Factors 38

5.1.5. Environmental Factors 38

5.1.6. Legal Factors 38

5.2. Adjacent Market Analysis 38

CHAPTER NO. 6 : FOUNDRY MARKET – BY METAL TYPES SEGMENT ANALYSIS 39

6.1. Foundry Market Overview, by Metal Types Segment 39

6.1.1. Foundry Market Volume Share, By Metal Types, 2023 & 2032 40

6.1.2. Foundry Market Revenue Share, By Metal Types, 2023 & 2032 40

6.1.3. Foundry Market Attractiveness Analysis, By Metal Types 41

6.1.4. Incremental Revenue Growth Opportunity, by Metal Types, 2024 – 2032 41

6.1.5. Foundry Market Revenue, By Metal Types, 2018, 2023, 2027 & 2032 42

6.2. Ferrous Foundries 43

6.3. Non-Ferrous Foundries 44

CHAPTER NO. 7 : FOUNDRY MARKET – BY CASTING PROCESSES SEGMENT ANALYSIS 45

7.1. Foundry Market Overview, by Casting Processes Segment 45

7.1.1. Foundry Market Volume Share, By Casting Processes, 2023 & 2032 46

7.1.2. Foundry Market Revenue Share, By Casting Processes, 2023 & 2032 46

7.1.3. Foundry Market Attractiveness Analysis, By Casting Processes 47

7.1.4. Incremental Revenue Growth Opportunity, by Casting Processes, 2024 – 2032 47

7.1.5. Foundry Market Revenue, By Casting Processes, 2018, 2023, 2027 & 2032 48

7.2. Sand Casting 49

7.3. Investment Casting 50

7.4. Die Casting 51

7.5. Permanent Mold Casting 52

CHAPTER NO. 8 : FOUNDRY MARKET – BY APPLICATION SEGMENT ANALYSIS 53

8.1. Foundry Market Overview, by Application Segment 53

8.1.1. Foundry Market Volume Share, By Application, 2023 & 2032 54

8.1.2. Foundry Market Revenue Share, By Application, 2023 & 2032 54

8.1.3. Foundry Market Attractiveness Analysis, By Application 55

8.1.4. Incremental Revenue Growth Opportunity, by Application, 2024 – 2032 55

8.1.5. Foundry Market Revenue, By Application, 2018, 2023, 2027 & 2032 56

8.2. Automotive 57

8.3. Aerospace 58

8.4. Construction & Infrastructure 59

8.5. Energy 60

CHAPTER NO. 9 : FOUNDRY MARKET – BY FOUNDRY SIZE AND SCALE SEGMENT ANALYSIS 61

9.1. Foundry Market Overview, by Foundry Size and Scale Segment 61

9.1.1. Foundry Market Volume Share, By Foundry Size and Scale, 2023 & 2032 62

9.1.2. Foundry Market Revenue Share, By Foundry Size and Scale, 2023 & 2032 62

9.1.3. Foundry Market Attractiveness Analysis, By Foundry Size and Scale 63

9.1.4. Incremental Revenue Growth Opportunity, by Foundry Size and Scale, 2024 – 2032 63

9.1.5. Foundry Market Revenue, By Foundry Size and Scale, 2018, 2023, 2027 & 2032 64

9.2. Large Foundries 65

9.3. Small & Medium Sized Foundries 66

CHAPTER NO. 10 : FOUNDRY MARKET – INDIA 67

10.1.1. India Foundry Market Volume, By Metal Types, 2018 – 2023 (Unit) 67

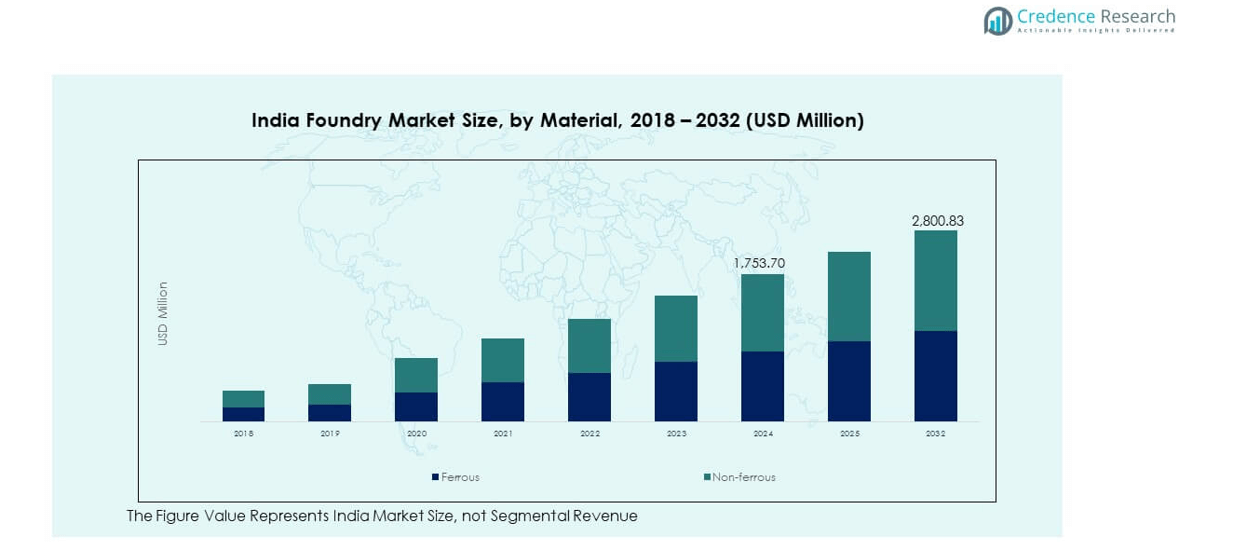
10.1.2. India Foundry Market Revenue, By Metal Types, 2018 – 2023 (USD Million) 68

10.1.3. India Foundry Market Volume, By Casting Processes, 2018 – 2023 (Unit) 69

10.1.4. India Foundry Market Revenue, By Casting Processes, 2018 – 2023 (USD Million) 70

10.1.5. India Foundry Market Volume, By Application, 2018 – 2023 (Unit) 71

10.1.6. India Foundry Market Revenue, By Application, 2018 – 2023 (USD Million) 72

10.1.7. India Foundry Market Volume, By Foundry Size and Scale, 2018 – 2023 (Unit) 73

10.1.8. India Foundry Market Revenue, By Foundry Size and Scale, 2018 – 2023 (USD Million) 74

CHAPTER NO. 11 : COMPANY PROFILES 75

11.1. Brakes India Pvt. Ltd. 75

11.1.1. Company Overview 75

11.1.2. Product Portfolio 75

11.1.3. Swot Analysis 75

11.1.4. Business Strategy 75

11.1.5. Financial Overview 76

11.2. Aditya Birla Management Corp. Pvt. Ltd 77

11.3. Larsen and Toubro Ltd. 77

11.4. Gujarat Metal Cast Industries Pvt. Ltd. 77

11.5. Jayaswal Neco Industries Ltd. 77

11.6. Company 6 77

11.7. Company 7 77

11.8. Company 8 77

11.9. Company 9 77

11.10. Company 10 77

List of Figures

FIG NO. 1. India Foundry Market Volume & Revenue, 2018 – 2032 (Unit) (USD Million) 22

FIG NO. 2. Porter’s Five Forces Analysis for India Foundry Market 29

FIG NO. 3. Company Share Analysis, 2024 30

FIG NO. 4. Company Share Analysis, 2024 31

FIG NO. 5. Company Share Analysis, 2024 31

FIG NO. 6. Company Share Analysis, 2024 32

FIG NO. 7. Foundry Market – Company Volume Market Share, 2024 33

FIG NO. 8. Foundry Market – Company Revenue Market Share, 2024 34

FIG NO. 9. Foundry Market Volume Share, By Metal Types, 2023 & 2032 40

FIG NO. 10. Foundry Market Revenue Share, By Metal Types, 2023 & 2032 40

FIG NO. 11. Market Attractiveness Analysis, By Metal Types 41

FIG NO. 12. Incremental Revenue Growth Opportunity by Metal Types, 2024 – 2032 41

FIG NO. 13. Foundry Market Revenue, By Metal Types, 2018, 2023, 2027 & 2032 42

FIG NO. 14. India Foundry Market for Ferrous Foundries, Volume & Revenue (Unit) (USD Million) 2018 – 2032 43

FIG NO. 15. India Foundry Market for Non-Ferrous Foundries, Volume & Revenue (Unit) (USD Million) 2018 – 2032 44

FIG NO. 16. Foundry Market Volume Share, By Casting Processes, 2023 & 2032 46

FIG NO. 17. Foundry Market Revenue Share, By Casting Processes, 2023 & 2032 46

FIG NO. 18. Market Attractiveness Analysis, By Casting Processes 47

FIG NO. 19. Incremental Revenue Growth Opportunity by Casting Processes, 2024 – 2032 47

FIG NO. 20. Foundry Market Revenue, By Casting Processes, 2018, 2023, 2027 & 2032 48

FIG NO. 21. India Foundry Market for Sand Casting, Volume & Revenue (Unit) (USD Million) 2018 – 2032 49

FIG NO. 22. India Foundry Market for Investment Casting, Volume & Revenue (Unit) (USD Million) 2018 – 2032 50

FIG NO. 23. India Foundry Market for Die Casting, Volume & Revenue (Unit) (USD Million) 2018 – 2032 51

FIG NO. 24. India Foundry Market for Permanent Mold Casting, Volume & Revenue (Unit) (USD Million) 2018 – 2032 52

FIG NO. 25. Foundry Market Volume Share, By Application, 2023 & 2032 54

FIG NO. 26. Foundry Market Revenue Share, By Application, 2023 & 2032 54

FIG NO. 27. Market Attractiveness Analysis, By Application 55

FIG NO. 28. Incremental Revenue Growth Opportunity by Application, 2024 – 2032 55

FIG NO. 29. Foundry Market Revenue, By Application, 2018, 2023, 2027 & 2032 56

FIG NO. 30. India Foundry Market for Automotive, Volume & Revenue (Unit) (USD Million) 2018 – 2032 57

FIG NO. 31. India Foundry Market for Aerospace, Volume & Revenue (Unit) (USD Million) 2018 – 2032 58

FIG NO. 32. India Foundry Market for Construction & Infrastructure, Volume & Revenue (Unit) (USD Million) 2018 – 2032 59

FIG NO. 33. India Foundry Market for Energy, Volume & Revenue (Unit) (USD Million) 2018 – 2032 60

FIG NO. 34. Foundry Market Volume Share, By Foundry Size and Scale, 2023 & 2032 62

FIG NO. 35. Foundry Market Revenue Share, By Foundry Size and Scale, 2023 & 2032 62

FIG NO. 36. Market Attractiveness Analysis, By Foundry Size and Scale 63

FIG NO. 37. Incremental Revenue Growth Opportunity by Foundry Size and Scale, 2024 – 2032 63

FIG NO. 38. Foundry Market Revenue, By Foundry Size and Scale, 2018, 2023, 2027 & 2032 64

FIG NO. 39. India Foundry Market for Large Foundries, Volume & Revenue (Unit) (USD Million) 2018 – 2032 65

FIG NO. 40. India Foundry Market for Small & Medium Sized Foundries, Volume & Revenue (Unit) (USD Million) 2018 – 2032 66


List of Tables

TABLE NO. 1. : India Foundry Market: Snapshot 20

TABLE NO. 2. : Drivers for the Foundry Market: Impact Analysis 25

TABLE NO. 3. : Restraints for the Foundry Market: Impact Analysis 27

TABLE NO. 4. : India Foundry Market Volume, By Metal Types, 2018 – 2023 (Unit) 67

TABLE NO. 5. : India Foundry Market Volume, By Metal Types, 2024 – 2032 (Unit) 67

TABLE NO. 6. : India Foundry Market Revenue, By Metal Types, 2018 – 2023 (USD Million) 68

TABLE NO. 7. : India Foundry Market Revenue, By Metal Types, 2024 – 2032 (USD Million) 68

TABLE NO. 8. : India Foundry Market Volume, By Casting Processes, 2018 – 2023 (Unit) 69

TABLE NO. 9. : India Foundry Market Volume, By Casting Processes, 2024 – 2032 (Unit) 69

TABLE NO. 10. : India Foundry Market Revenue, By Casting Processes, 2018 – 2023 (USD Million) 70

TABLE NO. 11. : India Foundry Market Revenue, By Casting Processes, 2024 – 2032 (USD Million) 70

TABLE NO. 12. : India Foundry Market Volume, By Application, 2018 – 2023 (Unit) 71

TABLE NO. 13. : India Foundry Market Volume, By Application, 2024 – 2032 (Unit) 71

TABLE NO. 14. : India Foundry Market Revenue, By Application, 2018 – 2023 (USD Million) 72

TABLE NO. 15. : India Foundry Market Revenue, By Application, 2024 – 2032 (USD Million) 72

TABLE NO. 16. : India Foundry Market Volume, By Foundry Size and Scale, 2018 – 2023 (Unit) 73

TABLE NO. 17. : India Foundry Market Volume, By Foundry Size and Scale, 2024 – 2032 (Unit) 73

TABLE NO. 18. : India Foundry Market Revenue, By Foundry Size and Scale, 2018 – 2023 (USD Million) 74

TABLE NO. 19. : India Foundry Market Revenue, By Foundry Size and Scale, 2024 – 2032 (USD Million) 74


Request Free Sample

We prioritize the confidentiality and security of your data. Our promise: your information remains private.

Ready to Transform Data into Decisions?

Request Your Sample Report and Start Your Journey of Informed Choices


Providing the strategic compass for industry titans.

cr-clients-logos

Frequently Asked Questions

What was the India Foundry Market size in 2023, and what are the projections for 2032 including the CAGR?

The India Foundry Market stood at USD 1,753.70 million in 2024 and is projected to reach USD 2,800.83 million by 2032. These figures reflect steady expansion driven by industrial and automotive demand across major regions.

At what Compound Annual Growth Rate is the India Foundry Market projected to grow between 2024 and 2032?

The India Foundry Market is set to grow at a CAGR of 6.03% during the forecast period. This growth reflects strong momentum from infrastructure, automotive, and engineering sectors.

What factors drive growth in the India Foundry Market?

Robust vehicle production and infrastructure projects fuel demand for cast components. Government incentives under Make in India and PLI schemes encourage capacity expansion and technology upgrades.

Which regions dominate foundry output in India?

Gujarat and Maharashtra concentrate iron and aluminum castings for automotive and energy sectors. Tamil Nadu and Karnataka specialize in precision investment castings for aerospace and heavy machinery.

Who are the key players in the India Foundry Market?

Major firms such as Jayaswal Neco Industries, Electrosteel Castings, Texmaco Castings & Tyres, and Mantena Foundries drive innovation and maintain quality standards.

About Author

Ganesh Chandwade

Ganesh Chandwade

Senior Industry Consultant

Ganesh is a senior industry consultant specializing in heavy industries and advanced materials.

View Profile

Related Reports

Recycled Metal Market

The Recycled Metal Market reached USD 72,329.5 million in 2024. The sector is projected to hit USD 119,705.01 million by 2032, reflecting a CAGR of 6.5% during the forecast period.

South Korea Flexible Copper Clad Laminate (FCCL) Market

The South Korea Flexible Copper Clad Laminate (FCCL) Market size was valued at USD 112.16 million in 2018, increased to USD 201.49 million in 2024, and is anticipated to reach USD 472.69 million by 2032, at a CAGR of 10.48% during the forecast period.

Welding Consumables Market

The Welding Consumables market size was valued at USD 17.85 billion in 2024 and is anticipated to reach USD 26.98 billion by 2032, growing at a CAGR of 5.3% during the forecast period.

Mining Equipment Market

Mining Equipment Market size was valued at USD  116.67  Billion in 2024 and is anticipated to reach USD  175.55  Billion by 2032, at a CAGR of 5.24 % during the forecast period.

Mining Drill Bits Market

The Mining Drill Bits Market is projected to grow from USD 1,859.8 million in 2024 to an estimated USD 2,574.78 million by 2032, with a compound annual growth rate (CAGR) of 4.15% from 2024 to 2032.

Activated Charcoal Market

Activated Charcoal Market size was valued USD 4.48 billion in 2024 and is anticipated to reach USD 7.3 billion by 2032, at a CAGR of 6.3% during the forecast period.

CEMAC Steel Market

CEMAC steel market size was valued at USD 5.9 billion in 2024 and is anticipated to reach USD 8.38 billion by 2032, growing at a CAGR of 4.5% during the forecast period.

Foundry Market

The Global Foundry Market size was valued at USD 123,600 million in 2018 to USD 146,781.49 million in 2024 and is anticipated to reach USD 238,346.09 million by 2032, at a CAGR of 6.35% during the forecast period.

Steel Wear Liner Market

The Steel Wear Liner Market size was valued at USD 359.42 million in 2024 and is anticipated to reach USD 491.9 million by 2032, at a CAGR of 4% during the forecast period.

Secondary Aluminum Alloys Market

Secondary Aluminum Alloys Market size was valued at USD 95.71 Billion in 2024 and is anticipated to reach USD 142.48 Billion by 2032, at a CAGR of 5.1% during the forecast period.

Aluminium Window System Market

Aluminium Window System Market size was valued USD 111.62 billion in 2024 and is anticipated to reach USD 146.3 billion by 2032, at a CAGR of 3.44% during the forecast period.

Scandium Metal Market

The global demand for the Scandium Metal Market was valued at USD 611.95 Million in 2024 is expected to reach USD 1,205.89 Million in 2032 growing at a CAGR of 8.70% between 2025 and 2032.

Licence Option

The report comes as a view-only PDF document, optimized for individual clients. This version is recommended for personal digital use and does not allow printing. Use restricted to one purchaser only.
$2999

To meet the needs of modern corporate teams, our report comes in two formats: a printable PDF and a data-rich Excel sheet. This package is optimized for internal analysis. Unlimited users allowed within one corporate location (e.g., regional office).
$4999

The report will be delivered in printable PDF format along with the report’s data Excel sheet. This license offers 100 Free Analyst hours where the client can utilize Credence Research Inc. research team. Permitted for unlimited global use by all users within the purchasing corporation, such as all employees of a single company.
$8999

Report delivery within 24 to 48 hours

Europe

North America

Email

Smallform of Sample request
User Review

Thank you for the data! The numbers are exactly what we asked for and what we need to build our business case.

Materials Scientist
(privacy requested)

User Review

The report was an excellent overview of the Industrial Burners market. This report does a great job of breaking everything down into manageable chunks.

Imre Hof
Management Assistant, Bekaert

cr-clients-logos

Request Sample