
Autonomous fleets and hazard rules push mines toward AI
The Australia AI in mining safety and monitoring market was valued at USD 84.5 million in 2025 and is projected to increase from USD 108.0 million in 2026 to USD 573.9 million by 2035, registering a CAGR of 20.39% during 2026–2035. Demand comes from iron ore, coal, gold and base metal operators that use machine vision, wearables, sensor analytics and autonomous fleet controls to prevent vehicle collisions, fatigue events and gas or ground incidents. New South Wales held the largest state share, 44.3% in 2025, because its regulator oversees a dense base of coal and extractives sites with strict principal hazard duties. Western Australia is the fastest-growing state at 20.83% a year, as Pilbara iron ore fleets add autonomous trucks and drills. However, the technology setting has shifted quickly, because Komatsu put its 500th autonomous haul truck to work in Australia in 2025 and Caterpillar renewed its autonomy deal with Fortescue in March 2026.
Which mine safety AI tools and buyers does the estimate cover?
The estimate measures spending on safety software platforms, embedded AI systems and AI safety services bought by Australian mine operators. It covers worker safety, equipment safety, environmental monitoring and safety mapping uses at surface and underground mines run by large, mid-sized and small operators.
The estimate excludes the base price of haul trucks, drills and loaders, general fleet dispatch software and conventional gas detectors sold without analytics. The value chain runs from equipment makers and software developers through system integrators and service firms to the mine operators that deploy and run these tools.
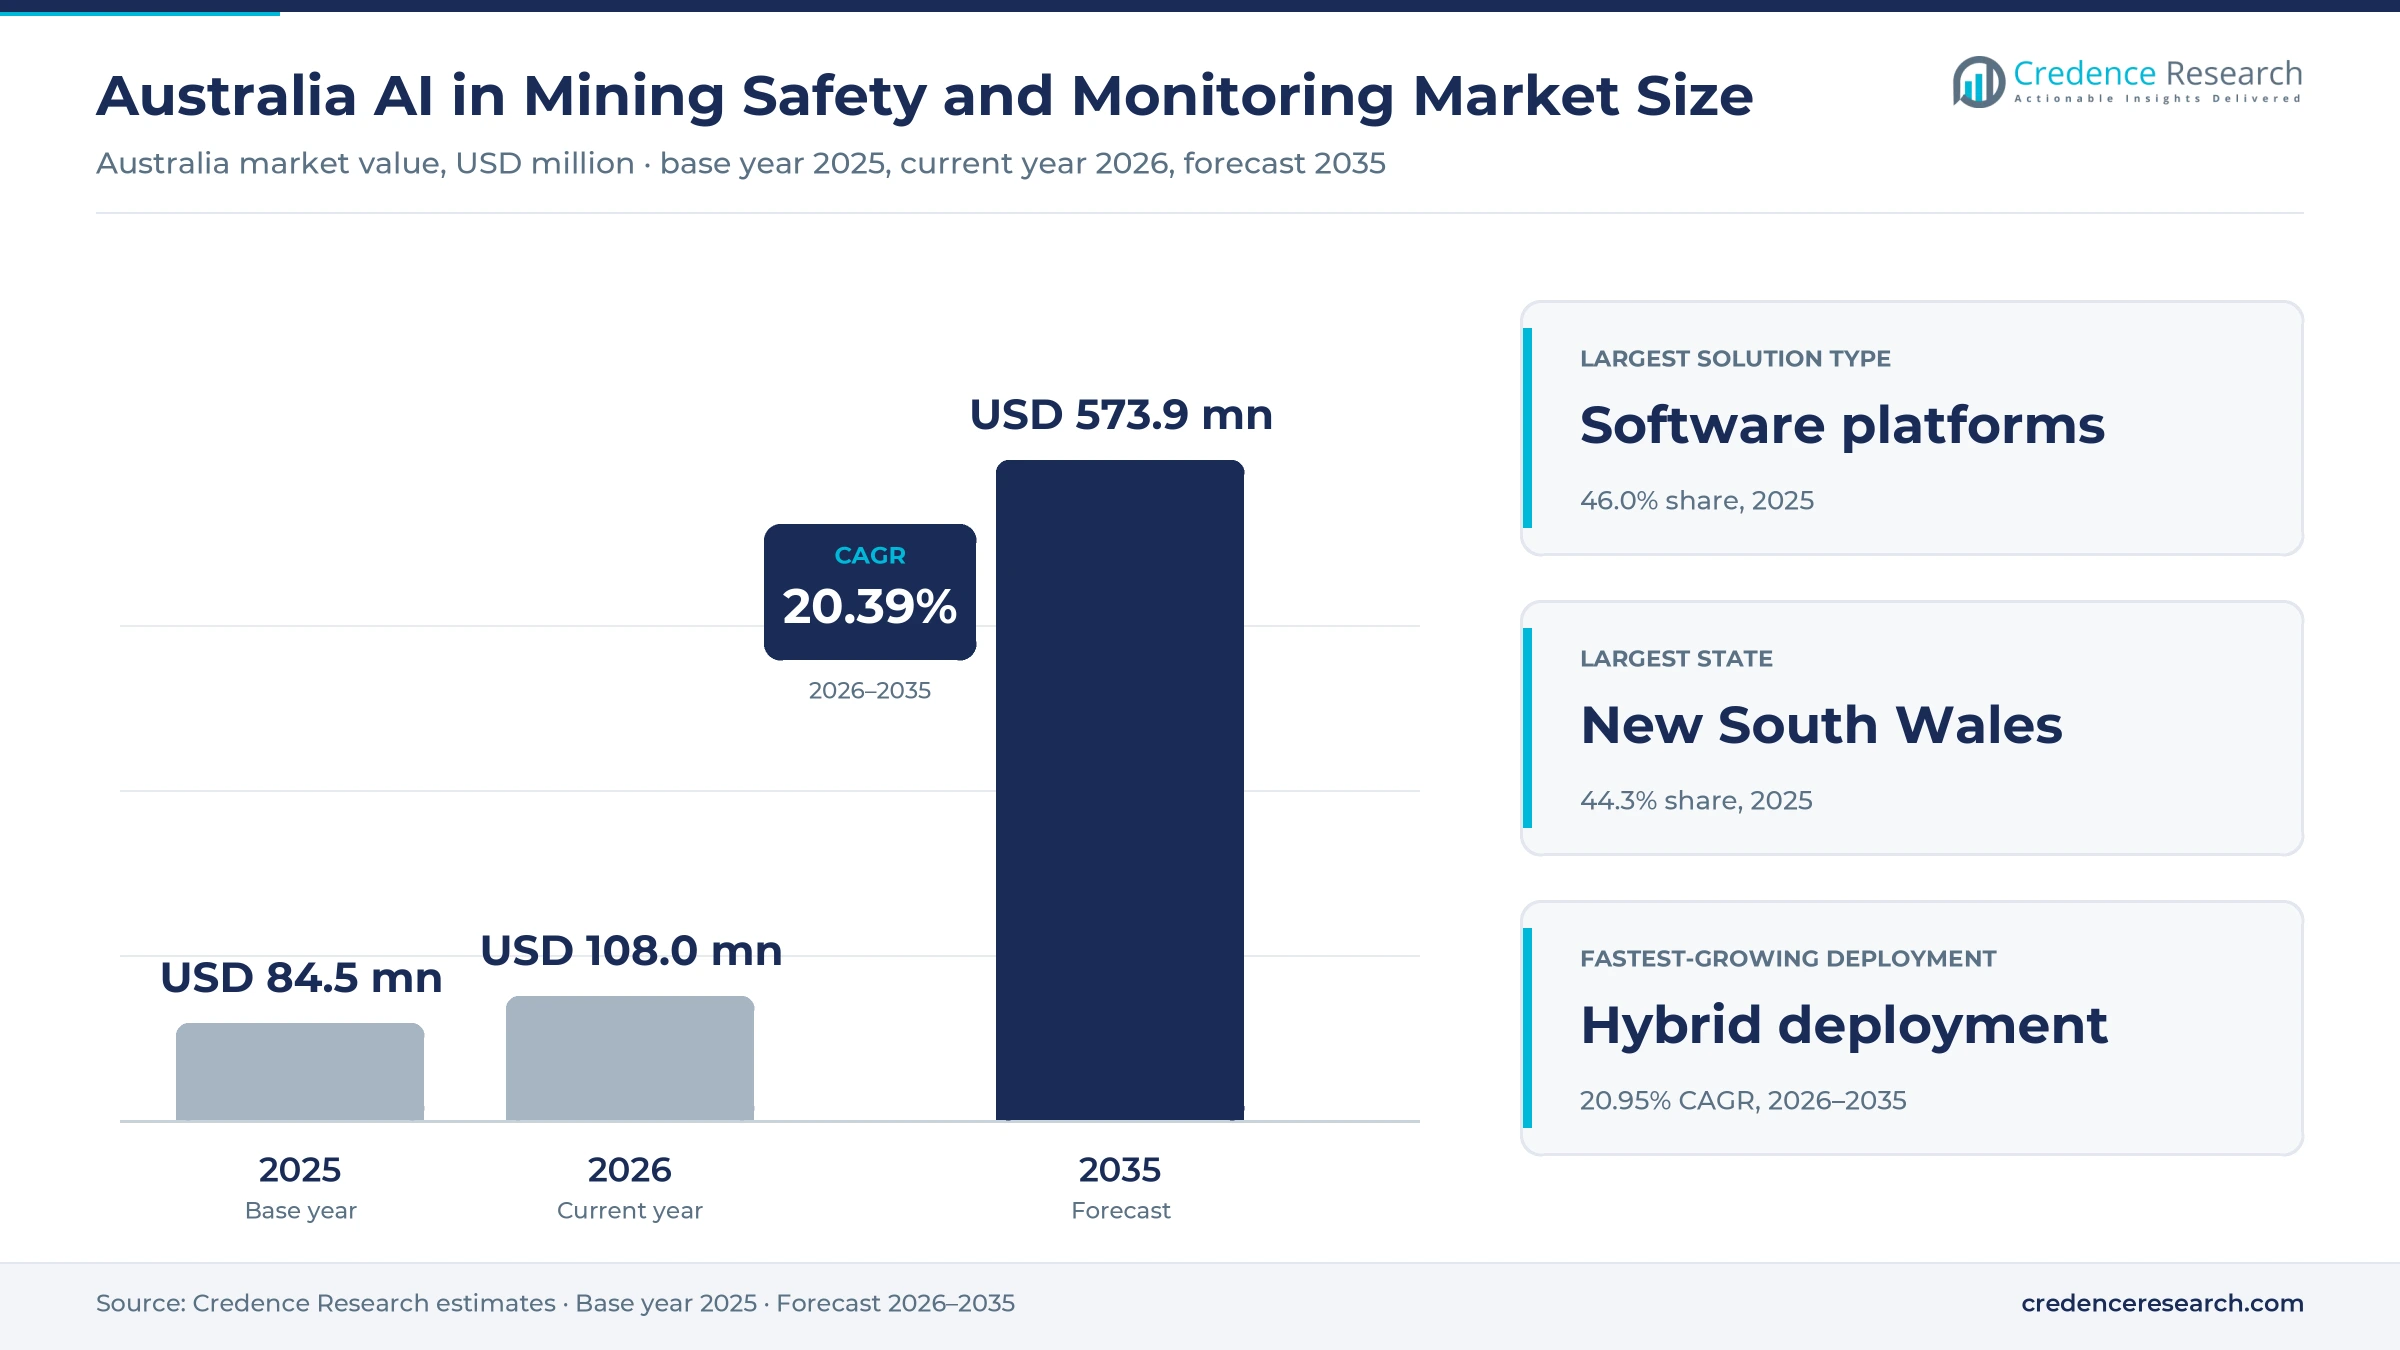
Australia AI in Mining Safety and Monitoring Market Insights
- The Australia AI in mining safety and monitoring market was valued at USD 84.5 million in 2025 and is projected to reach USD 573.9 million by 2035, registering a CAGR of 20.39% during 2026–2035.
- New South Wales held a 44.3% share of 2025 value, because its regulator oversaw 94 active coal mines and 2,032 extractives sites in late 2025.
- Safety software platforms led with a 46.0% share of 2025 value, because operators centralize alerts from cameras, wearables and fleet systems on one screen.
- Komatsu reported its 500th autonomous haul truck operating in Australia in September 2025, which shows how far driverless fleets have spread since their 2008 debut.
- Hybrid deployment grows fastest at 20.95% a year during 2026–2035, as mines pair onboard processing with cloud analytics for incident review.
Software platforms lead as hybrid systems grow fastest
Why do safety software platforms hold the largest value?
Based on solution type, the market is categorized into safety software platforms, embedded AI systems and AI safety services. Safety Software Platforms led with a 46.0% share of 2025 value, because operators want one control layer that combines alerts from cameras, wearables and fleet systems. Safety Software Platforms grow fastest at 20.80% a year, as subscription analytics spread from large miners to mid-sized sites.
How does equipment safety AI anchor application demand?
Based on application, the market is categorized into worker safety AI, equipment safety AI, environmental monitoring AI and safety intelligence and mapping. Equipment Safety AI led with a 38.0% share of 2025 value, because collision avoidance and autonomous fleet controls protect the costliest assets on site. Safety Intelligence and Mapping grows fastest at 21.33% a year, as lidar drones map stopes and voids that people cannot safely enter.
Why are hybrid deployments gaining on edge systems?
Based on deployment model, the market is categorized into edge deployment, cloud deployment and hybrid deployment. Edge Deployment led with a 48.0% share of 2025 value, because fatigue and collision alerts must fire inside the cab without waiting for remote networks. Hybrid Deployment grows fastest at 20.95% a year, as mines send onboard event data to cloud platforms for trend analysis.
Why does coal remain the largest end-use buyer?
Based on end-use industry, the market is categorized into iron ore mining, coal mining, gold mining and base and critical mineral mining. Coal Mining led with a 38.0% share of 2025 value, because coal sites face gas, fire and vehicle hazards across New South Wales and Queensland. Base and Critical Mineral Mining grows fastest at 21.50% a year, as new lithium, nickel and rare earth projects build safety systems from the start.
| Segment Group | Leading Sub-segment | Share, 2025 | Fastest-growing Sub-segment | CAGR, 2026–2035 |
|---|---|---|---|---|
| By Solution Type | Safety Software Platforms | 46.0% | Safety Software Platforms | 20.80% |
| By Application | Equipment Safety AI | 38.0% | Safety Intelligence and Mapping | 21.33% |
| By Deployment Model | Edge Deployment | 48.0% | Hybrid Deployment | 20.95% |
| By End-Use Industry | Coal Mining | 38.0% | Base and Critical Mineral Mining | 21.50% |
Request a Free Sample
Fill in your details and we'll send you a free sample report.
- Sample data tables & charts
- Research methodology
Fleet integration, fatigue detection and hazard duties
How does fleet safety integration lift AI spending?
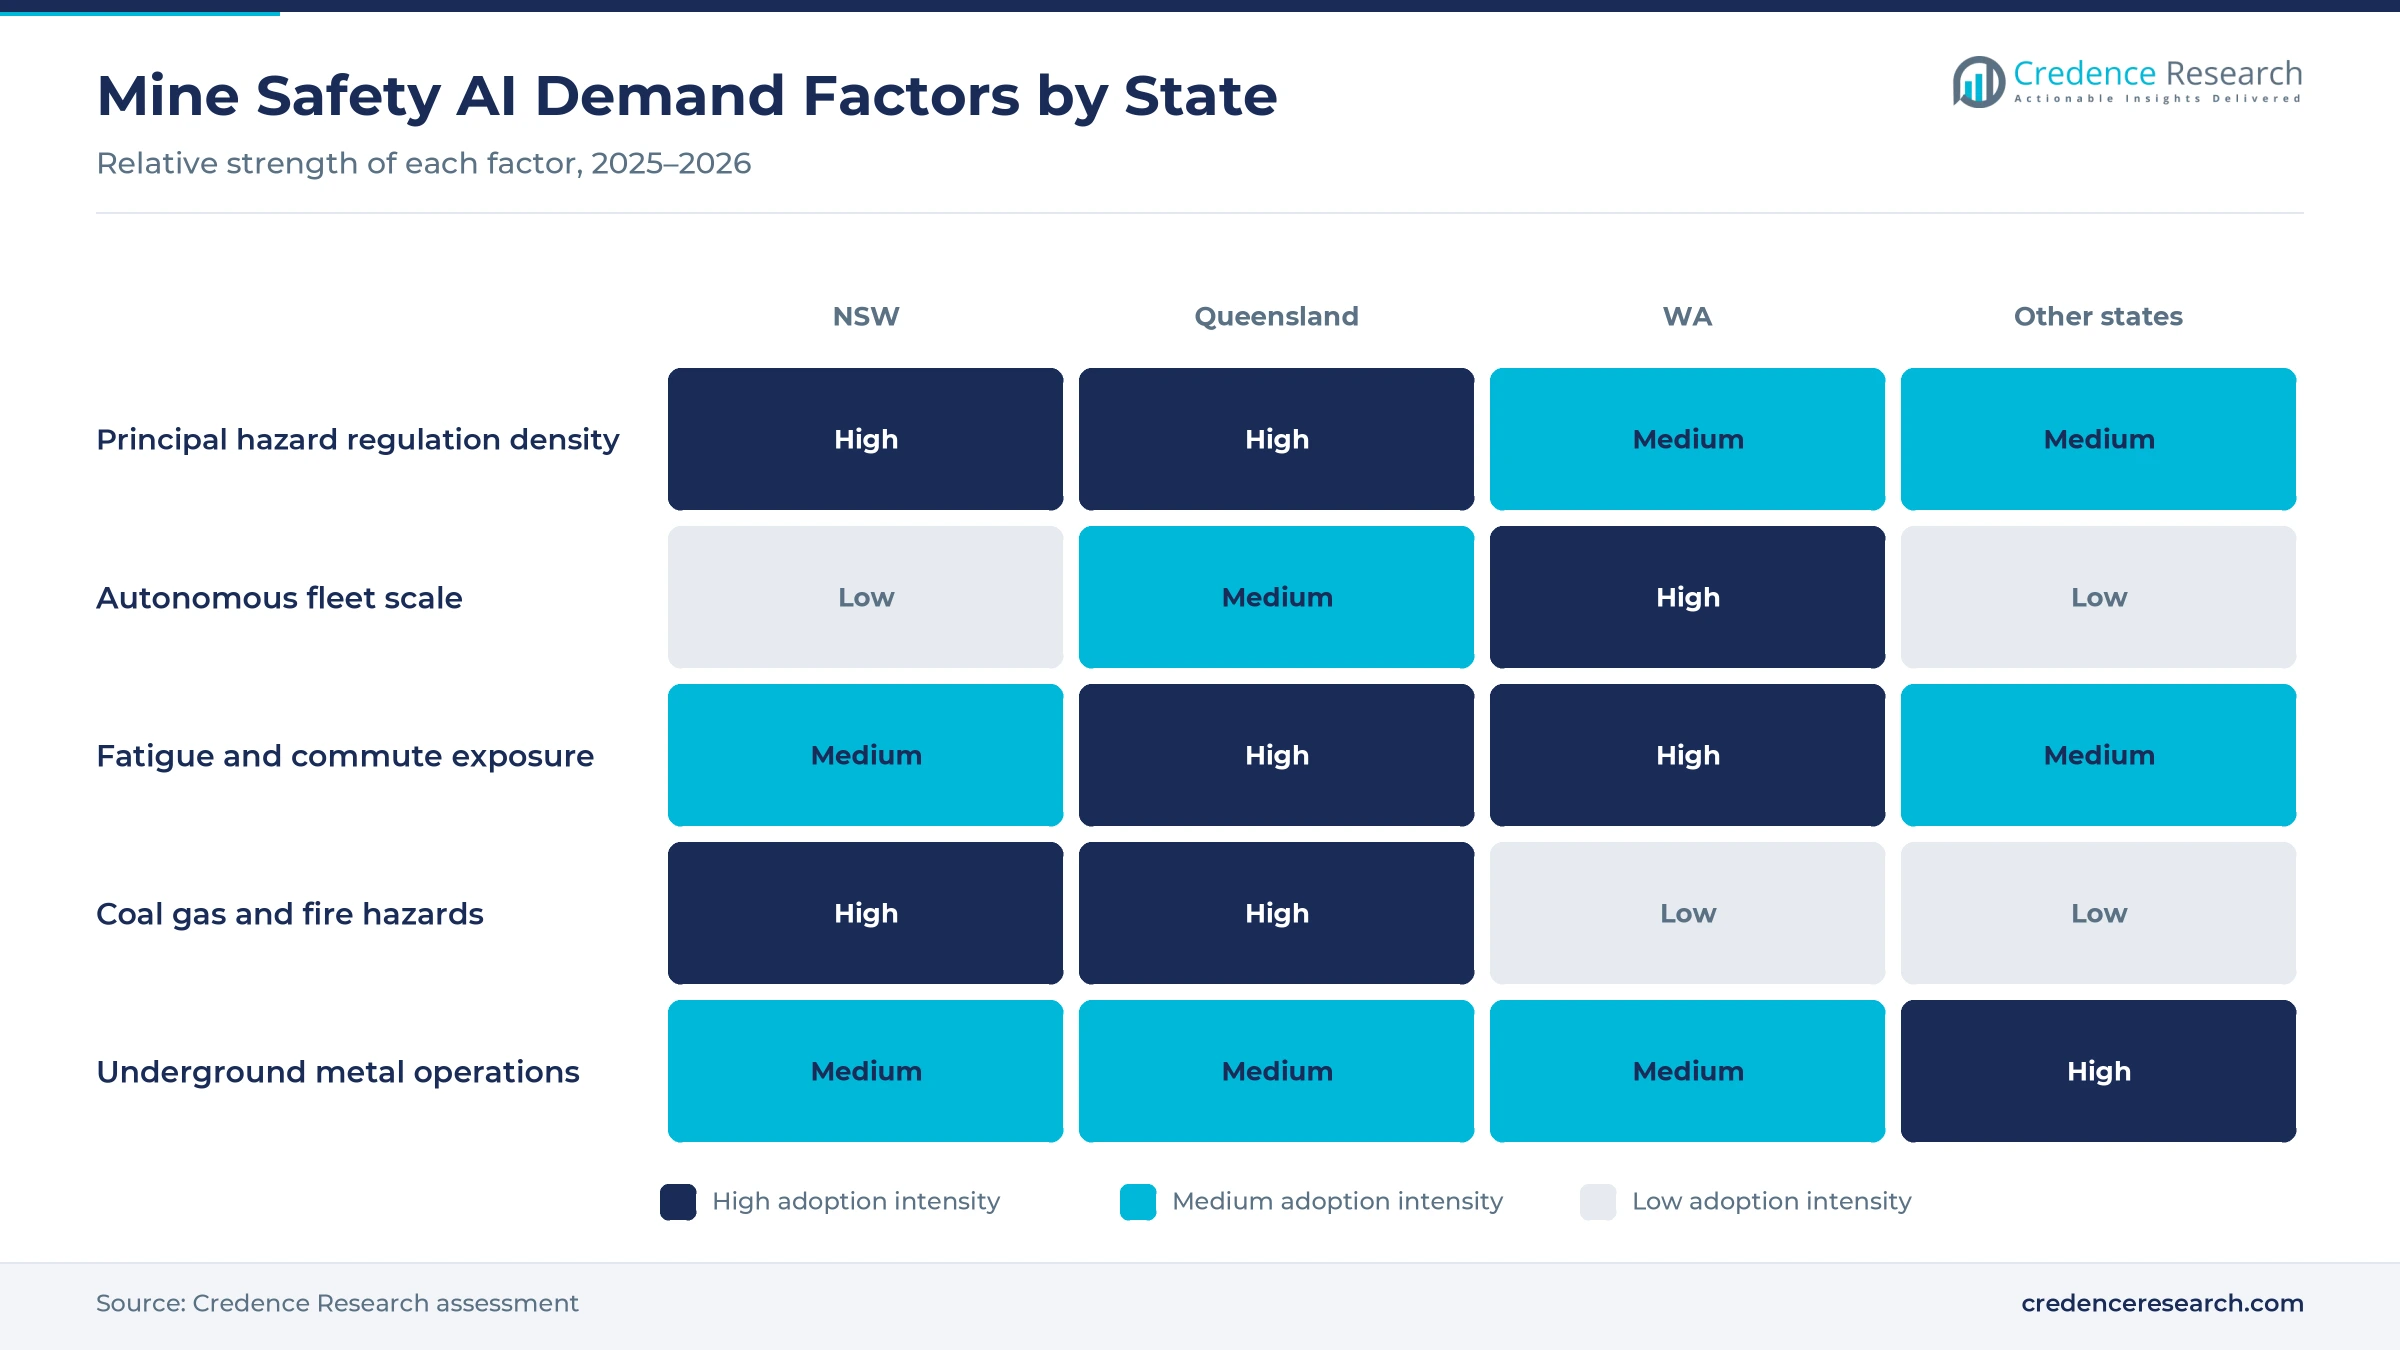
Autonomous and crewed machines now share the same haul roads, so operators must link collision avoidance, dispatch and machine controls into one safety system. Komatsu reported in September 2025 that its 500th autonomous haul truck had started work in Western Australia, after first introducing the system to Australia in 2008. Caterpillar extended its agreement with Fortescue on March 23, 2026, to keep running Cat MineStar Command for hauling at three Western Australian operations. The NSW Resources Regulator named proximity detection, collision avoidance and fit-for-purpose autonomous systems as critical controls in a May 2025 fact sheet. As a result, collision avoidance and fleet controls form the core of equipment safety spending.
Why does underground fatigue monitoring raise demand?
Long rosters, night shifts and long commutes leave many mine workers tired, and underground truck operators work in dark, confined roadways where a microsleep can be fatal. MMG partnered with Hexagon in 2023 to apply the Operator Alertness System to underground trucks at its Rosebery mine in Tasmania, the first such use in Australia. The Bowen Basin resource workforce reached about 47,530 people in June 2025, and 55% lived outside the area where they worked, according to the Queensland Government Statistician's Office. Brisbane-based SmartCap also had more than 5,000 users of its fatigue wearable worldwide in 2021. In turn, fatigue cameras and wearables are spreading from surface fleets to underground trucks and light vehicles.
How do documented risk-control obligations push adoption?
State mine safety laws require operators to identify each principal hazard, document its critical controls and prove those controls work, which favors systems that record evidence automatically. Western Australian regulations 627 to 629 under the Work Health and Safety (Mines) Regulations 2022 require a management plan for each principal mining hazard, including roads where mobile plant operate. The NSW Resources Regulator received 501 incident notifications in the December quarter of 2025, including 61 linked to roads or vehicle operating areas. Resources Safety and Health Queensland issued a safety alert on Nov. 6, 2025, after a worker was trapped by a reversing vehicle. As a result, operators favor software that logs each control check automatically.
Why does the economic weight of mining support budgets?
Mining carries a large share of national exports and capital spending, so even small safety gains protect large production values and keep operators investing. Ores and metals made up 34.6% of Australian merchandise exports in 2025, according to World Bank data. The Western Australian government reported that mining capital spending in the state rose 1.4% to A$33.5 billion in the year to the September quarter of 2025, or 62.1% of the national mining total. Mining also employed about 314,500 people nationwide in February 2026, according to Jobs and Skills Australia. In turn, large production values give operators strong reasons to fund systems that protect output.
Edge autonomy, drive-through inspection and mine mapping
How is the shift to onboard autonomy changing safety tools?
Safety systems are moving onto the machine itself, so drones and vehicles can decide where to go in places without GPS or reliable networks. Emesent raised A$25 million on July 8, 2026, including A$10 million in venture debt from the National Reconstruction Fund Corporation, to scale its Cortex AI onboard autonomy software. The Brisbane company said its Hovermap system was deployed at more than 200 mine sites worldwide, with clients in more than 40 countries. Epiroc won its largest order ever in April 2025 to supply autonomous, electric drill rigs for Fortescue mines in the Pilbara. As a result, edge deployment holds 48.0% of 2025 value.
Why is the rise of drive-through machine inspection notable?
Operators want to catch brake, tire and heat faults before a truck enters the haul road, without stopping it for a manual walkaround. Pitcrew AI builds inspection stations that combine thermal cameras, visual cameras, edge computing and computer vision to check each vehicle at normal operating speed, according to the Department of Industry, Science and Resources AI directory. The company designs its systems in Australia and lists operations in New South Wales and Western Australia. MaxMine expanded into fleet management on July 24, 2026, and said its platform tracks 580 million metric tons of material each year. In turn, inspection data feeds the safety software platforms that hold 46.0% of 2025 value.
Can critical minerals projects open a new safety opportunity?
New critical minerals mines and processing plants can install AI safety systems at the design stage, which is cheaper than retrofitting older sites. The federal Critical Minerals Production Tax Incentive will offer a 10% refundable tax offset on eligible processing spending from July 1, 2027, to June 30, 2040, according to the Department of Industry, Science and Resources. Each project can claim the offset for up to 10 years, which supports long-term investment in new operations. Many such projects also use underground automation from the start. As a result, base and critical mineral mining grows fastest at 21.50% a year during 2026–2035.
Is there room to grow in gold and mid-tier mine upgrades?
High gold prices are giving mid-tier operators cash to modernize older underground fleets, where many safety systems still rely on manual checks. The average monthly gold price reached US$4,087 a troy ounce in November 2025, 54.2% above a year earlier, according to the Western Australian government. Western Australia's mining sector also logged 269.7 million hours worked and 569 lost time injuries in 2023–24, according to WorkSafe Western Australia. Many mid-tier sites are now buying autonomous haulage systems and fatigue tools together. In turn, gold mining is expected to add safety projects faster than iron ore over the forecast period.
Connectivity, data trust and legacy fleets slow adoption
How does patchy connectivity limit AI rollouts?
Remote pits and deep underground workings often lack the fiber, private LTE or Wi-Fi coverage that cloud analytics need. As a result, operators must buy edge hardware that stores and processes data on the machine, which raises upfront cost. Vendors respond with onboard processing and delayed upload once trucks reach covered zones. This barrier is strongest for small and mid-sized operators in remote areas, because they cannot fund a full site network for a single safety system.
Why do worker trust and privacy concerns slow adoption?
Fatigue cameras and wearables collect data on the eyes, sleep and movement of individual workers, which raises questions about discipline and privacy. In turn, unions and crews may resist systems that look like surveillance rather than protection. Operators respond by agreeing on data use rules, training crews and treating alerts as coaching events rather than breaches. This concern is sharpest at sites where workers were not consulted before a system was installed and alerts feel like a disciplinary tool.
How do mixed and older fleets complicate integration?
Many mines run trucks, dozers and light vehicles from several makers and model years, each with different data ports and control software. As a result, linking collision avoidance and autonomous controls across a whole fleet can take years of engineering and testing work. Operators respond with vendor-neutral platforms and staged upgrades tied to fleet replacement. This challenge weighs most on older coal and gold sites where many machines stay in service for more than a decade.
Why do false alarms erode the value of safety alerts?
Collision and fatigue systems that trigger too often lead operators to ignore warnings or switch devices off during busy shifts. In turn, a system that looks strong on paper can fail at the moment it matters most. Vendors respond by training models on local site data and adding human review centers that confirm alerts before escalation. This issue is most visible during new installations, where site maps, dust and lighting differ from the conditions used in testing.
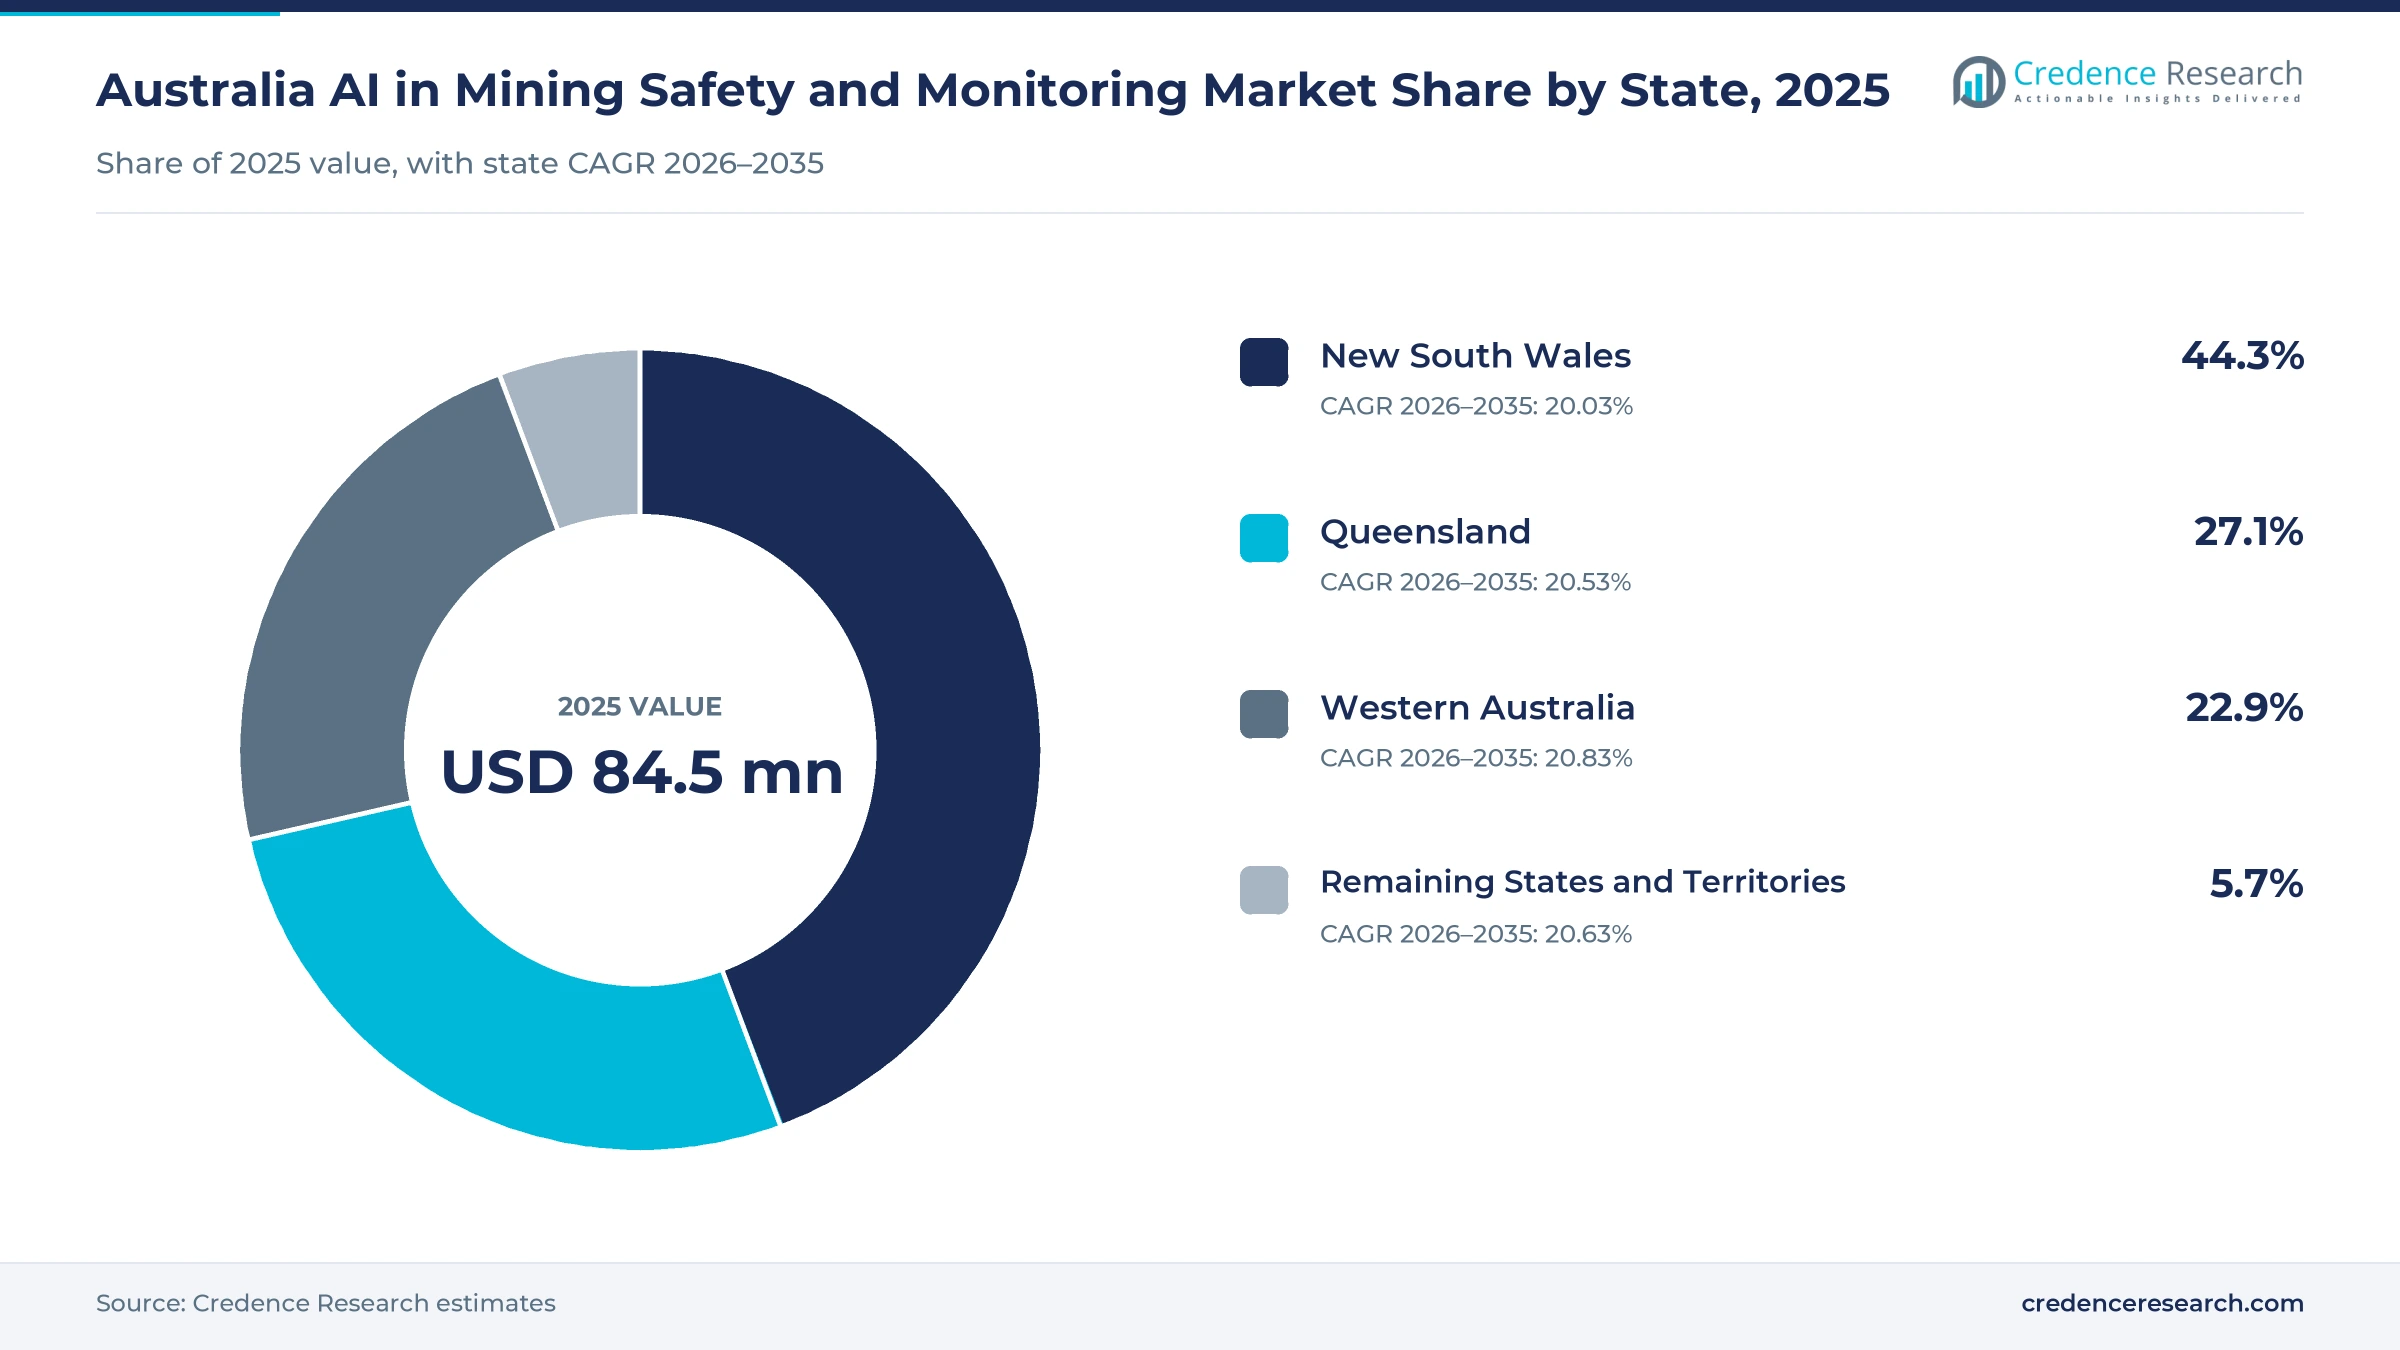
Coal rules lead in NSW as Pilbara autonomy lifts WA
| State | Value, 2025 (USD million) | Share, 2025 | CAGR, 2026–2035 |
|---|---|---|---|
| New South Wales | 37.4 | 44.3% | 20.03% |
| Queensland | 22.9 | 27.1% | 20.53% |
| Western Australia | 19.4 | 22.9% | 20.83% |
| Remaining States and Territories | 4.8 | 5.7% | 20.63% |
Dense coal and quarry regulation anchors New South Wales
New South Wales held a 44.3% share of 2025 value and grows at 20.03% a year, because its regulator oversaw 94 active coal mines and 2,032 extractives sites in the December quarter of 2025. Fire or explosion hazards drew 80 notifications that quarter, and roads or vehicle areas drew 61. The state regulator has also named proximity detection and collision avoidance as critical controls. As a result, operators buy software that documents controls across many sites.
Bowen Basin coal fleets sustain Queensland demand
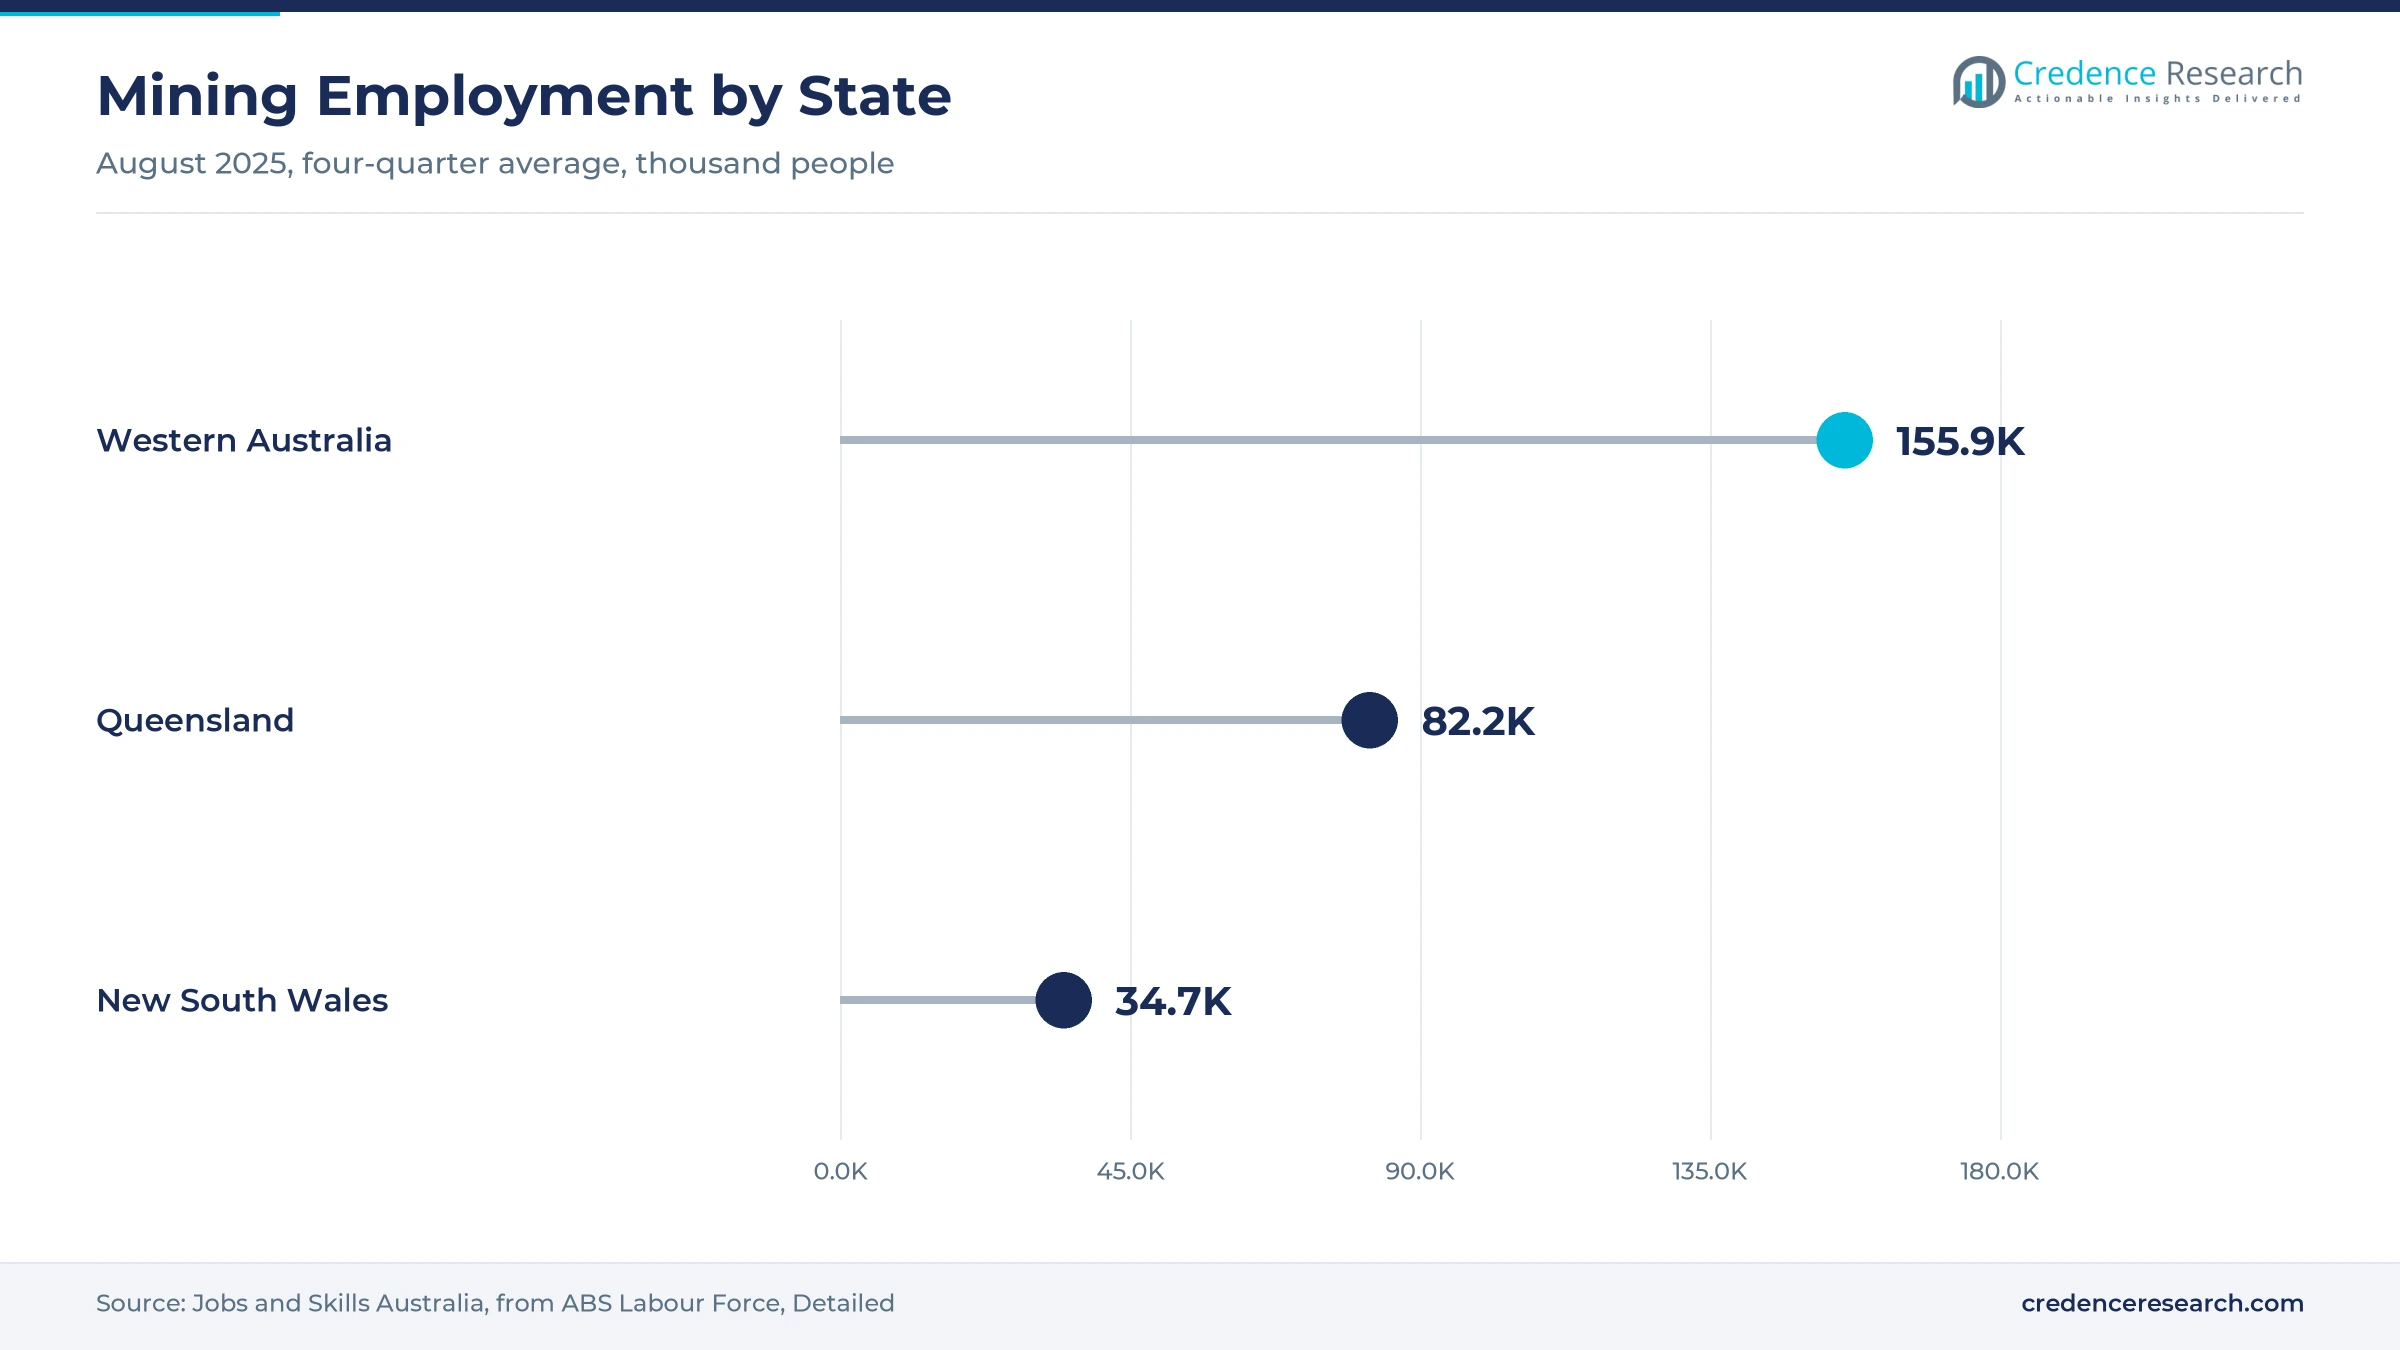
Queensland held a 27.1% share of 2025 value and grows at 20.53% a year, because mining employed about 82,200 people in the state in August 2025, according to Jobs and Skills Australia. The Bowen Basin alone had 47 operating coal mines in June 2025. At least four Queensland mine workers died in 2024, including one in a collision between a haul truck and a light vehicle at Byerwen. In turn, coal operators are funding collision and fatigue tools.
Pilbara autonomy makes Western Australia the fastest state
Western Australia held a 22.9% share of 2025 value and grows fastest at 20.83% a year, because mining employed about 155,900 people in the state in August 2025. The state also accounted for 62.1% of national mining capital spending in the year to September 2025. Fortescue is adding autonomous drills from Epiroc and extending Caterpillar autonomy at three operations. As a result, Western Australia leads the shift to integrated fleet safety.
Underground base metal mines shape the smaller states
The remaining states and territories held a 5.7% share of 2025 value and grow at 20.63% a year, because their mining bases are smaller but include deep underground base metal operations. MMG's Rosebery mine in Tasmania became the first Australian site to apply Hexagon's Operator Alertness System to underground trucks. New critical minerals projects in these regions can also claim the federal processing tax offset from July 2027. In turn, this zone adds niche but steady demand for underground safety tools.
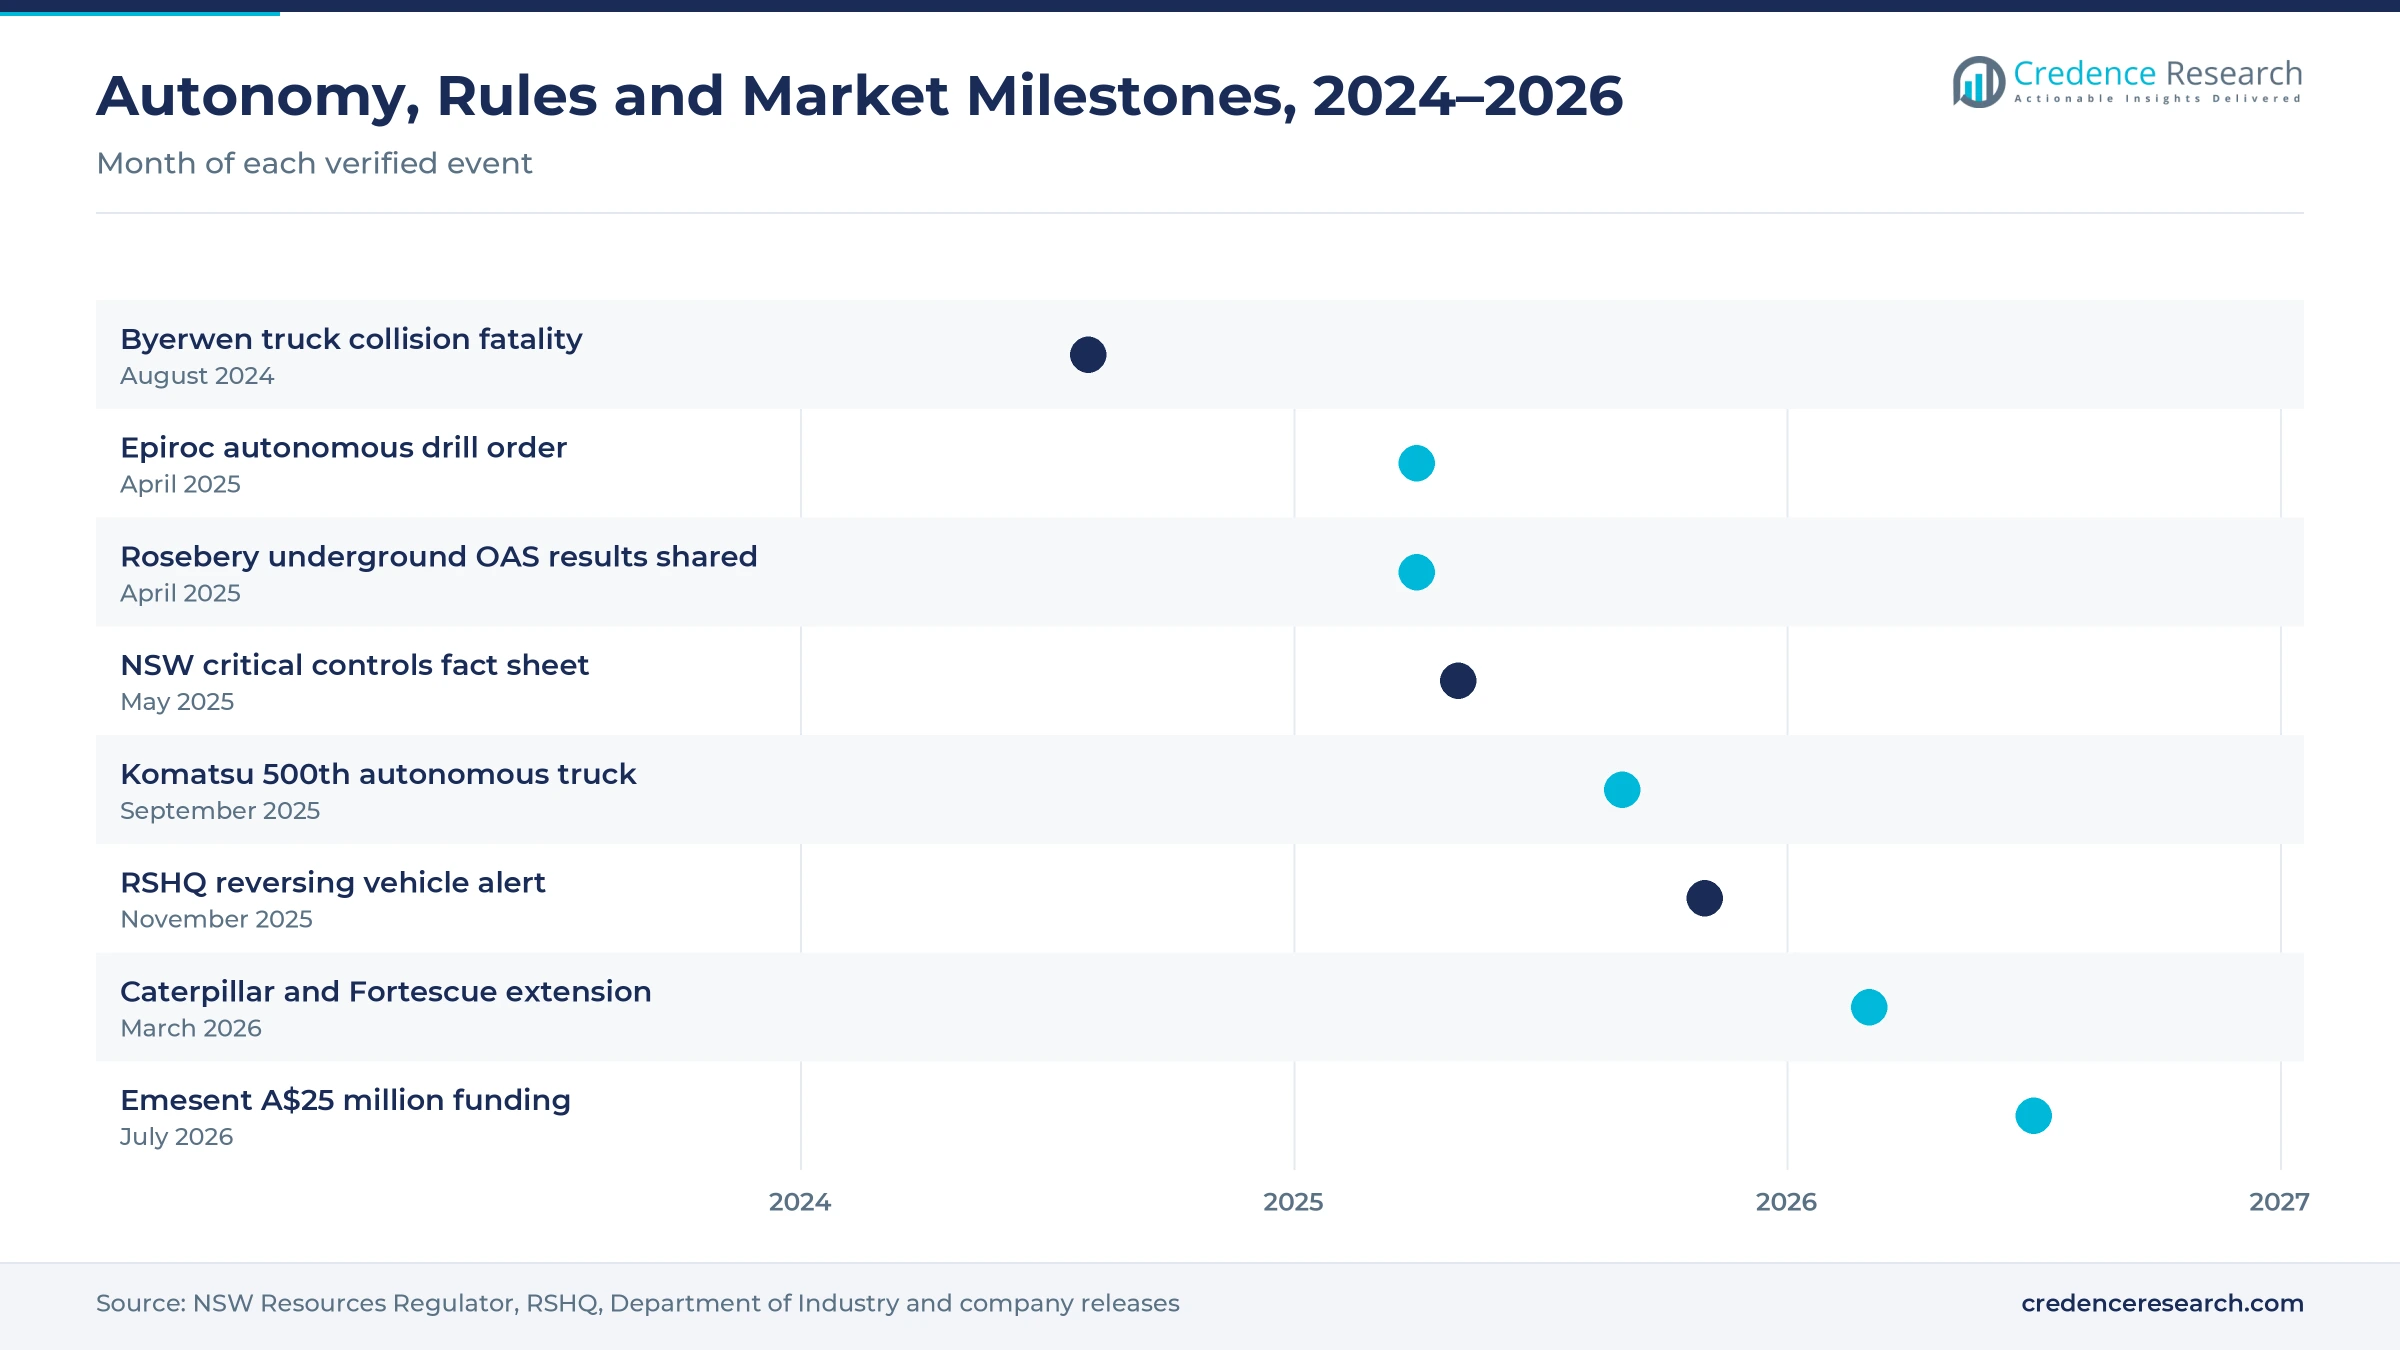
Autonomy deals, regulator alerts and funding since 2024
| Development | Status and market relevance |
|---|---|
| In August 2024, a collision between a haul truck and a light vehicle at the Byerwen coal site in Queensland killed a worker. | Raised pressure for collision avoidance in coal fleets |
| In April 2025, Epiroc won its largest order ever to supply autonomous, electric drill rigs for Fortescue mines in the Pilbara. | Extends driverless operation to drilling |
| In May 2025, the NSW Resources Regulator listed proximity detection and collision avoidance as critical controls for autonomous equipment. | Sets clear expectations for fleet safety systems |
| In March 2026, Caterpillar extended its agreement with Fortescue for Cat MineStar Command for hauling at three operations. | Keeps autonomous haulage running in Western Australia |
| In July 2026, Emesent raised A$25 million to scale its Cortex AI autonomy software and Aura cloud platform. | Backs local lidar mapping for hazardous underground areas |
Vision, wearables, lidar and fleet analytics at the face
- Driver fatigue cameras track eye closure and head position inside the cab, which lets supervisors act on microsleeps before a truck leaves the road.
- Proximity detection and collision avoidance combine GPS, radar and radio tags on machines and people, which warns or slows vehicles when they come too close.
- Lidar mapping drones fly into stopes, shafts and voids without GPS, which gives engineers 3D data on ground conditions without sending people into danger.
- Fleet safety analytics turn speed, braking and location data into risk scores, which help operators find unsafe ramps, intersections and driving habits.
Need a Custom Version of This Report?
Tailor the scope, geography, or segments to your exact requirements.
- Custom geography or segment scope
- Direct access to our analyst team
Equipment makers compete with local safety tech firms
Competition combines global equipment makers with Australian safety technology firms that sell software, sensors and services to mine operators. Komatsu and Caterpillar lead in autonomous haulage, with Komatsu reporting 500 driverless trucks in Australia and Caterpillar running hauling autonomy at three Fortescue operations. Epiroc is adding autonomous electric drill rigs in the Pilbara. Hexagon supplies operator alertness and collision avoidance systems and took its fatigue system underground at Rosebery in Tasmania. Brisbane-based Emesent and SmartCap lead in lidar mapping and fatigue wearables, while MaxMine and Pitcrew AI apply machine learning to fleet behavior and vehicle inspection. Vendors compete on fleet integration, local support, alert accuracy and proof that controls work.
Which safety technology suppliers are active in Australian mines?
| Company | Type | Role in the market |
|---|---|---|
| Komatsu | Equipment maker | Reported its 500th autonomous haul truck in Australia in 2025 |
| Caterpillar | Equipment maker | Runs MineStar Command for hauling at three Fortescue operations |
| Epiroc | Drilling equipment maker | Supplying autonomous electric drill rigs to Fortescue |
| Hexagon Mining | Safety technology provider | Operator Alertness System for underground trucks at Rosebery |
| Emesent | Lidar and autonomy developer | Hovermap deployed at more than 200 mine sites worldwide |
| SmartCap | Fatigue wearable maker | Brisbane-based fatigue monitoring wearable supplier |
| Pitcrew AI | Machine inspection developer | Drive-through thermal and visual truck inspection |
Credence Research view on AI safety tools in mines
Credence Research's view is that AI in Australian mine safety will grow quickly because autonomous fleets, fatigue risks and documented hazard duties all push operators toward systems that see and record risks in real time. Safety software platforms remain the largest solution type, while hybrid deployments grow fastest as onboard alerts feed cloud analytics. New South Wales leads on regulatory density, while Western Australia gains most from Pilbara autonomy. Suppliers that combine fleet integration, trusted fatigue tools and clear evidence for regulators should gain the most share by 2035.
How the national mine safety AI estimate was built
The report uses 2025 as the base year on a calendar basis, and market values come from the Credence Research model. That model combines mining employment and capital spending statistics, regulator incident data, mine safety legislation, export data and company releases. State shares are the client's inputs, while state growth rates and segment splits are Credence Research estimates built from mine numbers, employment and fleet automation data. Sources used are official statistics, regulator and government releases and company releases, and no interviews or surveys were used.
Autonomy and critical minerals carry growth to 2035
The Australia AI in mining safety and monitoring market is expected to reach USD 573.9 million by 2035, a 20.39% CAGR during 2026–2035, as autonomous fleets, fatigue detection and principal hazard rules keep raising safety technology budgets. Growth should be strongest in hybrid deployment, safety mapping, critical minerals projects and Western Australia, because these areas are adding new systems fastest. Patchy connectivity, worker trust and mixed fleets could slow some projects, while vendor-neutral platforms and local alert tuning help smaller operators adopt proven tools.
Frequently Asked Questions
How big is the Australia AI in mining safety and monitoring market?
Which solution type leads mine safety AI spending?
Which state leads the market?
How widespread are autonomous haul trucks in Australia?
Why is fatigue monitoring important in Australian mines?
What safety rules shape AI adoption?
Who are the leading suppliers of mine safety AI in Australia?
What are the main challenges for mine safety AI?
Table of Content
Chapter 1 Market Segmentation
- 1.1 Segmentation Framework
- 1.1.1 Product and Service Classification
- 1.1.2 Application and End-Use Classification
- 1.1.3 Technology and Solution Classification
- 1.1.4 Customer and Distribution Channel Classification
- 1.1.5 Geographic Segmentation
- 1.1.6 Market Segment Definitions and Boundaries
- 1.2 By Solution Type
- 1.2.1 Safety Software Platforms
- 1.2.2 Embedded AI Systems
- 1.2.3 AI Safety Services
- 1.3 By Application
- 1.3.1 Worker Safety AI
- 1.3.2 Equipment Safety AI
- 1.3.3 Environmental Monitoring AI
- 1.3.4 Safety Intelligence and Mapping
- 1.4 By Deployment Model
- 1.4.1 Edge Deployment
- 1.4.2 Cloud Deployment
- 1.4.3 Hybrid Deployment
- 1.5 By End-Use Industry
- 1.5.1 Iron Ore Mining
- 1.5.2 Coal Mining
- 1.5.3 Gold Mining
- 1.5.4 Base and Critical Mineral Mining
- 1.6 By State
- 1.6.1 Western Australia
- 1.6.2 Queensland
- 1.6.3 New South Wales
- 1.6.4 Remaining States and Territories
Chapter 2 Introduction
- 2.1 Report Objectives and Scope
- 2.2 Product Definition and Industry Terminology
- 2.3 Market Inclusions and Exclusions
- 2.4 Research Process
- 2.4.1 Primary Research and Expert Interviews
- 2.4.2 Secondary Research and Source Review
- 2.4.3 Top-Down and Bottom-Up Estimation
- 2.4.4 Data Triangulation and Verification
- 2.5 Market Size Measurement Basis
- 2.5.1 2025: USD 84.5 million → 2035: USD 573.9 million
- 2.6 Historical and Forecast Reference Periods
- 2.6.1 Historical Period: 2018-2025
- 2.6.2 Base Year: 2025
- 2.6.3 Forecast Period: 2025-2035
- 2.7 Research Assumptions and Limitations
Chapter 3 Executive Summary
- 3.1 Market Snapshot and Key Findings
- 3.2 Base-Year Market Size, 2025
- 3.3 Forecast Market Size, 2035
- 3.4 Revenue and Volume Growth Outlook
- 3.5 Key Demand and Supply Indicators
- 3.6 Leading Market Segments
- 3.7 Fastest-Growing Market Opportunities
- 3.8 Regional Performance Highlights
- 3.9 Technology and Industry Transformation
- 3.10 Competitive Landscape Summary
- 3.11 Analyst View and Strategic Implications
Chapter 4 Australia AI in Mining Safety and Monitoring Market Trends and Developments
- 4.1 Historical Industry Development, 2018-2025
- 4.2 Recent Market Trends and Developments
- 4.3 Demand and Customer Behavior Trends
- 4.4 Technology and Product Innovation
- 4.5 Artificial Intelligence, Automation and Digitalization
- 4.6 Local Manufacturing and Supply Chain Realignment
- 4.7 Industry Partnerships, Mergers and Acquisitions
- 4.8 Sustainability and Circular Economy Developments
- 4.9 Government and Private Sector Investment Trends
- 4.10 Emerging Business Models and Commercialization
- 4.11 Industry Developments and Announcements
Chapter 5 Australia AI in Mining Safety and Monitoring Market Production, Supply and Demand Analysis
- 5.1 Demand Trend and Consumption Analysis, 2018-2025
- 5.2 Demand Forecast, 2025-2035
- 5.3 Production and Output Trend, 2018-2025
- 5.4 Production and Output Forecast, 2025-2035
- 5.5 Installed Capacity and Capacity Utilization
- 5.6 Company-Wise Production Plants and Statistics
- 5.6.1 Installed Production Capacity
- 5.6.2 Actual Production
- 5.6.3 Planned Capacity and Expansion Targets
- 5.7 Supply Chain Structure and Procurement Trends
- 5.8 Supply-Demand Gap and Bottlenecks
- 5.9 Import Dependence and Sourcing Structure
- 5.10 Contract Manufacturing and Outsourcing
- 5.11 Regional Supply and Demand Concentration
Chapter 6 Australia AI in Mining Safety and Monitoring Market Pricing Analysis
- 6.1 Pricing Structure and Measurement
- 6.2 Historical Pricing Trends, 2018-2025
- 6.3 Pricing Outlook, 2025-2035
- 6.4 Average Selling Price and Unit Economics
- 6.5 Pricing by Product and Market Segment
- 6.6 Geographic Pricing Differences
- 6.7 Key Input, Energy, Labor and Logistics Costs
- 6.8 Contract Pricing and Purchasing Models
- 6.9 Pricing Sensitivity and Competitive Positioning
- 6.10 Price, Margin and Profitability Implications
Chapter 7 Australia AI in Mining Safety and Monitoring Market Dynamics
- 7.1 Market Growth Drivers
- 7.1.1 Demand-Side Drivers
- 7.1.2 Technology and Innovation Drivers
- 7.1.3 Infrastructure and Investment Drivers
- 7.1.4 Regulatory and Policy Drivers
- 7.2 Market Restraints
- 7.2.1 Cost and Affordability Constraints
- 7.2.2 Technology and Adoption Barriers
- 7.2.3 Supply Chain and Operational Constraints
- 7.3 Market Challenges
- 7.3.1 Competitive Pressure and Margin Erosion
- 7.3.2 Skills, Infrastructure and Implementation Gaps
- 7.4 Emerging Market Opportunities
- 7.5 Market Dynamics Impact and Time-Horizon Assessment
Chapter 8 Australia AI in Mining Safety and Monitoring Value Chain Analysis
- 8.1 Industry Value Chain Overview
- 8.2 Upstream Suppliers and Critical Inputs
- 8.3 Technology and Component Providers
- 8.4 Manufacturing or Service Delivery
- 8.5 Distribution, Channel Partners and Integrators
- 8.6 Downstream Applications and End Users
- 8.7 Value Addition and Profit Pools
- 8.8 Vertical Integration and Outsourcing
- 8.9 Supplier Concentration and Risk
- 8.10 Supply Chain Localization and Resilience
Chapter 9 Australia AI in Mining Safety and Monitoring Market Regulations and Policies
- 9.1 Relevant Laws, Standards and Compliance Frameworks
- 9.2 Product, Service, Safety and Quality Requirements
- 9.3 Government Policies, Incentives and Subsidies
- 9.4 Imports, Exports and Trade Barriers
- 9.5 Public Procurement and Local Content Requirements
- 9.6 Environmental and Sustainability Compliance
- 9.7 Upcoming Policy Changes and Market Implications
Chapter 10 Australia AI in Mining Safety and Monitoring Market Hotspots and Opportunities
- 10.1 Market Opportunity Mapping and Growth Hotspots
- 10.2 High-Growth Applications and Customer Groups
- 10.3 Underserved Markets and White-Space Opportunities
- 10.4 Emerging Technology and Product Opportunities
- 10.5 New Capacity and Investment Hotspots
- 10.6 Market Entry and Expansion Opportunities
- 10.7 Distribution and Partnership Opportunities
- 10.8 Near-Term and Long-Term Commercial Potential
- 10.9 Opportunity Attractiveness and Execution Risks
Chapter 11 Australia AI in Mining Safety and Monitoring Market Outlook, 2025-2035
- 11.1 Market Size and Analysis
- 11.1.1 Revenue (Market Measurement: 2025: USD 84.5 million → 2035: USD 573.9 million)
- 11.1.2 Market Volume and Quantity Sold
- 11.1.3 Historical Market Size, 2018-2025
- 11.1.4 Base-Year Market Size, 2025
- 11.2 Market Forecast, 2025-2035
- 11.2.1 Revenue Forecast to 2035
- 11.2.2 Volume Forecast to 2035
- 11.2.3 CAGR and Year-on-Year Growth
- 11.2.4 Incremental Revenue Opportunity
- 11.3 Forecast Assumptions and Scenario Analysis
- 11.3.1 Base-Case Forecast
- 11.3.2 Optimistic and Conservative Scenarios
- 11.3.3 Technology, Pricing and Policy Sensitivities
- 11.4 Market Attractiveness and Growth Outlook
Chapter 12 Australia AI in Mining Safety and Monitoring Market Segmentation and Outlook
- 12.1 Segmentation Summary and Market Shares, 2025
- 12.2 Largest and Fastest-Growing Segments
- 12.3 By Solution Type - Market Size and Forecast, 2025-2035
- 12.3.1 Segment Definition and Scope
- 12.3.2 Historical Market Size, 2018-2025
- 12.3.3 Revenue Forecast, 2025-2035
- 12.3.4 Volume Forecast, 2025-2035
- 12.3.5 Base-Year Market Share, 2025
- 12.3.6 Segment CAGR and Growth Drivers
- 12.3.7 Subsegment Market Size and Forecast
- 12.3.7.1 Safety Software Platforms
- 12.3.7.2 Embedded AI Systems
- 12.3.7.3 AI Safety Services
- 12.3.8 Subsegment Pricing and Adoption Trends
- 12.3.9 Leading Suppliers and Competition
- 12.3.10 Regional Demand and Opportunities
- 12.4 By Application - Market Size and Forecast, 2025-2035
- 12.4.1 Segment Definition and Scope
- 12.4.2 Historical Market Size, 2018-2025
- 12.4.3 Revenue Forecast, 2025-2035
- 12.4.4 Volume Forecast, 2025-2035
- 12.4.5 Base-Year Market Share, 2025
- 12.4.6 Segment CAGR and Growth Drivers
- 12.4.7 Subsegment Market Size and Forecast
- 12.4.7.1 Worker Safety AI
- 12.4.7.2 Equipment Safety AI
- 12.4.7.3 Environmental Monitoring AI
- 12.4.7.4 Safety Intelligence and Mapping
- 12.4.8 Subsegment Pricing and Adoption Trends
- 12.4.9 Leading Suppliers and Competition
- 12.4.10 Regional Demand and Opportunities
- 12.5 By Deployment Model - Market Size and Forecast, 2025-2035
- 12.5.1 Segment Definition and Scope
- 12.5.2 Historical Market Size, 2018-2025
- 12.5.3 Revenue Forecast, 2025-2035
- 12.5.4 Volume Forecast, 2025-2035
- 12.5.5 Base-Year Market Share, 2025
- 12.5.6 Segment CAGR and Growth Drivers
- 12.5.7 Subsegment Market Size and Forecast
- 12.5.7.1 Edge Deployment
- 12.5.7.2 Cloud Deployment
- 12.5.7.3 Hybrid Deployment
- 12.5.8 Subsegment Pricing and Adoption Trends
- 12.5.9 Leading Suppliers and Competition
- 12.5.10 Regional Demand and Opportunities
- 12.6 By End-Use Industry - Market Size and Forecast, 2025-2035
- 12.6.1 Segment Definition and Scope
- 12.6.2 Historical Market Size, 2018-2025
- 12.6.3 Revenue Forecast, 2025-2035
- 12.6.4 Volume Forecast, 2025-2035
- 12.6.5 Base-Year Market Share, 2025
- 12.6.6 Segment CAGR and Growth Drivers
- 12.6.7 Subsegment Market Size and Forecast
- 12.6.7.1 Iron Ore Mining
- 12.6.7.2 Coal Mining
- 12.6.7.3 Gold Mining
- 12.6.7.4 Base and Critical Mineral Mining
- 12.6.8 Subsegment Pricing and Adoption Trends
- 12.6.9 Leading Suppliers and Competition
- 12.6.10 Regional Demand and Opportunities
- 12.7 By State - Market Size and Forecast, 2025-2035
- 12.7.1 Segment Definition and Scope
- 12.7.2 Historical Market Size, 2018-2025
- 12.7.3 Revenue Forecast, 2025-2035
- 12.7.4 Volume Forecast, 2025-2035
- 12.7.5 Base-Year Market Share, 2025
- 12.7.6 Segment CAGR and Growth Drivers
- 12.7.7 Subsegment Market Size and Forecast
- 12.7.7.1 Western Australia
- 12.7.7.2 Queensland
- 12.7.7.3 New South Wales
- 12.7.7.4 Remaining States and Territories
- 12.7.8 Subsegment Pricing and Adoption Trends
- 12.7.9 Leading Suppliers and Competition
- 12.7.10 Regional Demand and Opportunities
- 12.8 Segment Growth Comparison
- 12.9 Segment Attractiveness and Priority Matrix
Chapter 13 Australia AI in Mining Safety and Monitoring End-Use and Application Market Outlook
- 13.1 End-Use Industry and Customer Demand Structure
- 13.2 Leading Applications and Customer Groups
- 13.3 End-Use Market Size, Share and Forecast
- 13.4 Major End-Use Industry Deep Dives
- 13.4.1 Customer Requirements and Use Cases
- 13.4.2 Demand and Replacement Cycles
- 13.4.3 Technical and Regulatory Considerations
- 13.4.4 Purchasing and Procurement Models
- 13.4.5 Leading Vendors and Distribution Channels
- 13.4.6 Forecast and Commercial Opportunities
- 13.5 Emerging Applications and Cross-Segment Demand
- 13.6 End-Use Industry Investment Priorities
Chapter 14 Australia AI in Mining Safety and Monitoring Geographic Market Outlook, 2025-2035
- 14.1 Domestic Market Distribution and Demand Clusters
- 14.2 State- or Province-Wise Market Size and Forecast, 2025-2035
- 14.3 City and Metropolitan Market Outlook
- 14.4 Industrial, Manufacturing and Commercial Clusters
- 14.5 Geographic Concentration of Key End Users
- 14.6 Local Pricing and Purchasing Differences
- 14.7 Domestic Production Facilities and Capacity Map
- 14.8 Local Infrastructure and Project Pipeline
- 14.9 State-Level Policy and Incentive Differences
- 14.10 Subnational Investment Hotspots and Opportunities
- 14.11 Distribution and Logistics Networks
- 14.12 Domestic Competitive Footprint
Chapter 15 Australia AI in Mining Safety and Monitoring Technology, Innovation and Sustainability Outlook
- 15.1 Technology Landscape and Maturity
- 15.2 Product, Process and Service Innovation
- 15.3 AI, Automation and Digital Tools in the Industry
- 15.4 Technology Adoption and Performance Benchmarking
- 15.5 Innovation Pipeline and R&D Investment
- 15.6 Patent and Intellectual Property Trends
- 15.7 Energy Efficiency and Resource Management
- 15.8 Sustainability, Recycling and Circularity
- 15.9 Technology Roadmap, 2025-2035
- 15.10 Risks of Obsolescence and Technology Substitution
Chapter 16 Australia AI in Mining Safety and Monitoring Market Key Strategic Imperatives
- 16.1 Growth and Market Entry Priorities
- 16.2 High-Return Products and Segments
- 16.3 Pricing, Profitability and Cost Optimization
- 16.4 Technology Investment and Product Differentiation
- 16.5 Supply Chain Localization and Resilience
- 16.6 Distribution and Customer Acquisition
- 16.7 Partnership, Acquisition and Capacity Strategy
- 16.8 Regional Expansion Priorities
- 16.9 Short-, Medium- and Long-Term Actions
Chapter 17 Competition Outlook
- 17.1 Industry Competition Characteristics
- 17.2 Market Structure and Concentration
- 17.3 Market Share and Competitive Positioning, 2025
- 17.4 Company-Wise Revenue and Product Benchmarking
- 17.5 Production and Service Capacity Benchmarking
- 17.6 Technology, Pricing and Differentiation
- 17.7 Regional Footprint and Distribution Strength
- 17.8 Mergers, Acquisitions and Strategic Alliances
- 17.9 New Entrants and Competitive Threats
- 17.10 Porter's Five Forces and Industry Attractiveness
- 17.11 Competitive Outlook, 2025-2035
Chapter 18 Company Profiles
- 18.1 Company Coverage and Selection Criteria
- 18.2 Hexagon Mining
- 18.2.1 Business Description
- 18.2.2 Company Ownership and Geographic Presence
- 18.2.3 Product and Service Portfolio
- 18.2.4 Manufacturing and Operating Footprint
- 18.2.5 Production Capacity and Expansion Plans
- 18.2.6 Financial Performance and Investment
- 18.2.7 Market Share and Competitive Position
- 18.2.8 Technology and Innovation Capabilities
- 18.2.9 Strategic Alliances or Partnerships
- 18.2.10 Recent Developments
- 18.2.11 Growth Strategy and Outlook
- 18.3 Caterpillar
- 18.4 Komatsu
- 18.5 Epiroc
- 18.6 Emesent
- 18.7 ABB
- 18.8 AspenTech
- 18.9 SmartCap
- 18.10 MaxMine
- 18.11 Pitcrew AI
- 18.12 Other Relevant Market Participants
Note: Every listed company is profiled on the structure shown under the first company. The company list is preliminary and may change based on research findings, market developments, data availability and client requirements.
Chapter 19 Disclaimer
- 19.1 Research and Forecast Disclaimer
- 19.2 Data Source and Estimation Limitations
Note: The depth of individual sections depends on data availability for this market. Volume, capacity, trade and other unit-based metrics are included where applicable.

