
Heavy sands feed pigment, welding and ceramics buyers
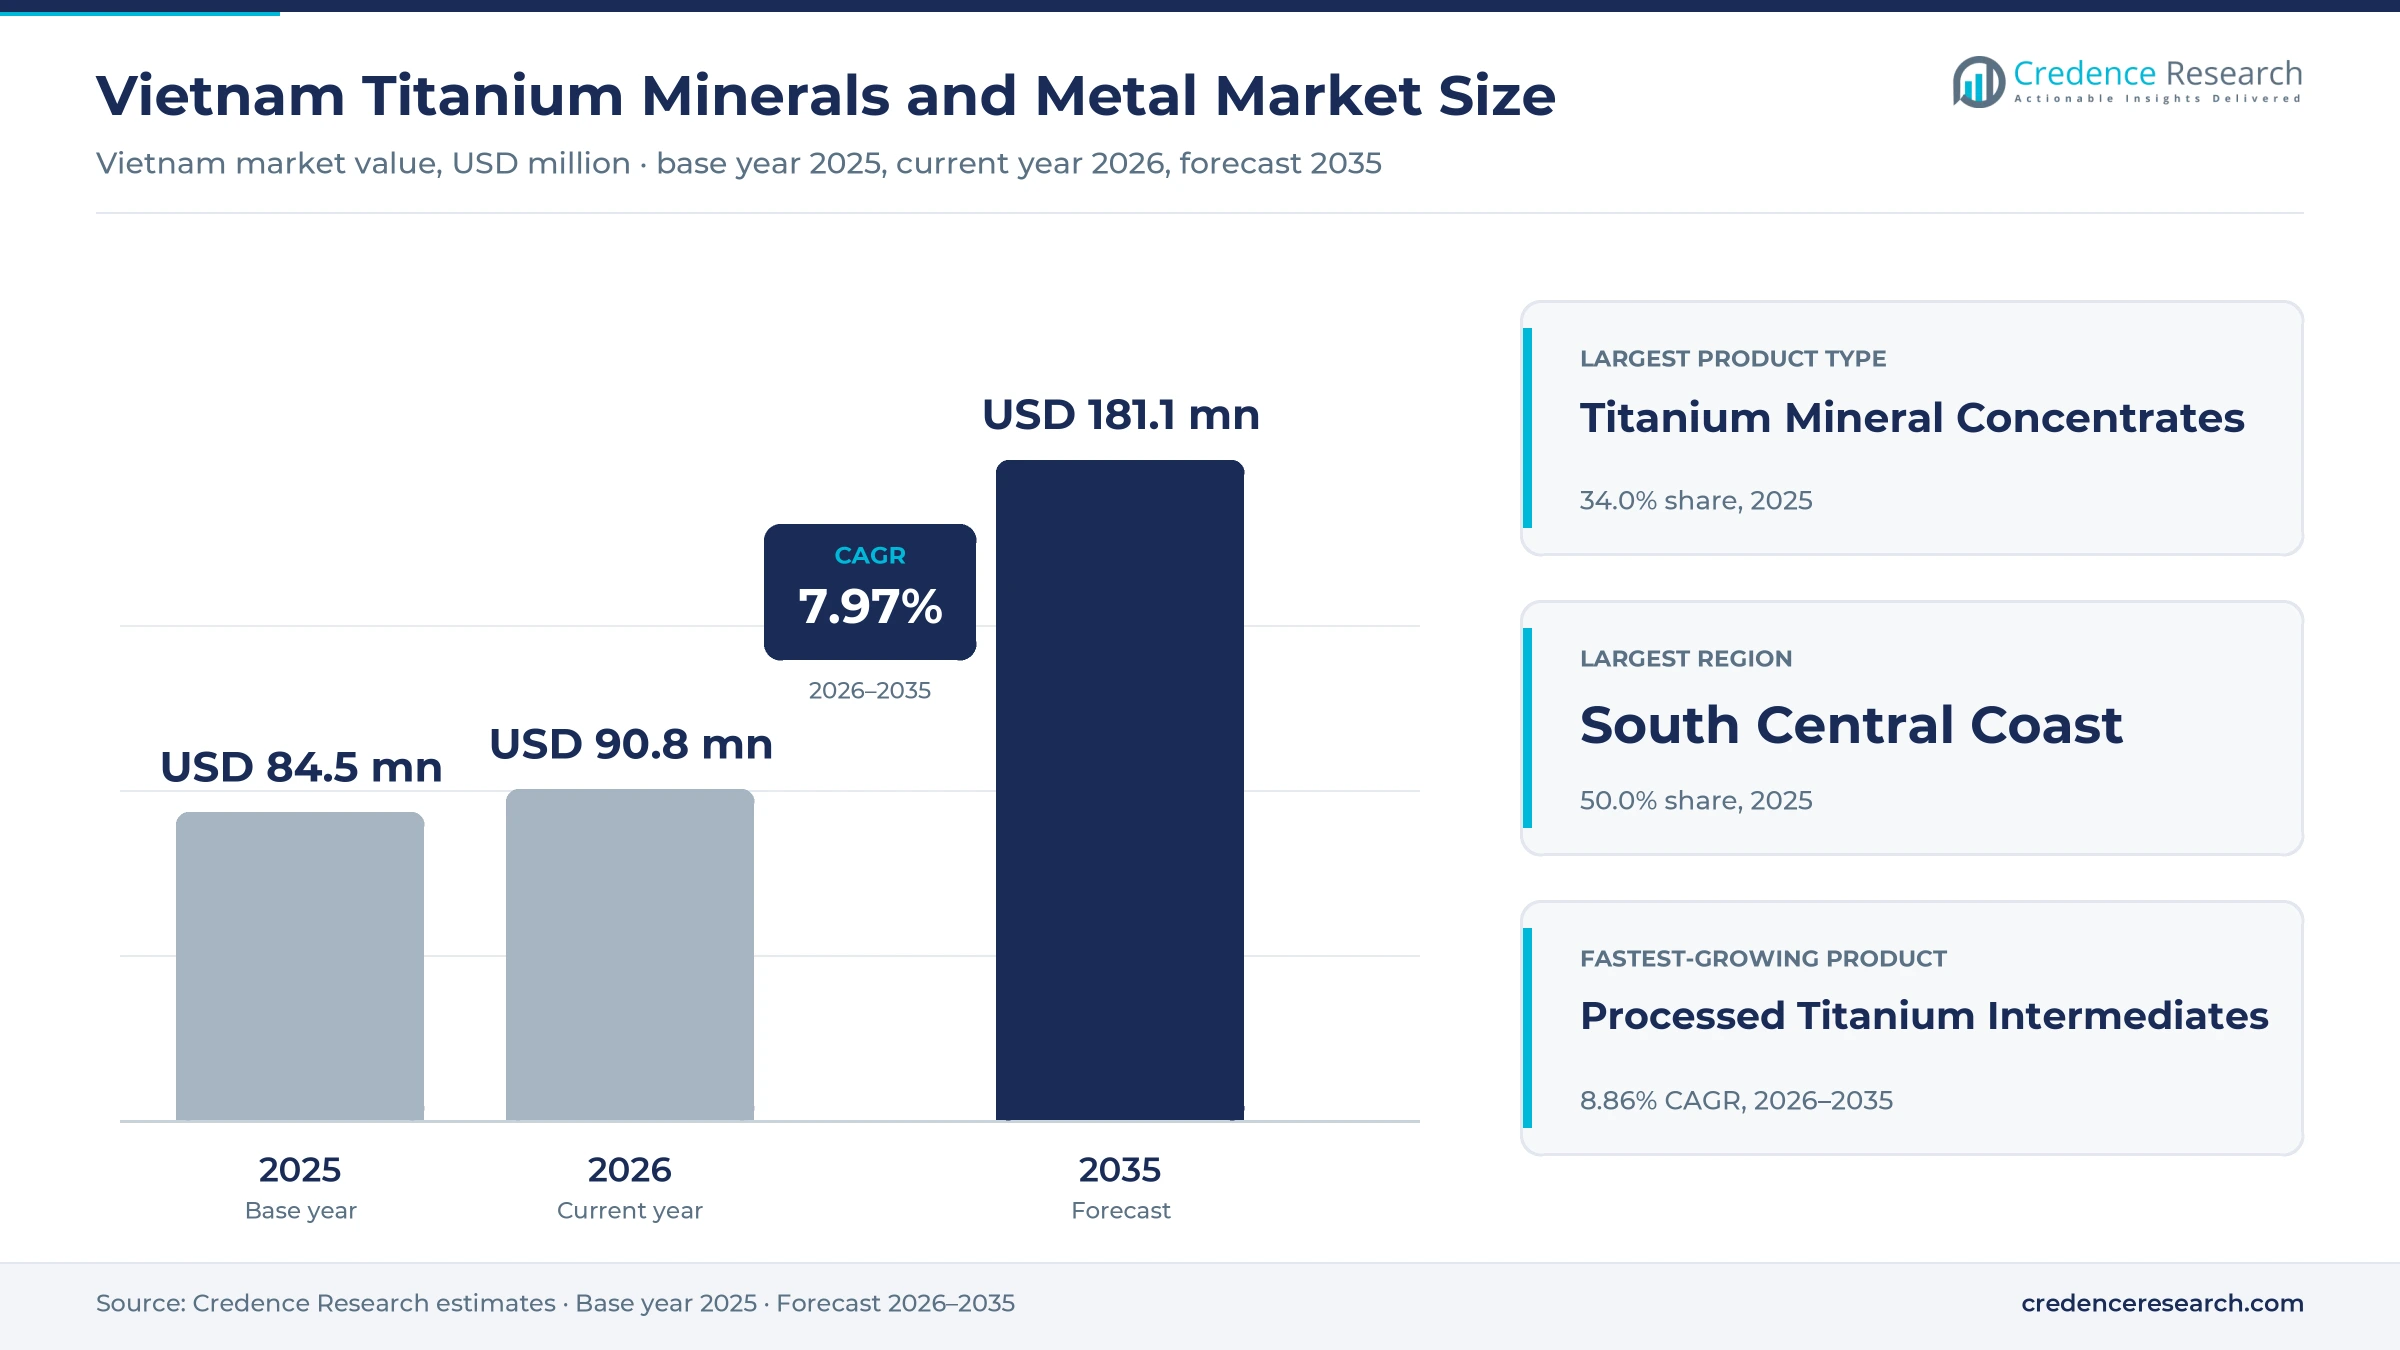
The Vietnam titanium minerals and metal market was valued at USD 84.5 million in 2025 and is projected to increase from USD 90.8 million in 2026 to USD 181.1 million by 2035, registering a CAGR of 7.97% during 2026–2035. Demand comes from overseas pigment and slag producers that buy ilmenite, from ceramic tile makers that use zircon, and from welding-electrode, steel and fabrication plants that need rutile, reduced ilmenite and titanium metal. The South Central Coast held the largest regional share, 50.0% in 2025, because the heavy-sand belts of Binh Dinh and Binh Thuan host most licensed mines and separation plants. Metropolitan and remaining locations form the fastest-growing region at 8.53% a year, as factories around Hanoi and Ho Chi Minh City buy more imported titanium mill products. At the same time, export rules now favor slag, reduced ilmenite and milled zircon over raw concentrate, which pushes miners toward domestic processing.
Which heavy-sand and titanium products does the estimate cover?
The estimate measures the value of titanium-bearing minerals and titanium metal supplied by and to buyers in Vietnam. It counts ilmenite and rutile concentrates, slag, reduced ilmenite and synthetic rutile, zircon and monazite recovered from the same sands, and titanium sponge, bar, sheet and tube bought by local manufacturers.
The estimate excludes titanium dioxide pigment made abroad and imported as finished pigment, as well as finished consumer articles that only contain titanium parts. The value chain runs from coastal placer mines through separation and smelting plants to exporters, trading houses, pigment and ceramic producers, welding-electrode makers and metal fabricators.
Vietnam Titanium Minerals and Metal Market Insights
- The Vietnam titanium minerals and metal market was valued at USD 84.5 million in 2025 and is projected to reach USD 181.1 million by 2035, registering a CAGR of 7.97% during 2026–2035.
- The South Central Coast held a 50.0% share of 2025 value, because Binh Dinh and Binh Thuan host the largest licensed heavy-sand mines.
- Titanium mineral concentrates led with a 34.0% share of 2025 value, because ilmenite remains the main product of nearly every coastal mine.
- China imported 291,162 tons of Vietnamese titanium ores and concentrates in 2023 but only 21,263 tons in 2025, according to UN Comtrade data.
- Processed titanium intermediates grow fastest at 8.86% a year during 2026–2035, as slag and reduced ilmenite plants replace raw ore sales.
Concentrates lead while processed intermediates grow fastest
Why do mineral concentrates still hold the largest value?
Based on product type, the market is categorized into titanium mineral concentrates, processed titanium intermediates, mineral-sand co-products and titanium metal products. Titanium mineral concentrates led with a 34.0% share of 2025 value, because ilmenite is the main output of every placer mine. Processed titanium intermediates grow fastest at 8.86% a year, as slag and reduced ilmenite plants absorb feedstock that once left the country as raw ore.
How does pigment manufacturing anchor demand?
Based on end-use industry, the market is categorized into pigment manufacturing, ceramics and refractories, and metallurgy and fabrication. Pigment manufacturing led with 47.0% of 2025 value, because most ilmenite and slag goes to chloride and sulfate pigment plants abroad. Metallurgy and fabrication grows fastest at 8.65% a year, as welding-electrode, steel and machinery plants in Vietnam buy more rutile, ferroalloys and titanium mill products.
Which buyers take the most heavy-sand output?
Based on customer type, the market is categorized into integrated manufacturers, specialist processors and merchant buyers. Integrated manufacturers led with a 46.0% share of 2025 value, because pigment and welding groups sign volume contracts for consistent grades. Specialist processors grow fastest at 8.49% a year, as domestic slag smelters and zircon mills buy concentrate from smaller licensed mines.
Why do direct export contracts dominate sales?
Based on sales channel, the market is categorized into direct export contracts, export trading houses and domestic direct supply. Direct export contracts led with a 48.0% share of 2025 value, because large miners sell slag and concentrate straight to pigment plants in China, Japan and Korea. Domestic direct supply grows fastest at 9.09% a year, as provincial rules steer feedstock to local processing plants.
| Segment Group | Leading Sub-segment | Share, 2025 | Fastest-growing Sub-segment | CAGR, 2026–2035 |
|---|---|---|---|---|
| By Product Type | Titanium mineral concentrates | 34.0% | Processed titanium intermediates | 8.86% |
| By End-Use Industry | Pigment manufacturing | 47.0% | Metallurgy and fabrication | 8.65% |
| By Customer Type | Integrated manufacturers | 46.0% | Specialist processors | 8.49% |
| By Sales Channel | Direct export contracts | 48.0% | Domestic direct supply | 9.09% |
Request a Free Sample
Fill in your details and we'll send you a free sample report.
- Sample data tables & charts
- Research methodology
Processing rules, factory output and formal licensing
How do processing rules reshape market access?
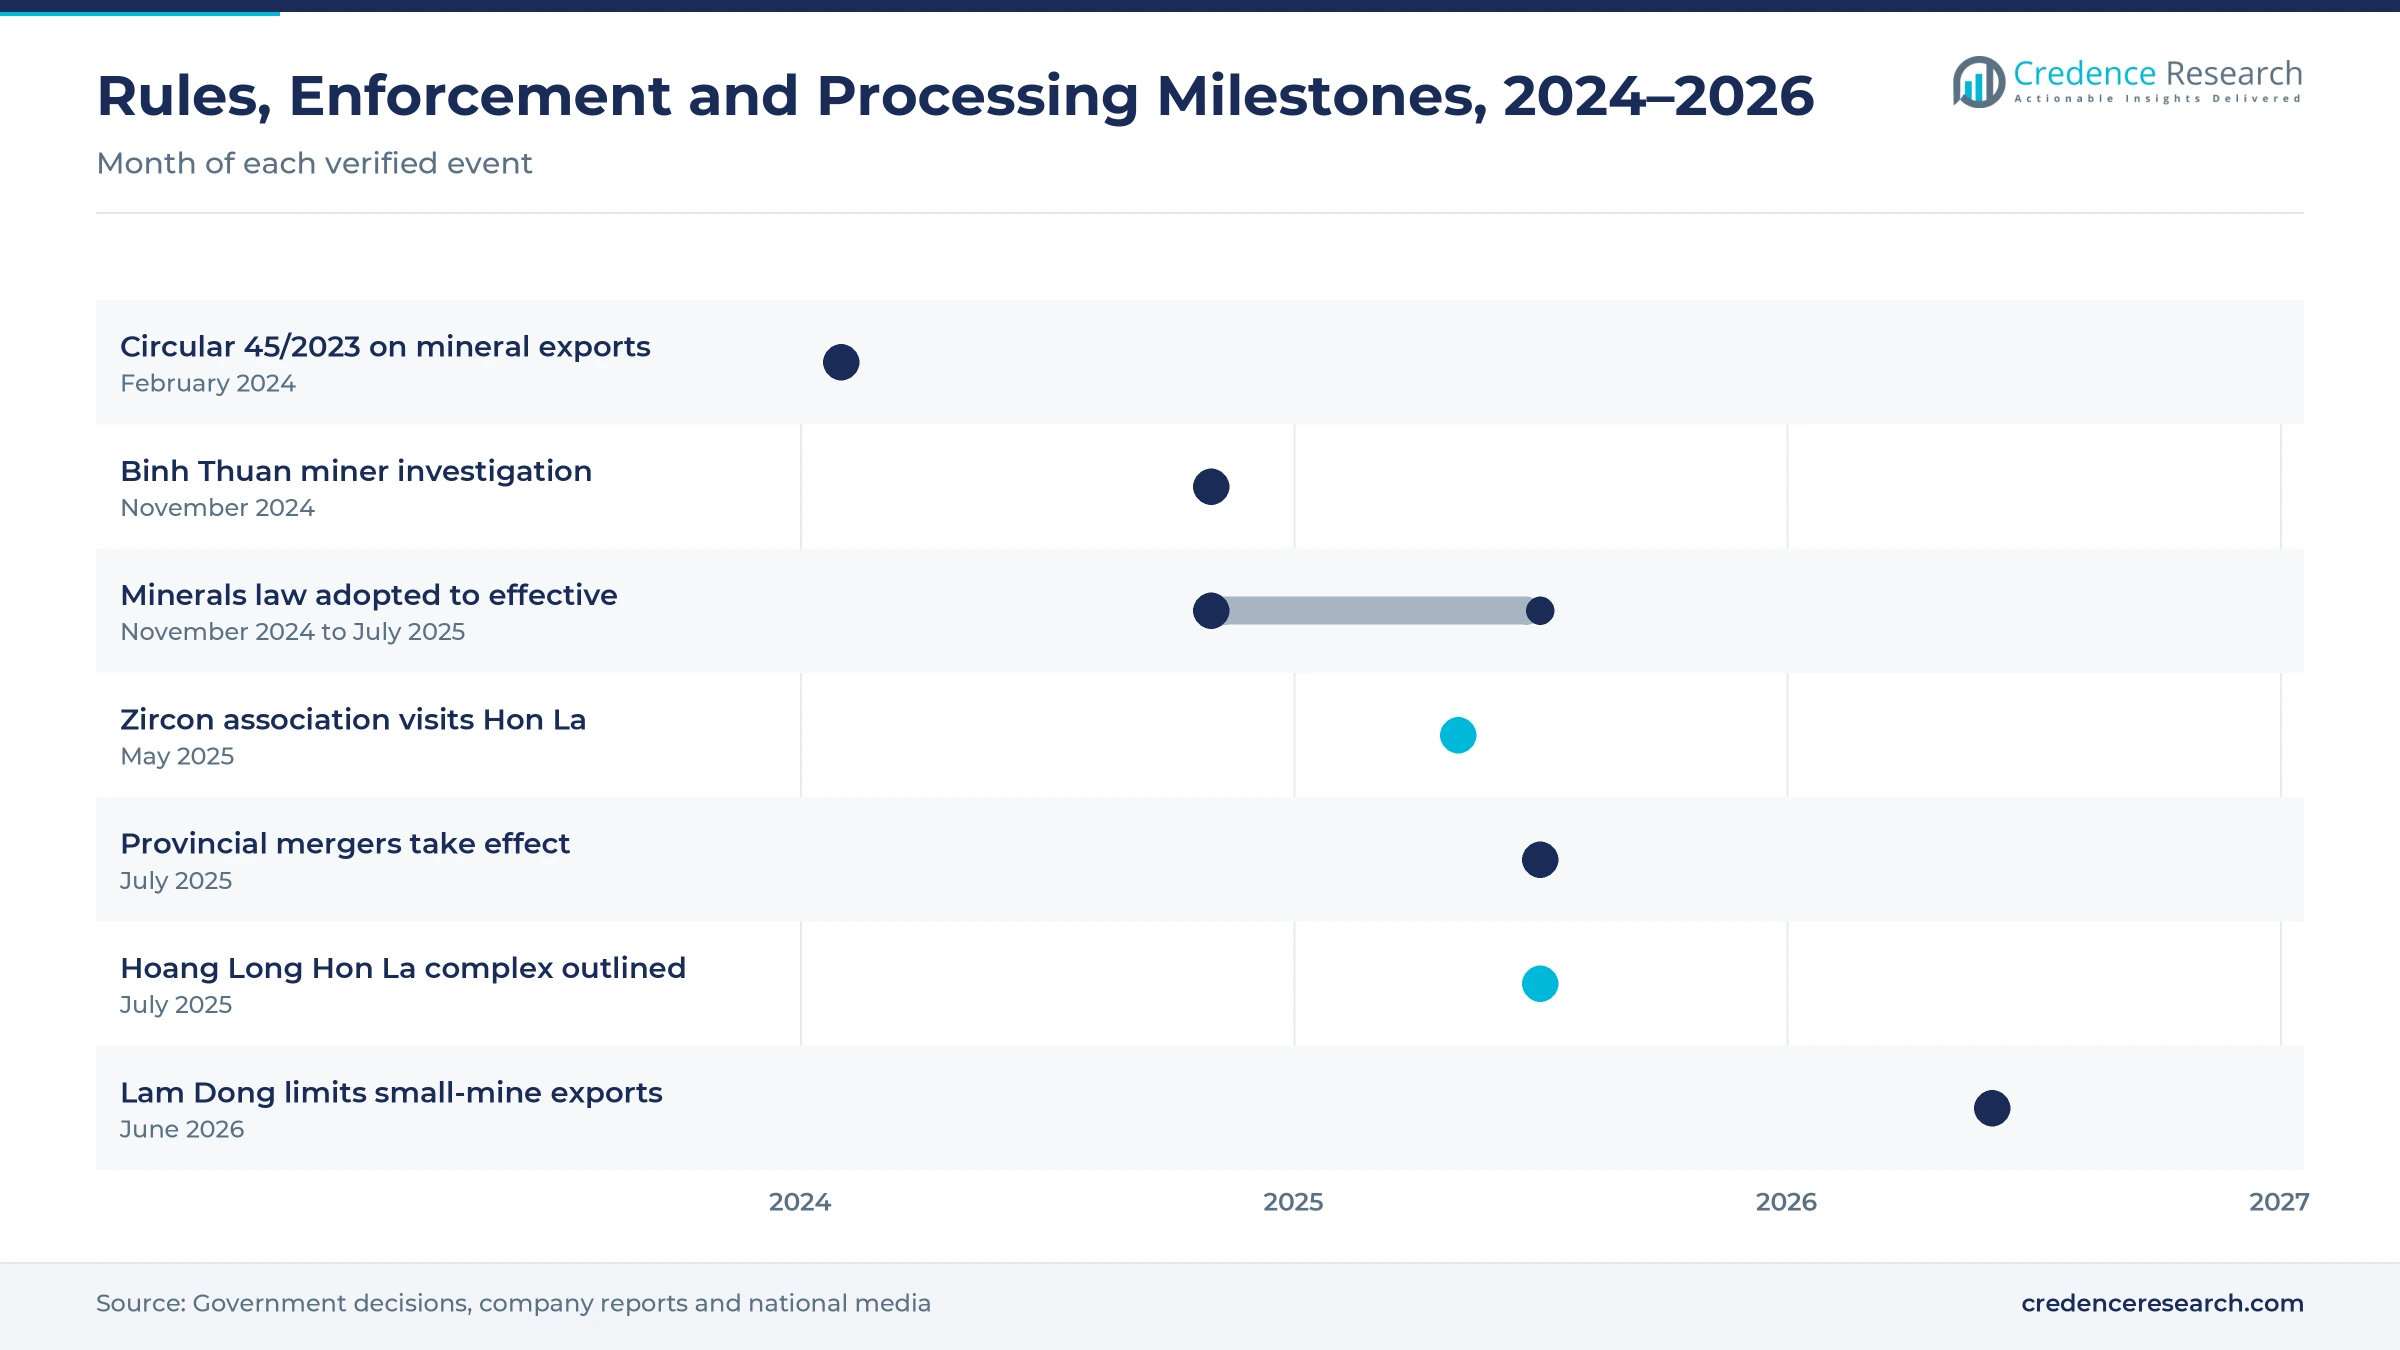
Vietnam now ties mineral exports to processing standards, which shifts value from raw ore toward slag, reduced ilmenite and milled zircon. Circular 45/2023/TT-BCT from the Ministry of Industry and Trade took effect on Feb. 15, 2024 and updated the list of exportable mineral products and their quality standards, the Vietnam Lawyers newspaper reported. Prime Minister Decision 866/QD-TTg of July 18, 2023 lists titanium among strategic minerals open only to licensed miners with modern technology. The Leader reported in June 2026 that Lam Dong no longer has small, low-grade mines eligible for export, because all current mines are planned for domestic processing. As a result, processed titanium intermediates grow at 8.86% a year, the fastest product type.
Why does factory and fabrication output lift local demand?
Vietnam's factories are using more steel, ferroalloys and welding consumables, which raises domestic demand for rutile, reduced ilmenite and titanium mill products. Vietnam Economic News reported that metal production rose 15.4% in 2025, fabricated metal products rose 12.5% and rolled steel output rose 17.6%. Binh Dinh Minerals listed Hyundai Welding Vina among its customers in its 2024 annual report, which links coastal ilmenite to electrode plants inside the country. Thanh Tam in Quang Tri markets reduced ilmenite and synthetic rutile for welding materials and ferrotitanium. In turn, metallurgy and fabrication grows at 8.65% a year, the fastest end-use industry.
How does more formal project development change supply?
Licensing has become stricter and more transparent, which favors well-capitalized miners that can finance closure, restoration and processing. The National Assembly adopted Law No. 54/2024/QH15 on Geology and Minerals on Nov. 29, 2024, and it took effect on July 1, 2025, according to the law firm Rajah and Tann Asia. On Nov. 7, 2024, Ministry of Public Security investigators charged nine people over alleged overmining and accounting violations at a Binh Thuan zirconium and titanium miner, Saigon Giai Phong reported. Binh Thuan had seven companies licensed for titanium-zircon placer ore as of June 2024. As a result, integrated manufacturers hold 46.0% of 2025 value.
Why do zircon and ceramics buyers add a second outlet?
Zircon recovered from the same heavy sands gives miners a second product that sells to ceramic tile, glaze and refractory makers. Binh Dinh Minerals reports zircon with about 65% zirconium dioxide alongside rutile and monazite from its Phu Cat operations, according to its 2024 annual report. Song Binh Minerals is the only zircon powder producer still operating in Lam Dong, The Leader reported in June 2026. Lam Dong plans to send local feedstock to a 50,000-ton-per-year ultra-fine zircon powder project. In turn, ceramics and refractories give miners a second outlet, while pigment manufacturing keeps its 47.0% lead but slowly loses share.
Slag smelting, cleaner plants and rare earth recovery
How is the shift toward slag smelting changing plants?
Miners are adding smelters so that they sell high-grade slag and pig iron instead of raw concentrate. Binh Dinh Minerals reports slag with 85% to 92% titanium dioxide from its Cat Nhon plant, where a second phase lifted capacity to about 2.5 times the first-phase level of 9,500 tons a year. Hoang Long Titanium Mineral Processing plans a 100,000-ton-per-year slag plant and a 50,000-ton pig iron line in the Hon La Economic Zone, the Dien Dan Doanh Nghiep newspaper reported on July 2, 2025. Hung Thinh built a slag plant on about 10 hectares in Hoa Thang commune, although police sealed it during the investigation, according to Saigon Giai Phong and The Leader. As a result, specialist processors grow at 8.49% a year.
Why is the rise of cleaner processing notable?
Buyers and regulators now look closely at water use, tailings and land restoration, which rewards plants with closed-loop processing. More than 40 experts from the International Zircon Association visited the Hoang Long plant on May 19, 2025, the only Vietnamese field site for the group's 2025 meeting in Hanoi, Saigon Giai Phong reported. The visitors praised its closed-loop separation, water reuse and treated mud waste. Law No. 54/2024/QH15 also prioritizes environmentally friendly technology and a circular economy model in mining and processing. In turn, operators that can show restoration and clean water records gain an edge with overseas pigment buyers, and Binh Dinh Minerals already markets its slag to European, Japanese, Korean and Chinese standards.
Is there an opening in monazite and rare earth co-products?
Monazite separated from titanium sands contains rare earths, which offers processors a higher-value co-product than zircon alone. Hoang Long plans 2,100 tons a year of rare earth chlorides and 150 to 200 tons of individual rare earth oxides at its Hon La complex, according to Dien Dan Doanh Nghiep. Binh Dinh Minerals lists monazite with more than 57% rare earth oxides among its products. Decision 866/QD-TTg targets more than two million tons of rare earth ore processing by 2030, Rajah and Tann Asia noted. As a result, mineral-sand co-products could gain share when separation plants open, and buyers of heavy sand output pay more for certified monazite and zircon.
Is there an opening in consolidated provincial licensing?
The 2025 provincial mergers concentrate titanium reserves under fewer administrations, which could speed up larger and better planned mining projects. The National Assembly approved the mergers on June 12, 2025, and the new provinces began work on July 1, 2025, folding Binh Thuan into Lam Dong and Binh Dinh into Gia Lai, Tuoi Tre reported. The Leader reported that Lam Dong now holds more than 92% of national titanium reserves and resources, about 566 million tons, with 17 planned areas on nearly 16,000 hectares. As a result, processors that secure long-term feedstock from these areas can supply domestic slag smelting at larger scale.
Export slump, idle smelters and licensing gaps weigh
How does the collapse in raw ore exports pressure miners?
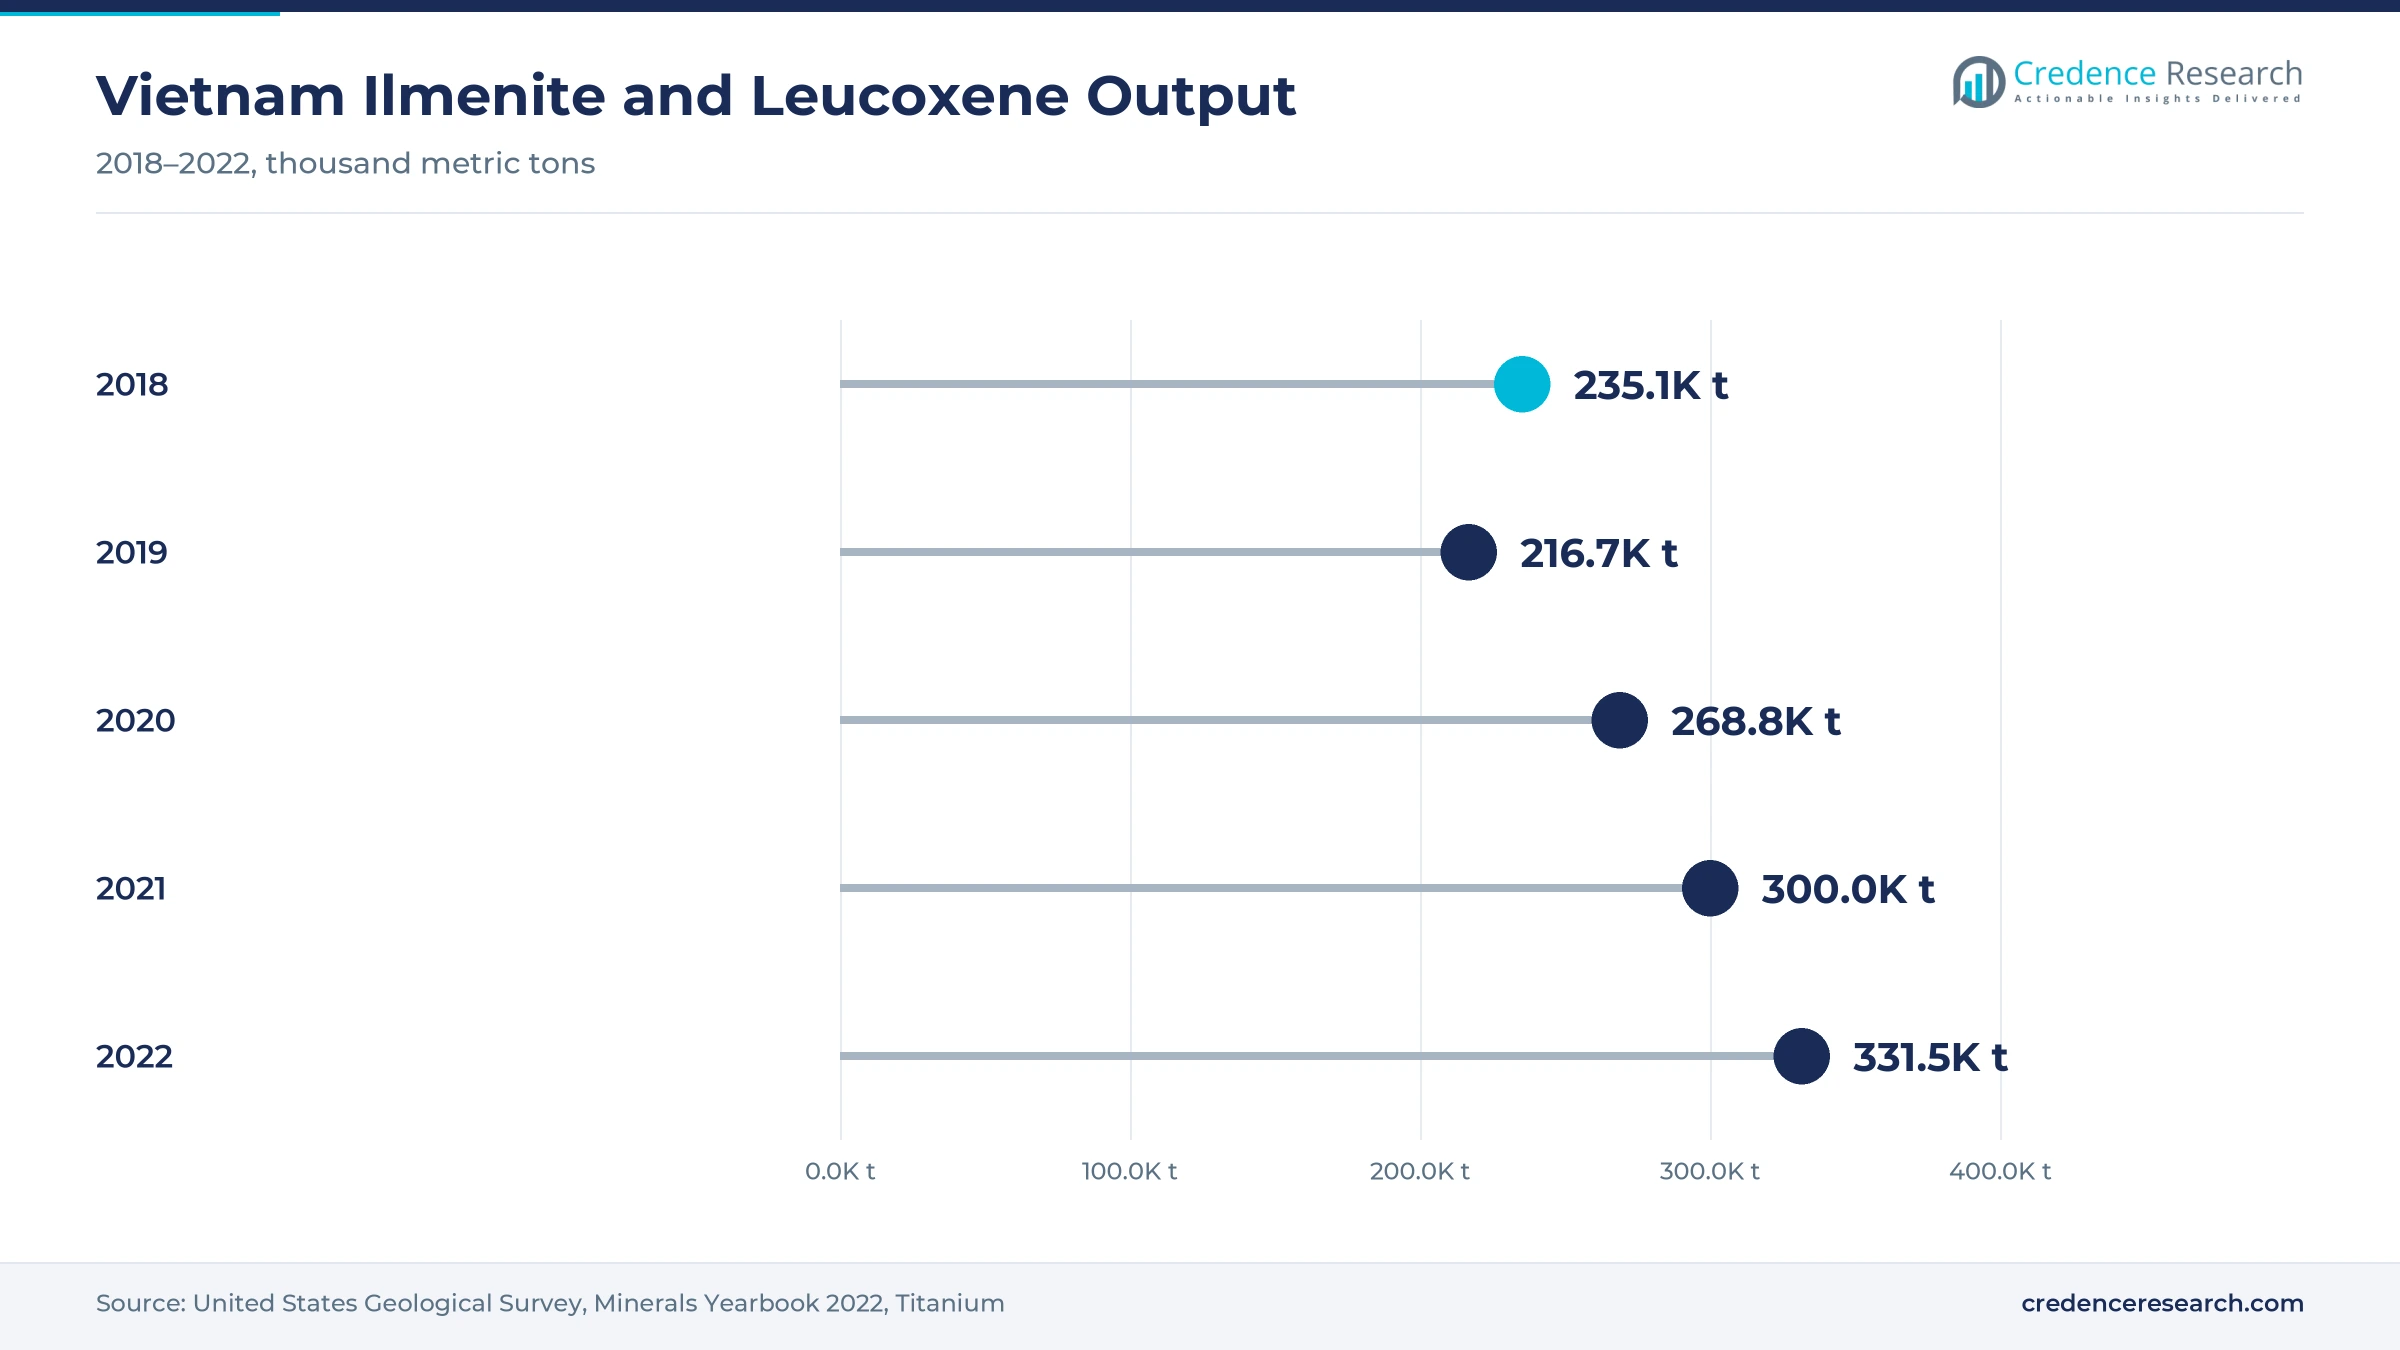
China has long been the main buyer of Vietnamese ilmenite, so lower shipments hit mine cash flow quickly. Vietnam was the third-largest source of Chinese titanium concentrate imports in 2022, according to the United States Geological Survey. UN Comtrade data show China imported 291,162 tons of Vietnamese titanium ores and concentrates in 2023, 174,077 tons in 2024 and only 21,263 tons in 2025. As a result, miners without processing plants carry high stock costs. Firms respond by selling to domestic smelters and by seeking export approval for upgraded grades.
Why do idle smelters weaken processing returns?
Several licensed slag plants run far below capacity, because electricity, material losses and environmental treatment raise costs. The three licensed slag projects in Lam Dong total 94,000 tons a year, yet most are largely idle, according to The Leader. In turn, the value added from local feedstock stays lower than planners expected. Operators respond by seeking cheaper power, better furnace technology and long-term offtake contracts with pigment buyers that can absorb steady volumes.
How do licensing gaps interrupt mine output?
Mines must renew licenses, close exhausted pits and pass new reserve reviews, which can stop output for long periods. Binh Dinh Minerals stopped mining after its license expired and is completing closure while it applies for new titanium mining licenses. As a result, processing plants that depend on one mine can face feedstock gaps. Companies respond by recovering minerals from old dumps, buying from other licensed miners and planning exploration earlier.
Why does coastal land damage raise project costs?
Placer mining moves large volumes of coastal sand, which can damage forests, water tables and farmland if restoration fails. As a result, local authorities face pressure from residents and add stricter closure and replanting duties. These rules raise costs for small miners that cannot fund reforestation or water treatment. Larger operators respond with closed-loop water systems, staged restoration and community funds, which help them win new licenses near sensitive coastal areas.
South Central Coast leads on Binh Dinh and Binh Thuan sands
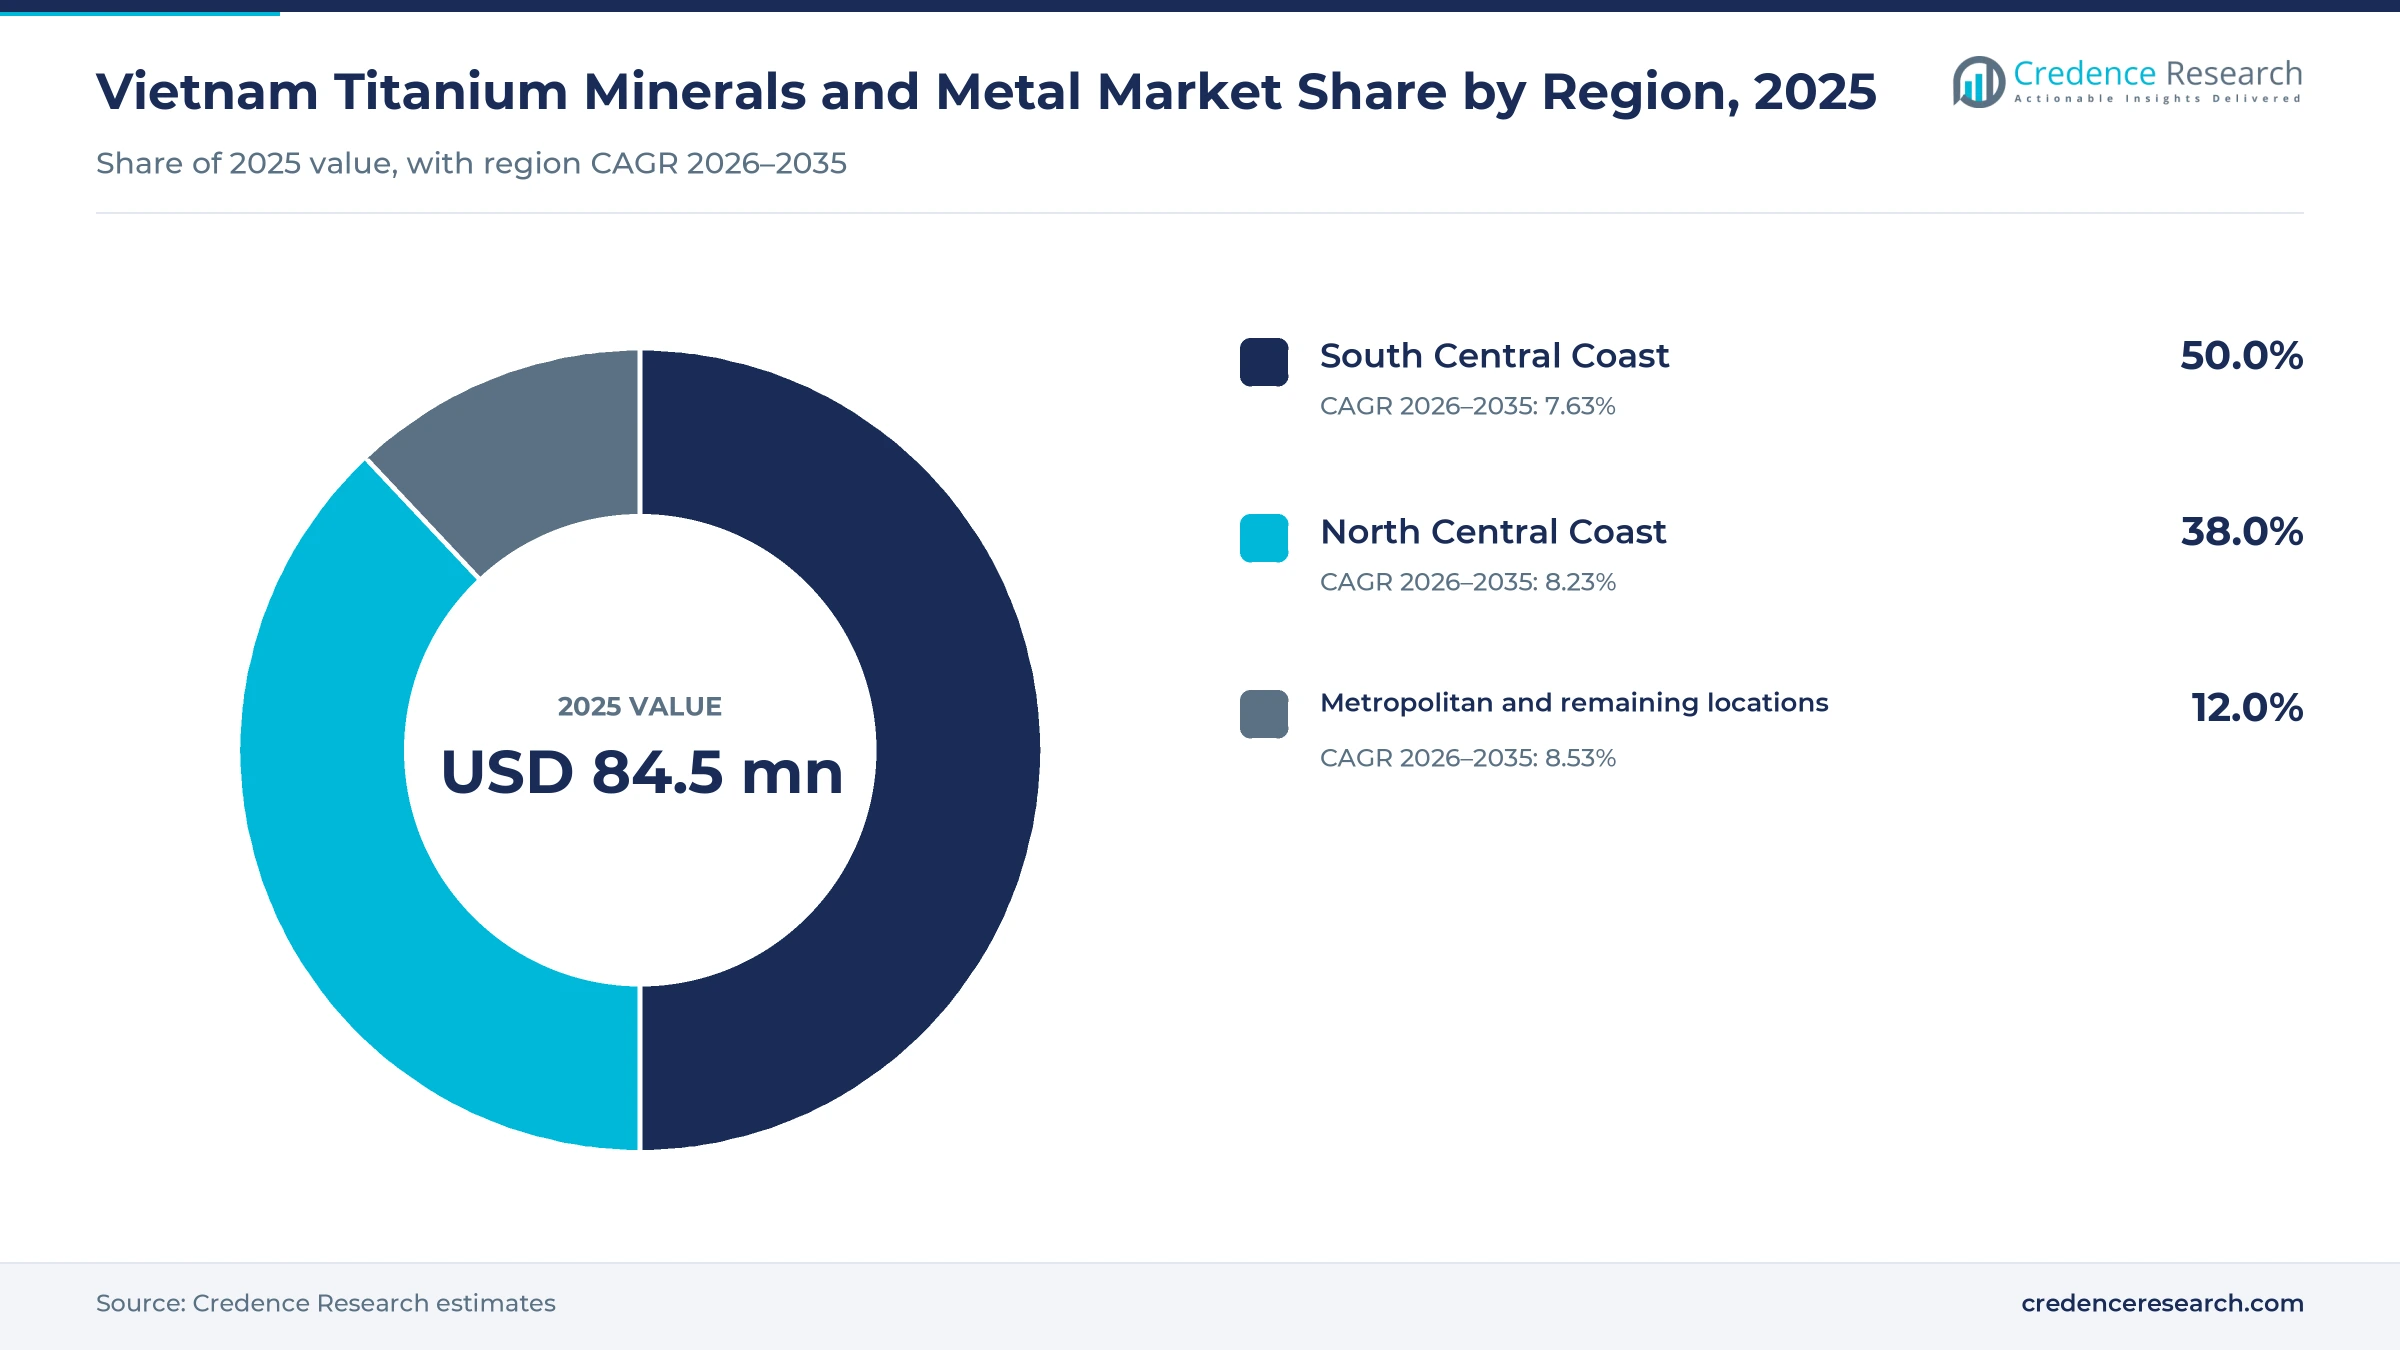
| Region | Value, 2025 (USD million) | Share, 2025 | CAGR, 2026–2035 |
|---|---|---|---|
| South Central Coast | 42.2 | 50.0% | 7.63% |
| North Central Coast | 32.1 | 38.0% | 8.23% |
| Metropolitan and remaining locations | 10.1 | 12.0% | 8.53% |
Binh Dinh and Binh Thuan sands anchor the top share
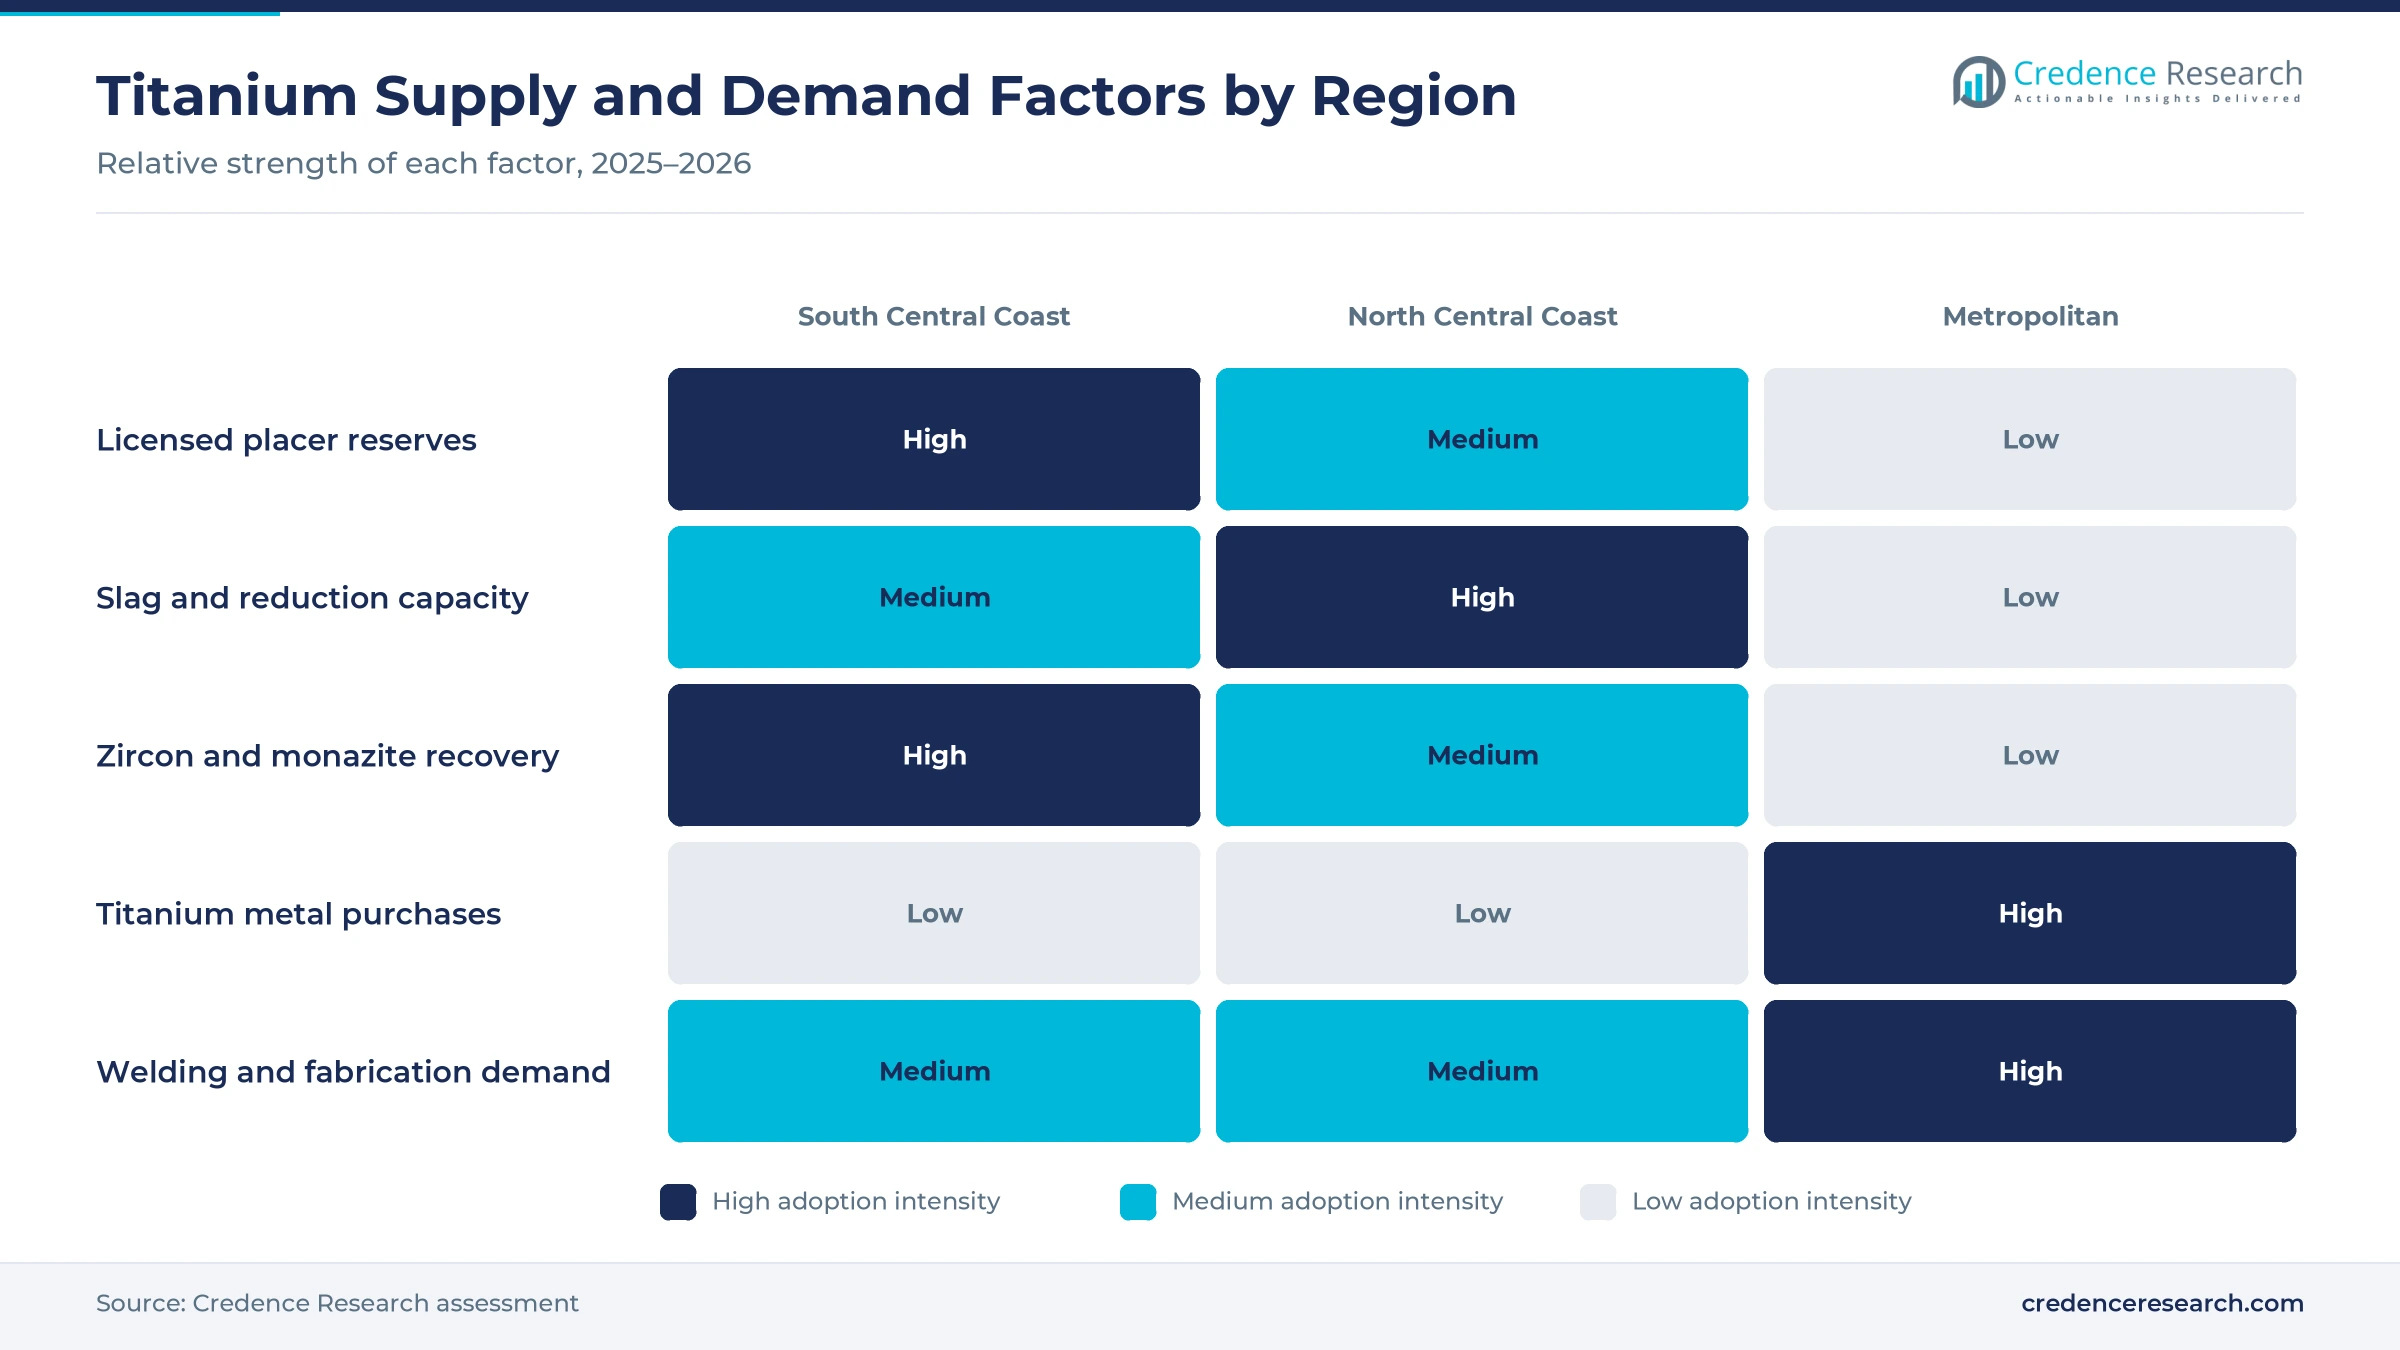
The South Central Coast held a 50.0% share of 2025 value and grows at 7.63% a year, because Binh Dinh and Binh Thuan host the largest licensed heavy-sand mines. Tan Quang Cuong holds a license for 117,345 tons of ore minerals a year at its Nam Suoi Nhum mine in Ham Thuan Nam. Binh Dinh Minerals runs separation and slag plants in Phu Cat. As a result, the zone supplies most concentrate, slag and zircon sold by Vietnamese producers.
Quang Tri reduction and slag plants deepen processing
The North Central Coast held a 38.0% share of 2025 value and grows at 8.23% a year, because Quang Tri, Ha Tinh and Thua Thien Hue combine placer mines with reduction and slag plants. The merged Quang Tri province holds more than two million tons of titanium reserves, Dien Dan Doanh Nghiep reported. Thanh Tam in Dong Ha supplies reduced ilmenite and synthetic rutile. In turn, the zone gains most from the planned Hon La complex.
Why do metropolitan locations grow fastest?
Metropolitan and remaining locations held a 12.0% share of 2025 value and grow fastest at 8.53% a year, because factories around Hanoi, Ho Chi Minh City and Hai Phong buy imported titanium bar, sheet and tube. Vietnam imported titanium and titanium articles worth USD 194.5 million in 2023, according to UN Comtrade data, although finished articles outside this estimate make up most of that value. As a result, import-led metal supply grows faster than mined output, and coatings and paint makers add steady pigment-related demand.
Export rules, a new minerals law and a Hon La complex
| Development | Status and market relevance |
|---|---|
| In February 2024, Circular 45/2023/TT-BCT on exportable mineral products took effect. | Updates export product lists and quality standards for titanium slag, ilmenite and zircon |
| In November 2024, investigators charged nine people over a Binh Thuan titanium and zirconium miner. | Signals tighter enforcement of licensed reserves and output limits |
| In May 2025, the International Zircon Association visited the Hoang Long plant in Hon La. | Puts a closed-loop Vietnamese processing site in front of global buyers |
| In July 2025, Law No. 54/2024/QH15 on Geology and Minerals took effect. | Resets licensing, fees and mineral recovery rules for all miners |
| In July 2025, Hoang Long outlined a slag, pig iron and monazite complex in the Hon La Economic Zone. | Plans 100,000 tons a year of slag and rare earth chloride output |
Separation, reduction, smelting and zircon milling
- Gravity and magnetic separation splits ilmenite, rutile, zircon and monazite from coastal sand, which sets the grade of every later product.
- Ilmenite reduction kilns remove part of the iron from ilmenite, which lifts titanium content for welding electrodes and synthetic rutile.
- Electric arc slag smelting melts ilmenite with coal into slag of 85% to 92% titanium dioxide and pig iron, which pigment plants prefer.
- Ultra-fine zircon milling grinds zircon into flour for tile glazes and refractories, which earns more than unmilled zircon sand.
Need a Custom Version of This Report?
Tailor the scope, geography, or segments to your exact requirements.
- Custom geography or segment scope
- Direct access to our analyst team
Provincial miners and processors compete on licenses
Competition combines provincial miners that hold placer licenses with processors that add separation, reduction and smelting steps. Binh Dinh Minerals, partly owned by the state, runs a separation plant and a slag plant in Phu Cat and sells to welding and mineral buyers in China and Vietnam. Tan Quang Cuong and Duc Canh hold licensed placer mines in Binh Thuan, now part of Lam Dong, while Song Binh Minerals is the only zircon powder producer still operating in Lam Dong, The Leader reported. Thanh Tam and Quang Tri Minerals focus on reduced ilmenite, synthetic rutile and zircon flour in Quang Tri. Companies compete on license security, product grade, processing depth and long-term offtake contracts with overseas pigment makers that buy ilmenite and slag.
Which miners and processors shape heavy-sand supply?
| Company | Type | Role in the market |
|---|---|---|
| Binh Dinh Minerals Joint Stock Company | Miner and slag producer | Runs separation and slag plants in Phu Cat with zircon and rutile output |
| Tan Quang Cuong Trading Company Limited | Placer miner | Holds the Nam Suoi Nhum titanium-zircon mine in Ham Thuan Nam |
| Song Binh Minerals Joint Stock Company | Zircon processor | Operates zircon powder production in Lam Dong |
| Duc Canh Trading Company Limited | Placer miner | Holds the Thien Ai 2 mine in Hoa Thang commune |
| Thanh Tam Company Limited | Ilmenite processor | Supplies reduced ilmenite and synthetic rutile from Quang Tri |
| Quang Tri Minerals Joint Stock Company | Ilmenite and zircon processor | Runs reduced ilmenite and zircon flour plants in Quan Ngang |
Credence Research view on Vietnam heavy-sand processing
Credence Research's view is that Vietnam's titanium value will grow as the country moves from raw ilmenite sales to slag, reduced ilmenite, milled zircon and rare earth co-products. Concentrates remain the largest product type, while processed intermediates grow fastest as export rules and provincial plans favor domestic processing. The South Central Coast keeps the largest share because of its licensed reserves. Companies that combine secure licenses, efficient smelting and long-term offtake contracts should gain most by 2035.
How the country estimate was built
The report uses 2025 as the base year on a calendar basis, and market values come from the Credence Research model. That model combines UN Comtrade trade data, United States Geological Survey production and price statistics, government decisions, provincial reports, company annual reports and news coverage. Segment splits and regional growth rates are Credence Research estimates, while regional shares follow the client split. Sources used are official statistics, legal texts, company reports, trade media and company websites, and no interviews or surveys were used.
Domestic processing and metal demand lift value to 2035
The Vietnam titanium minerals and metal market is expected to reach USD 181.1 million by 2035, a 7.97% CAGR during 2026–2035, as processing plants, licensed mines and factories expand. Growth should be strongest in processed intermediates, metallurgy and fabrication and metropolitan locations, because these areas gain most from slag smelting, welding demand and imported titanium mill products. Idle smelters, licensing gaps and weak export demand could slow some projects, while larger provincial planning areas and rare earth co-products should support well-funded processors.
Frequently Asked Questions
How big is the Vietnam titanium minerals and metal market?
Which product type leads the market?
Which region leads the market?
Why did raw ore exports fall?
How do export rules affect producers?
Why is metallurgy and fabrication growing fastest?
Who are the leading companies in the market?
What are the main challenges for producers?
Table of Content
Chapter 1 Market Segmentation
- 1.1 Segmentation Framework
- 1.1.1 Product and Service Classification
- 1.1.2 Application and End-Use Classification
- 1.1.3 Technology and Solution Classification
- 1.1.4 Customer and Distribution Channel Classification
- 1.1.5 Geographic Segmentation
- 1.1.6 Market Segment Definitions and Boundaries
- 1.2 By Product Type
- 1.2.1 Titanium mineral concentrates
- 1.2.2 Processed titanium intermediates
- 1.2.3 Mineral-sand co-products
- 1.2.4 Titanium metal products
- 1.3 By End-Use Industry
- 1.3.1 Pigment manufacturing
- 1.3.2 Ceramics and refractories
- 1.3.3 Metallurgy and fabrication
- 1.4 By Customer Type
- 1.4.1 Integrated manufacturers
- 1.4.2 Specialist processors
- 1.4.3 Merchant buyers
- 1.5 By Sales Channel
- 1.5.1 Direct export contracts
- 1.5.2 Export trading houses
- 1.5.3 Domestic direct supply
Chapter 2 Introduction
- 2.1 Report Objectives and Scope
- 2.2 Product Definition and Industry Terminology
- 2.3 Market Inclusions and Exclusions
- 2.4 Research Process
- 2.4.1 Primary Research and Expert Interviews
- 2.4.2 Secondary Research and Source Review
- 2.4.3 Top-Down and Bottom-Up Estimation
- 2.4.4 Data Triangulation and Verification
- 2.5 Market Size Measurement Basis
- 2.5.1 2025: USD 84.5 million → 2035: USD 181.1 million
- 2.6 Historical and Forecast Reference Periods
- 2.6.1 Historical Period: 2018-2025
- 2.6.2 Base Year: 2025
- 2.6.3 Forecast Period: 2025-2035
- 2.7 Research Assumptions and Limitations
Chapter 3 Executive Summary
- 3.1 Market Snapshot and Key Findings
- 3.2 Base-Year Market Size, 2025
- 3.3 Forecast Market Size, 2035
- 3.4 Revenue and Volume Growth Outlook
- 3.5 Key Demand and Supply Indicators
- 3.6 Leading Market Segments
- 3.7 Fastest-Growing Market Opportunities
- 3.8 Regional Performance Highlights
- 3.9 Technology and Industry Transformation
- 3.10 Competitive Landscape Summary
- 3.11 Analyst View and Strategic Implications
Chapter 4 Vietnam Titanium Minerals and Metal Market Trends and Developments
- 4.1 Historical Industry Development, 2018-2025
- 4.2 Recent Market Trends and Developments
- 4.3 Demand and Customer Behavior Trends
- 4.4 Technology and Product Innovation
- 4.5 Artificial Intelligence, Automation and Digitalization
- 4.6 Local Manufacturing and Supply Chain Realignment
- 4.7 Industry Partnerships, Mergers and Acquisitions
- 4.8 Sustainability and Circular Economy Developments
- 4.9 Government and Private Sector Investment Trends
- 4.10 Emerging Business Models and Commercialization
- 4.11 Industry Developments and Announcements
Chapter 5 Vietnam Titanium Minerals and Metal Market Production, Supply and Demand Analysis
- 5.1 Demand Trend and Consumption Analysis, 2018-2025
- 5.2 Demand Forecast, 2025-2035
- 5.3 Production and Output Trend, 2018-2025
- 5.4 Production and Output Forecast, 2025-2035
- 5.5 Installed Capacity and Capacity Utilization
- 5.6 Company-Wise Production Plants and Statistics
- 5.6.1 Installed Production Capacity
- 5.6.2 Actual Production
- 5.6.3 Planned Capacity and Expansion Targets
- 5.7 Supply Chain Structure and Procurement Trends
- 5.8 Supply-Demand Gap and Bottlenecks
- 5.9 Import Dependence and Sourcing Structure
- 5.10 Contract Manufacturing and Outsourcing
- 5.11 Regional Supply and Demand Concentration
Chapter 6 Vietnam Titanium Minerals and Metal Market Pricing Analysis
- 6.1 Pricing Structure and Measurement
- 6.2 Historical Pricing Trends, 2018-2025
- 6.3 Pricing Outlook, 2025-2035
- 6.4 Average Selling Price and Unit Economics
- 6.5 Pricing by Product and Market Segment
- 6.6 Geographic Pricing Differences
- 6.7 Key Input, Energy, Labor and Logistics Costs
- 6.8 Contract Pricing and Purchasing Models
- 6.9 Pricing Sensitivity and Competitive Positioning
- 6.10 Price, Margin and Profitability Implications
Chapter 7 Vietnam Titanium Minerals and Metal Market Dynamics
- 7.1 Market Growth Drivers
- 7.1.1 Demand-Side Drivers
- 7.1.2 Technology and Innovation Drivers
- 7.1.3 Infrastructure and Investment Drivers
- 7.1.4 Regulatory and Policy Drivers
- 7.2 Market Restraints
- 7.2.1 Cost and Affordability Constraints
- 7.2.2 Technology and Adoption Barriers
- 7.2.3 Supply Chain and Operational Constraints
- 7.3 Market Challenges
- 7.3.1 Competitive Pressure and Margin Erosion
- 7.3.2 Skills, Infrastructure and Implementation Gaps
- 7.4 Emerging Market Opportunities
- 7.5 Market Dynamics Impact and Time-Horizon Assessment
Chapter 8 Vietnam Titanium Minerals and Metal Value Chain Analysis
- 8.1 Industry Value Chain Overview
- 8.2 Upstream Suppliers and Critical Inputs
- 8.3 Technology and Component Providers
- 8.4 Manufacturing or Service Delivery
- 8.5 Distribution, Channel Partners and Integrators
- 8.6 Downstream Applications and End Users
- 8.7 Value Addition and Profit Pools
- 8.8 Vertical Integration and Outsourcing
- 8.9 Supplier Concentration and Risk
- 8.10 Supply Chain Localization and Resilience
Chapter 9 Vietnam Titanium Minerals and Metal Market Regulations and Policies
- 9.1 Relevant Laws, Standards and Compliance Frameworks
- 9.2 Product, Service, Safety and Quality Requirements
- 9.3 Government Policies, Incentives and Subsidies
- 9.4 Imports, Exports and Trade Barriers
- 9.5 Public Procurement and Local Content Requirements
- 9.6 Environmental and Sustainability Compliance
- 9.7 Upcoming Policy Changes and Market Implications
Chapter 10 Vietnam Titanium Minerals and Metal Market Hotspots and Opportunities
- 10.1 Market Opportunity Mapping and Growth Hotspots
- 10.2 High-Growth Applications and Customer Groups
- 10.3 Underserved Markets and White-Space Opportunities
- 10.4 Emerging Technology and Product Opportunities
- 10.5 New Capacity and Investment Hotspots
- 10.6 Market Entry and Expansion Opportunities
- 10.7 Distribution and Partnership Opportunities
- 10.8 Near-Term and Long-Term Commercial Potential
- 10.9 Opportunity Attractiveness and Execution Risks
Chapter 11 Vietnam Titanium Minerals and Metal Market Outlook, 2025-2035
- 11.1 Market Size and Analysis
- 11.1.1 Revenue (Market Measurement: 2025: USD 84.5 million → 2035: USD 181.1 million)
- 11.1.2 Market Volume and Quantity Sold
- 11.1.3 Historical Market Size, 2018-2025
- 11.1.4 Base-Year Market Size, 2025
- 11.2 Market Forecast, 2025-2035
- 11.2.1 Revenue Forecast to 2035
- 11.2.2 Volume Forecast to 2035
- 11.2.3 CAGR and Year-on-Year Growth
- 11.2.4 Incremental Revenue Opportunity
- 11.3 Forecast Assumptions and Scenario Analysis
- 11.3.1 Base-Case Forecast
- 11.3.2 Optimistic and Conservative Scenarios
- 11.3.3 Technology, Pricing and Policy Sensitivities
- 11.4 Market Attractiveness and Growth Outlook
Chapter 12 Vietnam Titanium Minerals and Metal Market Segmentation and Outlook
- 12.1 Segmentation Summary and Market Shares, 2025
- 12.2 Largest and Fastest-Growing Segments
- 12.3 By Product Type - Market Size and Forecast, 2025-2035
- 12.3.1 Segment Definition and Scope
- 12.3.2 Historical Market Size, 2018-2025
- 12.3.3 Revenue Forecast, 2025-2035
- 12.3.4 Volume Forecast, 2025-2035
- 12.3.5 Base-Year Market Share, 2025
- 12.3.6 Segment CAGR and Growth Drivers
- 12.3.7 Subsegment Market Size and Forecast
- 12.3.7.1 Titanium mineral concentrates
- 12.3.7.2 Processed titanium intermediates
- 12.3.7.3 Mineral-sand co-products
- 12.3.7.4 Titanium metal products
- 12.3.8 Subsegment Pricing and Adoption Trends
- 12.3.9 Leading Suppliers and Competition
- 12.3.10 Regional Demand and Opportunities
- 12.4 By End-Use Industry - Market Size and Forecast, 2025-2035
- 12.4.1 Segment Definition and Scope
- 12.4.2 Historical Market Size, 2018-2025
- 12.4.3 Revenue Forecast, 2025-2035
- 12.4.4 Volume Forecast, 2025-2035
- 12.4.5 Base-Year Market Share, 2025
- 12.4.6 Segment CAGR and Growth Drivers
- 12.4.7 Subsegment Market Size and Forecast
- 12.4.7.1 Pigment manufacturing
- 12.4.7.2 Ceramics and refractories
- 12.4.7.3 Metallurgy and fabrication
- 12.4.8 Subsegment Pricing and Adoption Trends
- 12.4.9 Leading Suppliers and Competition
- 12.4.10 Regional Demand and Opportunities
- 12.5 By Customer Type - Market Size and Forecast, 2025-2035
- 12.5.1 Segment Definition and Scope
- 12.5.2 Historical Market Size, 2018-2025
- 12.5.3 Revenue Forecast, 2025-2035
- 12.5.4 Volume Forecast, 2025-2035
- 12.5.5 Base-Year Market Share, 2025
- 12.5.6 Segment CAGR and Growth Drivers
- 12.5.7 Subsegment Market Size and Forecast
- 12.5.7.1 Integrated manufacturers
- 12.5.7.2 Specialist processors
- 12.5.7.3 Merchant buyers
- 12.5.8 Subsegment Pricing and Adoption Trends
- 12.5.9 Leading Suppliers and Competition
- 12.5.10 Regional Demand and Opportunities
- 12.6 By Sales Channel - Market Size and Forecast, 2025-2035
- 12.6.1 Segment Definition and Scope
- 12.6.2 Historical Market Size, 2018-2025
- 12.6.3 Revenue Forecast, 2025-2035
- 12.6.4 Volume Forecast, 2025-2035
- 12.6.5 Base-Year Market Share, 2025
- 12.6.6 Segment CAGR and Growth Drivers
- 12.6.7 Subsegment Market Size and Forecast
- 12.6.7.1 Direct export contracts
- 12.6.7.2 Export trading houses
- 12.6.7.3 Domestic direct supply
- 12.6.8 Subsegment Pricing and Adoption Trends
- 12.6.9 Leading Suppliers and Competition
- 12.6.10 Regional Demand and Opportunities
- 12.7 Segment Growth Comparison
- 12.8 Segment Attractiveness and Priority Matrix
Chapter 13 Vietnam Titanium Minerals and Metal End-Use and Application Market Outlook
- 13.1 End-Use Industry and Customer Demand Structure
- 13.2 Leading Applications and Customer Groups
- 13.3 End-Use Market Size, Share and Forecast
- 13.4 Major End-Use Industry Deep Dives
- 13.4.1 Customer Requirements and Use Cases
- 13.4.2 Demand and Replacement Cycles
- 13.4.3 Technical and Regulatory Considerations
- 13.4.4 Purchasing and Procurement Models
- 13.4.5 Leading Vendors and Distribution Channels
- 13.4.6 Forecast and Commercial Opportunities
- 13.5 Emerging Applications and Cross-Segment Demand
- 13.6 End-Use Industry Investment Priorities
Chapter 14 Vietnam Titanium Minerals and Metal Geographic Market Outlook, 2025-2035
- 14.1 Domestic Market Distribution and Demand Clusters
- 14.2 State- or Province-Wise Market Size and Forecast, 2025-2035
- 14.3 City and Metropolitan Market Outlook
- 14.4 Industrial, Manufacturing and Commercial Clusters
- 14.5 Geographic Concentration of Key End Users
- 14.6 Local Pricing and Purchasing Differences
- 14.7 Domestic Production Facilities and Capacity Map
- 14.8 Local Infrastructure and Project Pipeline
- 14.9 State-Level Policy and Incentive Differences
- 14.10 Subnational Investment Hotspots and Opportunities
- 14.11 Distribution and Logistics Networks
- 14.12 Domestic Competitive Footprint
Chapter 15 Vietnam Titanium Minerals and Metal Technology, Innovation and Sustainability Outlook
- 15.1 Technology Landscape and Maturity
- 15.2 Product, Process and Service Innovation
- 15.3 AI, Automation and Digital Tools in the Industry
- 15.4 Technology Adoption and Performance Benchmarking
- 15.5 Innovation Pipeline and R&D Investment
- 15.6 Patent and Intellectual Property Trends
- 15.7 Energy Efficiency and Resource Management
- 15.8 Sustainability, Recycling and Circularity
- 15.9 Technology Roadmap, 2025-2035
- 15.10 Risks of Obsolescence and Technology Substitution
Chapter 16 Vietnam Titanium Minerals and Metal Market Key Strategic Imperatives
- 16.1 Growth and Market Entry Priorities
- 16.2 High-Return Products and Segments
- 16.3 Pricing, Profitability and Cost Optimization
- 16.4 Technology Investment and Product Differentiation
- 16.5 Supply Chain Localization and Resilience
- 16.6 Distribution and Customer Acquisition
- 16.7 Partnership, Acquisition and Capacity Strategy
- 16.8 Regional Expansion Priorities
- 16.9 Short-, Medium- and Long-Term Actions
Chapter 17 Competition Outlook
- 17.1 Industry Competition Characteristics
- 17.2 Market Structure and Concentration
- 17.3 Market Share and Competitive Positioning, 2025
- 17.4 Company-Wise Revenue and Product Benchmarking
- 17.5 Production and Service Capacity Benchmarking
- 17.6 Technology, Pricing and Differentiation
- 17.7 Regional Footprint and Distribution Strength
- 17.8 Mergers, Acquisitions and Strategic Alliances
- 17.9 New Entrants and Competitive Threats
- 17.10 Porter's Five Forces and Industry Attractiveness
- 17.11 Competitive Outlook, 2025-2035
Chapter 18 Company Profiles
- 18.1 Company Coverage and Selection Criteria
- 18.2 Binh Dinh Minerals Joint Stock Company
- 18.2.1 Business Description
- 18.2.2 Company Ownership and Geographic Presence
- 18.2.3 Product and Service Portfolio
- 18.2.4 Manufacturing and Operating Footprint
- 18.2.5 Production Capacity and Expansion Plans
- 18.2.6 Financial Performance and Investment
- 18.2.7 Market Share and Competitive Position
- 18.2.8 Technology and Innovation Capabilities
- 18.2.9 Strategic Alliances or Partnerships
- 18.2.10 Recent Developments
- 18.2.11 Growth Strategy and Outlook
- 18.3 Thanh Tam Company Limited
- 18.4 Song Binh Minerals Joint Stock Company
- 18.5 East Minerals Binh Dinh Company Limited
- 18.6 Tan Quang Cuong Trading Company Limited
- 18.7 Quang Tri Minerals Joint Stock Company
- 18.8 Phu Hiep Company Limited
- 18.9 Anh Vy Trading Company Limited
- 18.10 Ban Mai Mineral Company Limited
- 18.11 Duc Canh Trading Company Limited
- 18.12 Other Relevant Market Participants
Note: Every listed company is profiled on the structure shown under the first company. The company list is preliminary and may change based on research findings, market developments, data availability and client requirements.
Chapter 19 Disclaimer
- 19.1 Research and Forecast Disclaimer
- 19.2 Data Source and Estimation Limitations
Note: The depth of individual sections depends on data availability for this market. Volume, capacity, trade and other unit-based metrics are included where applicable.

