
EV programs and local sourcing reshape molded part demand
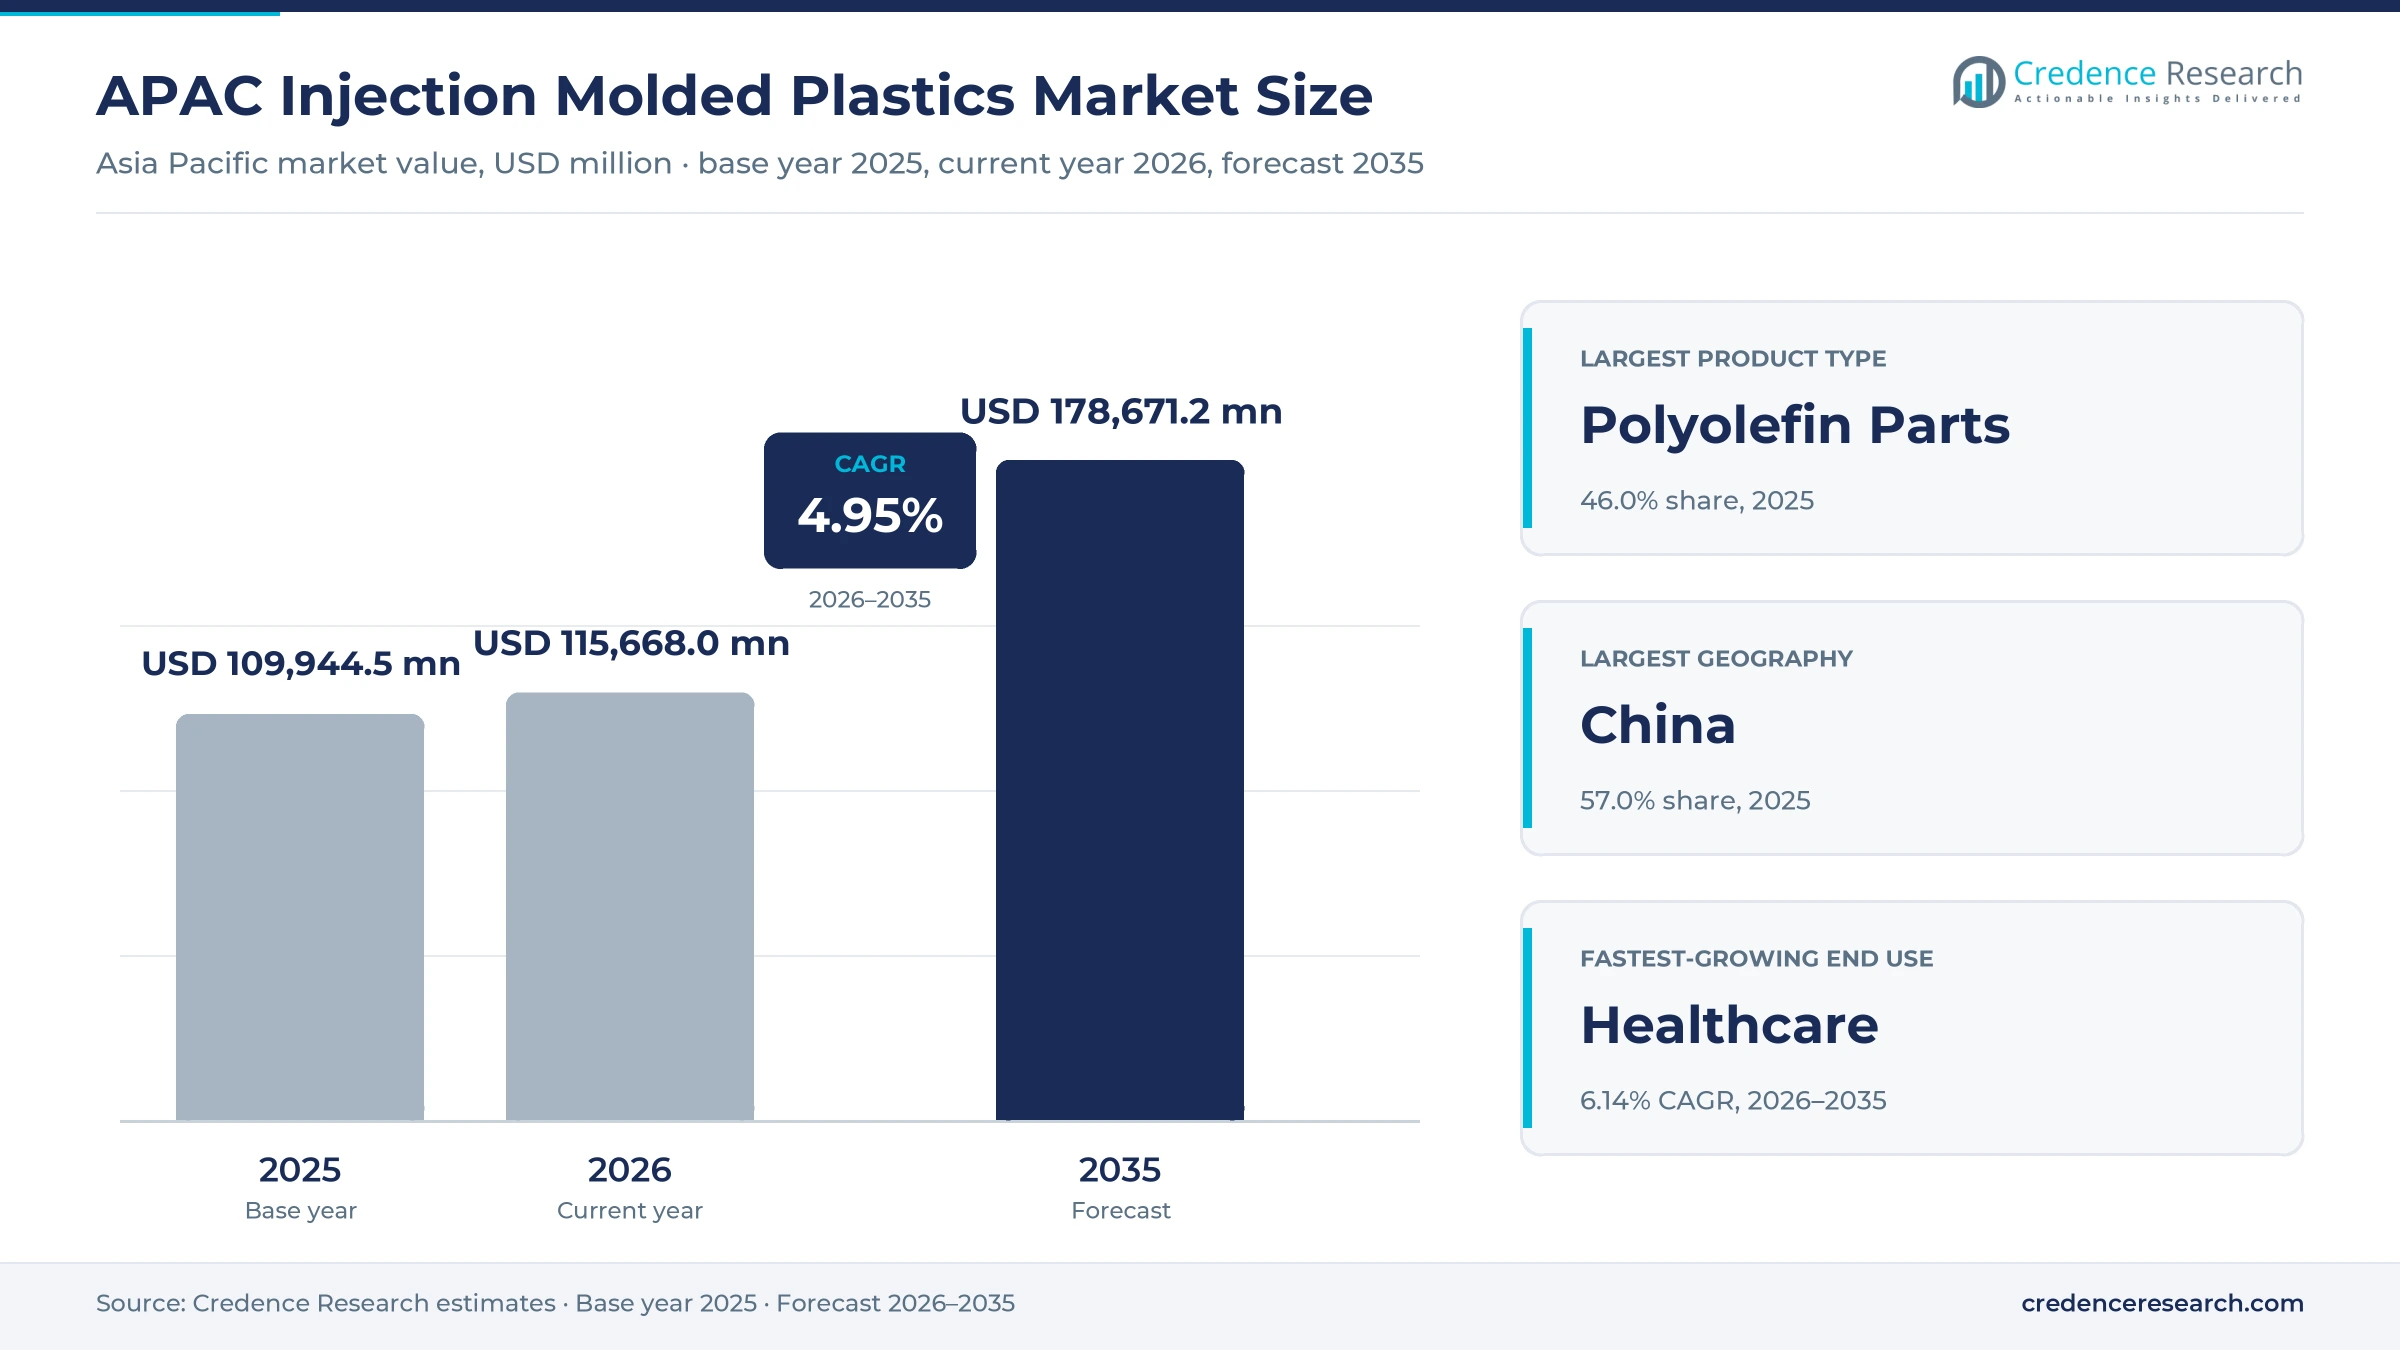
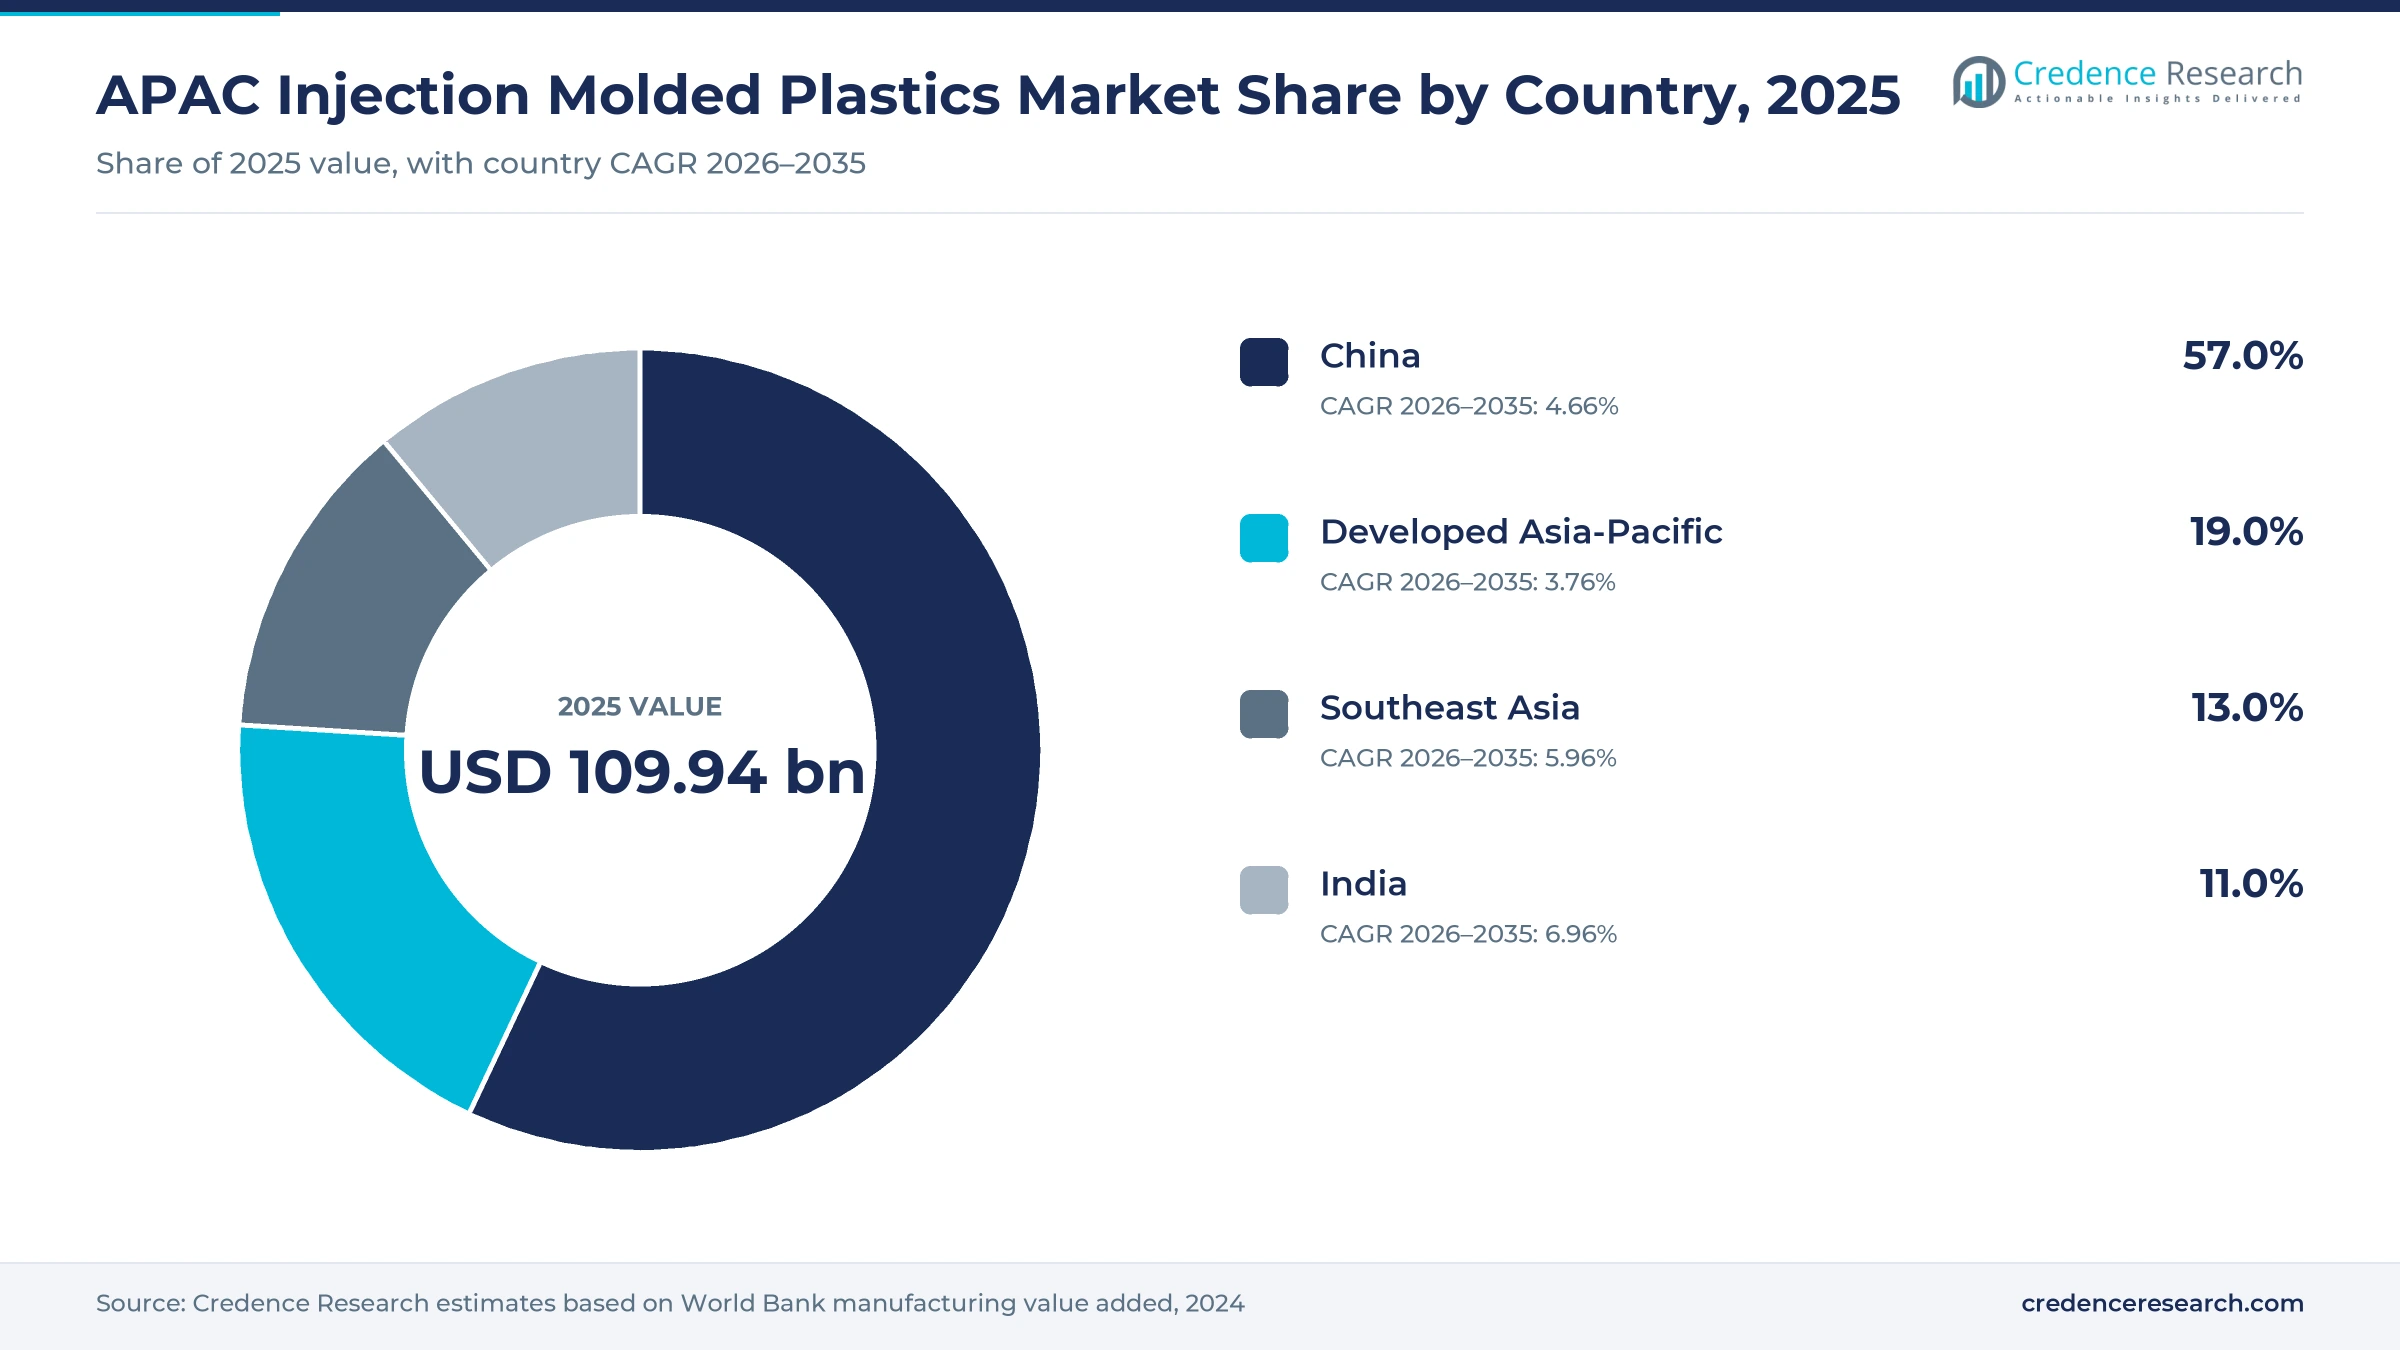
The APAC injection molded plastics market was valued at USD 109.94 billion in 2025 and is projected to increase from USD 115.67 billion in 2026 to USD 178.67 billion by 2035, registering a CAGR of 4.95% during 2026–2035. Demand comes from packaging lines, car assembly plants, electronics factories, medical device makers and furniture and building product brands that buy molded parts in high volume. China held the largest share, 57.0% in 2025, because its auto, appliance and packaging plants run the deepest supplier base in the region. India is the fastest-growing geography at 6.96% a year, as carmakers, pipe-fitting and furniture brands and contract medical molders add plants. Regional ownership is also consolidating, and SCG Packaging completed its purchase of the remaining stake in Vietnamese rigid packaging maker Duy Tan Plastic in June 2025.
Which molded parts and buyers does the estimate cover?
The estimate measures the value of thermoplastic parts made by injection molding in China, India, Southeast Asia and developed Asia-Pacific economies, covering polyolefin, styrenic, engineering and specialty resin parts. It counts containers, closures, housings, brackets, connectors, fluid parts and visible trim sold under program contracts, from catalogs, through distributors or made in house by brand owners.
The estimate excludes blow-molded bottles, extruded pipe and film, thermoformed trays, raw resin and the molding machines themselves. The value chain runs from resin and compound suppliers through toolmakers and molders to packagers, carmakers, electronics assemblers, medical device firms and building product brands that place the finished parts into their own goods.
APAC Injection Molded Plastics Market Insights
- The APAC injection molded plastics market was valued at USD 109.94 billion in 2025 and is projected to reach USD 178.67 billion by 2035, registering a CAGR of 4.95% during 2026–2035.
- China held a 57.0% share of 2025 value, because it produced 34.531 million vehicles in 2025 and hosts the largest packaging and appliance base.
- Polyolefin parts led product demand with a 46.0% share of 2025 value, because caps, crates, containers and furniture use low-cost polypropylene and polyethylene.
- China produced 16.626 million new energy vehicles in 2025, up 29%, which shifts molded part demand toward battery, thermal and lighting parts.
- SCG Packaging completed its purchase of all of Duy Tan Plastic in June 2025, which shows regional groups buying scale in rigid packaging.
Polyolefin parts lead as engineering resins gain share
Why do polyolefin parts lead product demand?
Based on product type, the market is categorized into polyolefin parts, styrenic parts, engineering thermoplastic parts and specialty thermoplastic parts. Polyolefin Parts led with a 46.0% share of 2025 value, because closures, crates, household goods and molded chairs rely on low-cost polypropylene and polyethylene. Specialty Thermoplastic Parts grow fastest at 5.84% a year, as battery, connector and drug-delivery parts need heat resistance and tight tolerances.
How does packaging stay the largest end use?
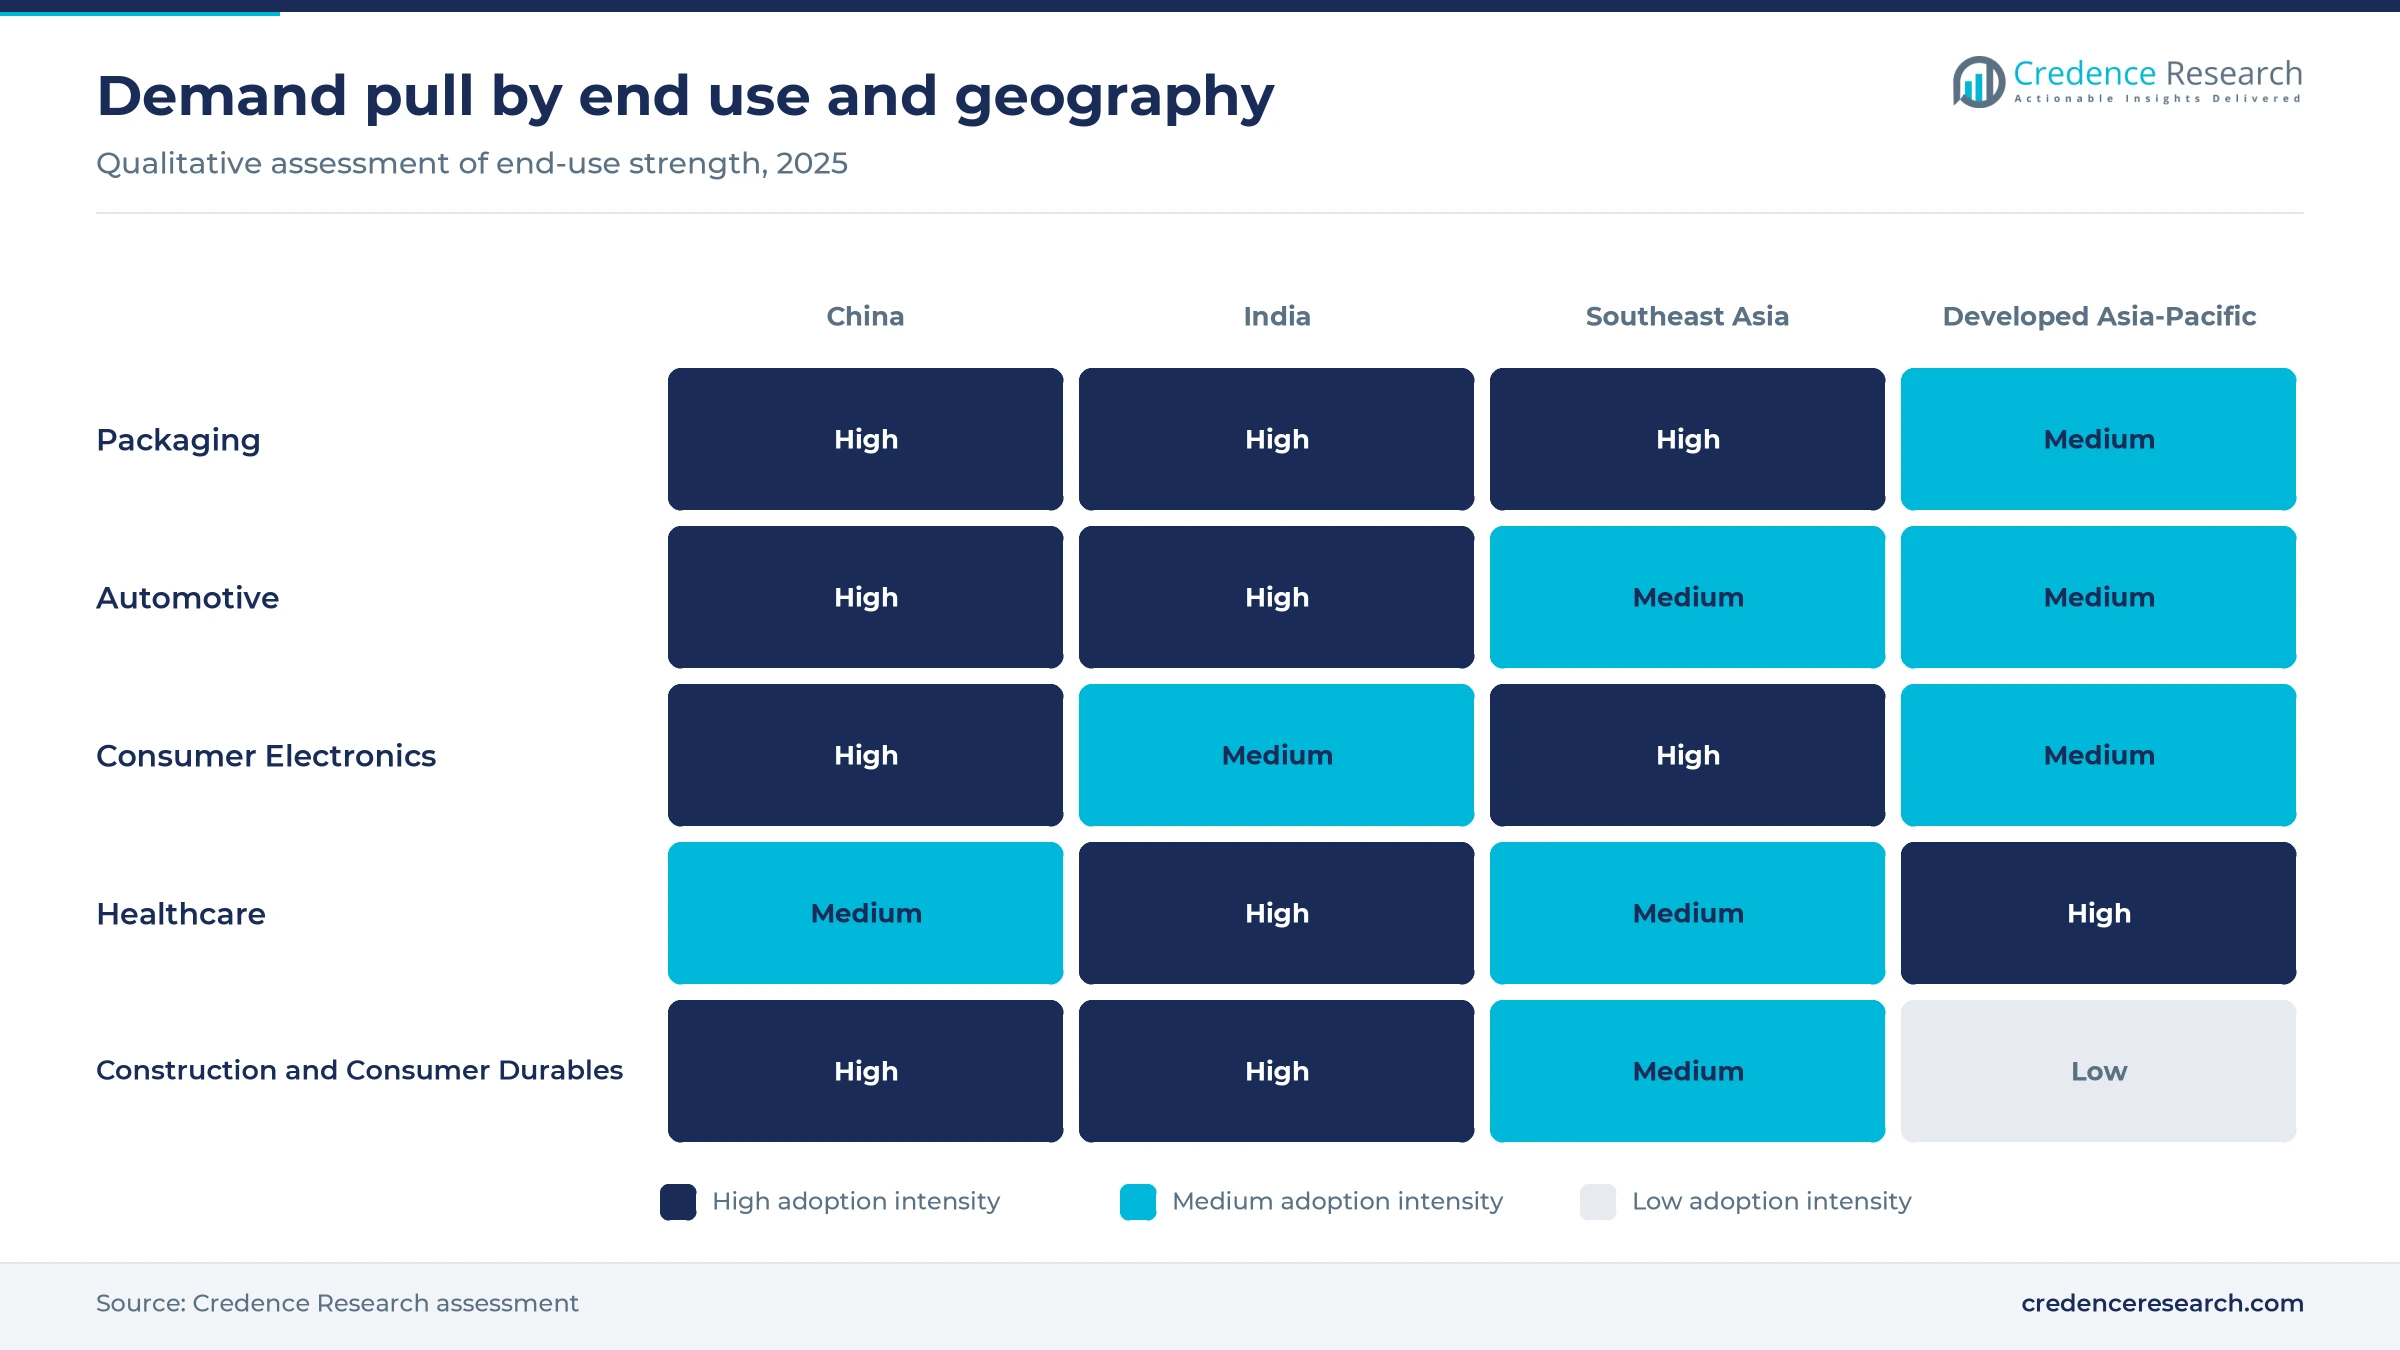
Based on end-use industry, the market is categorized into packaging, automotive, consumer electronics, healthcare and construction and consumer durables. Packaging led with a 34.0% share of 2025 value, because food, dairy and personal care brands in China, India and Vietnam buy closures and tubs in huge volumes. Healthcare grows fastest at 6.14% a year, as pen injectors and diagnostic housings move to Asian molders.
Why do containment and closure parts lead applications?
Based on application, the market is categorized into containment and closure, housing and structural support, connection and fluid management, and surface and functional components. Containment and Closure led with a 38.0% share of 2025 value, because packaging volumes dwarf other uses by part count. Housing and Structural Support grows fastest at 5.30% a year, as electric vehicles and electronics need more battery covers, brackets and device enclosures.
How do program contracts shape the sales channel mix?
Based on sales channel, the market is categorized into direct program contracts, direct catalog sales, distributor sales and captive internal supply. Direct Program Contracts led with a 44.0% share of 2025 value, because carmakers and device brands award parts for the life of a model. The same channel also grows fastest at 5.36% a year, as new vehicle and drug-delivery programs are sourced from tier-one suppliers rather than in-house shops.
| Segment Group | Leading Sub-segment | Share, 2025 | Fastest-growing Sub-segment | CAGR, 2026–2035 |
|---|---|---|---|---|
| By Product Type | Polyolefin Parts | 46.0% | Specialty Thermoplastic Parts | 5.84% |
| By End-Use Industry | Packaging | 34.0% | Healthcare | 6.14% |
| By Application | Containment and Closure | 38.0% | Housing and Structural Support | 5.30% |
| By Sales Channel | Direct Program Contracts | 44.0% | Direct Program Contracts | 5.36% |
Request a Free Sample
Fill in your details and we'll send you a free sample report.
- Sample data tables & charts
- Research methodology
EV output, local car plants and medical molding lift orders
How does electrified vehicle output raise part demand?
Battery packs, thermal loops, charging ports and lighting add plastic content that combustion engines never needed, so each new electric platform brings a fresh round of molded part awards for regional suppliers. China produced 16.626 million new energy vehicles in 2025, up 29% from 2024, according to figures from the China Association of Automobile Manufacturers reported by Xinhua. FORVIA states that electric vehicles make up 46% of its sales in China, where it runs more than 80 sites and serves more than 40 global and Chinese automakers. As a result, automotive parts grow faster than the market, and specialty thermoplastic parts lead product growth at 5.84% a year because battery, sensor and connector parts need heat-resistant grades.
Why does localized automotive manufacturing lift orders?
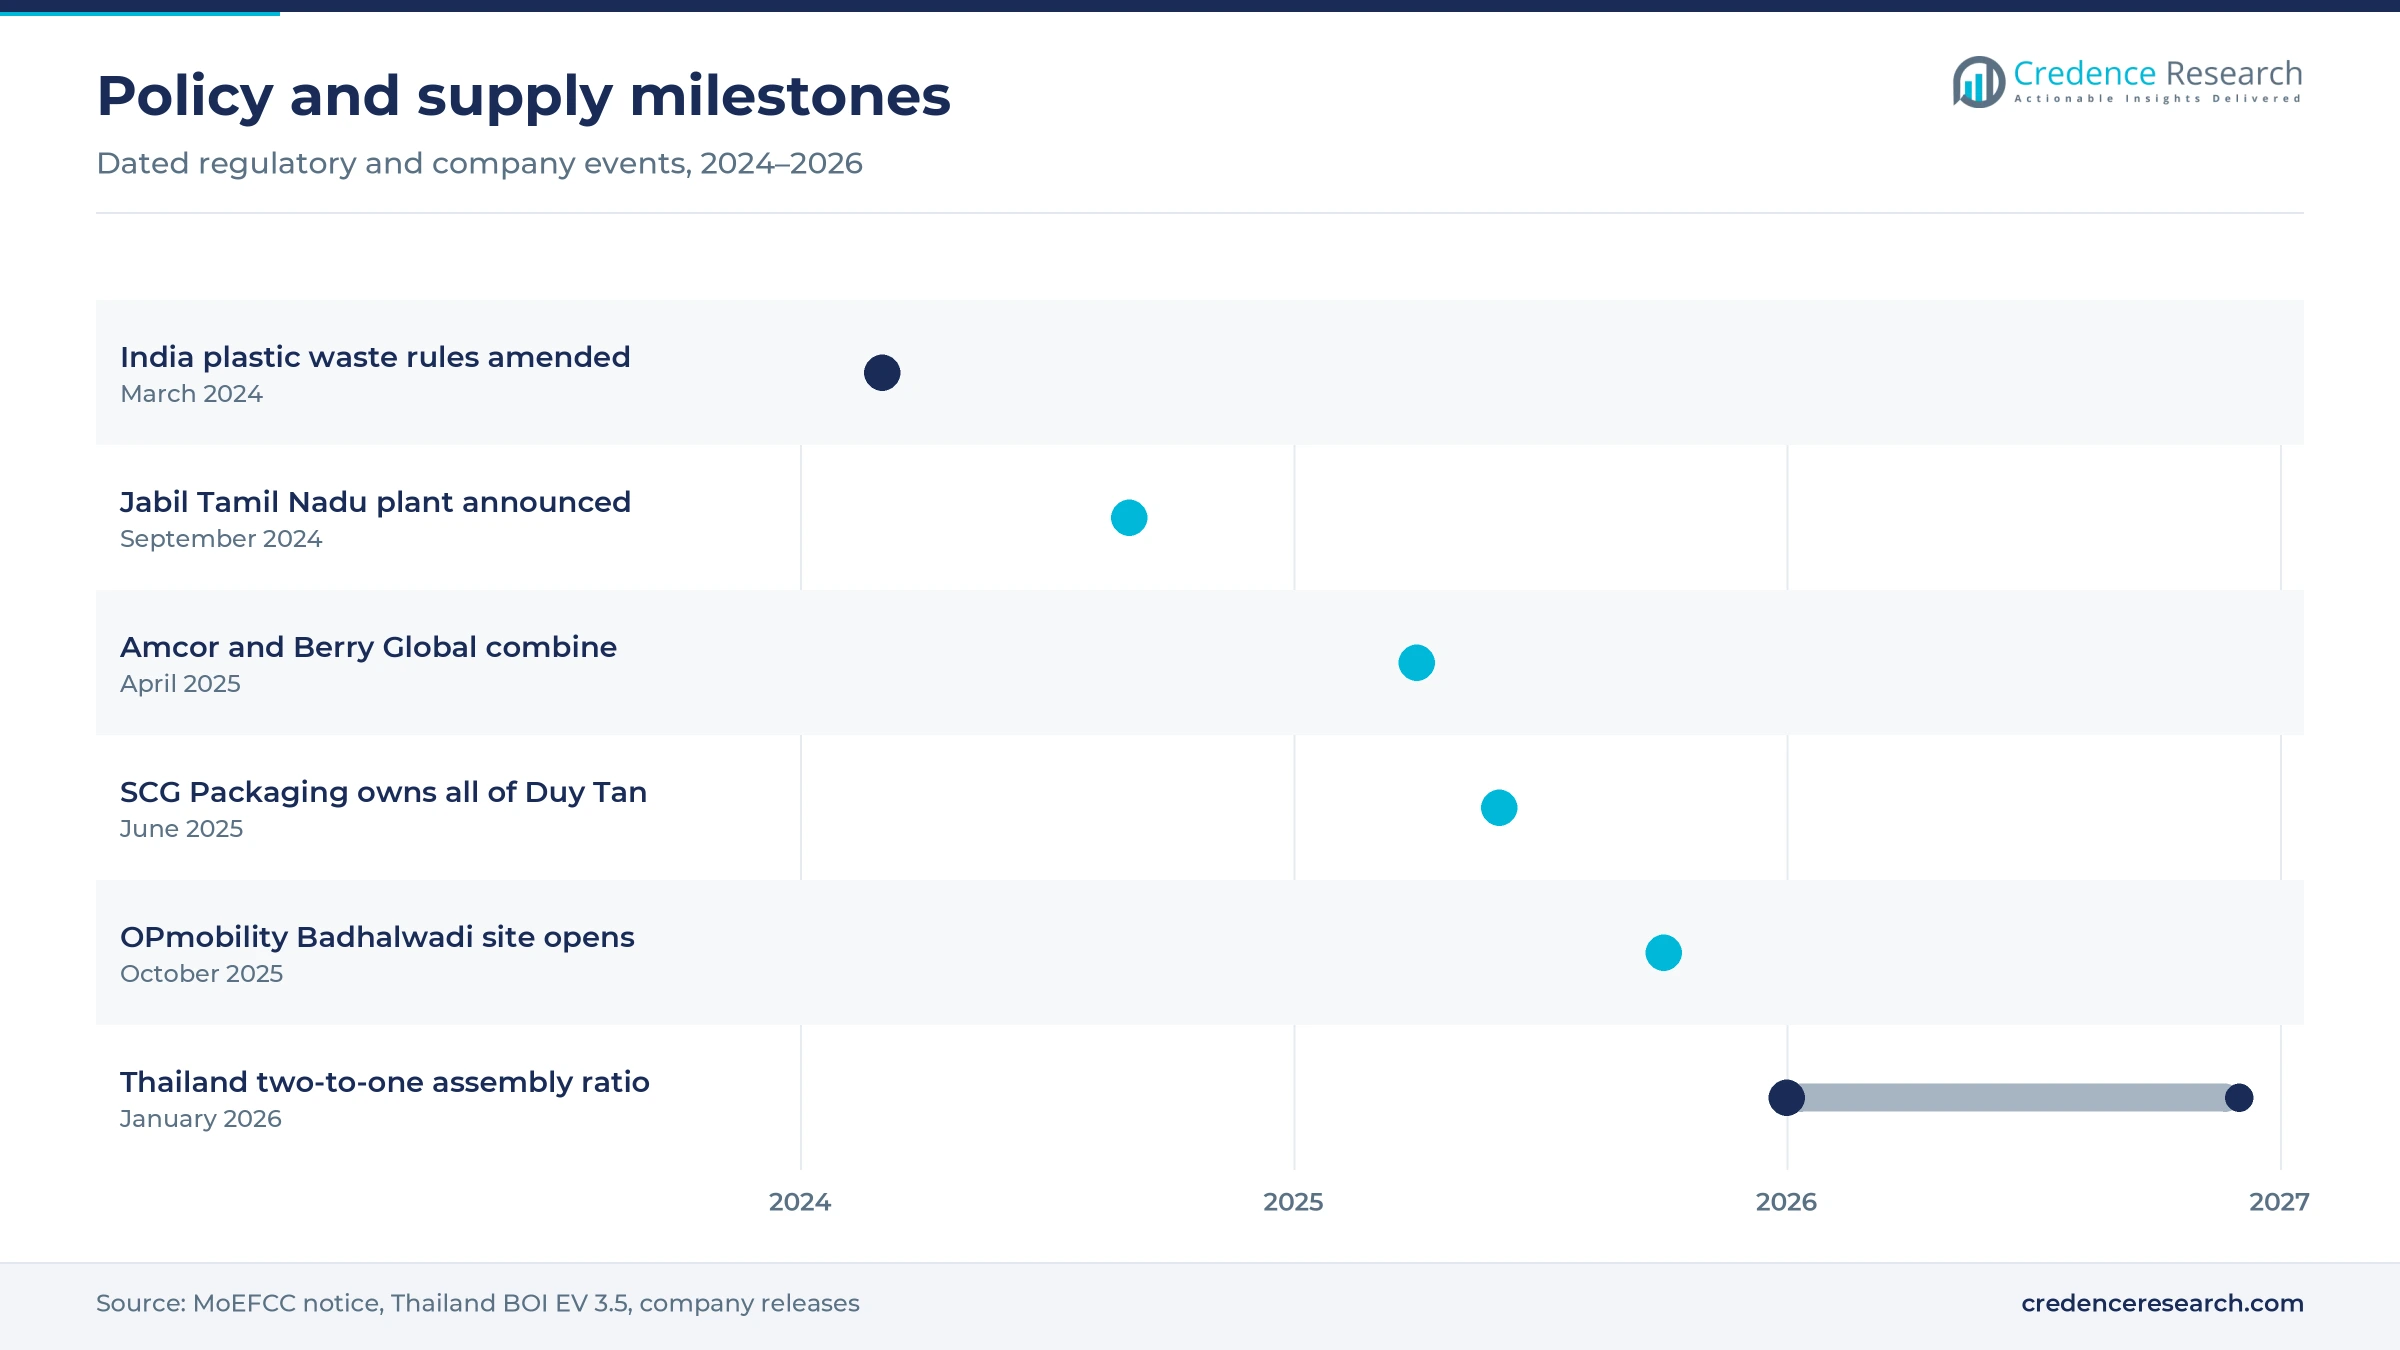
Localized vehicle assembly lifts orders for regional molders, because carmakers want bumpers, panels and modules made close to the line to cut freight and duty. Under Thailand's EV 3.5 scheme, importers that took tax relief must assemble two vehicles locally for every imported unit from 2026 and three by 2027. OPmobility opened a site in Badhalwadi, Maharashtra, in October 2025 and is building a second plant in Kharkhoda, Haryana, adding to five operating Indian plants that supply over one-third of vehicles made in India. Thailand also cut the excise rate on eligible battery electric vehicles to 2%, which pulls more assembly and part sourcing into the country. In turn, automotive is the second-largest end use and direct program contracts lead sales channels with 44.0% of 2025 value.
How is precision healthcare manufacturing moving to Asia?
Drug makers now want second sources in Asia for pen injectors, inhaler parts and diagnostic housings, which sends validated tooling and cleanroom work to Indian and Southeast Asian molders. Shaily Engineering Plastics added 19 molding machines in the quarter to September 2025, signed four healthcare projects including GLP-1 therapies and runs ISO Class 8 cleanrooms in Gujarat, according to its Nov. 8, 2025, filing. India also runs a production-linked incentive scheme for medical devices with an outlay of 3,420 crore rupees through fiscal 2027-28. As a result, healthcare is the fastest-growing end use at 6.14% a year, although it starts from a small base and depends on customer audits that take many months.
Why does packaging and household demand keep volumes high?
Rising incomes in India and Southeast Asia lift purchases of packaged food, chairs, crates and storage products, which keeps the largest share of injection molded plastics volume in everyday consumer goods. Supreme Industries sold 753,907 metric tons of plastic goods in fiscal 2025-26, up 11.77%, and plans capital spending of more than 1,000 crore rupees in fiscal 2026-27. The Vietnam Plastics Association expected 2024 national plastics output of 11.65 million metric tons from more than 4,000 producers, with exports forecast to rise 26.7%. In turn, packaging remains the largest end use with a 34.0% share of 2025 value, and polyolefin parts lead product types because these goods use low-cost polypropylene and polyethylene.
Consolidation, EPR rules and new Indian capacity advance
Why is rigid packaging ownership consolidating?
Regional rigid packaging is shifting toward fewer, larger owners, because brand customers want suppliers with multi-country plants and recycled resin access. SCG Packaging completed its purchase of all of Duy Tan Plastic in June 2025 for more than 2.8 trillion dong, after first buying a 70% stake in 2021, according to Viet Nam News. Amcor completed its all-stock combination with Berry Global on April 30, 2025, joining two large consumer and healthcare packaging groups under one owner. As a result, smaller molders in Vietnam, Thailand and Indonesia face buyers with more pricing power, and containment and closure parts keep a 38.0% share of 2025 value.
How do producer responsibility rules change resin choices?
Producer responsibility rules are rising across the region, which changes how molders source resin and label parts. India notified the Plastic Waste Management Amendment Rules on March 14, 2024, extending producer duties to intermediate material makers and contract manufacturers and requiring raw material buyers to be registered. Compostable items must now be labeled for industrial composting only, and biodegradable claims need a stated number of days. Raw material makers and importers in India must also file quarterly returns and an annual report by June 30, while compostable items must meet IS/ISO 17088:2021. In turn, molders invest in recycled polypropylene lines and traceable resin records to keep packaging contracts.
Can new Indian plants lift fittings and furniture work?
New Indian capacity creates an opening for tool makers, resin suppliers and contract molders, because domestic brands are building plants in states that had little molding capacity. Supreme Industries plans piping plants in Patna, Jammu and Gadegaon and a material handling plant in Malanpur, taking total capacity to about 1.35 million metric tons. Nilkamal reported 9% plastics volume growth in the quarter to September 2024 and ended that quarter with 1,577 retail outlets after 92 net additions. As a result, construction and consumer durables hold a sizable share of demand, and Indian molders that supply chairs, crates and fittings gain steady volume.
Can electronics relocation lift molded housing demand?
Electronics relocation opens new work for molders of housings, frames and connectors, because assemblers want local plastic suppliers near new final assembly lines. Jabil announced a 2,000 crore rupee manufacturing plant in Tiruchirappalli, Tamil Nadu, in September 2024, with about 5,000 jobs expected, according to Deccan Herald. Vietnam's plastics sales were estimated at about 31.1 billion dollars in 2024, up 23.9%, according to its industry association, which expects national output to reach 16.36 million metric tons by 2029. In turn, housing and structural support parts gain share as device makers diversify away from single-country sourcing and ask local molders to qualify housings, frames and connector bodies.
Resin swings, overcapacity and recycling costs test molders
Why do resin price swings squeeze molder margins?
Resin makes up most of the cost of a commodity molded part, so swings in polypropylene and polyethylene prices move margins quickly. Smaller molders on short contracts cannot pass increases to large brand customers within the same quarter. As a result, they lose margin when naphtha or propane costs rise, and they often lack hedging tools. Larger firms reduce the risk through index-linked contracts, multiple resin suppliers and longer purchase agreements with petrochemical producers.
How does overcapacity in China pressure regional pricing?
China's molding base grew alongside its vehicle and appliance output, which leaves capacity that competes hard for export business when home demand slows. Molders in Thailand, Vietnam and India then face lower bids on commodity housings and closures. Consequently, regional firms must compete on tooling skill, delivery and quality certificates rather than price alone. Suppliers that shift toward engineering resin and medical parts reduce this pressure, because those programs depend on approvals rather than lowest bids.
Why do recycling and compliance rules raise costs?
Producer responsibility rules in India and planned schemes elsewhere add registration, reporting and recycled content costs for packaging molders. Small and medium firms, which make up about 90% of Vietnam's plastics producers, have less staff to manage these filings. As a result, compliance costs fall heavily on the smallest molders. Group purchasing of recycled resin and shared compliance services through trade bodies can ease the burden for firms that lack dedicated environmental and regulatory staff.
How do tooling lead times slow new programs?
Multi-cavity and multi-component molds take months to design, cut and validate, which delays program launches for new vehicles and devices. Toolmakers with medical and automotive approvals are scarce outside China and Japan. Consequently, molders in India and Southeast Asia sometimes import tools and wait for trials abroad. Local tool rooms, mold-flow simulation software and standard mold bases help shorten these lead times, and several Indian molders now build tools in house.
China anchors volume while India grows fastest to 2035
| Country | Value, 2025 (USD billion) | Share, 2025 | CAGR, 2026–2035 |
|---|---|---|---|
| China | 62.67 | 57.0% | 4.66% |
| Developed Asia-Pacific | 20.89 | 19.0% | 3.76% |
| Southeast Asia | 14.29 | 13.0% | 5.96% |
| India | 12.09 | 11.0% | 6.96% |
China holds the deepest automotive and packaging base
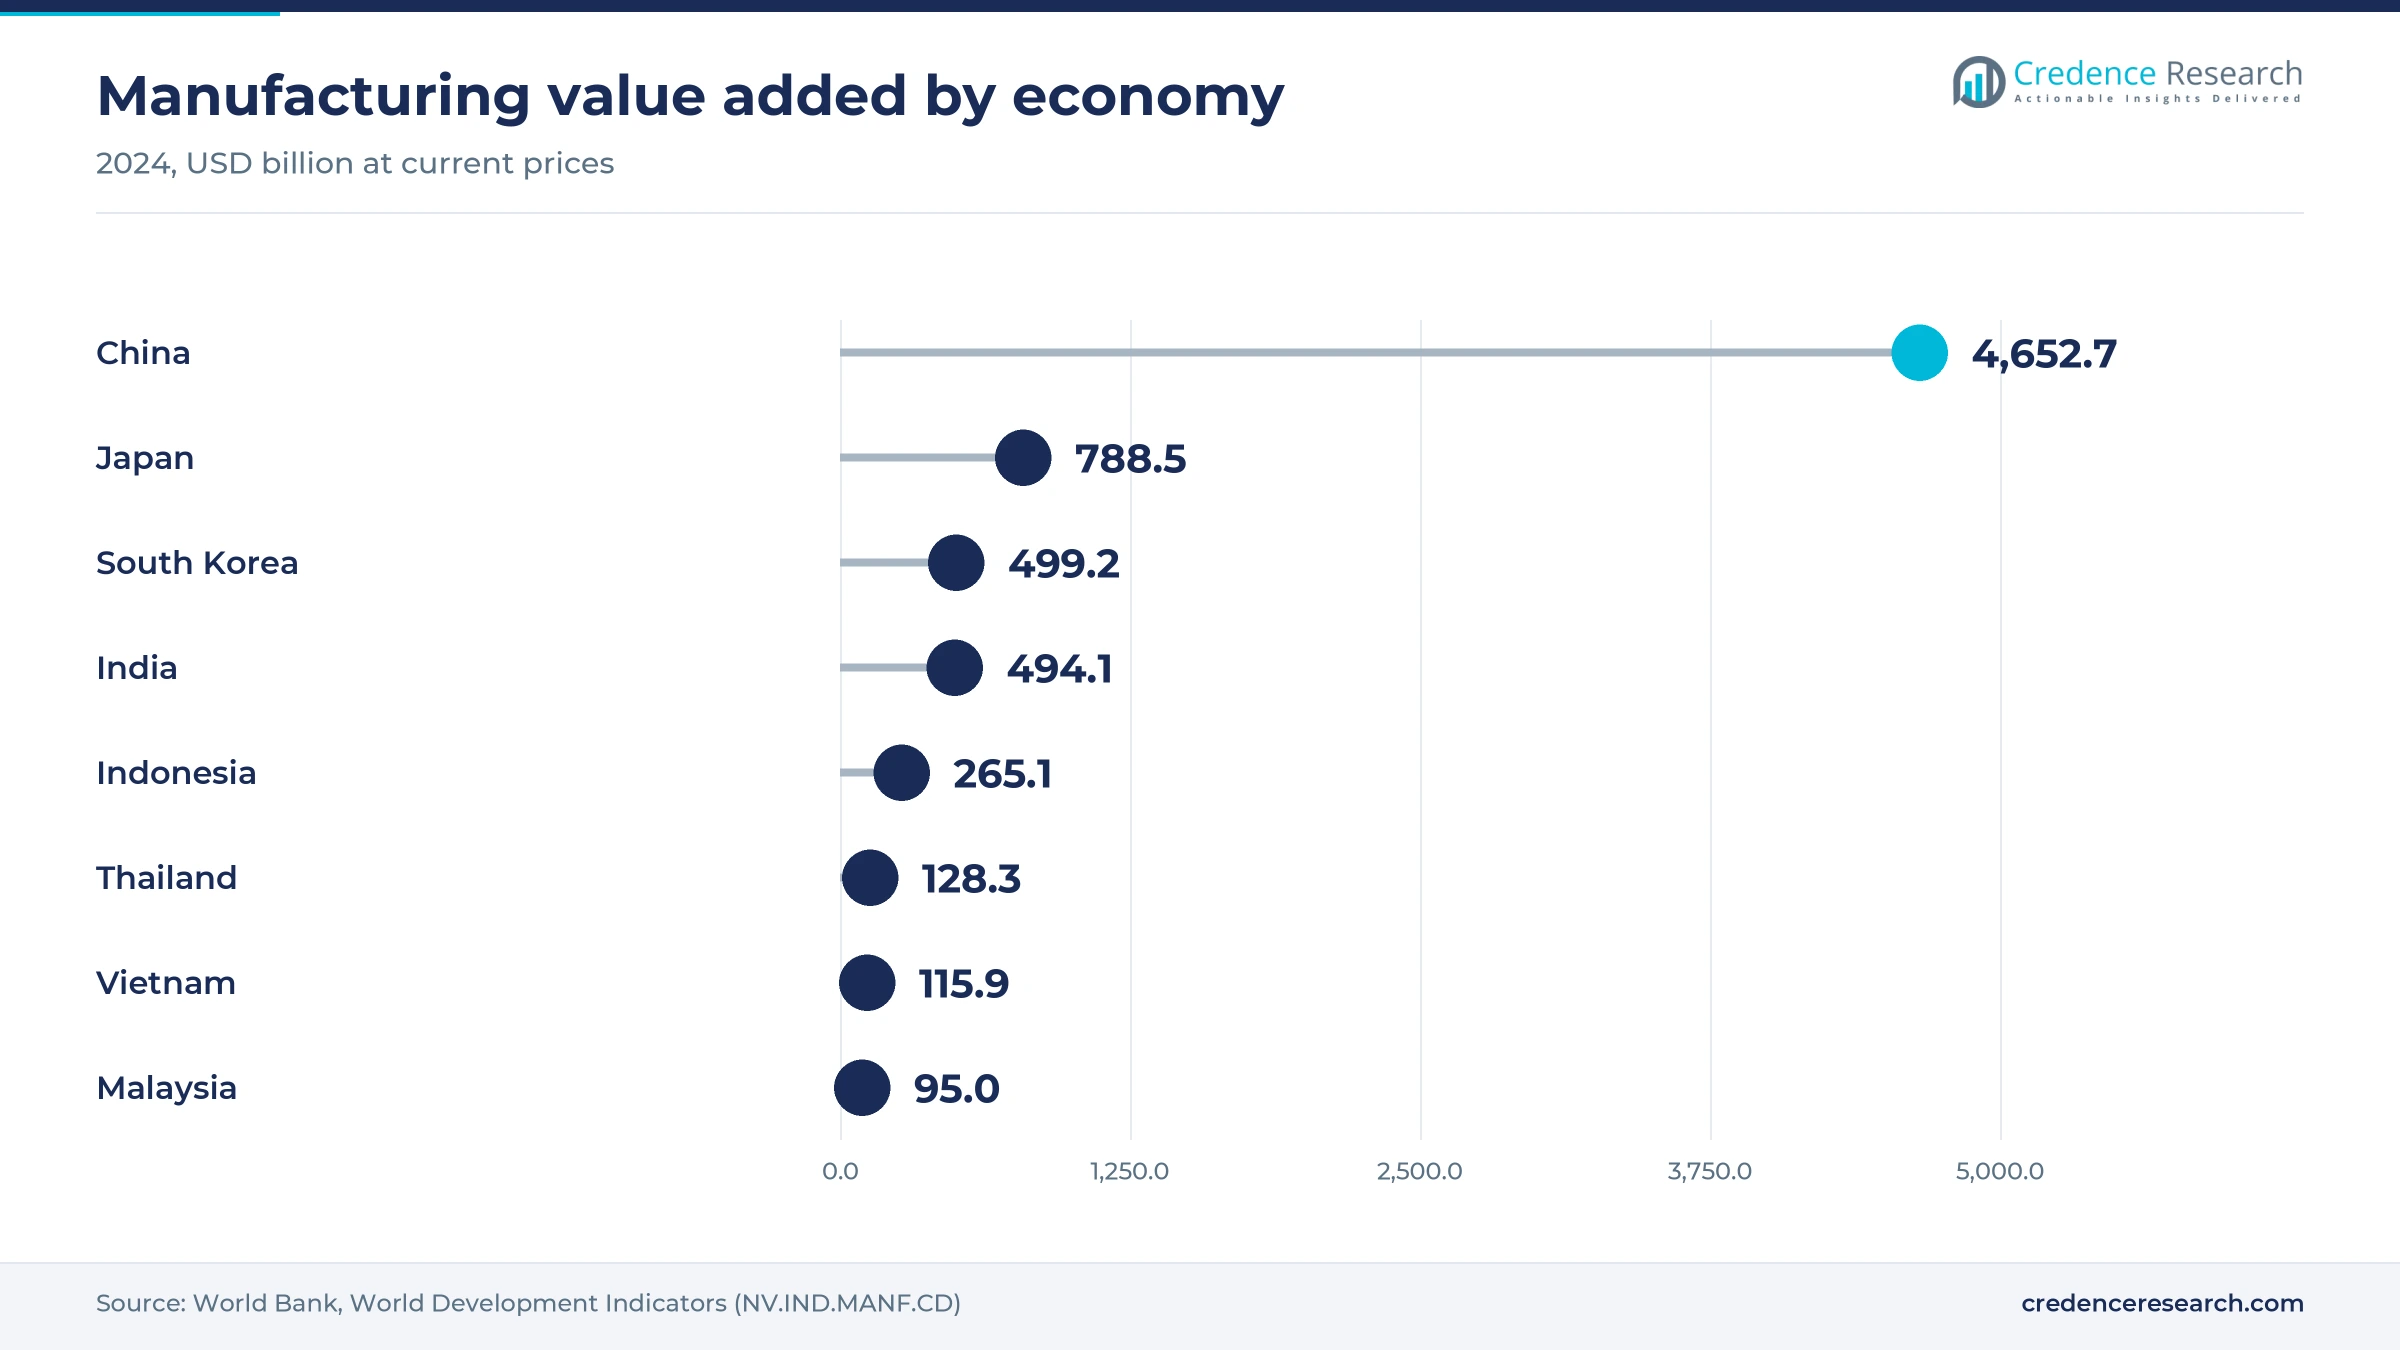
China held 57.0% of 2025 value and grows at 4.66% a year, because its auto, appliance, electronics and packaging plants form the largest molding base in the world. China generated about 4.65 trillion dollars of manufacturing value added in 2024, according to World Bank data. OPmobility and Yanfeng agreed in November 2025 to add lighting and module assembly to their YFPO venture, which will run 38 plants in China serving new electric and hybrid vehicle makers.
Developed Asia-Pacific relies on precision and export parts
Developed Asia-Pacific, covering Japan, South Korea, Australia and New Zealand, held 19.0% of 2025 value and grows at 3.76% a year. Japan and South Korea produced about 788.5 billion and 499.2 billion dollars of manufacturing value added in 2024, which supports precision automotive, electronics and medical molding. Growth is slower than elsewhere, because domestic vehicle output is mature and many programs move to Thai, Chinese or Indian plants.
Southeast Asia gains from packaging and EV assembly
Southeast Asia held 13.0% of 2025 value and grows at 5.96% a year, led by Thailand, Vietnam, Indonesia and Malaysia. Thailand's EV 3.5 local assembly ratios push carmakers to source bumpers, panels and battery parts from local molders. Vietnam's more than 4,000 plastics producers, about 90% of them small and medium firms, supply packaging and household goods at home and to more than 170 export markets.
India adds share through cars, pipes and medical parts
India held 11.0% of 2025 value and grows at 6.96% a year, the fastest pace in the region. Supreme Industries, Nilkamal and Shaily Engineering Plastics are adding machines and plants, while OPmobility and Jabil expand assembly that pulls molded parts. India also tightened plastic waste rules in March 2024, which pushes packaging molders toward registered resin sources and recycled grades used in caps and closures.
Plant, merger and joint venture moves from 2024 to 2026
| Development | Status and market relevance |
|---|---|
| In September 2024, Jabil announced a 2,000 crore rupee manufacturing plant in Tiruchirappalli, Tamil Nadu, with about 5,000 jobs expected. | Announced; adds demand for local housings and connectors near electronics assembly |
| In April 2025, Amcor completed its all-stock combination with Berry Global, joining two large container and closure molders. | Completed April 30, 2025; widens regional rigid packaging capacity |
| In June 2025, SCG Packaging completed its purchase of the remaining stake in Vietnam's Duy Tan Plastic. | Completed; full ownership of a leading Vietnamese rigid packaging maker |
| In October 2025, OPmobility opened its Badhalwadi site in Maharashtra for exterior and energy storage systems. | Operating; a Kharkhoda, Haryana plant follows from early 2026 |
| In November 2025, OPmobility and Yanfeng agreed to add lighting and module assembly to their Chinese venture YFPO. | Pending Chinese approval; YFPO to run 38 plants in China |
Multi-shot tools, insert molding and cleanrooms advance
- Multi-component molding combines two or more resins in one cycle, which removes assembly steps for seals, soft-touch grips and lighting lenses.
- Insert molding overmolds metal terminals and busbars, which suits battery connectors and sensor housings in electric vehicles.
- Assisted injection molding uses gas or microcellular foaming to cut weight and sink marks in large panels and furniture.
- Cleanroom molding runs presses inside ISO-classified cleanrooms, which medical buyers require for pen injectors and diagnostic parts, and Shaily Engineering Plastics operates ISO Class 8 rooms in Gujarat for export and pharmaceutical work.
Need a Custom Version of This Report?
Tailor the scope, geography, or segments to your exact requirements.
- Custom geography or segment scope
- Direct access to our analyst team
Tier-one suppliers and local molders split the field
Competition splits between global tier-one suppliers that win multi-year vehicle and device programs and local molders that serve packaging, furniture and building product brands at low cost. OPmobility and FORVIA compete for exterior, lighting and interior programs with Chinese carmakers, and OPmobility also supplies Indian assembly lines, using joint ventures and local engineering to win new electric vehicle platforms. Amcor and Duy Tan Plastics compete in rigid containers and closures, where recycled resin access and multi-country plants matter to brand owners. Supreme Industries and Nilkamal lead Indian household, furniture and material handling products through dealer networks. Shaily Engineering Plastics and Jabil compete for drug-delivery and electronics programs that require cleanrooms and validated tooling, the same base that serves medical device contract manufacturing in the region. Minth Group, a Hong Kong-listed auto parts maker, builds electric vehicle battery housings for automakers. As a result, scale, customer approvals and resin sourcing decide who wins long contracts.
Companies profiled and their roles in this market
| Company | Type | Role in the market |
|---|---|---|
| OPmobility | Automotive tier-one supplier | Exterior systems and lighting through the YFPO venture in China and five Indian plants |
| FORVIA | Automotive tier-one supplier | More than 80 sites in China with electric vehicles at 46% of its China sales |
| Amcor | Packaging group | Rigid containers and closures after the April 2025 Berry Global combination |
| Duy Tan Plastics | Rigid packaging molder | Vietnamese packaging maker fully owned by SCG Packaging since June 2025 |
| Supreme Industries | Diversified plastics processor | Pipes, furniture and material handling, with capacity near 1.35 million metric tons |
| Nilkamal | Molded furniture and material handling | Indian molded furniture and crates sold through 1,577 outlets |
| Shaily Engineering Plastics | Precision contract molder | Over 200 molding machines in Gujarat, with GLP-1 pen projects |
| Jabil | Contract manufacturer | New Tamil Nadu plant announced in September 2024 |
Credence Research view on regional molded part demand
Credence Research's view is that the regional injection molded plastics market will grow steadily rather than sharply, because packaging and household goods hold most of the volume and track consumer spending. The faster growth sits in electric vehicle, electronics and medical parts, where engineering resins, cleanrooms and long program contracts raise value per part. China remains the base for volume, while India and Southeast Asia gain share as carmakers and device firms localize production. Molders that secure customer approvals, recycled resin supply and multi-shot tooling should capture the best margins through 2035.
How the regional molded part estimate was built
The report uses 2025 as the base year and forecasts value for 2026 to 2035 in U.S. dollars. Market values for every year come from the Credence Research forecasting model. Geography, product type, end-use industry, application and sales channel splits are Credence Research estimates, with geography shares built from World Bank manufacturing value added by economy and adjusted for packaging and vehicle intensity. Inputs include vehicle production statistics, government policy notices, trade association data and company filings and releases. No primary interviews or buyer surveys were used for this estimate.
Electrified cars and drug-delivery parts carry growth
Through 2035, demand will follow vehicle electrification in China and Thailand, new car and appliance plants in India, and the move of drug-delivery and electronics parts to Asian molders. Packaging will stay the largest end use, although recycled content rules will change resin choices and favor larger molders. Battery housings and connectors will lift engineering resin parts, and molders serving battery enclosures will gain long contracts. Firms that pair local plants with validated tooling should hold share as programs localize.
Frequently Asked Questions
How big is the APAC injection molded plastics market?
Which geography leads the regional market?
Which geography grows fastest?
Which product type holds the largest share?
Which end use grows fastest?
How do electric vehicles affect demand?
Which companies compete in the regional market?
What challenges do regional molders face?
Table of Content
Chapter 1 Market Segmentation
- 1.1 Segmentation Framework
- 1.1.1 Product and Service Classification
- 1.1.2 Application and End-Use Classification
- 1.1.3 Technology and Solution Classification
- 1.1.4 Customer and Distribution Channel Classification
- 1.1.5 Geographic Segmentation
- 1.1.6 Market Segment Definitions and Boundaries
- 1.2 By Product Type
- 1.2.1 Polyolefin Parts
- 1.2.2 Styrenic Parts
- 1.2.3 Engineering Thermoplastic Parts
- 1.2.4 Specialty Thermoplastic Parts
- 1.3 By End-Use Industry
- 1.3.1 Packaging
- 1.3.2 Automotive
- 1.3.3 Consumer Electronics
- 1.3.4 Healthcare
- 1.3.5 Construction and Consumer Durables
- 1.4 By Application
- 1.4.1 Containment and Closure
- 1.4.2 Housing and Structural Support
- 1.4.3 Connection and Fluid Management
- 1.4.4 Surface and Functional Components
- 1.5 By Sales Channel
- 1.5.1 Direct Program Contracts
- 1.5.2 Direct Catalog Sales
- 1.5.3 Distributor Sales
- 1.5.4 Captive Internal Supply
- 1.6 By Country
- 1.6.1 China
- 1.6.2 India
- 1.6.3 Southeast Asia
- 1.6.4 Developed Asia-Pacific
Chapter 2 Introduction
- 2.1 Report Objectives and Scope
- 2.2 Product Definition and Industry Terminology
- 2.3 Market Inclusions and Exclusions
- 2.4 Research Process
- 2.4.1 Primary Research and Expert Interviews
- 2.4.2 Secondary Research and Source Review
- 2.4.3 Top-Down and Bottom-Up Estimation
- 2.4.4 Data Triangulation and Verification
- 2.5 Market Size Measurement Basis
- 2.5.1 2025: USD 109.94 billion → 2035: USD 178.67 billion
- 2.6 Historical and Forecast Reference Periods
- 2.6.1 Historical Period: 2018-2025
- 2.6.2 Base Year: 2025
- 2.6.3 Forecast Period: 2025-2035
- 2.7 Research Assumptions and Limitations
Chapter 3 Executive Summary
- 3.1 Market Snapshot and Key Findings
- 3.2 Base-Year Market Size, 2025
- 3.3 Forecast Market Size, 2035
- 3.4 Revenue and Volume Growth Outlook
- 3.5 Key Demand and Supply Indicators
- 3.6 Leading Market Segments
- 3.7 Fastest-Growing Market Opportunities
- 3.8 Regional Performance Highlights
- 3.9 Technology and Industry Transformation
- 3.10 Competitive Landscape Summary
- 3.11 Analyst View and Strategic Implications
Chapter 4 APAC Injection Molded Plastics Market Trends and Developments
- 4.1 Historical Industry Development, 2018-2025
- 4.2 Recent Market Trends and Developments
- 4.3 Demand and Customer Behavior Trends
- 4.4 Technology and Product Innovation
- 4.5 Artificial Intelligence, Automation and Digitalization
- 4.6 Local Manufacturing and Supply Chain Realignment
- 4.7 Industry Partnerships, Mergers and Acquisitions
- 4.8 Sustainability and Circular Economy Developments
- 4.9 Government and Private Sector Investment Trends
- 4.10 Emerging Business Models and Commercialization
- 4.11 Industry Developments and Announcements
Chapter 5 APAC Injection Molded Plastics Market Production, Supply and Demand Analysis
- 5.1 Demand Trend and Consumption Analysis, 2018-2025
- 5.2 Demand Forecast, 2025-2035
- 5.3 Production and Output Trend, 2018-2025
- 5.4 Production and Output Forecast, 2025-2035
- 5.5 Installed Capacity and Capacity Utilization
- 5.6 Company-Wise Production Plants and Statistics
- 5.6.1 Installed Production Capacity
- 5.6.2 Actual Production
- 5.6.3 Planned Capacity and Expansion Targets
- 5.7 Supply Chain Structure and Procurement Trends
- 5.8 Supply-Demand Gap and Bottlenecks
- 5.9 Import Dependence and Sourcing Structure
- 5.10 Contract Manufacturing and Outsourcing
- 5.11 Regional Supply and Demand Concentration
Chapter 6 APAC Injection Molded Plastics Market Pricing Analysis
- 6.1 Pricing Structure and Measurement
- 6.2 Historical Pricing Trends, 2018-2025
- 6.3 Pricing Outlook, 2025-2035
- 6.4 Average Selling Price and Unit Economics
- 6.5 Pricing by Product and Market Segment
- 6.6 Geographic Pricing Differences
- 6.7 Key Input, Energy, Labor and Logistics Costs
- 6.8 Contract Pricing and Purchasing Models
- 6.9 Pricing Sensitivity and Competitive Positioning
- 6.10 Price, Margin and Profitability Implications
Chapter 7 APAC Injection Molded Plastics Market Dynamics
- 7.1 Market Growth Drivers
- 7.1.1 Demand-Side Drivers
- 7.1.2 Technology and Innovation Drivers
- 7.1.3 Infrastructure and Investment Drivers
- 7.1.4 Regulatory and Policy Drivers
- 7.2 Market Restraints
- 7.2.1 Cost and Affordability Constraints
- 7.2.2 Technology and Adoption Barriers
- 7.2.3 Supply Chain and Operational Constraints
- 7.3 Market Challenges
- 7.3.1 Competitive Pressure and Margin Erosion
- 7.3.2 Skills, Infrastructure and Implementation Gaps
- 7.4 Emerging Market Opportunities
- 7.5 Market Dynamics Impact and Time-Horizon Assessment
Chapter 8 APAC Injection Molded Plastics Value Chain Analysis
- 8.1 Industry Value Chain Overview
- 8.2 Upstream Suppliers and Critical Inputs
- 8.3 Technology and Component Providers
- 8.4 Manufacturing or Service Delivery
- 8.5 Distribution, Channel Partners and Integrators
- 8.6 Downstream Applications and End Users
- 8.7 Value Addition and Profit Pools
- 8.8 Vertical Integration and Outsourcing
- 8.9 Supplier Concentration and Risk
- 8.10 Supply Chain Localization and Resilience
Chapter 9 APAC Injection Molded Plastics Market Regulations and Policies
- 9.1 Relevant Laws, Standards and Compliance Frameworks
- 9.2 Product, Service, Safety and Quality Requirements
- 9.3 Government Policies, Incentives and Subsidies
- 9.4 Imports, Exports and Trade Barriers
- 9.5 Public Procurement and Local Content Requirements
- 9.6 Environmental and Sustainability Compliance
- 9.7 Upcoming Policy Changes and Market Implications
Chapter 10 APAC Injection Molded Plastics Market Hotspots and Opportunities
- 10.1 Market Opportunity Mapping and Growth Hotspots
- 10.2 High-Growth Applications and Customer Groups
- 10.3 Underserved Markets and White-Space Opportunities
- 10.4 Emerging Technology and Product Opportunities
- 10.5 New Capacity and Investment Hotspots
- 10.6 Market Entry and Expansion Opportunities
- 10.7 Distribution and Partnership Opportunities
- 10.8 Near-Term and Long-Term Commercial Potential
- 10.9 Opportunity Attractiveness and Execution Risks
Chapter 11 APAC Injection Molded Plastics Market Outlook, 2025-2035
- 11.1 Market Size and Analysis
- 11.1.1 Revenue (Market Measurement: 2025: USD 109.94 billion → 2035: USD 178.67 billion)
- 11.1.2 Market Volume and Quantity Sold
- 11.1.3 Historical Market Size, 2018-2025
- 11.1.4 Base-Year Market Size, 2025
- 11.2 Market Forecast, 2025-2035
- 11.2.1 Revenue Forecast to 2035
- 11.2.2 Volume Forecast to 2035
- 11.2.3 CAGR and Year-on-Year Growth
- 11.2.4 Incremental Revenue Opportunity
- 11.3 Forecast Assumptions and Scenario Analysis
- 11.3.1 Base-Case Forecast
- 11.3.2 Optimistic and Conservative Scenarios
- 11.3.3 Technology, Pricing and Policy Sensitivities
- 11.4 Market Attractiveness and Growth Outlook
Chapter 12 APAC Injection Molded Plastics Market Segmentation and Outlook
- 12.1 Segmentation Summary and Market Shares, 2025
- 12.2 Largest and Fastest-Growing Segments
- 12.3 By Product Type - Market Size and Forecast, 2025-2035
- 12.3.1 Segment Definition and Scope
- 12.3.2 Historical Market Size, 2018-2025
- 12.3.3 Revenue Forecast, 2025-2035
- 12.3.4 Volume Forecast, 2025-2035
- 12.3.5 Base-Year Market Share, 2025
- 12.3.6 Segment CAGR and Growth Drivers
- 12.3.7 Subsegment Market Size and Forecast
- 12.3.7.1 Polyolefin Parts
- 12.3.7.2 Styrenic Parts
- 12.3.7.3 Engineering Thermoplastic Parts
- 12.3.7.4 Specialty Thermoplastic Parts
- 12.3.8 Subsegment Pricing and Adoption Trends
- 12.3.9 Leading Suppliers and Competition
- 12.3.10 Regional Demand and Opportunities
- 12.4 By End-Use Industry - Market Size and Forecast, 2025-2035
- 12.4.1 Segment Definition and Scope
- 12.4.2 Historical Market Size, 2018-2025
- 12.4.3 Revenue Forecast, 2025-2035
- 12.4.4 Volume Forecast, 2025-2035
- 12.4.5 Base-Year Market Share, 2025
- 12.4.6 Segment CAGR and Growth Drivers
- 12.4.7 Subsegment Market Size and Forecast
- 12.4.7.1 Packaging
- 12.4.7.2 Automotive
- 12.4.7.3 Consumer Electronics
- 12.4.7.4 Healthcare
- 12.4.7.5 Construction and Consumer Durables
- 12.4.8 Subsegment Pricing and Adoption Trends
- 12.4.9 Leading Suppliers and Competition
- 12.4.10 Regional Demand and Opportunities
- 12.5 By Application - Market Size and Forecast, 2025-2035
- 12.5.1 Segment Definition and Scope
- 12.5.2 Historical Market Size, 2018-2025
- 12.5.3 Revenue Forecast, 2025-2035
- 12.5.4 Volume Forecast, 2025-2035
- 12.5.5 Base-Year Market Share, 2025
- 12.5.6 Segment CAGR and Growth Drivers
- 12.5.7 Subsegment Market Size and Forecast
- 12.5.7.1 Containment and Closure
- 12.5.7.2 Housing and Structural Support
- 12.5.7.3 Connection and Fluid Management
- 12.5.7.4 Surface and Functional Components
- 12.5.8 Subsegment Pricing and Adoption Trends
- 12.5.9 Leading Suppliers and Competition
- 12.5.10 Regional Demand and Opportunities
- 12.6 By Sales Channel - Market Size and Forecast, 2025-2035
- 12.6.1 Segment Definition and Scope
- 12.6.2 Historical Market Size, 2018-2025
- 12.6.3 Revenue Forecast, 2025-2035
- 12.6.4 Volume Forecast, 2025-2035
- 12.6.5 Base-Year Market Share, 2025
- 12.6.6 Segment CAGR and Growth Drivers
- 12.6.7 Subsegment Market Size and Forecast
- 12.6.7.1 Direct Program Contracts
- 12.6.7.2 Direct Catalog Sales
- 12.6.7.3 Distributor Sales
- 12.6.7.4 Captive Internal Supply
- 12.6.8 Subsegment Pricing and Adoption Trends
- 12.6.9 Leading Suppliers and Competition
- 12.6.10 Regional Demand and Opportunities
- 12.7 By Country - Market Size and Forecast, 2025-2035
- 12.7.1 Segment Definition and Scope
- 12.7.2 Historical Market Size, 2018-2025
- 12.7.3 Revenue Forecast, 2025-2035
- 12.7.4 Volume Forecast, 2025-2035
- 12.7.5 Base-Year Market Share, 2025
- 12.7.6 Segment CAGR and Growth Drivers
- 12.7.7 Subsegment Market Size and Forecast
- 12.7.7.1 China
- 12.7.7.2 India
- 12.7.7.3 Southeast Asia
- 12.7.7.4 Developed Asia-Pacific
- 12.7.8 Subsegment Pricing and Adoption Trends
- 12.7.9 Leading Suppliers and Competition
- 12.7.10 Regional Demand and Opportunities
- 12.8 Segment Growth Comparison
- 12.9 Segment Attractiveness and Priority Matrix
Chapter 13 APAC Injection Molded Plastics End-Use and Application Market Outlook
- 13.1 End-Use Industry and Customer Demand Structure
- 13.2 Leading Applications and Customer Groups
- 13.3 End-Use Market Size, Share and Forecast
- 13.4 Major End-Use Industry Deep Dives
- 13.4.1 Customer Requirements and Use Cases
- 13.4.2 Demand and Replacement Cycles
- 13.4.3 Technical and Regulatory Considerations
- 13.4.4 Purchasing and Procurement Models
- 13.4.5 Leading Vendors and Distribution Channels
- 13.4.6 Forecast and Commercial Opportunities
- 13.5 Emerging Applications and Cross-Segment Demand
- 13.6 End-Use Industry Investment Priorities
Chapter 14 APAC Injection Molded Plastics Geographic Market Outlook, 2025-2035
- 14.1 Regional Market Size and Country-Level Shares, 2025
- 14.2 Country Market Size Comparison, 2025
- 14.3 Country Market Forecasts, 2025-2035
- 14.4 Subregional Industrial and Demand Clusters
- 14.5 Intra-Regional Pricing and Cost Differences
- 14.6 Cross-Border Trade and Supply Networks
- 14.7 Regional Supply and Demand Balances
- 14.8 Country Opportunity Comparison and Prioritization
Note: Every listed country is covered on the structure shown under the first country.
Chapter 15 APAC Injection Molded Plastics Technology, Innovation and Sustainability Outlook
- 15.1 Technology Landscape and Maturity
- 15.2 Product, Process and Service Innovation
- 15.3 AI, Automation and Digital Tools in the Industry
- 15.4 Technology Adoption and Performance Benchmarking
- 15.5 Innovation Pipeline and R&D Investment
- 15.6 Patent and Intellectual Property Trends
- 15.7 Energy Efficiency and Resource Management
- 15.8 Sustainability, Recycling and Circularity
- 15.9 Technology Roadmap, 2025-2035
- 15.10 Risks of Obsolescence and Technology Substitution
Chapter 16 APAC Injection Molded Plastics Market Key Strategic Imperatives
- 16.1 Growth and Market Entry Priorities
- 16.2 High-Return Products and Segments
- 16.3 Pricing, Profitability and Cost Optimization
- 16.4 Technology Investment and Product Differentiation
- 16.5 Supply Chain Localization and Resilience
- 16.6 Distribution and Customer Acquisition
- 16.7 Partnership, Acquisition and Capacity Strategy
- 16.8 Regional Expansion Priorities
- 16.9 Short-, Medium- and Long-Term Actions
Chapter 17 Competition Outlook
- 17.1 Industry Competition Characteristics
- 17.2 Market Structure and Concentration
- 17.3 Market Share and Competitive Positioning, 2025
- 17.4 Company-Wise Revenue and Product Benchmarking
- 17.5 Production and Service Capacity Benchmarking
- 17.6 Technology, Pricing and Differentiation
- 17.7 Regional Footprint and Distribution Strength
- 17.8 Mergers, Acquisitions and Strategic Alliances
- 17.9 New Entrants and Competitive Threats
- 17.10 Porter's Five Forces and Industry Attractiveness
- 17.11 Competitive Outlook, 2025-2035
Chapter 18 Company Profiles
- 18.1 Company Coverage and Selection Criteria
- 18.2 Amcor
- 18.2.1 Business Description
- 18.2.2 Company Ownership and Geographic Presence
- 18.2.3 Product and Service Portfolio
- 18.2.4 Manufacturing and Operating Footprint
- 18.2.5 Production Capacity and Expansion Plans
- 18.2.6 Financial Performance and Investment
- 18.2.7 Market Share and Competitive Position
- 18.2.8 Technology and Innovation Capabilities
- 18.2.9 Strategic Alliances or Partnerships
- 18.2.10 Recent Developments
- 18.2.11 Growth Strategy and Outlook
- 18.3 Jabil
- 18.4 OPmobility
- 18.5 Minth Group
- 18.6 FORVIA
- 18.7 Greiner
- 18.8 Nilkamal
- 18.9 Supreme Industries
- 18.10 Duy Tan Plastics
- 18.11 Shaily Engineering Plastics
- 18.12 Other Relevant Market Participants
Note: Every listed company is profiled on the structure shown under the first company. The company list is preliminary and may change based on research findings, market developments, data availability and client requirements.
Chapter 19 Disclaimer
- 19.1 Research and Forecast Disclaimer
- 19.2 Data Source and Estimation Limitations
Note: The depth of individual sections depends on data availability for this market. Volume, capacity, trade and other unit-based metrics are included where applicable.

