
Solvent swaps and battery plans reshape DMC buying
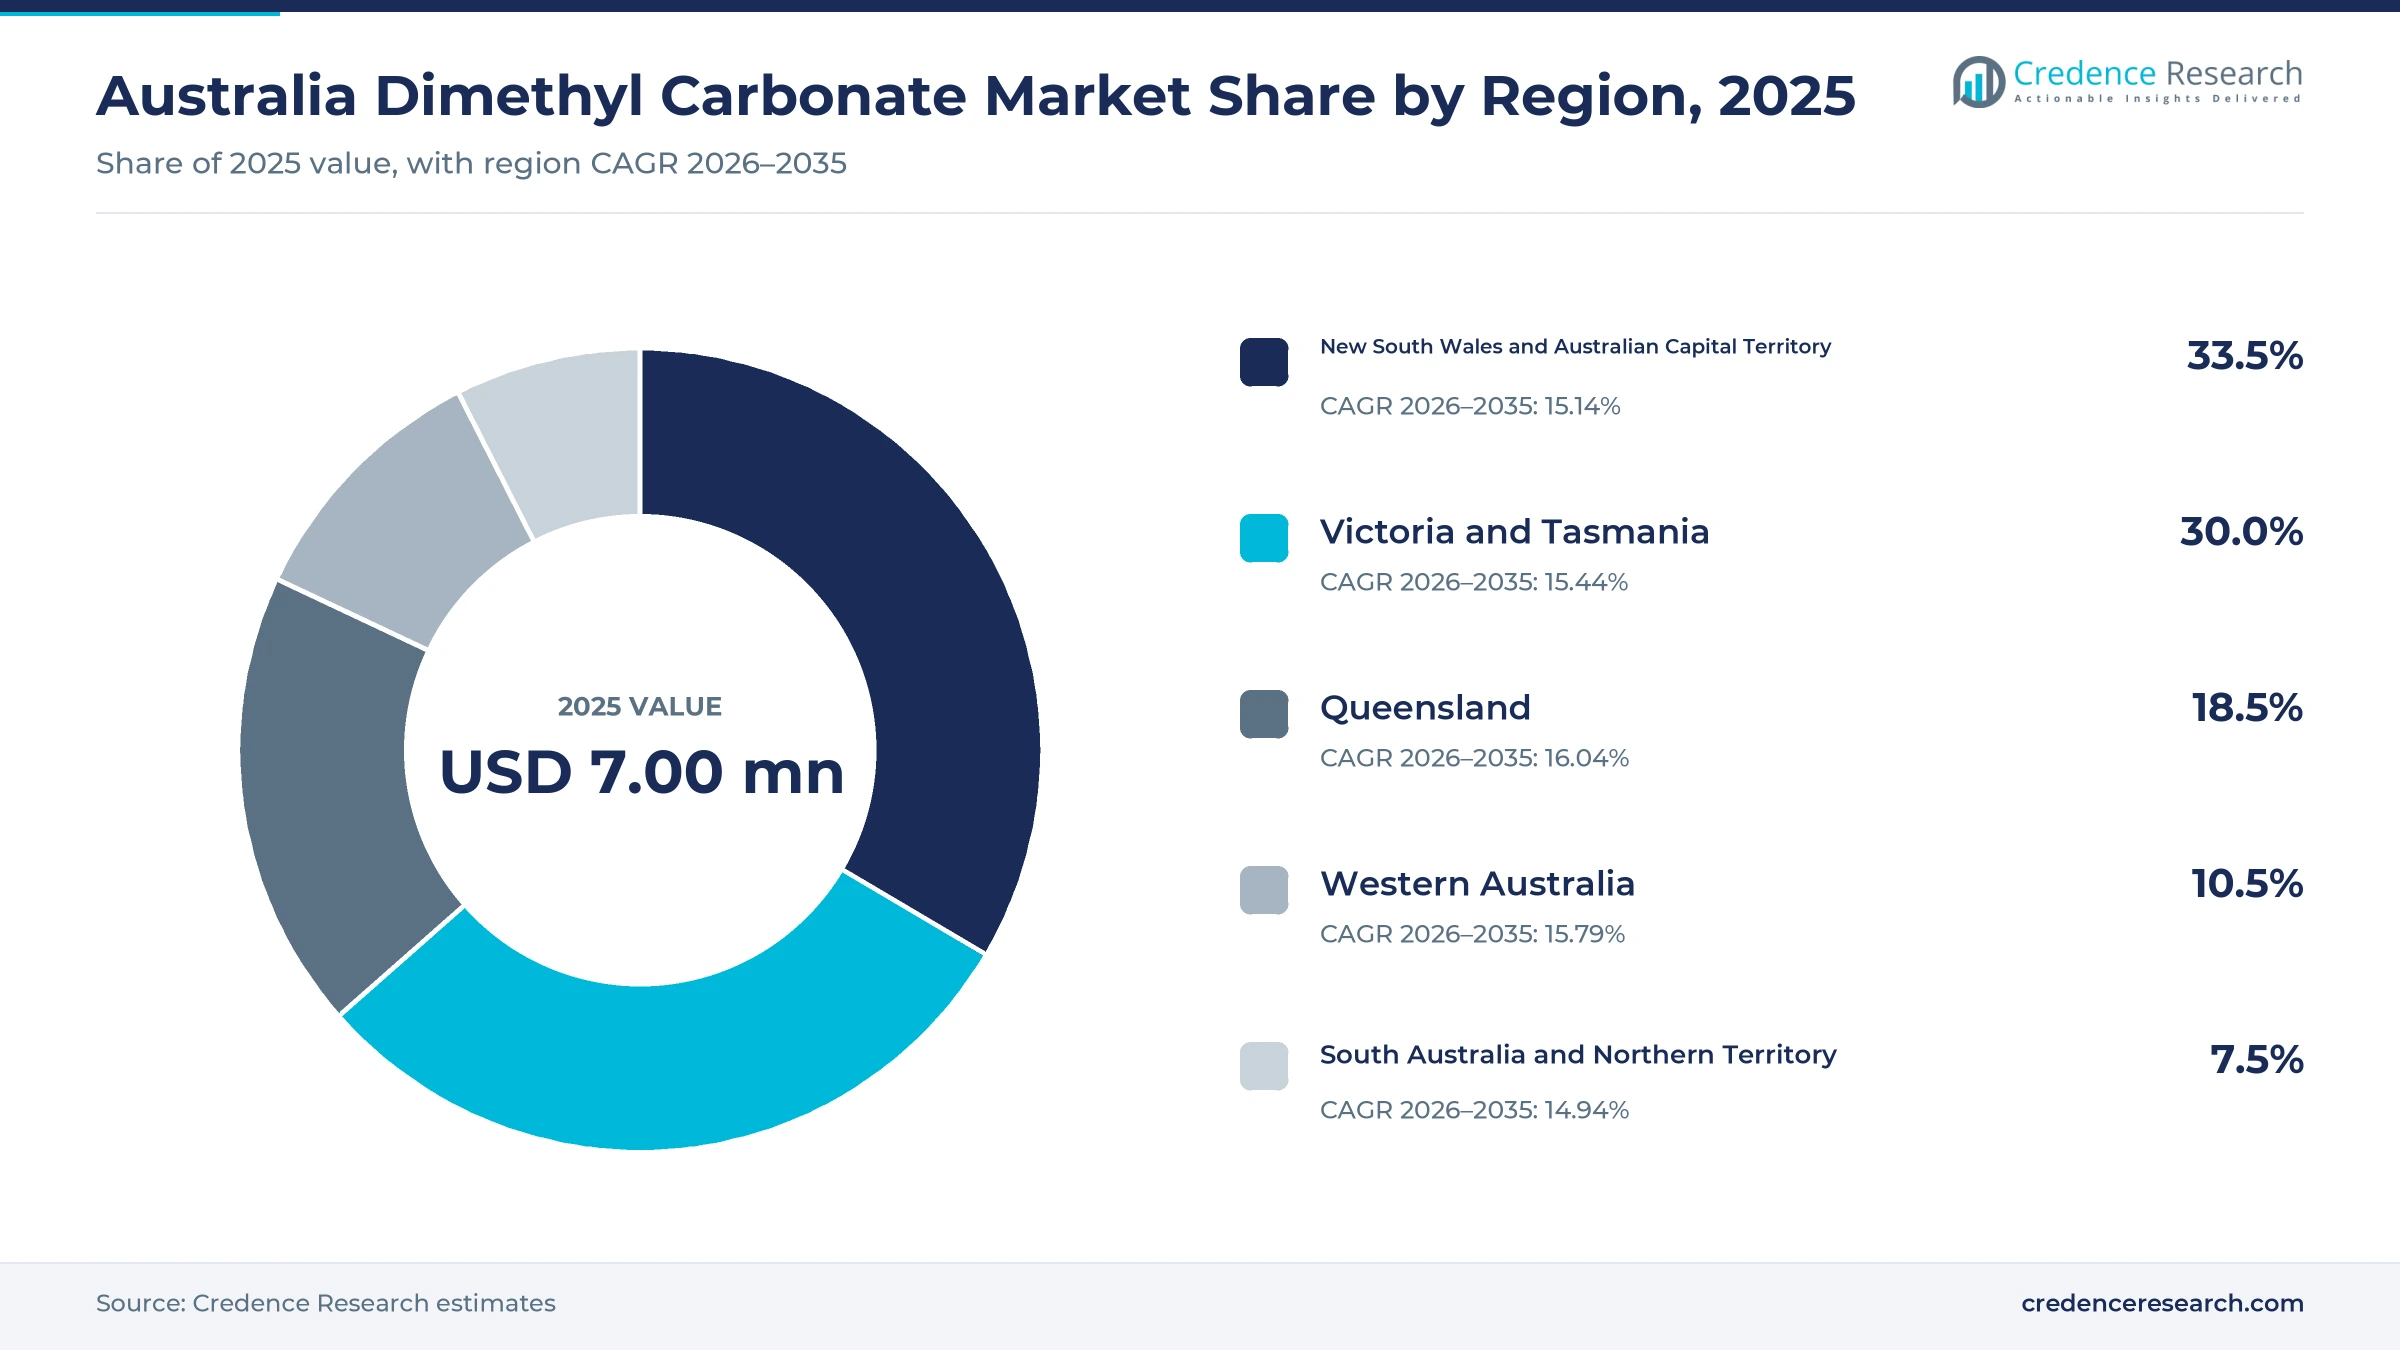
The Australia dimethyl carbonate market was valued at USD 7.00 million in 2025 and is projected to increase from USD 7.59 million in 2026 to USD 27.7 million by 2035, registering a CAGR of 15.45% during 2026–2035. Demand comes from paint, adhesive and cleaning formulators that want a fast-evaporating solvent, from chemical and pharmaceutical producers that use it as a methylating reagent, and from battery makers that blend it into lithium-ion electrolytes. New South Wales and Australian Capital Territory held the largest regional share, 33.5% in 2025, because Sydney combines the biggest population with dense formulation and laboratory activity. Queensland is the fastest-growing region at 16.04% a year, as its battery industry strategy backs a national battery precinct. At the same time, national workplace exposure limits that replace the current standards from December 2026 are pushing formulators to review their solvent choices.
Which DMC grades and uses does the estimate cover?
The estimate measures the value of dimethyl carbonate sold to Australian buyers in industrial, pharmaceutical and battery grades, whether it reaches them through local distributor stock, direct import shipments or scientific supply catalogs. It covers use as a formulation solvent, a cleaning solvent, a synthesis reagent and an electrolyte co-solvent in lithium-ion cells and pilot lines.
The estimate excludes other organic carbonates such as ethylene carbonate and diethyl carbonate, finished electrolyte blends counted by value of the whole solution, and polycarbonate resins. The value chain runs from producers through importers and stockholding distributors to coatings, adhesive, cleaning, chemical, pharmaceutical and battery manufacturers, contract formulators and research laboratories across Australia.
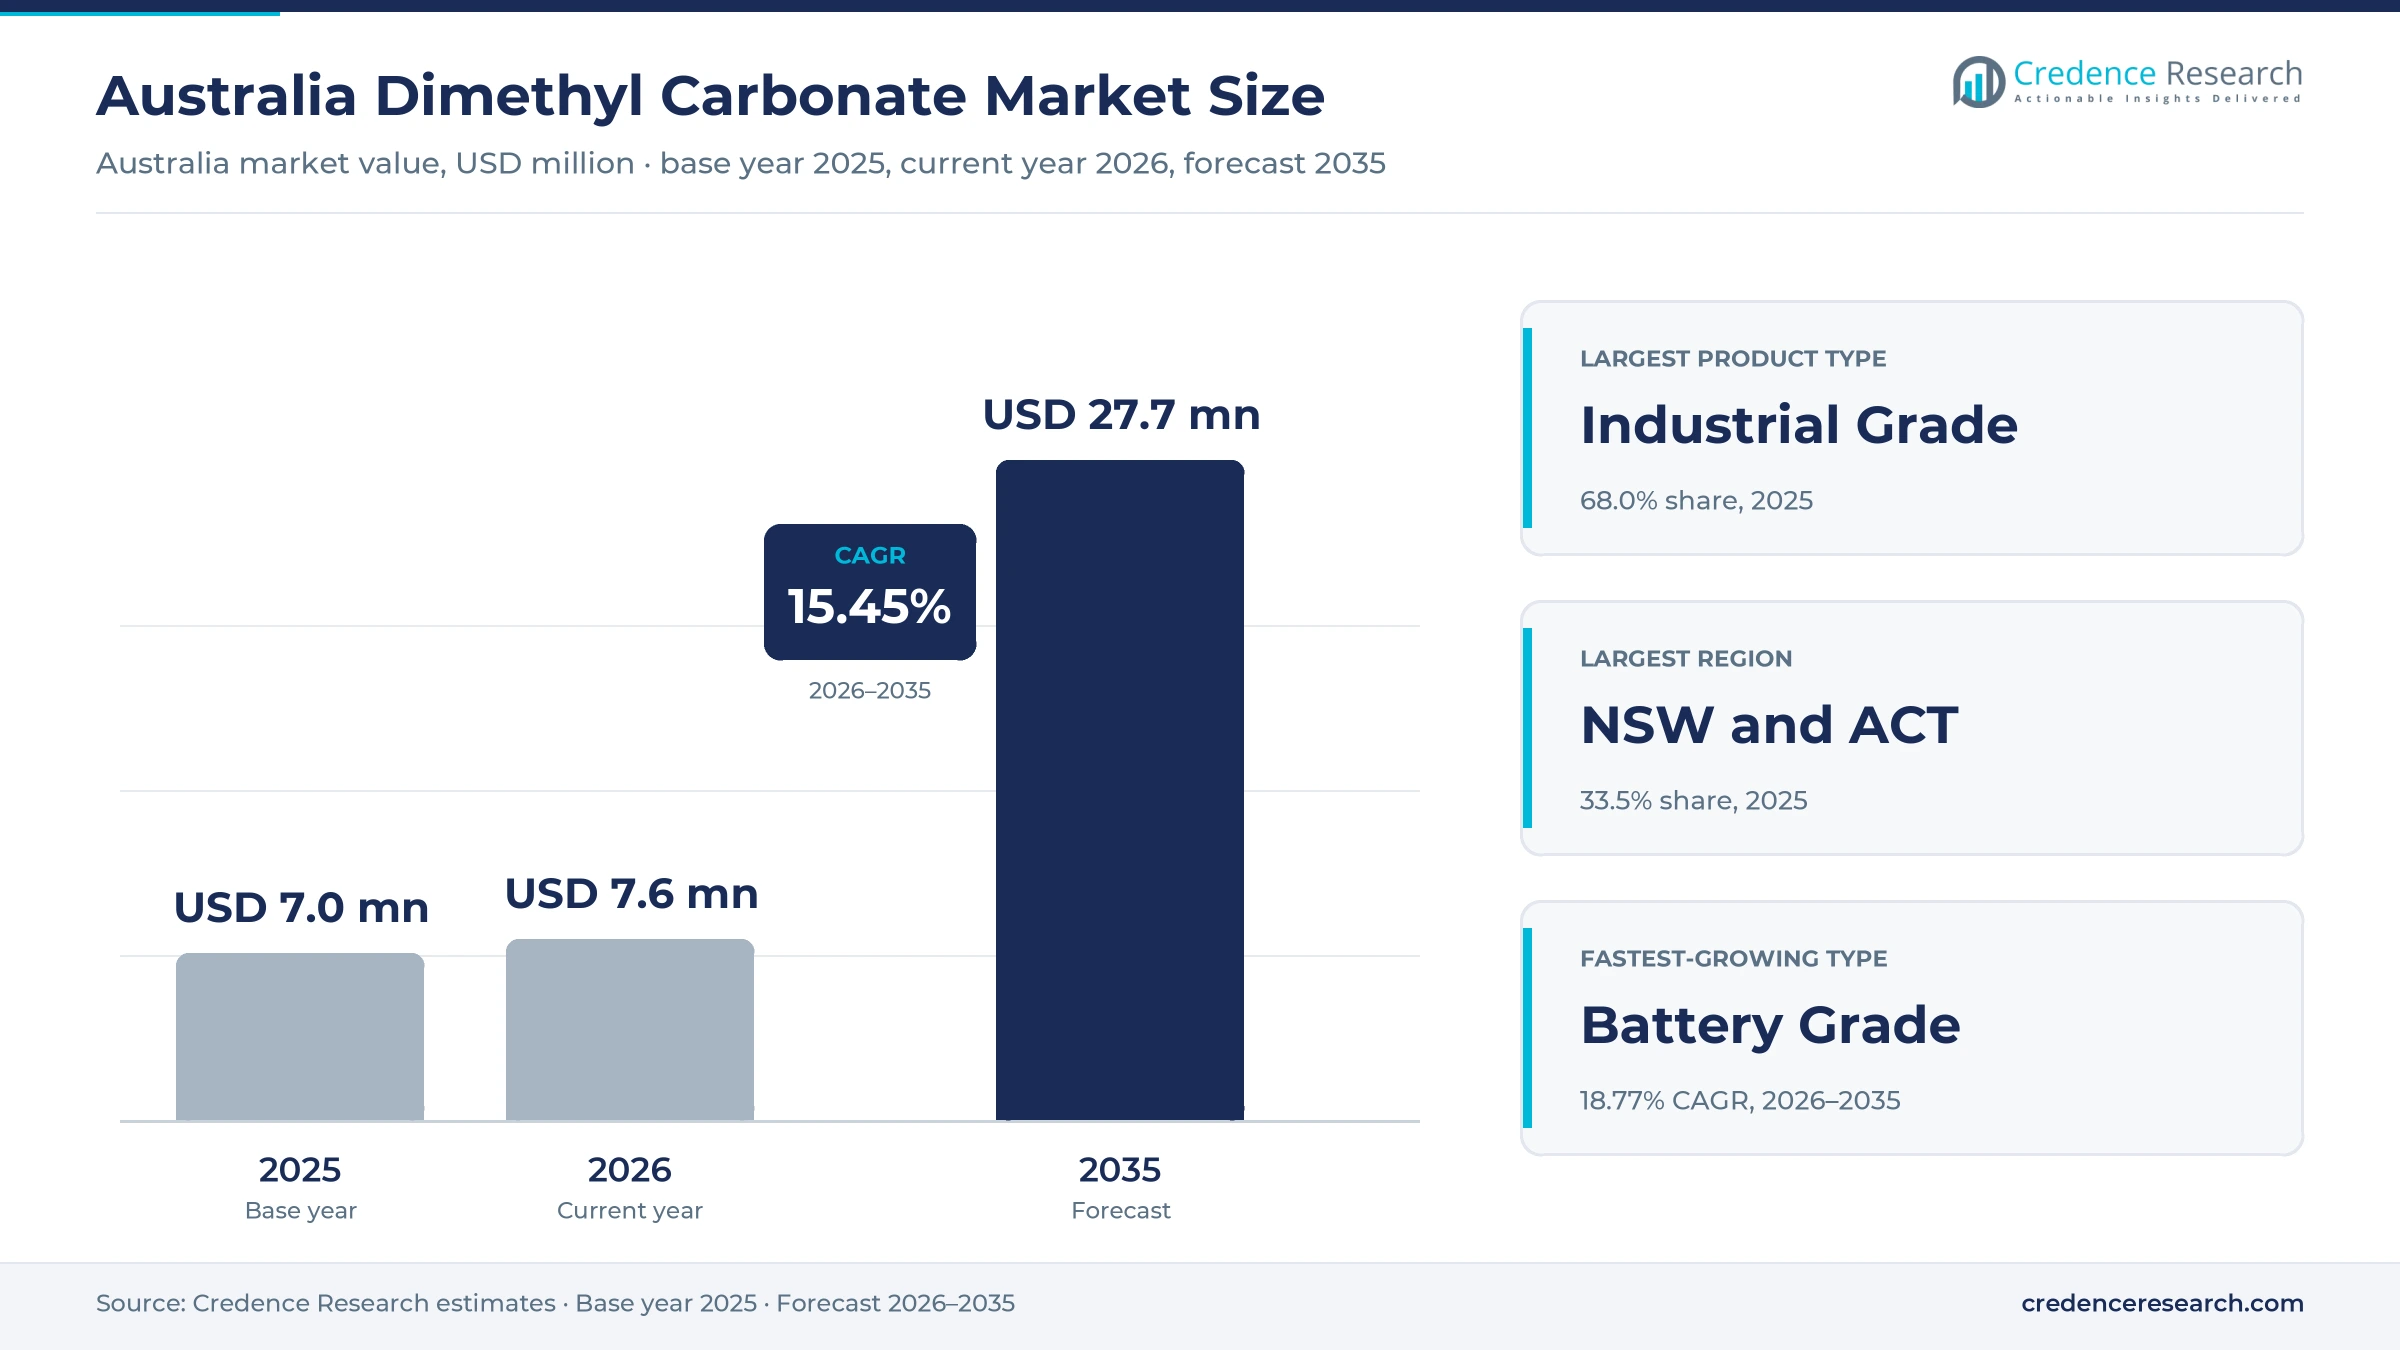
Australia Dimethyl Carbonate Market Insights
- The Australia dimethyl carbonate market was valued at USD 7.00 million in 2025 and is projected to reach USD 27.7 million by 2035, registering a CAGR of 15.45% during 2026–2035.
- New South Wales and Australian Capital Territory held a 33.5% share of 2025 value, because the zone housed about 9.16 million people in March 2026.
- Industrial grade dimethyl carbonate led with a 68.0% share of 2025 value, because coatings, adhesive and cleaning formulators buy it in drums from local distributor stock.
- ARENA opened its A$500 million Battery Breakthrough Initiative on Aug. 19, 2025, naming electrolytes among the active materials it will fund in Australia.
- Battery grade dimethyl carbonate grows fastest at 18.77% a year during 2026–2035, as local cell, pack and materials projects move from pilot to commercial scale.
Industrial grade leads as battery grade grows fastest
Why does industrial grade hold the largest share?
Based on product type, the market is categorized into industrial grade, pharmaceutical grade and battery grade. Industrial Grade led with a 68.0% share of 2025 value, because coatings, adhesive and cleaning formulators use it as a general solvent in drum lots. Battery Grade grows fastest at 18.77% a year, as electrolyte and cell projects need ultra-dry, high-purity material with tight water limits.
How do solvent and electrolyte uses split demand?
Based on application, the market is categorized into formulation solvent, cleaning solvent, synthesis reagent and electrolyte co-solvent. Formulation Solvent led with 40.0% of 2025 value, because paint, ink and adhesive makers use it to thin resins and control drying. Electrolyte Co-Solvent grows fastest at 17.93% a year, as battery makers blend it with cyclic carbonates and lithium salts in lithium-ion cells.
Why do stockholding distributors control access?
Based on sales channel, the market is categorized into stockholding distributors, direct imports and scientific supply channels. Stockholding Distributors led with a 58.0% share of 2025 value, because most buyers need small, frequent deliveries of a flammable liquid with local safety support. Direct Imports grow fastest at 16.03% a year, as battery projects contract full container loads of battery grade material.
How do manufacturers and research teams buy differently?
Based on customer type, the market is categorized into production manufacturers, contract formulators and research and pilot operators. Production Manufacturers led with a 64.0% share of 2025 value, because coatings, chemical and pharmaceutical plants buy repeat volumes on supply contracts. Research and Pilot Operators grow fastest at 16.61% a year, as university, CSIRO and start-up cell lines test new electrolyte formulas.
| Segment Group | Leading Sub-segment | Share, 2025 | Fastest-growing Sub-segment | CAGR, 2026–2035 |
|---|---|---|---|---|
| By Product Type | Industrial Grade | 68.0% | Battery Grade | 18.77% |
| By Application | Formulation Solvent | 40.0% | Electrolyte Co-Solvent | 17.93% |
| By Sales Channel | Stockholding Distributors | 58.0% | Direct Imports | 16.03% |
| By Customer Type | Production Manufacturers | 64.0% | Research and Pilot Operators | 16.61% |
Request a Free Sample
Fill in your details and we'll send you a free sample report.
- Sample data tables & charts
- Research methodology
Solvent substitution, battery funding and synthesis demand
Why are formulators substituting older solvents with DMC?
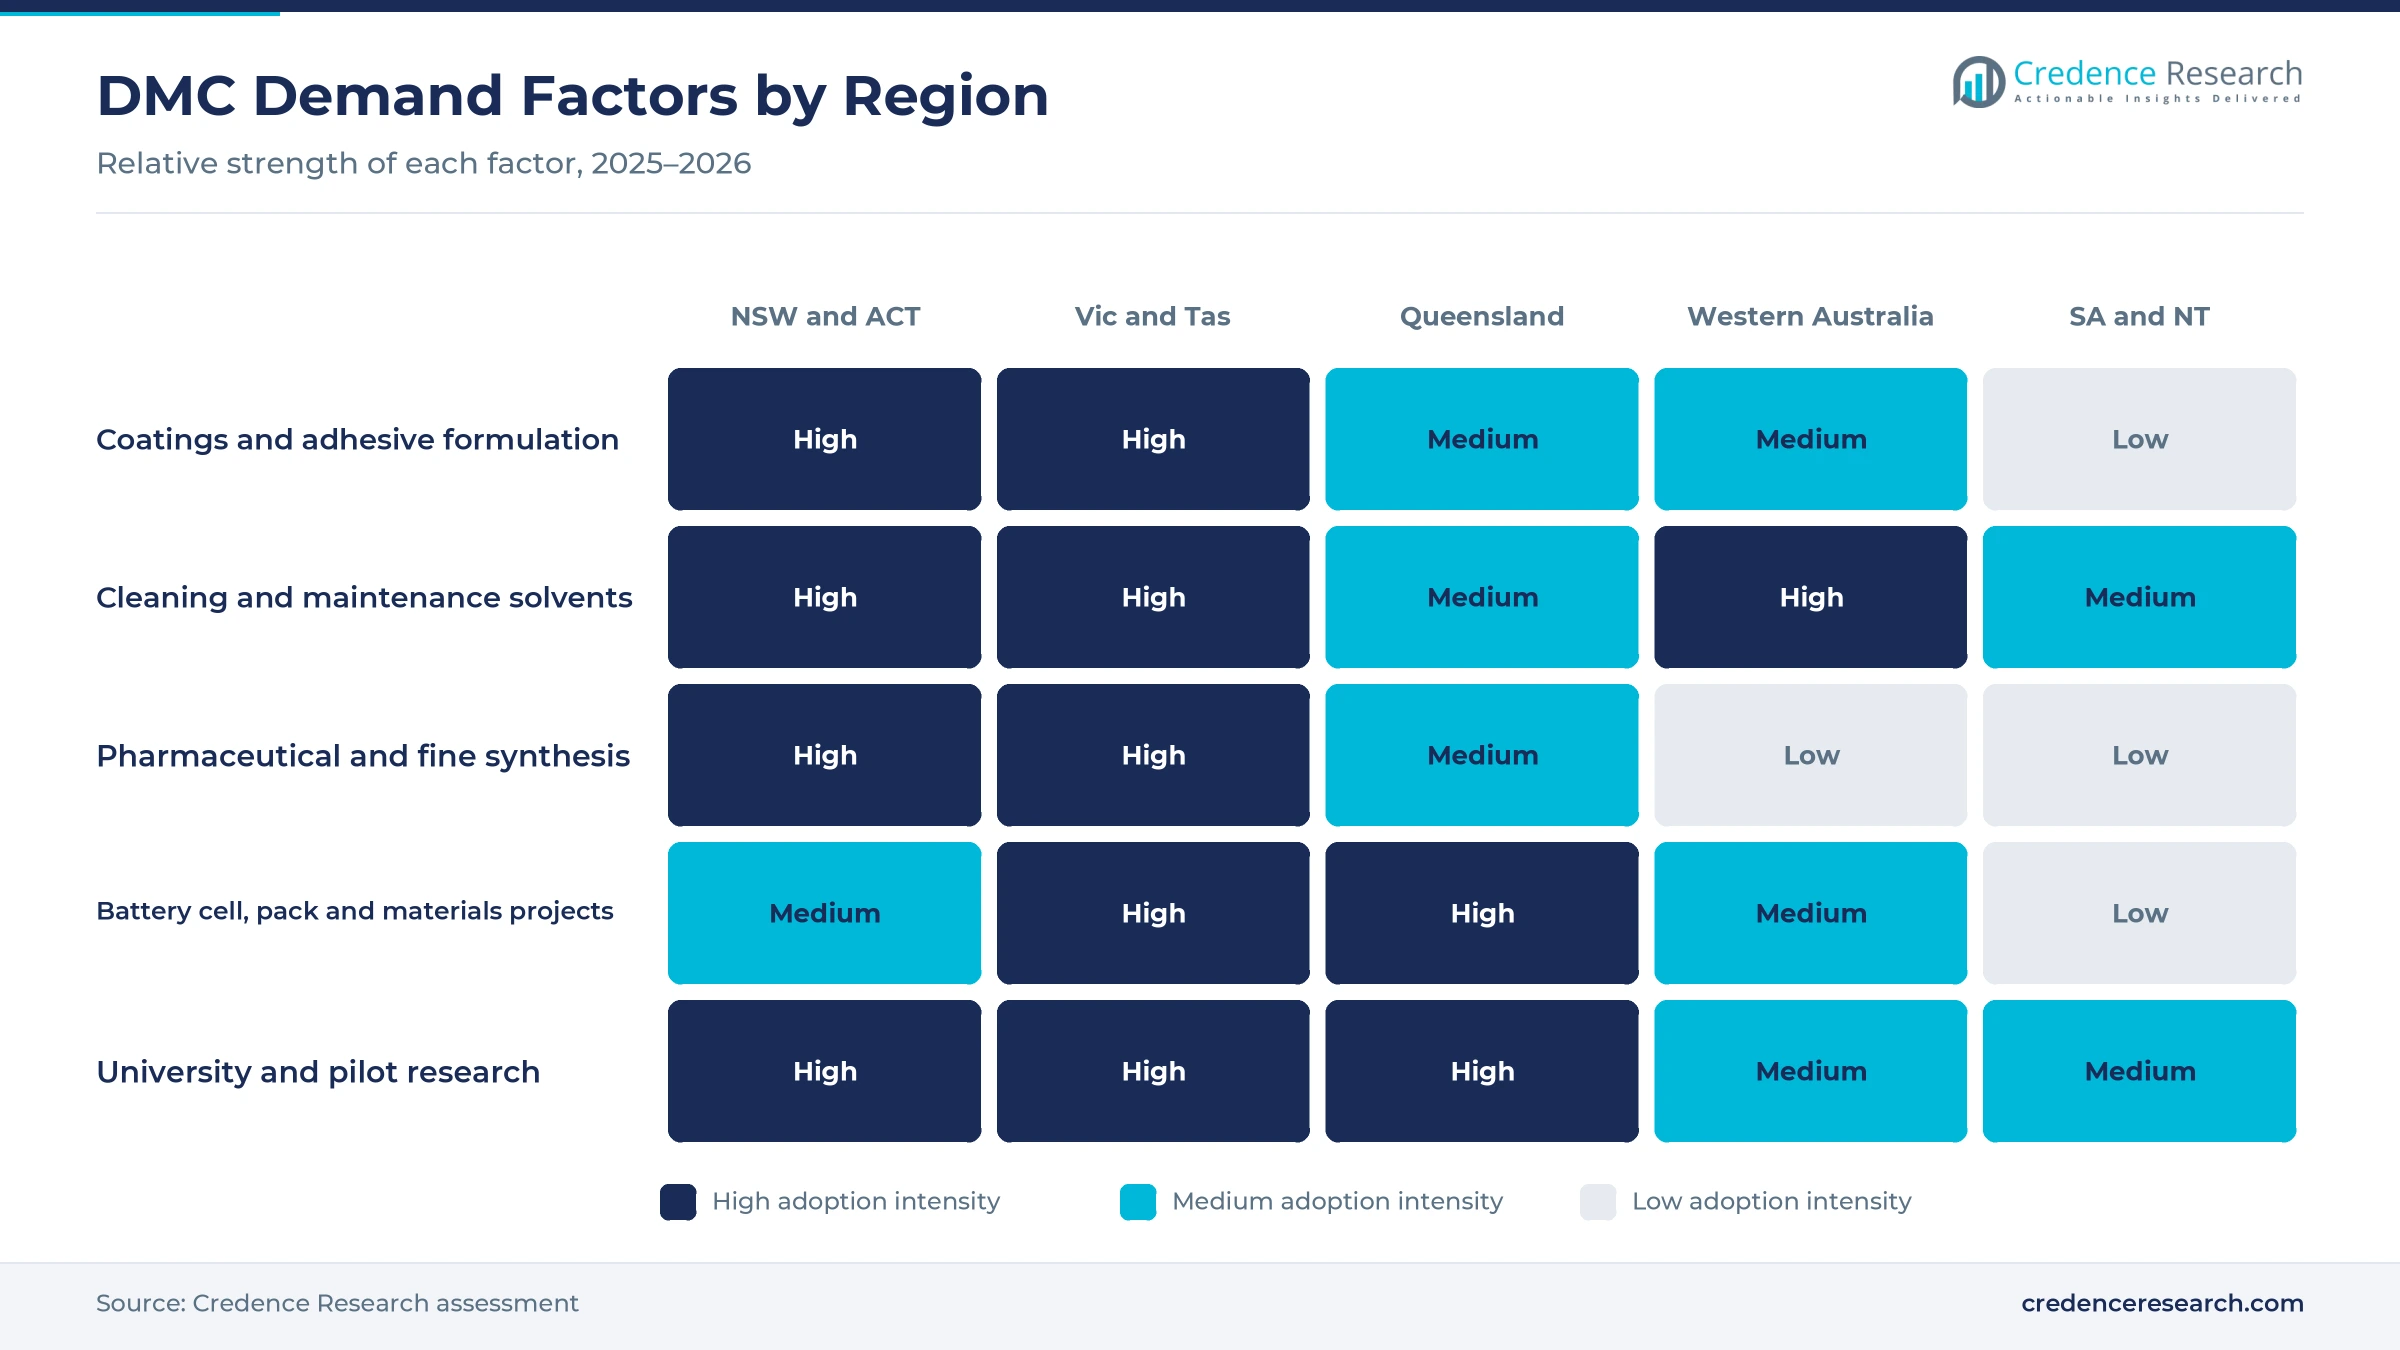
Coatings, adhesive and cleaning formulators are reviewing solvent blends, because workplace limits and customer safety demands now reward lower-hazard ingredients. Safe Work Australia says its new workplace exposure limits list replaces the current exposure standards from Dec. 1, 2026, with lower values for some chemicals. Dimethyl carbonate is used in organic synthesis and as a specialty solvent, according to its PubChem record at the U.S. National Library of Medicine. The same record lists a boiling point of about 90 degrees Celsius, which suits coatings that need to dry quickly at room temperature. As a result, formulation solvent holds 40.0% of 2025 value, as paint and adhesive makers replace older industrial solvents in their blends.
How does battery funding lift battery-grade demand?
Federal policy now funds local battery materials and cells, which creates the first steady Australian demand for high-purity electrolyte solvents. The Prime Minister released the National Battery Strategy on May 23, 2024, and the industry minister said it carried A$523.2 million for the Battery Breakthrough Initiative. ARENA opened that program on Aug. 19, 2025 with A$500 million, naming cathode, anode and electrolyte materials among its focus areas. Then industry minister Ed Husic said in 2024 that Australia supplies half of global lithium but produces less than 1% of the world's processed battery components. Because local cells need imported carbonate solvents, battery grade grows at 18.77% a year, alongside the wider battery electrolyte supply chain.
Why do specialty synthesis and research teams need access?
Pharmaceutical, fine chemical and research buyers use dimethyl carbonate as a cleaner methylating reagent, which keeps a steady flow of small, high-purity orders. PubChem describes it as an environmentally benign substitute for dimethyl sulfate and methyl halides in methylation reactions. The same record says it can be used in the synthesis of ciprofloxacin and in preparing guaifenesin, a precursor for methocarbamol. Rowe Scientific, a 100% Australian-owned supplier, has served scientific laboratories since 1987. Li-S Energy opened a 2 MWh lithium sulfur and lithium metal battery facility in Geelong in August 2024, iConnect007 reported, with an A$1.7 million federal grant. As a result, research and pilot operators grow at 16.61% a year.
How do population and factories sustain solvent use?
A growing population lifts consumption of paints, adhesives and cleaning products, which keeps industrial grade volumes rising even outside the battery sector. The Australian Bureau of Statistics said the population reached 27.92 million at March 31, 2026, up 1.4% in a year, adding about 392,700 people. Western Australia grew 2.1%, the fastest of any state, the same release showed, which widens demand for maintenance and cleaning solvents in Perth. Manufacturing contributed about 5.3% of gross domestic product in 2025, according to World Bank data, which anchors repeat solvent orders from local plants. In turn, production manufacturers hold 64.0% of 2025 value through repeat supply contracts.
Battery-grade sourcing, specialty distribution and precincts
How is the shift to battery-grade sourcing changing supply?
Battery assemblers and materials start-ups are scaling local output, which shifts part of the market from drum-grade solvent to sealed, moisture-controlled battery grade lots. PowerPlus received a A$2.3 million Battery Breakthrough grant to lift annual pack output in Melbourne from 50 MWh to 150 MWh, ESS News reported in April 2026. Sicona Battery Technologies won A$45 million from ARENA for a silicon-carbon anode facility at Port Kembla, Business News Australia reported on June 29, 2026. CSIRO says Energy Renaissance makes lithium-ion batteries at its Tomago factory in New South Wales, with superStorage products using 92% Australian components. Electrolyte co-solvent therefore grows at 17.93% a year as cell work deepens.
Why are distributors moving deeper into specialty chemicals?
Chemical distributors are adding specialty lines and technical service, which matters because most dimethyl carbonate reaches Australian buyers through their warehouses. Brenntag announced on Nov. 2, 2022 that it would acquire the Life Science and Coatings business of Ravenswood, which operated two sites in Australia. Redox lists surface coatings, detergents and human health among the markets it serves, and one of its directors has served the company since 1986. Ixom says it is headquartered in Melbourne and supported by more than 1,300 people in ten countries. These moves keep distributors central to supply, even as direct imports grow at 16.03% a year for large battery projects.
Can Queensland battery precinct plans open new demand?
Queensland's battery program creates an opening for electrolyte solvent suppliers, because it funds research, pilot cells and a shared manufacturing precinct in one state. The Queensland Battery Industry Strategy covers 2024 to 2029 and targets A$570 million of investment over five years, according to the state development department. It includes A$105 million to plan the Australian Battery Industrialisation Centre, subject to a business case with the federal government. The Australian-Made Battery Precinct is backed by up to A$100 million from the Australian Government, the same page says. As a result, Queensland becomes the fastest-growing zone, because the precinct, the planned industrialization hub and the grants sit in one state.
Is there an opening in safer cleaning and methylation?
Cleaning, degreasing and synthesis buyers want lower-hazard alternatives, which opens room for dimethyl carbonate in tasks once served by more toxic solvents and reagents. PubChem lists it as a replacement for dimethyl sulfate and methyl halides in methylation and records 29 consumer products that contain it. The same record notes use as a blowing agent in polyurethane foam and as a nonaqueous lithium battery electrolyte component. Safe Work Australia classes 33 airborne contaminants as non-threshold genotoxic carcinogens with no safe exposure limit, and its new limits apply from Dec. 1, 2026. In turn, suppliers that offer technical data and small pack sizes can win cleaning solvent trials and paints and coatings reformulation projects.
Flammability, funding cuts and a thin cell base slow uptake
How does flammability raise storage and freight costs?
Dimethyl carbonate is a highly flammable liquid, which means every warehouse, truck and workshop that holds it must meet dangerous goods controls. PubChem lists a closed-cup flash point of 14 degrees Celsius and a boiling point of about 90 degrees Celsius. As a result, small formulators pay more for compliant storage, licensed transport and staff training. Distributors absorb part of this burden through bunded stores and smaller packs, which helps them keep most repeat orders.
Why do funding cuts slow the battery pipeline?
Battery-grade demand depends on federal grants that help projects reach commercial scale, so any change in funding shifts timing for solvent orders. Business News Australia reported that the Battery Breakthrough Initiative envelope was revised down to A$142 million in the 2026 federal budget. In turn, fewer projects may win support in each round, and some cell or materials lines could wait longer. Suppliers respond by pairing battery work with steadier solvent and synthesis accounts.
How does a thin local cell base limit volumes?
Australia has only a small battery components base, so much of the electrolyte it uses arrives already blended inside imported cells and packs. Then industry minister Ed Husic said in 2024 that Australia produces less than 1% of the world's processed battery components. As a result, battery grade volumes stay small next to industrial grade, even though they grow fastest. Distributors and importers must therefore hold expensive high-purity stock for a few buyers, which raises unit costs and slows the shift to local electrolyte blending.
Why does import dependence expose buyers to supply swings?
Buyers that depend on imported supply face long shipping routes, which leaves them exposed to delays, currency moves and swings in Asian battery demand. Small formulators cannot easily hold months of a flammable solvent, so a late vessel can stop a batch. Credence Research estimates that stockholding distributors carry 58.0% of 2025 value, with the rest moving through direct shipments and catalogs. Larger buyers reduce risk through managed inventory and dual sourcing, while smaller ones pay for local stock.
New South Wales leads as Queensland grows fastest
| Region | Value, 2025 (USD million) | Share, 2025 | CAGR, 2026–2035 |
|---|---|---|---|
| New South Wales and Australian Capital Territory | 2.3 | 33.5% | 15.14% |
| Victoria and Tasmania | 2.1 | 30.0% | 15.44% |
| Queensland | 1.3 | 18.5% | 16.04% |
| Western Australia | 0.7 | 10.5% | 15.79% |
| South Australia and Northern Territory | 0.5 | 7.5% | 14.94% |
New South Wales and the ACT lead on scale and laboratories
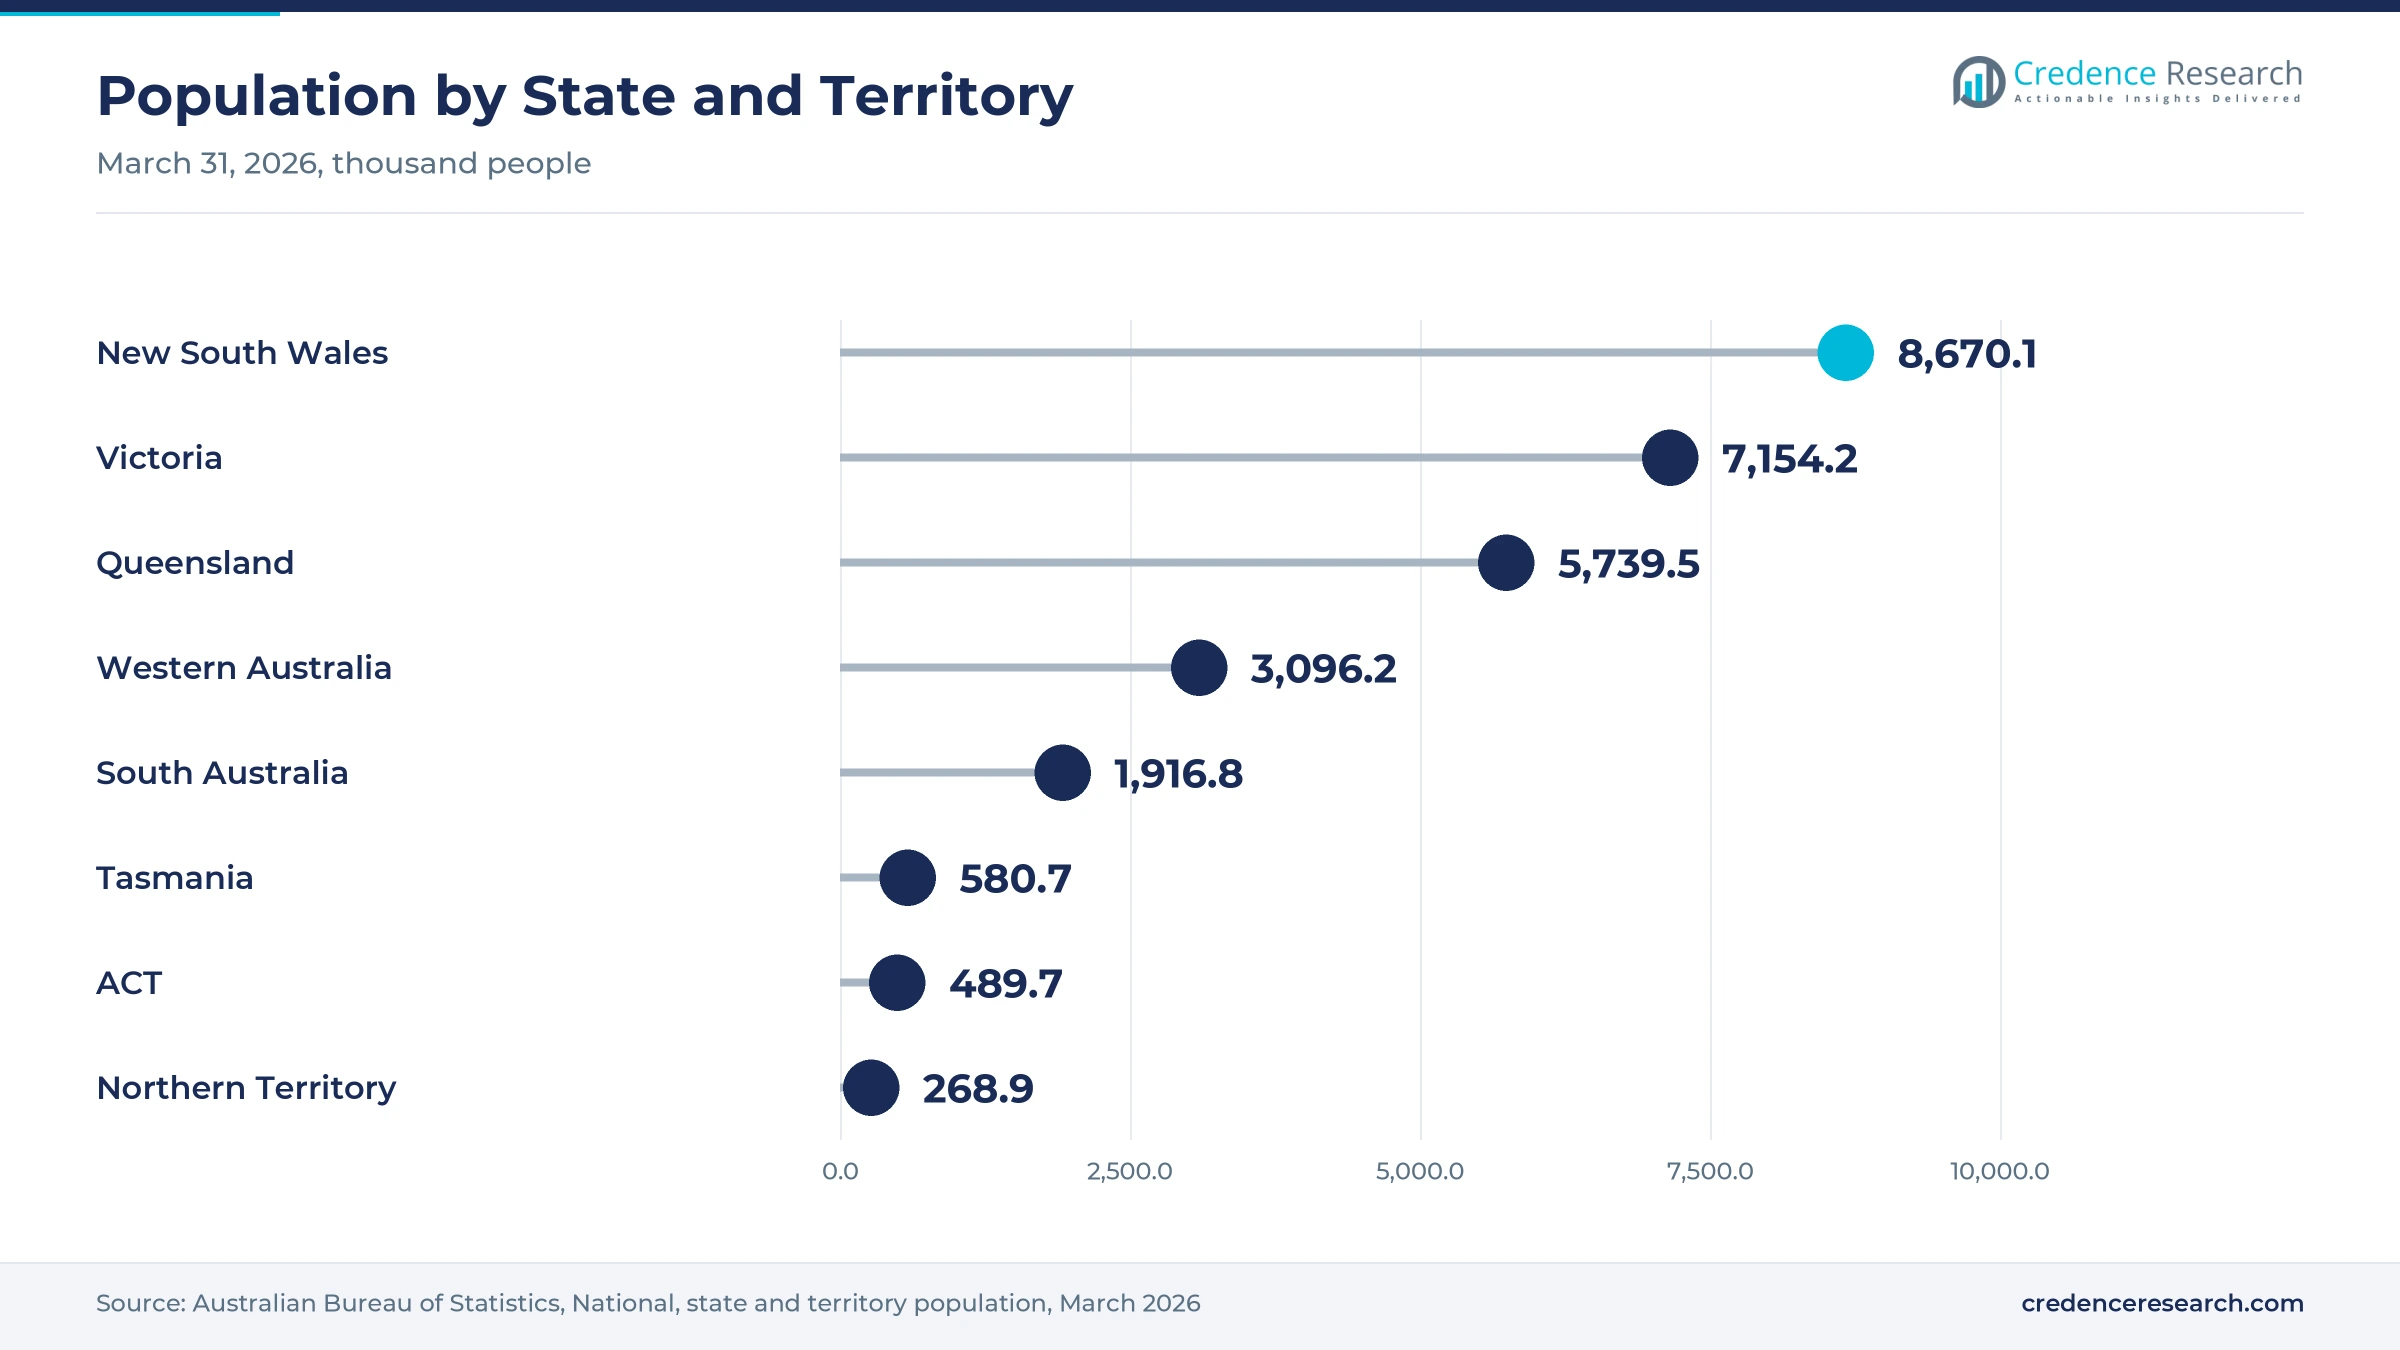
New South Wales and Australian Capital Territory held a 33.5% share of 2025 value and grow at 15.14% a year, because Sydney combines the largest population with dense formulation, pharmaceutical and laboratory work. New South Wales had 8.67 million residents and the ACT 489,700 in March 2026, the Australian Bureau of Statistics said. Sicona's planned Port Kembla anode plant and Energy Renaissance at Tomago add battery activity to the zone.
How do Victoria and Tasmania mix solvents and batteries?
Victoria and Tasmania held a 30.0% share of 2025 value and grow at 15.44% a year, because Melbourne hosts chemical distributors, formulators and pack assemblers. Victoria's population rose 1.6% to 7.15 million in the year to March 2026. Ixom is headquartered in Melbourne, PowerPlus is tripling pack output there, and Li-S Energy runs its Geelong battery facility. As a result, the zone blends steady solvent demand with growing electrolyte trials.
Why does Queensland become the fastest-growing region?
Queensland held 18.5% of 2025 value and grows fastest at 16.04% a year, because state and federal money is building a battery precinct and research base. The state's battery strategy targets A$570 million over five years, and the Australian-Made Battery Precinct has up to A$100 million of federal backing. Queensland's population grew to 5.74 million in the year to March 2026. That combined pipeline lifts future battery grade, pilot cell and research demand across the state.
Western Australia grows on population and refining links
Western Australia held a 10.5% share of 2025 value and grows at 15.79% a year, because Perth's population and its resources processing base are expanding. The state's population rose 2.1% to 3.10 million in the year to March 2026, the fastest rate of any state. Mining, refining and maintenance workshops buy cleaning and formulation solvents through local distributors. In turn, the zone adds steady industrial grade volumes from mine sites and processing plants.
Why do South Australia and the NT grow more slowly?
South Australia and Northern Territory held a 7.5% share of 2025 value and grow at 14.94% a year, because the zone has a smaller population and fewer formulators. South Australia grew 1.0% to 1.92 million people in the year to March 2026, while the Northern Territory reached 268,900. Adelaide coatings, food and defense suppliers still buy regular solvent volumes, so the zone keeps a stable base.
Battery grants, distributor deals and exposure limit reform
| Development | Status and market relevance |
|---|---|
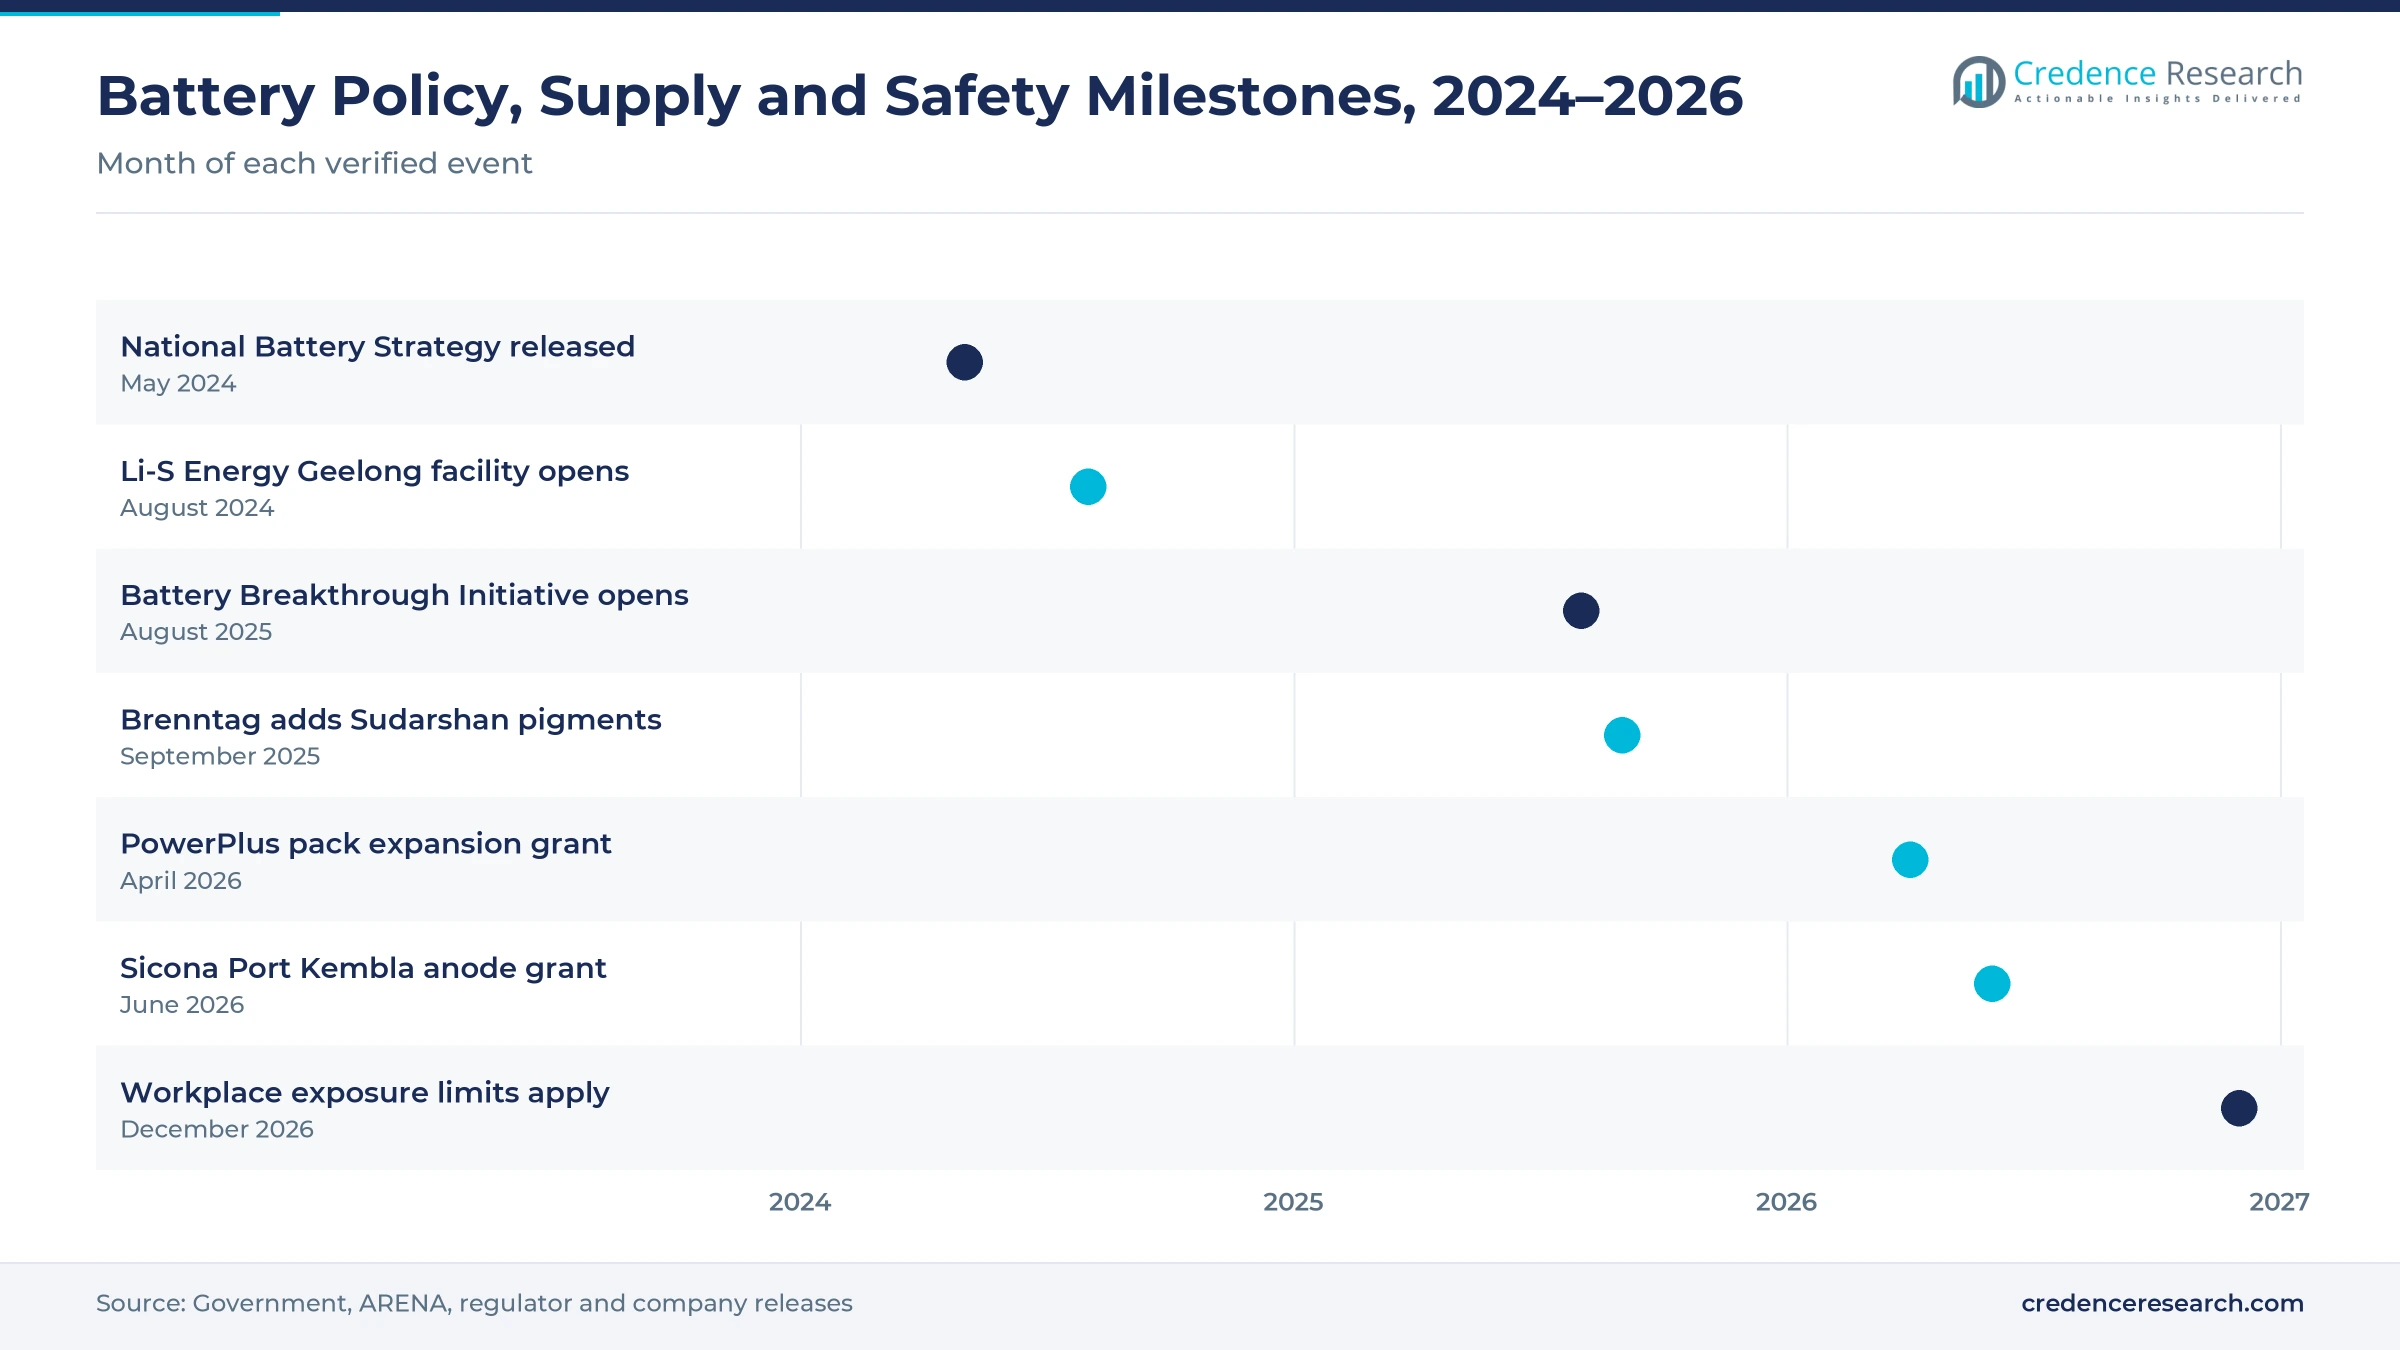
| In May 2024, the federal government released the National Battery Strategy with A$523.2 million for the Battery Breakthrough Initiative. | Sets the policy base for local battery materials and electrolyte demand |
| In August 2024, Li-S Energy opened a 2 MWh lithium sulfur and lithium metal battery facility in Geelong. | Adds pilot-scale cell work that tests new electrolyte formulas |
| In August 2025, ARENA opened the A$500 million Battery Breakthrough Initiative for battery manufacturers. | Names electrolytes among the active materials eligible for support |
| In April 2026, PowerPlus received a A$2.3 million Battery Breakthrough grant to expand its Melbourne pack line. | Lifts planned annual output from 50 MWh to 150 MWh |
| In June 2026, Sicona Battery Technologies secured A$45 million from ARENA for a Port Kembla anode facility. | Signals progress in local battery materials production |
Purity control, drying and safe handling set product value
- Purity grading separates industrial, pharmaceutical and battery material by assay and impurity limits, which sets the price gap between drum solvent and battery grade.
- Moisture control keeps water and acid levels very low in battery grade lots, which protects lithium salts in electrolytes from breaking down.
- Solvent blending combines dimethyl carbonate with other carbonates or resin solvents, which tunes evaporation in coatings and conductivity in cells.
- Dangerous goods handling uses bunded storage, earthing and sealed packs, which lets distributors hold a flammable liquid close to buyers.
Need a Custom Version of This Report?
Tailor the scope, geography, or segments to your exact requirements.
- Custom geography or segment scope
- Direct access to our analyst team
Stockholding distributors and lab suppliers shape access
Competition centers on stockholding distributors that import dimethyl carbonate and sell it with safety data, local stock and technical advice. Brenntag Australia, a subsidiary of Brenntag SE, strengthened its specialty range when it agreed in November 2022 to acquire the Life Science and Coatings business of Ravenswood. Redox, an Australian distributor, serves surface coatings, detergents and human health customers, which match the main solvent and reagent uses. Ixom, headquartered in Melbourne, supplies packaged and bulk chemicals with supply chain services across ten countries. Rowe Scientific has served scientific laboratories since 1987, which gives research and pilot teams a local supply route. Battery projects can also buy direct imports when they need full container loads of battery grade material. Suppliers win by holding stock, meeting dangerous goods rules and offering certified grades.
Which distributors and suppliers lead DMC supply?
| Company | Type | Role in the market |
|---|---|---|
| Brenntag Australia Pty Ltd | Chemical distributor | Distributes chemicals across Australia, with coatings and life science lines |
| Redox Ltd | Chemical distributor | Serves surface coatings, detergents and human health markets |
| Ixom | Chemical supplier and distributor | Supplies packaged and bulk chemicals from its Melbourne base |
| Rowe Scientific Pty Ltd | Scientific supplier | Supplies laboratory products and equipment to scientific laboratories |
Credence Research view on Australian DMC demand
Credence Research's view is that Australian dimethyl carbonate demand will grow fast from a small base, because battery materials and safer solvent formulas both favor the chemical. Industrial grade stays the largest product type through local coatings, adhesive and cleaning makers, while battery grade grows fastest as funded cell, anode and pack projects reach scale. Queensland gains most because its precinct plans concentrate battery work. Distributors that hold certified battery grade stock, manage dangerous goods well and support research teams should win the most new accounts by 2035.
How the Australian DMC estimate was built
The report uses 2025 as the base year on a calendar basis, and market values come from the Credence Research model. That model combines official population statistics, manufacturing data, government battery program releases, workplace safety guidance, chemical property records and company information. Segment splits, regional shares and regional growth rates are Credence Research estimates, with regional shares based on state population and battery project locations. Sources used are government and regulator pages, statistical releases, company websites and trade media, and no interviews or surveys were used.
Battery materials and safer solvents carry growth to 2035
The Australia dimethyl carbonate market is expected to reach USD 27.7 million by 2035, a 15.45% CAGR during 2026–2035, as battery materials projects scale and formulators adopt lower-hazard solvents. Growth should be strongest in battery grade, electrolyte co-solvent use, research and pilot buyers and Queensland, because funded cell and materials lines need high-purity supply. Smaller grant budgets, dangerous goods costs and import dependence could slow some projects, while new exposure limits and specialty distribution should support steady industrial grade demand.
Frequently Asked Questions
How big is the Australia dimethyl carbonate market?
Which product type leads dimethyl carbonate demand?
Which region leads the market?
How does battery policy support demand?
How do new exposure limits affect solvent buyers?
Why is battery grade growing quickly?
Who are the leading companies in the market?
What are the main challenges for suppliers?
Table of Content
Chapter 1 Market Segmentation
- 1.1 Segmentation Framework
- 1.1.1 Product and Service Classification
- 1.1.2 Application and End-Use Classification
- 1.1.3 Technology and Solution Classification
- 1.1.4 Customer and Distribution Channel Classification
- 1.1.5 Geographic Segmentation
- 1.1.6 Market Segment Definitions and Boundaries
- 1.2 By Product Type
- 1.2.1 Industrial Grade
- 1.2.2 Pharmaceutical Grade
- 1.2.3 Battery Grade
- 1.3 By Application
- 1.3.1 Formulation Solvent
- 1.3.2 Cleaning Solvent
- 1.3.3 Synthesis Reagent
- 1.3.4 Electrolyte Co-Solvent
- 1.4 By Sales Channel
- 1.4.1 Stockholding Distributors
- 1.4.2 Direct Imports
- 1.4.3 Scientific Supply Channels
- 1.5 By Customer Type
- 1.5.1 Production Manufacturers
- 1.5.2 Contract Formulators
- 1.5.3 Research and Pilot Operators
Chapter 2 Introduction
- 2.1 Report Objectives and Scope
- 2.2 Product Definition and Industry Terminology
- 2.3 Market Inclusions and Exclusions
- 2.4 Research Process
- 2.4.1 Primary Research and Expert Interviews
- 2.4.2 Secondary Research and Source Review
- 2.4.3 Top-Down and Bottom-Up Estimation
- 2.4.4 Data Triangulation and Verification
- 2.5 Market Size Measurement Basis
- 2.5.1 2025: USD 7.00 million → 2035: USD 27.7 million
- 2.6 Historical and Forecast Reference Periods
- 2.6.1 Historical Period: 2018-2025
- 2.6.2 Base Year: 2025
- 2.6.3 Forecast Period: 2025-2035
- 2.7 Research Assumptions and Limitations
Chapter 3 Executive Summary
- 3.1 Market Snapshot and Key Findings
- 3.2 Base-Year Market Size, 2025
- 3.3 Forecast Market Size, 2035
- 3.4 Revenue and Volume Growth Outlook
- 3.5 Key Demand and Supply Indicators
- 3.6 Leading Market Segments
- 3.7 Fastest-Growing Market Opportunities
- 3.8 Regional Performance Highlights
- 3.9 Technology and Industry Transformation
- 3.10 Competitive Landscape Summary
- 3.11 Analyst View and Strategic Implications
Chapter 4 Australia Dimethyl Carbonate Market Trends and Developments
- 4.1 Historical Industry Development, 2018-2025
- 4.2 Recent Market Trends and Developments
- 4.3 Demand and Customer Behavior Trends
- 4.4 Technology and Product Innovation
- 4.5 Artificial Intelligence, Automation and Digitalization
- 4.6 Local Manufacturing and Supply Chain Realignment
- 4.7 Industry Partnerships, Mergers and Acquisitions
- 4.8 Sustainability and Circular Economy Developments
- 4.9 Government and Private Sector Investment Trends
- 4.10 Emerging Business Models and Commercialization
- 4.11 Industry Developments and Announcements
Chapter 5 Australia Dimethyl Carbonate Market Production, Supply and Demand Analysis
- 5.1 Demand Trend and Consumption Analysis, 2018-2025
- 5.2 Demand Forecast, 2025-2035
- 5.3 Production and Output Trend, 2018-2025
- 5.4 Production and Output Forecast, 2025-2035
- 5.5 Installed Capacity and Capacity Utilization
- 5.6 Company-Wise Production Plants and Statistics
- 5.6.1 Installed Production Capacity
- 5.6.2 Actual Production
- 5.6.3 Planned Capacity and Expansion Targets
- 5.7 Supply Chain Structure and Procurement Trends
- 5.8 Supply-Demand Gap and Bottlenecks
- 5.9 Import Dependence and Sourcing Structure
- 5.10 Contract Manufacturing and Outsourcing
- 5.11 Regional Supply and Demand Concentration
Chapter 6 Australia Dimethyl Carbonate Market Pricing Analysis
- 6.1 Pricing Structure and Measurement
- 6.2 Historical Pricing Trends, 2018-2025
- 6.3 Pricing Outlook, 2025-2035
- 6.4 Average Selling Price and Unit Economics
- 6.5 Pricing by Product and Market Segment
- 6.6 Geographic Pricing Differences
- 6.7 Key Input, Energy, Labor and Logistics Costs
- 6.8 Contract Pricing and Purchasing Models
- 6.9 Pricing Sensitivity and Competitive Positioning
- 6.10 Price, Margin and Profitability Implications
Chapter 7 Australia Dimethyl Carbonate Market Dynamics
- 7.1 Market Growth Drivers
- 7.1.1 Demand-Side Drivers
- 7.1.2 Technology and Innovation Drivers
- 7.1.3 Infrastructure and Investment Drivers
- 7.1.4 Regulatory and Policy Drivers
- 7.2 Market Restraints
- 7.2.1 Cost and Affordability Constraints
- 7.2.2 Technology and Adoption Barriers
- 7.2.3 Supply Chain and Operational Constraints
- 7.3 Market Challenges
- 7.3.1 Competitive Pressure and Margin Erosion
- 7.3.2 Skills, Infrastructure and Implementation Gaps
- 7.4 Emerging Market Opportunities
- 7.5 Market Dynamics Impact and Time-Horizon Assessment
Chapter 8 Australia Dimethyl Carbonate Value Chain Analysis
- 8.1 Industry Value Chain Overview
- 8.2 Upstream Suppliers and Critical Inputs
- 8.3 Technology and Component Providers
- 8.4 Manufacturing or Service Delivery
- 8.5 Distribution, Channel Partners and Integrators
- 8.6 Downstream Applications and End Users
- 8.7 Value Addition and Profit Pools
- 8.8 Vertical Integration and Outsourcing
- 8.9 Supplier Concentration and Risk
- 8.10 Supply Chain Localization and Resilience
Chapter 9 Australia Dimethyl Carbonate Market Regulations and Policies
- 9.1 Relevant Laws, Standards and Compliance Frameworks
- 9.2 Product, Service, Safety and Quality Requirements
- 9.3 Government Policies, Incentives and Subsidies
- 9.4 Imports, Exports and Trade Barriers
- 9.5 Public Procurement and Local Content Requirements
- 9.6 Environmental and Sustainability Compliance
- 9.7 Upcoming Policy Changes and Market Implications
Chapter 10 Australia Dimethyl Carbonate Market Hotspots and Opportunities
- 10.1 Market Opportunity Mapping and Growth Hotspots
- 10.2 High-Growth Applications and Customer Groups
- 10.3 Underserved Markets and White-Space Opportunities
- 10.4 Emerging Technology and Product Opportunities
- 10.5 New Capacity and Investment Hotspots
- 10.6 Market Entry and Expansion Opportunities
- 10.7 Distribution and Partnership Opportunities
- 10.8 Near-Term and Long-Term Commercial Potential
- 10.9 Opportunity Attractiveness and Execution Risks
Chapter 11 Australia Dimethyl Carbonate Market Outlook, 2025-2035
- 11.1 Market Size and Analysis
- 11.1.1 Revenue (Market Measurement: 2025: USD 7.00 million → 2035: USD 27.7 million)
- 11.1.2 Market Volume and Quantity Sold
- 11.1.3 Historical Market Size, 2018-2025
- 11.1.4 Base-Year Market Size, 2025
- 11.2 Market Forecast, 2025-2035
- 11.2.1 Revenue Forecast to 2035
- 11.2.2 Volume Forecast to 2035
- 11.2.3 CAGR and Year-on-Year Growth
- 11.2.4 Incremental Revenue Opportunity
- 11.3 Forecast Assumptions and Scenario Analysis
- 11.3.1 Base-Case Forecast
- 11.3.2 Optimistic and Conservative Scenarios
- 11.3.3 Technology, Pricing and Policy Sensitivities
- 11.4 Market Attractiveness and Growth Outlook
Chapter 12 Australia Dimethyl Carbonate Market Segmentation and Outlook
- 12.1 Segmentation Summary and Market Shares, 2025
- 12.2 Largest and Fastest-Growing Segments
- 12.3 By Product Type - Market Size and Forecast, 2025-2035
- 12.3.1 Segment Definition and Scope
- 12.3.2 Historical Market Size, 2018-2025
- 12.3.3 Revenue Forecast, 2025-2035
- 12.3.4 Volume Forecast, 2025-2035
- 12.3.5 Base-Year Market Share, 2025
- 12.3.6 Segment CAGR and Growth Drivers
- 12.3.7 Subsegment Market Size and Forecast
- 12.3.7.1 Industrial Grade
- 12.3.7.2 Pharmaceutical Grade
- 12.3.7.3 Battery Grade
- 12.3.8 Subsegment Pricing and Adoption Trends
- 12.3.9 Leading Suppliers and Competition
- 12.3.10 Regional Demand and Opportunities
- 12.4 By Application - Market Size and Forecast, 2025-2035
- 12.4.1 Segment Definition and Scope
- 12.4.2 Historical Market Size, 2018-2025
- 12.4.3 Revenue Forecast, 2025-2035
- 12.4.4 Volume Forecast, 2025-2035
- 12.4.5 Base-Year Market Share, 2025
- 12.4.6 Segment CAGR and Growth Drivers
- 12.4.7 Subsegment Market Size and Forecast
- 12.4.7.1 Formulation Solvent
- 12.4.7.2 Cleaning Solvent
- 12.4.7.3 Synthesis Reagent
- 12.4.7.4 Electrolyte Co-Solvent
- 12.4.8 Subsegment Pricing and Adoption Trends
- 12.4.9 Leading Suppliers and Competition
- 12.4.10 Regional Demand and Opportunities
- 12.5 By Sales Channel - Market Size and Forecast, 2025-2035
- 12.5.1 Segment Definition and Scope
- 12.5.2 Historical Market Size, 2018-2025
- 12.5.3 Revenue Forecast, 2025-2035
- 12.5.4 Volume Forecast, 2025-2035
- 12.5.5 Base-Year Market Share, 2025
- 12.5.6 Segment CAGR and Growth Drivers
- 12.5.7 Subsegment Market Size and Forecast
- 12.5.7.1 Stockholding Distributors
- 12.5.7.2 Direct Imports
- 12.5.7.3 Scientific Supply Channels
- 12.5.8 Subsegment Pricing and Adoption Trends
- 12.5.9 Leading Suppliers and Competition
- 12.5.10 Regional Demand and Opportunities
- 12.6 By Customer Type - Market Size and Forecast, 2025-2035
- 12.6.1 Segment Definition and Scope
- 12.6.2 Historical Market Size, 2018-2025
- 12.6.3 Revenue Forecast, 2025-2035
- 12.6.4 Volume Forecast, 2025-2035
- 12.6.5 Base-Year Market Share, 2025
- 12.6.6 Segment CAGR and Growth Drivers
- 12.6.7 Subsegment Market Size and Forecast
- 12.6.7.1 Production Manufacturers
- 12.6.7.2 Contract Formulators
- 12.6.7.3 Research and Pilot Operators
- 12.6.8 Subsegment Pricing and Adoption Trends
- 12.6.9 Leading Suppliers and Competition
- 12.6.10 Regional Demand and Opportunities
- 12.7 Segment Growth Comparison
- 12.8 Segment Attractiveness and Priority Matrix
Chapter 13 Australia Dimethyl Carbonate End-Use and Application Market Outlook
- 13.1 End-Use Industry and Customer Demand Structure
- 13.2 Leading Applications and Customer Groups
- 13.3 End-Use Market Size, Share and Forecast
- 13.4 Major End-Use Industry Deep Dives
- 13.4.1 Customer Requirements and Use Cases
- 13.4.2 Demand and Replacement Cycles
- 13.4.3 Technical and Regulatory Considerations
- 13.4.4 Purchasing and Procurement Models
- 13.4.5 Leading Vendors and Distribution Channels
- 13.4.6 Forecast and Commercial Opportunities
- 13.5 Emerging Applications and Cross-Segment Demand
- 13.6 End-Use Industry Investment Priorities
Chapter 14 Australia Dimethyl Carbonate Geographic Market Outlook, 2025-2035
- 14.1 Domestic Market Distribution and Demand Clusters
- 14.2 State- or Province-Wise Market Size and Forecast, 2025-2035
- 14.3 City and Metropolitan Market Outlook
- 14.4 Industrial, Manufacturing and Commercial Clusters
- 14.5 Geographic Concentration of Key End Users
- 14.6 Local Pricing and Purchasing Differences
- 14.7 Domestic Production Facilities and Capacity Map
- 14.8 Local Infrastructure and Project Pipeline
- 14.9 State-Level Policy and Incentive Differences
- 14.10 Subnational Investment Hotspots and Opportunities
- 14.11 Distribution and Logistics Networks
- 14.12 Domestic Competitive Footprint
Chapter 15 Australia Dimethyl Carbonate Technology, Innovation and Sustainability Outlook
- 15.1 Technology Landscape and Maturity
- 15.2 Product, Process and Service Innovation
- 15.3 AI, Automation and Digital Tools in the Industry
- 15.4 Technology Adoption and Performance Benchmarking
- 15.5 Innovation Pipeline and R&D Investment
- 15.6 Patent and Intellectual Property Trends
- 15.7 Energy Efficiency and Resource Management
- 15.8 Sustainability, Recycling and Circularity
- 15.9 Technology Roadmap, 2025-2035
- 15.10 Risks of Obsolescence and Technology Substitution
Chapter 16 Australia Dimethyl Carbonate Market Key Strategic Imperatives
- 16.1 Growth and Market Entry Priorities
- 16.2 High-Return Products and Segments
- 16.3 Pricing, Profitability and Cost Optimization
- 16.4 Technology Investment and Product Differentiation
- 16.5 Supply Chain Localization and Resilience
- 16.6 Distribution and Customer Acquisition
- 16.7 Partnership, Acquisition and Capacity Strategy
- 16.8 Regional Expansion Priorities
- 16.9 Short-, Medium- and Long-Term Actions
Chapter 17 Competition Outlook
- 17.1 Industry Competition Characteristics
- 17.2 Market Structure and Concentration
- 17.3 Market Share and Competitive Positioning, 2025
- 17.4 Company-Wise Revenue and Product Benchmarking
- 17.5 Production and Service Capacity Benchmarking
- 17.6 Technology, Pricing and Differentiation
- 17.7 Regional Footprint and Distribution Strength
- 17.8 Mergers, Acquisitions and Strategic Alliances
- 17.9 New Entrants and Competitive Threats
- 17.10 Porter's Five Forces and Industry Attractiveness
- 17.11 Competitive Outlook, 2025-2035
Chapter 18 Company Profiles
- 18.1 Company Coverage and Selection Criteria
- 18.2 Brenntag Australia Pty Ltd
- 18.2.1 Business Description
- 18.2.2 Company Ownership and Geographic Presence
- 18.2.3 Product and Service Portfolio
- 18.2.4 Manufacturing and Operating Footprint
- 18.2.5 Production Capacity and Expansion Plans
- 18.2.6 Financial Performance and Investment
- 18.2.7 Market Share and Competitive Position
- 18.2.8 Technology and Innovation Capabilities
- 18.2.9 Strategic Alliances or Partnerships
- 18.2.10 Recent Developments
- 18.2.11 Growth Strategy and Outlook
- 18.3 Redox Ltd
- 18.4 Ixom
- 18.5 Univar Solutions Australia
- 18.6 Rowe Scientific Pty Ltd
- 18.7 Other Relevant Market Participants
Note: Every listed company is profiled on the structure shown under the first company. The company list is preliminary and may change based on research findings, market developments, data availability and client requirements.
Chapter 19 Disclaimer
- 19.1 Research and Forecast Disclaimer
- 19.2 Data Source and Estimation Limitations
Note: The depth of individual sections depends on data availability for this market. Volume, capacity, trade and other unit-based metrics are included where applicable.

