
Binary geothermal and factory heat recovery lift ORC demand
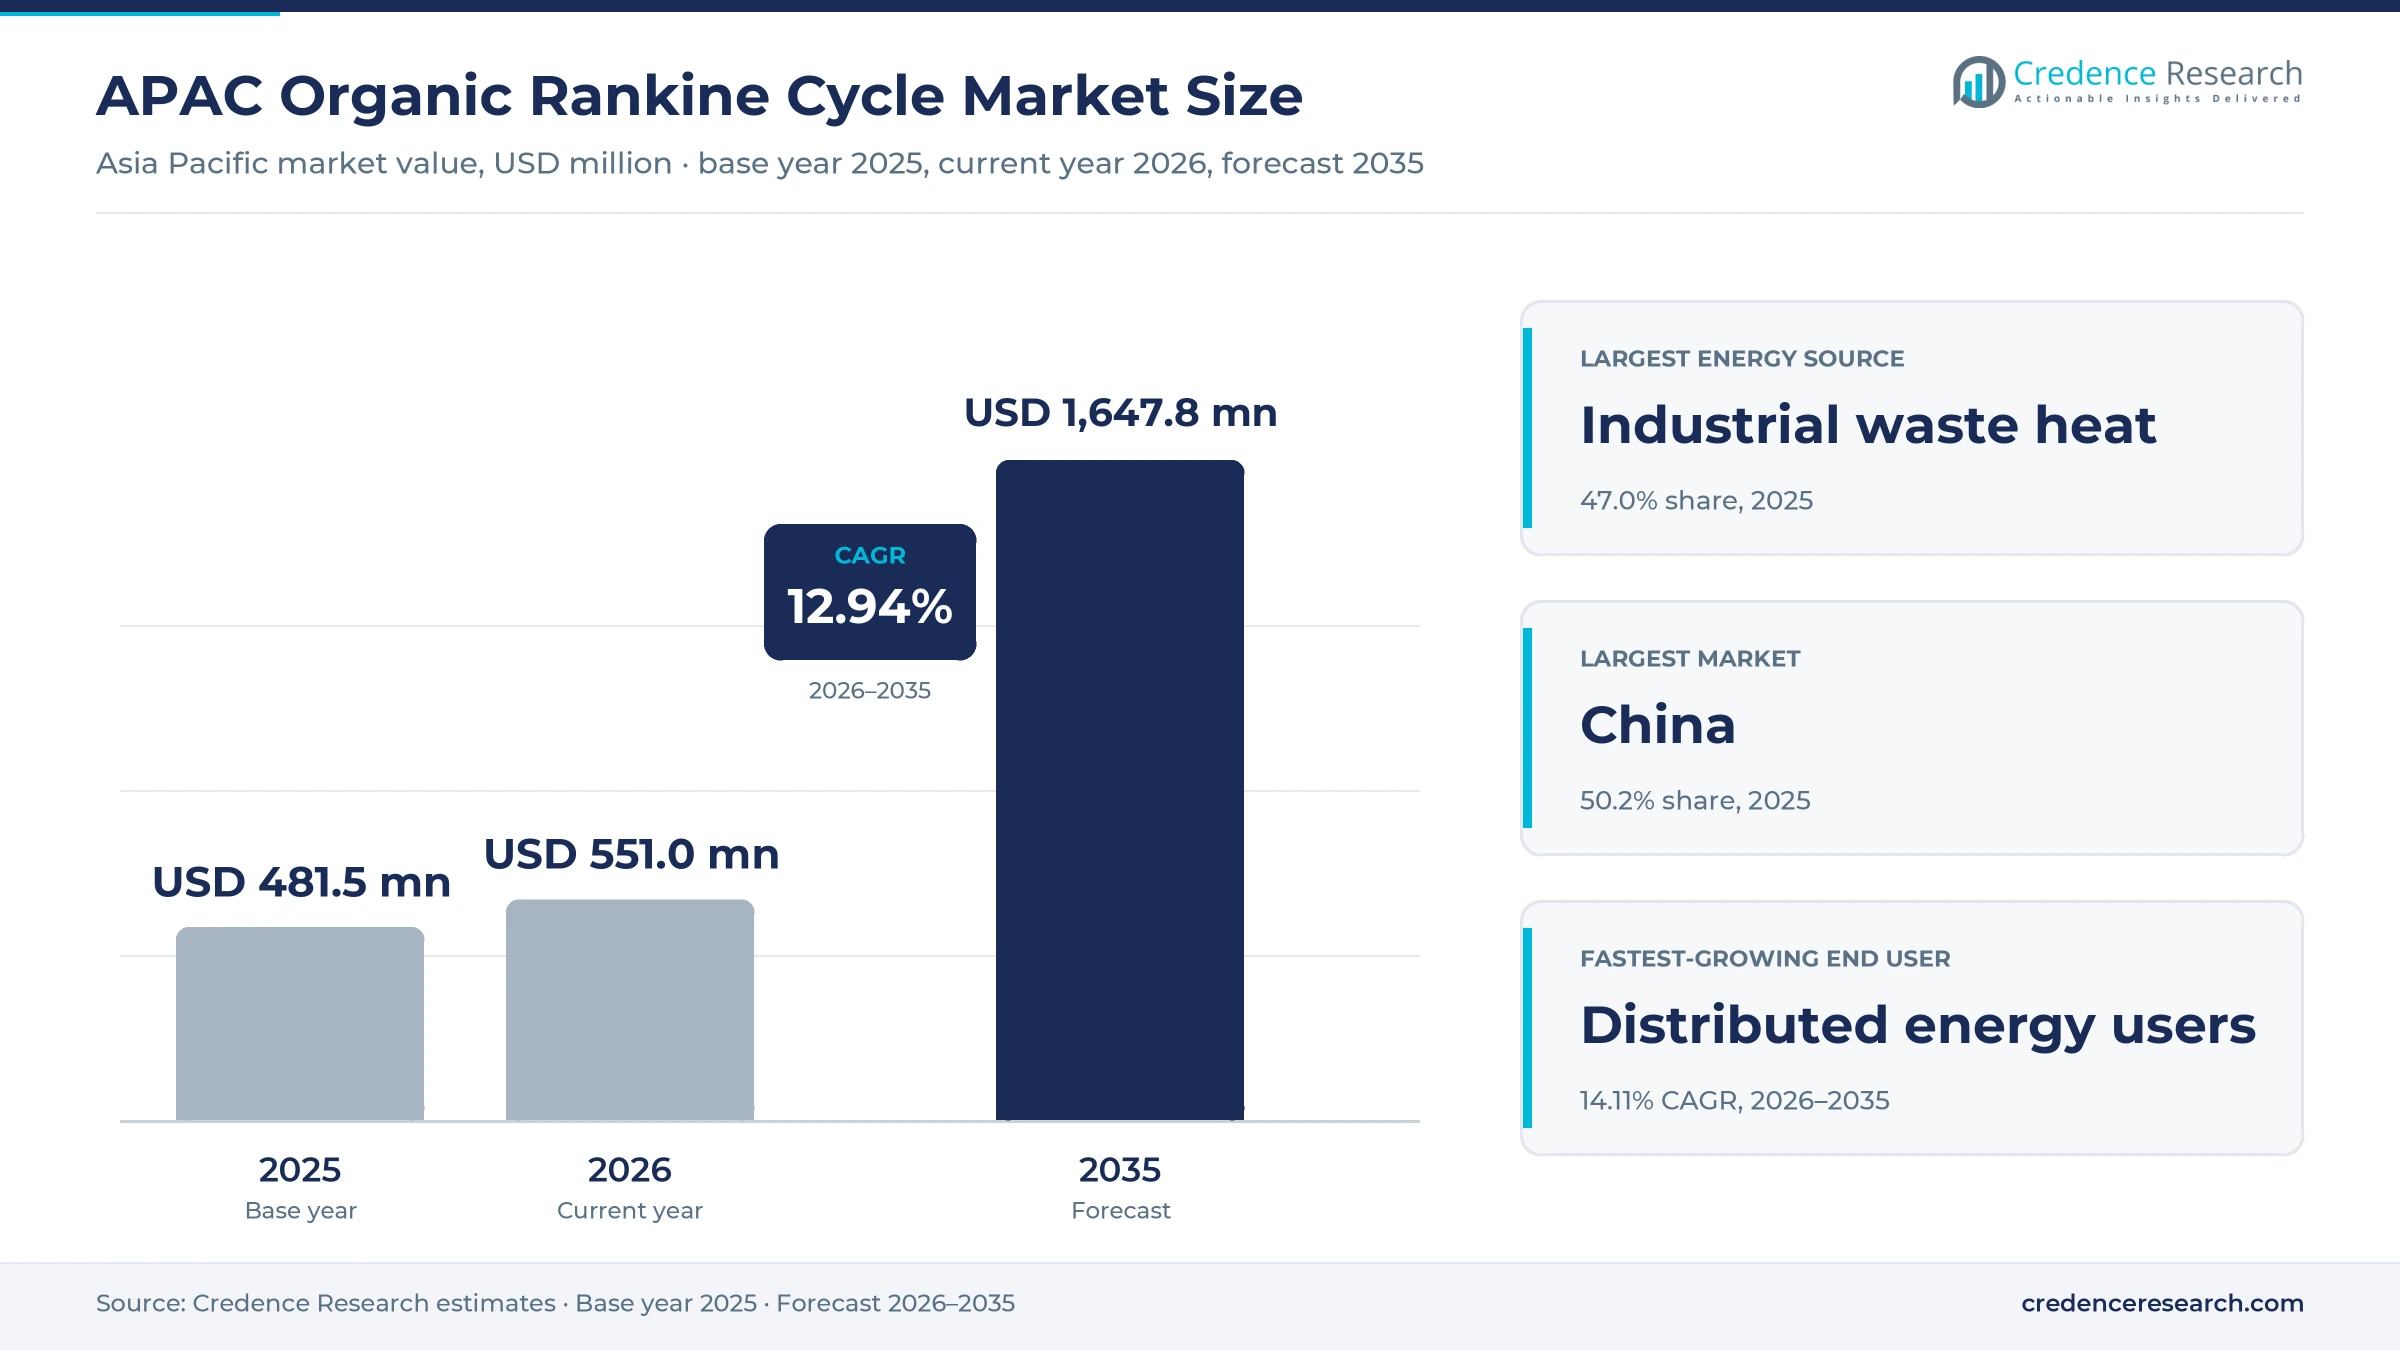
The APAC organic Rankine cycle market was valued at USD 481.5 million in 2025 and is projected to increase from USD 533.5 million in 2026 to USD 1.34 billion by 2035, registering a CAGR of 10.80% during 2026–2035. Demand comes from utilities that add binary units to geothermal fields, factories that turn low-grade exhaust heat into power and biomass plants that need small turbines for steady output. China held the largest share, 50.2% in 2025, because steel, cement and chemical plants recover heat under national energy-saving targets. New Zealand is the fastest-growing market at 15.76% a year, as large binary expansions at Taupo-area fields move toward commercial operation. Southeast Asia adds steady orders from Indonesian and Philippine operators that recover heat from brine at existing flash plants. Technology is also shifting, because screw expanders and packaged modules now make units below 1 MWe practical for small factories and hot spring sites.
What does the regional ORC estimate cover?
The estimate measures the value of organic Rankine cycle systems sold and serviced in China, New Zealand, Southeast Asia and the remaining covered Asia-Pacific markets. It counts turbine and expander packages, heat exchangers, working fluid systems and controls, along with engineering, construction and operations and maintenance contracts tied to these units. Projects bought as stand-alone equipment and as full turnkey plants both count toward the total.
The estimate excludes conventional steam turbines, flash geothermal plants, heat pumps and the value of electricity sold by ORC plants. The value chain runs from turbine and expander makers through heat exchanger suppliers and engineering contractors to utilities, independent power producers, factories and energy-service companies that own and operate the units.
APAC Organic Rankine Cycle Market Insights
- The APAC organic Rankine cycle market was valued at USD 481.5 million in 2025 and is projected to reach USD 1.34 billion by 2035, registering a CAGR of 10.80% during 2026–2035.
- China held 50.2% of 2025 value, because steel, cement and chemical plants recover exhaust heat under national energy-saving and carbon-cutting plans.
- Industrial waste heat led energy sources with a 47.0% share of 2025 value, while geothermal heat grows fastest at 11.45% a year.
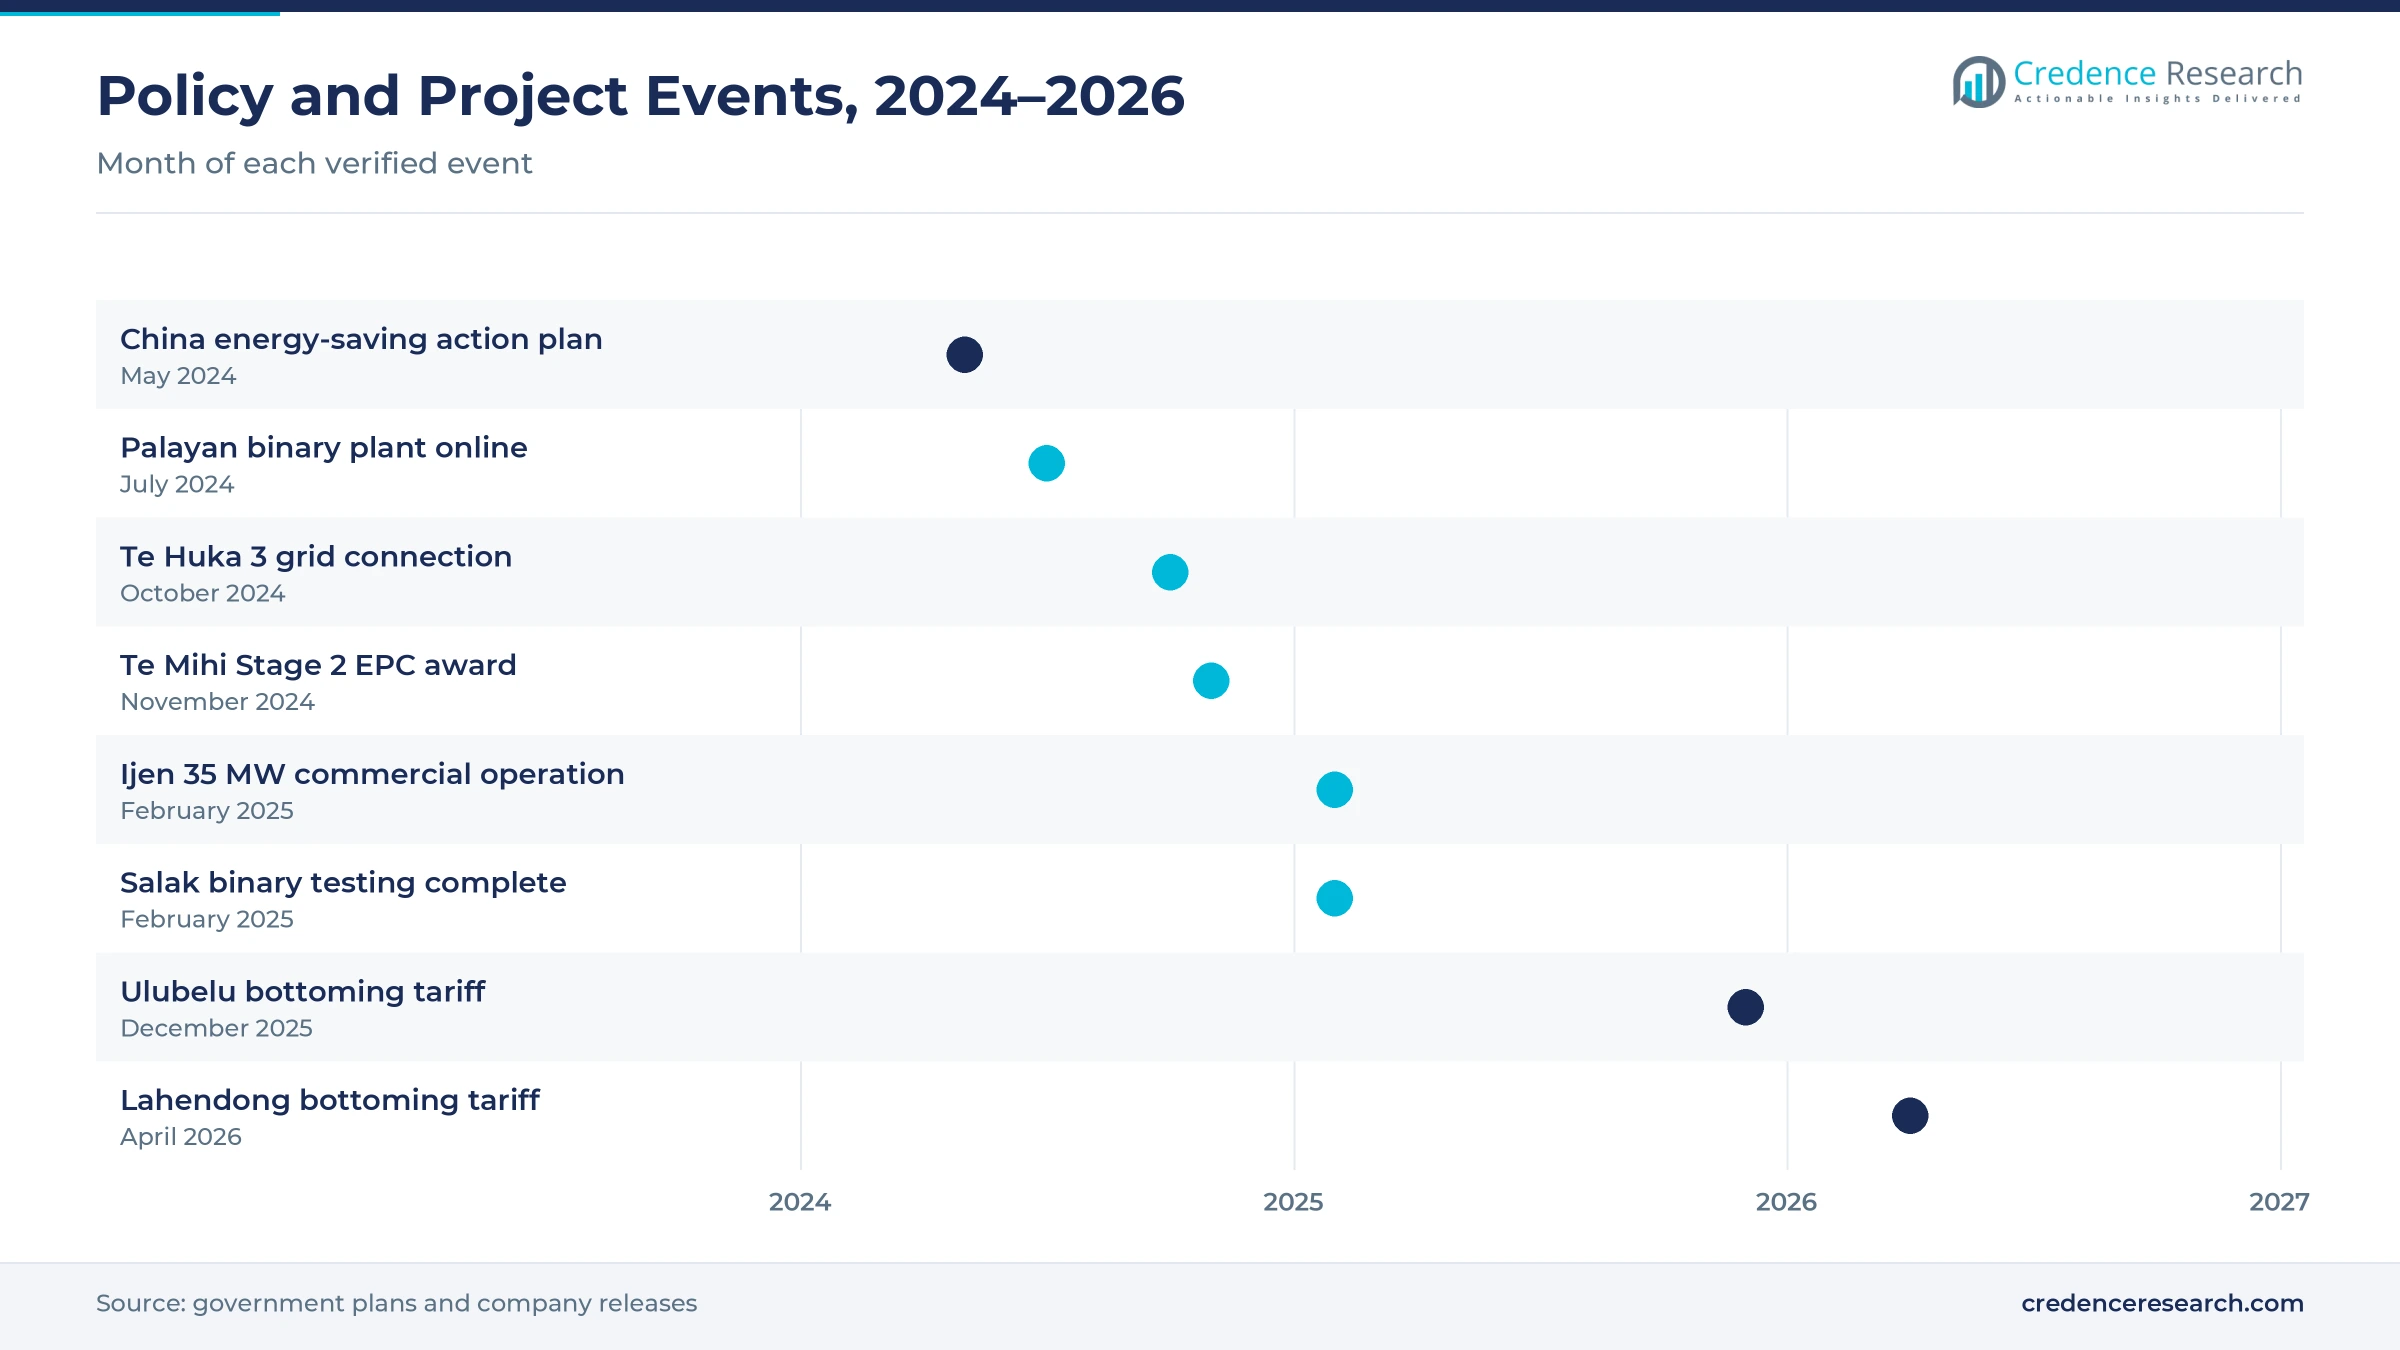
- Ormat and Medco Power Indonesia began commercial operation of the 35 MW first phase of the Ijen binary geothermal plant in East Java on Feb. 10, 2025.
- Pertamina Geothermal Energy and PLN Indonesia Power agreed a tariff for the 30 MW Ulubelu binary bottoming unit on Dec. 24, 2025, targeting operation in 2027.
Waste heat leads while geothermal heat grows fastest
Why does industrial waste heat lead energy sources?
Based on energy source, the market is categorized into geothermal heat, industrial waste heat, biomass heat and solar and residual renewable heat. Industrial waste heat led with a 47.0% share of 2025 value, because Chinese steel, cement and glass plants recover exhaust heat to meet energy-saving targets. Geothermal heat grows fastest at 11.45% a year, as Indonesian, Philippine and New Zealand operators add binary units to existing fields.
How does bottoming-cycle recovery shape applications?
Based on application, the market is categorized into standalone power generation, bottoming-cycle power recovery and combined heat and power. Bottoming-cycle power recovery led with a 52.0% share of 2025 value, because most units recover heat left over from furnaces, engines or flash geothermal plants. Standalone power generation grows fastest at 11.27% a year, as greenfield binary geothermal plants such as Ijen sell their full output under long contracts.
Why do electricity generators lead end-user demand?
Based on end user, the market is categorized into electricity generators, process manufacturers, bioenergy operators and distributed energy users. Electricity generators led with a 41.0% share of 2025 value, because geothermal utilities buy the largest binary units in the region. Distributed energy users grow fastest at 11.97% a year, as hot spring owners, small factories and remote sites install packaged modules rated below 1 MWe.
How does project size split regional demand?
Based on project scale, the market is categorized into below 0.5 MWe, 0.5 to below 5 MWe, 5 to below 20 MWe and 20 MWe and above. 20 MWe and above led with a 33.0% share of 2025 value, because single geothermal binary plants such as Te Huka 3 and Ijen exceed 30 MW. Below 0.5 MWe grows fastest at 11.87% a year, as packaged modules reach hot springs and small factories.
| Segment Group | Leading Sub-segment | Share, 2025 | Fastest-growing Sub-segment | CAGR, 2026–2035 |
|---|---|---|---|---|
| By Energy Source | Industrial waste heat | 47.0% | Geothermal heat | 11.45% |
| By Application | Bottoming-cycle power recovery | 52.0% | Standalone power generation | 11.27% |
| By End User | Electricity generators | 41.0% | Distributed energy users | 11.97% |
| By Project Scale | 20 MWe and above | 33.0% | Below 0.5 MWe | 11.87% |
Request a Free Sample
Fill in your details and we'll send you a free sample report.
- Sample data tables & charts
- Research methodology
Geothermal buying, heat recovery and small units lift sales
How does utility geothermal procurement lift binary orders?
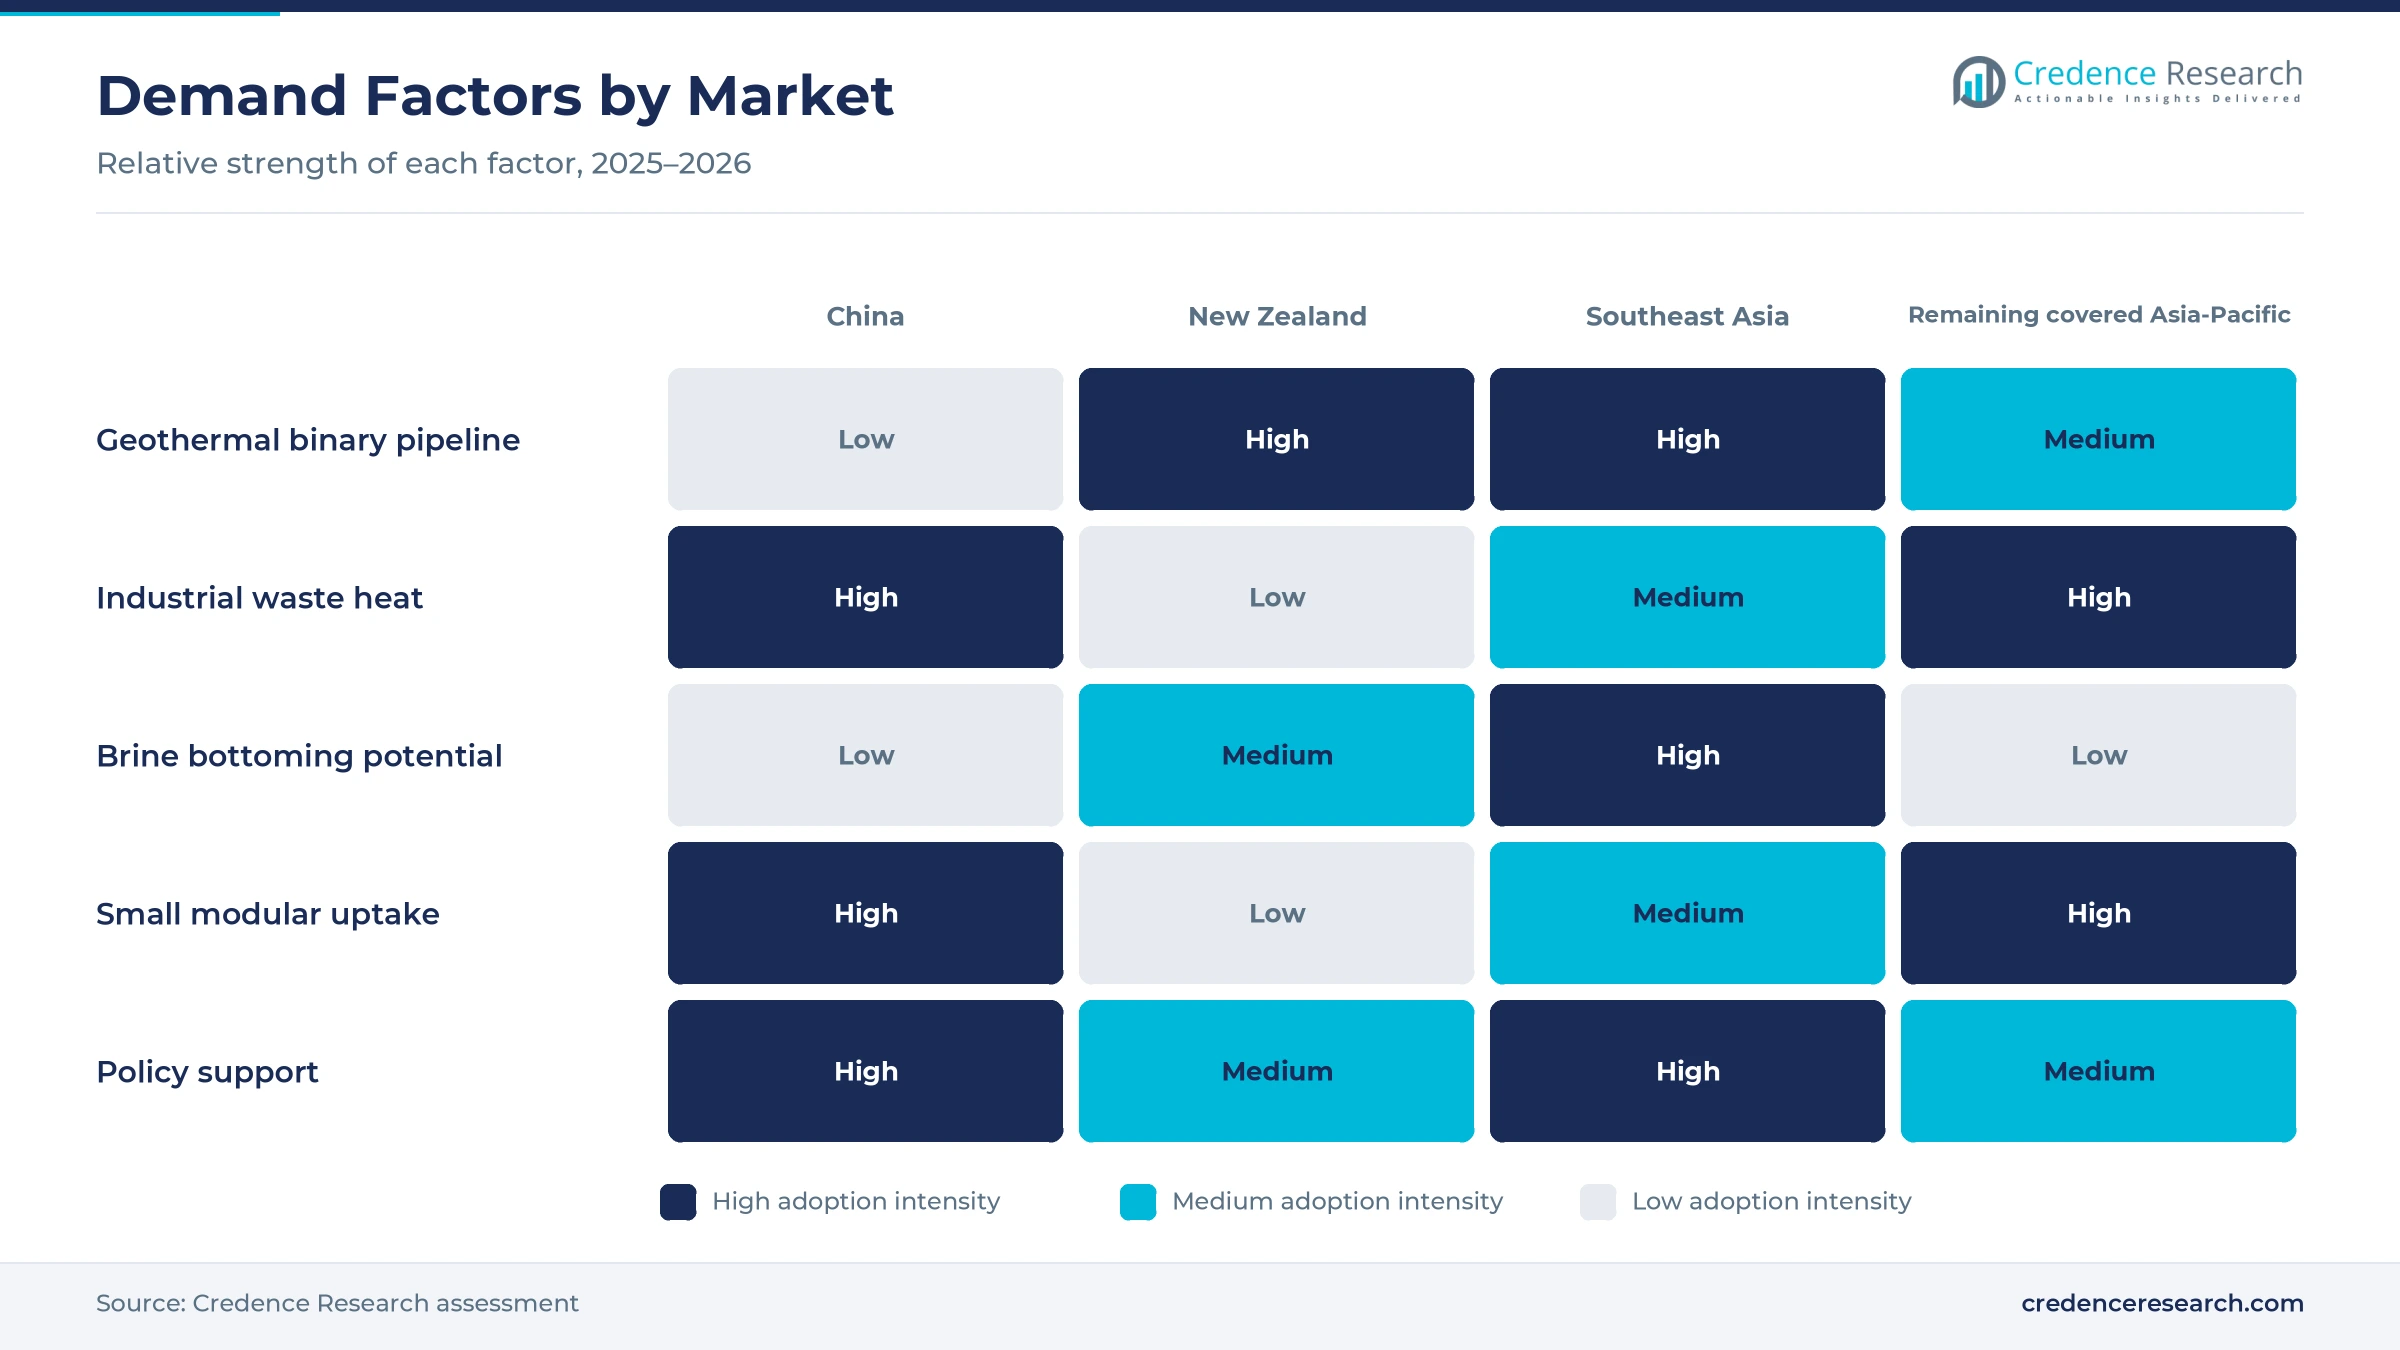
Utilities and power producers in Indonesia, the Philippines and New Zealand are buying large binary units, which makes geothermal procurement the biggest single source of project value. Indonesia holds about 40% of the world's geothermal reserves, according to the World Bank. Indonesia's RUPTL 2025 to 2034 supply plan adds 5.2 GW of geothermal capacity out of 69.5 GW of new generation, Hogan Lovells reported in June 2025. Ormat and Medco Power Indonesia began operating the 35 MW first phase of the Ijen plant on Feb. 10, 2025, under a 30-year power purchase agreement, according to Ormat. As a result, electricity generators lead end-user demand with a 41.0% share of 2025 value.
Why does industrial heat monetization drive Chinese demand?
Chinese factories now treat low-grade exhaust heat as a power source, because national plans reward lower energy use per unit of output. The State Council issued its 2024 to 2025 energy conservation and carbon reduction action plan on May 23, 2024, with a goal to save 50 million tons of standard coal equivalent in key sectors in each year, China Briefing reported. The plan also asks steelmakers to raise the self-generation rate of residual heat, pressure and energy by 3 percentage points. Cement makers must cut about 13 million tons of carbon dioxide over 2024 and 2025 under the same plan. As a result, industrial waste heat leads energy sources with a 47.0% share of 2025 value.
How do modular low-temperature units widen the buyer base?
Packaged ORC modules now run on heat sources as cool as 80 C, which lets small factories and hot spring owners buy units that once suited only utilities. Kaishan Group says its screw-expander ORC systems use low-grade heat above 80 C and have been installed in China and Indonesia, Sustainability Matters reported. ElectraTherm commissioned a Power+ unit rated up to 110 kWe at a Beppu onsen in March 2016, which uses 110 C geothermal steam, ThinkGeoEnergy reported. Pune-based HrimTron Energy Systems is also testing its Avega ORC turbine, rated 55 to 520 kWe, in steel and waste plants, according to NITI Aayog. As a result, units below 0.5 MWe grow fastest by scale at 11.87% a year.
Why do bottoming units at flash plants add new demand?
Operators of flash geothermal plants can add binary units that run on leftover brine, which raises output without new drilling. Pertamina Geothermal Energy and PLN Indonesia Power agreed a tariff for the 30 MW Ulubelu binary bottoming unit on Dec. 24, 2025, and target operation in 2027, according to Pertamina Geothermal Energy. The same partners signed a tariff for the 15 MW Lahendong bottoming unit in April 2026, with operation expected by 2028, ThinkGeoEnergy reported. Kaishan's KS Orka and Pertamina Geothermal Energy also signed a 2023 cooperation pact covering a 210 MW waste heat portfolio at existing fields. As a result, bottoming-cycle power recovery leads applications with a 52.0% share of 2025 value.
Brine bottoming units and local turbines reshape supply
How is brine recovery rising at existing geothermal fields?
Geothermal operators are recovering heat from brine that flash plants used to reinject, which turns sunk well costs into new output. Exergy supplied a 3.6 MW ORC unit for the Mindanao 3 plant in the Philippines, which recovers brine heat from the existing Mindanao 1 and Mindanao 2 plants without new wells, ThinkGeoEnergy reported in April 2022. Energy Development Corporation later ordered a 28 MW Exergy binary system for its 180 MW Mahanagdong plant in Leyte. Star Energy Geothermal completed testing of the 15.5 MW Salak binary plant, built with Ormat equipment, in February 2025. Idle wells and brine in Indonesia could add about 2,000 MW without new drilling, ThinkGeoEnergy reported in January 2023. As a result, Southeast Asia grows at 11.96% a year.
Why are large binary plants emerging in hot reservoirs?
Developers now choose binary units even at high-temperature fields, which lifts average project size across the region. Contact Energy first synchronized the 51.4 MW Te Huka 3 binary unit to the grid on Oct. 14, 2024, and the plant uses pentane heated by geothermal fluid, according to Contact Energy. Contact Energy later selected Ormat in November 2024 to build the 101 MW Te Mihi Stage 2 binary plant, with completion expected around mid-2027, EnergyTech reported. Mercury also hired Ormat in September 2023 for a 56 MW Ngatamariki expansion. As a result, projects of 20 MWe and above lead project scale with a 33.0% share of 2025 value.
Can locally built turbines open room for lower-cost units?
Asian suppliers are designing their own ORC turbines and expanders, which creates an opening for lower-cost units in price-sensitive factories. HrimTron Energy Systems says its Avega turbine costs 30% to 40% less than comparable imported ORC systems, because it avoids imported mechanical parts, NITI Aayog's Frontier Tech hub reported. Nanjing-based TICA bought Exergy in January 2020 and paired its radial outflow turbine with TICA's small PureCycle units, giving a range from 280 kW up to 25 MW per turbine, Power Progress reported. Kaishan Group also builds its screw expanders at its own plants in China. As a result, distributed energy users grow fastest among end users at 11.97% a year.
Is there room for heat recovery at engine and biomass plants?
Gas engine plants and biomass boilers across the region reject heat that small ORC units can convert, which opens a retrofit market for packaged suppliers. Orcan Energy and its partner VPower Group installed 70 efficiency PACK modules on a 90 MW gas engine plant in Myanmar, which adds about 40 GWh of electricity a year, Cleanthinking reported in April 2019. Kobe Steel has marketed its MicroBinary unit since 2011 for factory waste heat and geothermal heat in Japan. Turboden appointed Daiichi Jitsugyo in May 2016 to sell its medium and large ORC units in Japan. As a result, combined heat and power and engine retrofits keep a steady share of regional orders.
Resource risk, lead times and low power prices slow uptake
Why does resource risk slow geothermal binary projects?
Geothermal binary projects depend on wells that may not deliver enough heat, which makes lenders cautious before drilling results are known. Exploring one Indonesian site costs USD 30 to 50 million, and developing a 100 MW site can cost up to USD 400 million, according to the World Bank. As a result, smaller developers struggle to fund early work. Governments respond with risk-sharing facilities, while operators favor bottoming units at proven fields.
How do long lead times delay commissioning?
Large ORC plants take years to move from contract to operation, which delays revenue for owners and suppliers. Star Energy Geothermal contracted Ormat for the Salak binary plant in 2021, but missed operation targets for 2022 and late 2023 before testing finished in February 2025, ThinkGeoEnergy reported. Tariff talks, financing and grid access all add to this delay. Operators respond by reusing existing wells and standardizing binary designs across projects.
Why do low power prices weaken small-unit returns?
Small ORC units earn little when the electricity they save or sell is cheap, which stretches payback for factories. Kaishan Group puts the typical payback of its screw-expander systems at 12 to 18 months, but says the period depends on local energy costs, Sustainability Matters reported. The ElectraTherm unit at a Beppu onsen, for example, sells power under Japan's feed-in tariff for renewables, which shields its owner from low wholesale prices. As a result, units without such support take longer to repay. Suppliers respond with cheaper expanders and shared-savings contracts that cut upfront costs.
How do thin service networks raise operating risk?
Many ORC suppliers are based in Europe or the United States, which leaves Asian owners with long waits for parts and specialist technicians. Many owners in the region run only one or two small units, which gives them little leverage to demand fast repairs from distant suppliers. As a result, small owners face longer outages when a turbine or pump fails. Suppliers respond by training local partners and offering remote monitoring under long service contracts.
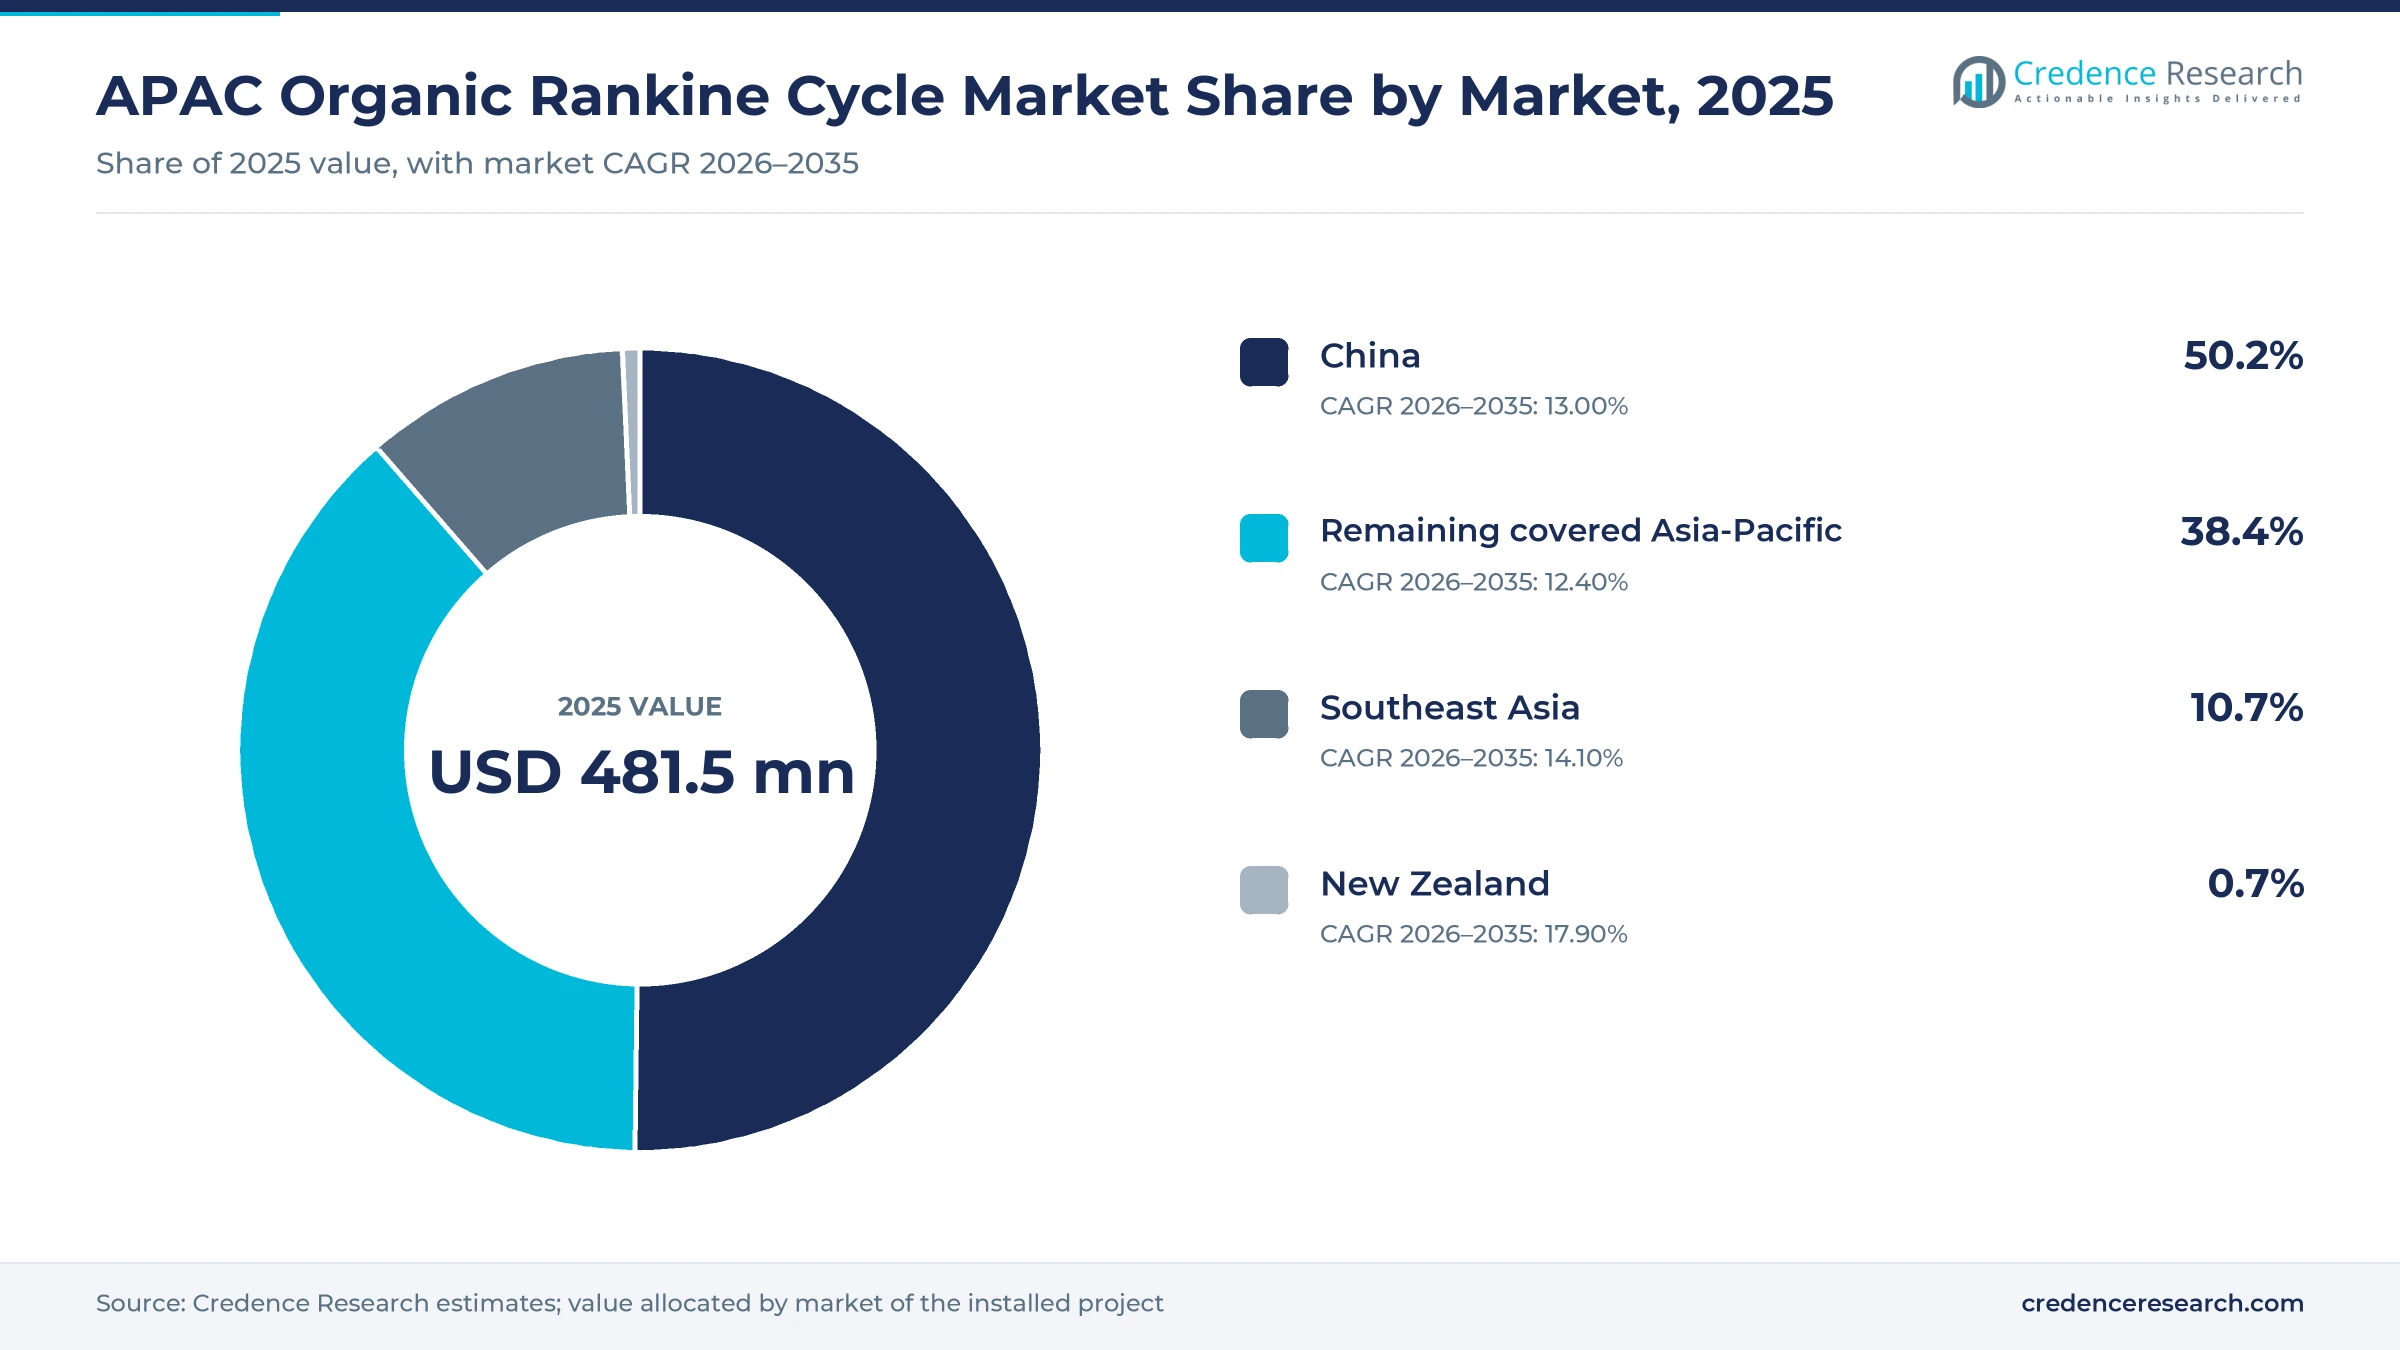
China leads while New Zealand grows fastest
| Market | Value, 2025 (USD million) | Share, 2025 | CAGR, 2026–2035 |
|---|---|---|---|
| China | 241.7 | 50.2% | 10.86% |
| Remaining covered Asia-Pacific | 184.9 | 38.4% | 10.26% |
| Southeast Asia | 51.5 | 10.7% | 11.96% |
| New Zealand | 3.4 | 0.7% | 15.76% |
Why does China lead regional ORC value?
China held 50.2% of 2025 value and grows at 10.86% a year, because its steel, cement and chemical plants form the largest pool of recoverable exhaust heat in the region. Factories install ORC units alongside other waste heat recovery systems to meet the 2024 to 2025 energy-saving plan. Kaishan builds screw expanders domestically, and TICA owns Exergy, which gives Chinese buyers local supply. Geothermal power remains small, however, with a national forecast of 500 MW by 2035.
How does Southeast Asia grow through binary geothermal?
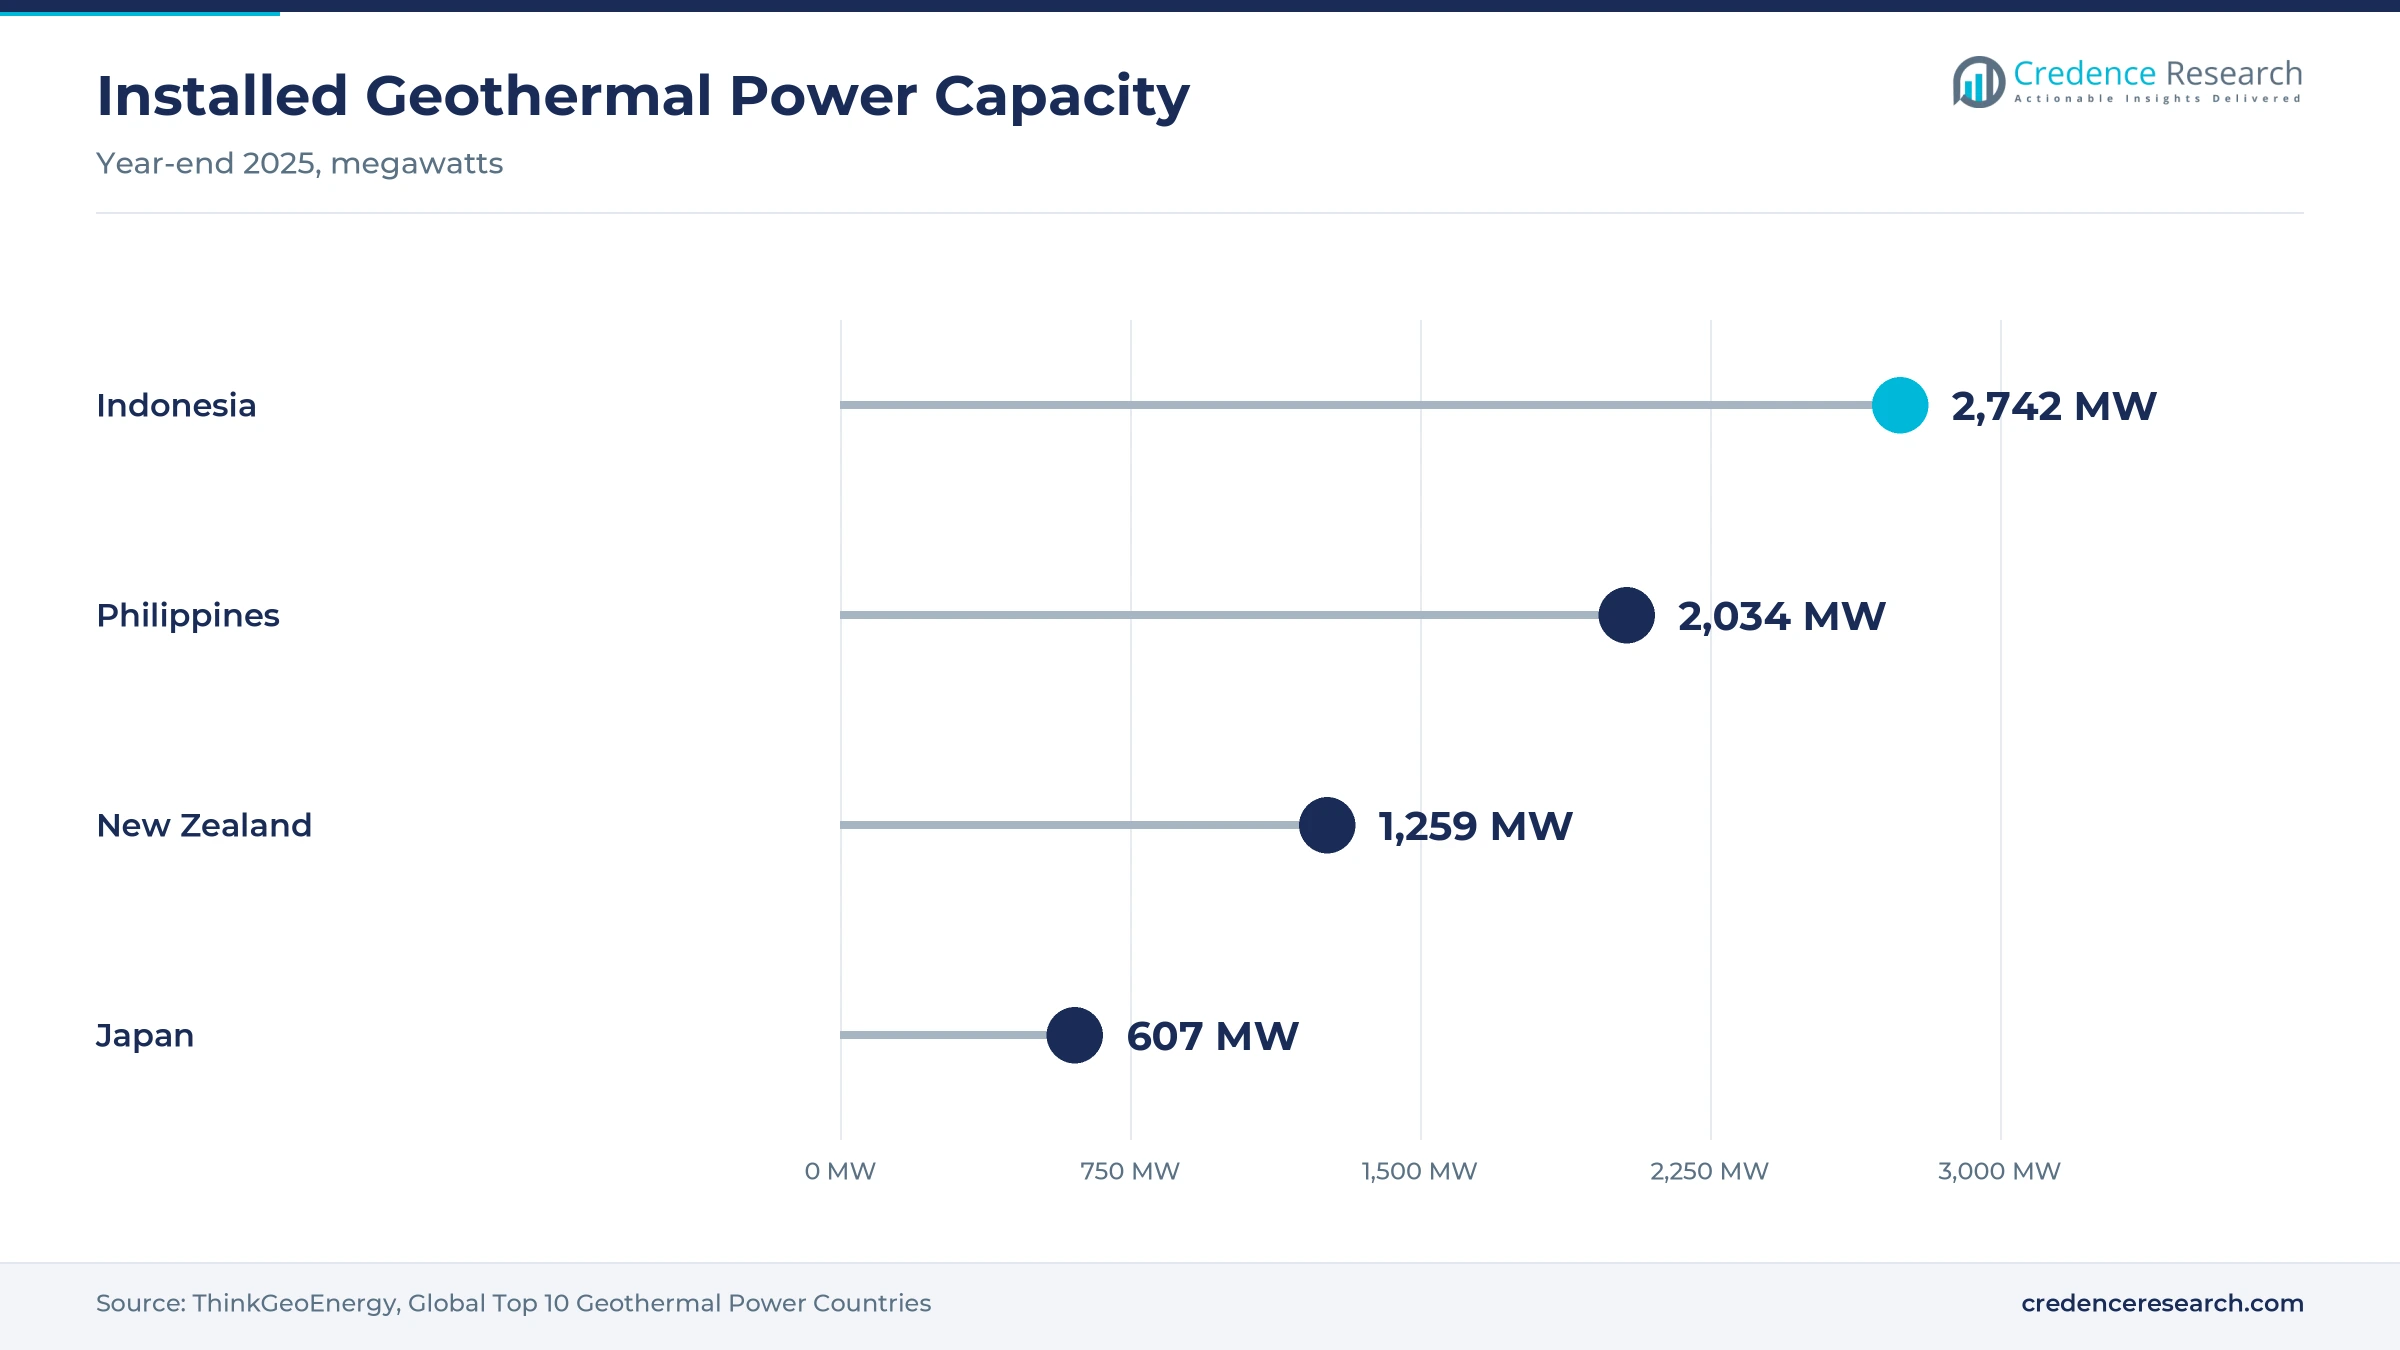
Southeast Asia held a 10.7% share of 2025 value and grows at 11.96% a year, because Indonesia and the Philippines add binary units to large geothermal fleets. Indonesia had 2,742 MW of geothermal capacity and the Philippines 2,034 MW at the end of 2025, ThinkGeoEnergy reported. First Gen and EDC commissioned the 29 MW Palayan binary plant in July 2024. These projects add to wider geothermal power generation capacity in both countries.
Why is New Zealand the fastest-growing market?
New Zealand held a 0.7% share of 2025 value and grows fastest at 15.76% a year, because large a small 2025 base meets large binary expansions due to enter service from 2026 onward. The country had 1,259 MW of geothermal capacity at the end of 2025, including Te Huka 3, ThinkGeoEnergy reported. Ormat is building the 101 MW Te Mihi Stage 2 plant for Contact Energy and a 56 MW Ngatamariki expansion for Mercury, both using units from its Ormat Energy Converter line.
How do the remaining markets add steady demand?
The remaining covered Asia-Pacific markets held a 38.4% share of 2025 value and grow at 10.26% a year, led by Japan, India and South Korea. Japan had 607 MW of geothermal capacity at the end of 2025, and onsen owners there run small binary units from ElectraTherm and Climeon. Indian steel and waste management sites are also testing locally built ORC turbines alongside combined heat and power systems.
Binary plant starts and bottoming tariffs since 2024
| Development | Status and market relevance |
|---|---|
| In July 2024, First Gen and Energy Development Corporation commissioned the 29 MW Palayan binary geothermal plant in the Philippines. | First of seven EDC growth projects to start |
| In October 2024, Contact Energy first synchronized the 51.4 MW Te Huka 3 binary geothermal unit to the New Zealand grid. | Equivalent to about 60,000 homes at full output |
| In February 2025, Ormat and Medco Power Indonesia began commercial operation of the 35 MW first phase of the Ijen geothermal plant. | First geothermal plant in East Java, 110 MW planned |
| In February 2025, Star Energy Geothermal completed testing of the 15.5 MW Salak binary plant built with Ormat equipment. | Raises Star Energy capacity to 901.5 MW |
| In December 2025, Pertamina Geothermal Energy and PLN Indonesia Power agreed a tariff for the 30 MW Ulubelu bottoming unit. | Operation targeted for 2027 |
Radial turbines, screw expanders and small modules compete
- Ormat Energy Converter units power large binary plants such as Ijen, Salak and Te Huka 3, which use organic fluids heated by geothermal brine and steam.
- Radial outflow turbines from Exergy recover brine heat at Philippine plants, which lets EDC raise output at Mindanao and Mahanagdong without new wells.
- Screw expanders from Kaishan run on heat above 80 C, which suits Chinese factories and Indonesian well-head projects with variable flow.
- Packaged small modules such as ElectraTherm Power+ and Kobe Steel MicroBinary units deliver about 100 kWe, which suits onsen and small factory sites.
Need a Custom Version of This Report?
Tailor the scope, geography, or segments to your exact requirements.
- Custom geography or segment scope
- Direct access to our analyst team
Binary specialists and Chinese makers compete on cost
Competition combines geothermal binary specialists, European ORC makers and Chinese equipment groups. Ormat leads large binary geothermal work in Indonesia and New Zealand, where it supplies Ormat Energy Converter units to Medco, Star Energy, Contact Energy and Mercury. Exergy, owned by TICA, competes for brine recovery plants in the Philippines with its radial outflow turbines. Kaishan Group builds screw expanders in China and develops geothermal fields in Indonesia through KS Orka. Turboden, part of Mitsubishi Heavy Industries, sells medium and large units in Japan through Daiichi Jitsugyo. Smaller suppliers, including ElectraTherm, Climeon, Orcan Energy and Kobe Steel, target onsen, engine and factory heat with packaged modules. Companies compete on turbine efficiency at low temperatures, delivery time, local service and the ability to finance or co-develop projects with owners.
Companies profiled and their roles in this market
| Company | Type | Role in the market |
|---|---|---|
| Ormat Technologies | Binary plant supplier and owner | Co-owns the Ijen plant and builds Te Mihi Stage 2 and Ngatamariki units |
| Kaishan Group | Expander maker and developer | Supplied the Lahendong ORC pilot and develops Indonesian fields via KS Orka |
| Exergy International | ORC turbine supplier | Supplied ORC units for EDC Mindanao 3 and Mahanagdong |
| TICA Thermal | Parent equipment group | Owns Exergy and offers PureCycle small ORC units |
| Turboden | ORC turbine supplier | Sells medium and large units in Japan through Daiichi Jitsugyo |
| Kobe Steel | Packaged unit maker | Markets MicroBinary units for factory and geothermal heat in Japan |
| ElectraTherm | Packaged unit maker | Supplied a Power+ unit of up to 110 kWe to a Beppu onsen |
| Climeon | Packaged unit maker | Installed heat power units at Japanese onsen sites |
| Orcan Energy | Packaged unit maker | Supplied 70 modules to a 90 MW gas engine plant in Myanmar |
Credence Research view on regional ORC demand
Credence Research's view is that ORC demand in the Asia-Pacific region will grow at a strong pace, because geothermal utilities and heavy industry both need ways to turn low-grade heat into power. Industrial waste heat keeps the largest energy source share, but geothermal heat grows faster as Indonesia, the Philippines and New Zealand build binary and bottoming units. China stays the largest market, while New Zealand grows fastest from a small base. However, resource risk, long lead times and low power prices will slow some projects. Suppliers that build local service teams should gain share over the decade.
How the regional ORC estimate was built
The report uses 2025 as the base year on a calendar basis, and market values come from the Credence Research model. That model combines installed and planned ORC capacity, geothermal capacity statistics, project costs per megawatt, industrial energy-saving programs and service revenue per unit. Market shares, segment splits and growth rates are Credence Research estimates. Sources used are multilateral lender records, government plans, company releases and filings, and news reports, and no interviews or surveys were used.
Bottoming units and geothermal pipelines lift growth to 2035
APAC organic Rankine cycle value is expected to reach USD 1.34 billion by 2035, a 10.80% CAGR during 2026–2035, as geothermal binary plants, bottoming units and factory heat recovery carry growth. Indonesia should add binary units at Ulubelu, Lahendong and new fields under its 5.2 GW geothermal plan. New Zealand will bring Te Mihi Stage 2 and Ngatamariki into service, while China keeps adding heat recovery at steel and cement plants. Faster tariff approvals would raise this outlook, while weak industrial output or failed wells would lower it.
Frequently Asked Questions
How big is the APAC organic Rankine cycle market?
Which market leads the region?
Which energy source leads demand?
What is a bottoming unit at a geothermal plant?
Which recent projects shaped the market?
Which end users grow fastest?
Who are the leading companies in the region?
What are the main challenges for buyers?
Table of Content
Chapter 1 Market Segmentation
- 1.1 Segmentation Framework
- 1.1.1 Product and Service Classification
- 1.1.2 Application and End-Use Classification
- 1.1.3 Technology and Solution Classification
- 1.1.4 Customer and Distribution Channel Classification
- 1.1.5 Geographic Segmentation
- 1.1.6 Market Segment Definitions and Boundaries
- 1.2 By Energy Source
- 1.2.1 Industrial waste heat
- 1.2.2 Geothermal heat
- 1.2.3 Biomass heat
- 1.2.4 Solar and residual renewable heat
- 1.3 By Application
- 1.3.1 Bottoming-cycle power recovery
- 1.3.2 Standalone power generation
- 1.3.3 Combined heat and power
- 1.4 By End User
- 1.4.1 Electricity generators
- 1.4.2 Process manufacturers
- 1.4.3 Bioenergy operators
- 1.4.4 Distributed energy users
- 1.5 By Project Scale
- 1.5.1 Below 0.5 MWe
- 1.5.2 0.5 to below 5 MWe
- 1.5.3 5 to below 20 MWe
- 1.5.4 20 MWe and above
- 1.6 By Market
- 1.6.1 China
- 1.6.2 New Zealand
- 1.6.3 Southeast Asia
- 1.6.4 Remaining covered Asia-Pacific
Chapter 2 Introduction
- 2.1 Report Objectives and Scope
- 2.2 Product Definition and Industry Terminology
- 2.3 Market Inclusions and Exclusions
- 2.4 Research Process
- 2.4.1 Primary Research and Expert Interviews
- 2.4.2 Secondary Research and Source Review
- 2.4.3 Top-Down and Bottom-Up Estimation
- 2.4.4 Data Triangulation and Verification
- 2.5 Market Size Measurement Basis
- 2.5.1 2025: USD 481.5 million → 2035: USD 1.34 billion
- 2.6 Historical and Forecast Reference Periods
- 2.6.1 Historical Period: 2018-2025
- 2.6.2 Base Year: 2025
- 2.6.3 Forecast Period: 2025-2035
- 2.7 Research Assumptions and Limitations
Chapter 3 Executive Summary
- 3.1 Market Snapshot and Key Findings
- 3.2 Base-Year Market Size, 2025
- 3.3 Forecast Market Size, 2035
- 3.4 Revenue and Volume Growth Outlook
- 3.5 Key Demand and Supply Indicators
- 3.6 Leading Market Segments
- 3.7 Fastest-Growing Market Opportunities
- 3.8 Regional Performance Highlights
- 3.9 Technology and Industry Transformation
- 3.10 Competitive Landscape Summary
- 3.11 Analyst View and Strategic Implications
Chapter 4 APAC Organic Rankine Cycle Market Trends and Developments
- 4.1 Historical Industry Development, 2018-2025
- 4.2 Recent Market Trends and Developments
- 4.3 Demand and Customer Behavior Trends
- 4.4 Technology and Product Innovation
- 4.5 Artificial Intelligence, Automation and Digitalization
- 4.6 Local Manufacturing and Supply Chain Realignment
- 4.7 Industry Partnerships, Mergers and Acquisitions
- 4.8 Sustainability and Circular Economy Developments
- 4.9 Government and Private Sector Investment Trends
- 4.10 Emerging Business Models and Commercialization
- 4.11 Industry Developments and Announcements
Chapter 5 APAC Organic Rankine Cycle Market Production, Supply and Demand Analysis
- 5.1 Demand Trend and Consumption Analysis, 2018-2025
- 5.2 Demand Forecast, 2025-2035
- 5.3 Production and Output Trend, 2018-2025
- 5.4 Production and Output Forecast, 2025-2035
- 5.5 Installed Capacity and Capacity Utilization
- 5.6 Company-Wise Production Plants and Statistics
- 5.6.1 Installed Production Capacity
- 5.6.2 Actual Production
- 5.6.3 Planned Capacity and Expansion Targets
- 5.7 Supply Chain Structure and Procurement Trends
- 5.8 Supply-Demand Gap and Bottlenecks
- 5.9 Import Dependence and Sourcing Structure
- 5.10 Contract Manufacturing and Outsourcing
- 5.11 Regional Supply and Demand Concentration
Chapter 6 APAC Organic Rankine Cycle Market Pricing Analysis
- 6.1 Pricing Structure and Measurement
- 6.2 Historical Pricing Trends, 2018-2025
- 6.3 Pricing Outlook, 2025-2035
- 6.4 Average Selling Price and Unit Economics
- 6.5 Pricing by Product and Market Segment
- 6.6 Geographic Pricing Differences
- 6.7 Key Input, Energy, Labor and Logistics Costs
- 6.8 Contract Pricing and Purchasing Models
- 6.9 Pricing Sensitivity and Competitive Positioning
- 6.10 Price, Margin and Profitability Implications
Chapter 7 APAC Organic Rankine Cycle Market Dynamics
- 7.1 Market Growth Drivers
- 7.1.1 Demand-Side Drivers
- 7.1.2 Technology and Innovation Drivers
- 7.1.3 Infrastructure and Investment Drivers
- 7.1.4 Regulatory and Policy Drivers
- 7.2 Market Restraints
- 7.2.1 Cost and Affordability Constraints
- 7.2.2 Technology and Adoption Barriers
- 7.2.3 Supply Chain and Operational Constraints
- 7.3 Market Challenges
- 7.3.1 Competitive Pressure and Margin Erosion
- 7.3.2 Skills, Infrastructure and Implementation Gaps
- 7.4 Emerging Market Opportunities
- 7.5 Market Dynamics Impact and Time-Horizon Assessment
Chapter 8 APAC Organic Rankine Cycle Value Chain Analysis
- 8.1 Industry Value Chain Overview
- 8.2 Upstream Suppliers and Critical Inputs
- 8.3 Technology and Component Providers
- 8.4 Manufacturing or Service Delivery
- 8.5 Distribution, Channel Partners and Integrators
- 8.6 Downstream Applications and End Users
- 8.7 Value Addition and Profit Pools
- 8.8 Vertical Integration and Outsourcing
- 8.9 Supplier Concentration and Risk
- 8.10 Supply Chain Localization and Resilience
Chapter 9 APAC Organic Rankine Cycle Market Regulations and Policies
- 9.1 Relevant Laws, Standards and Compliance Frameworks
- 9.2 Product, Service, Safety and Quality Requirements
- 9.3 Government Policies, Incentives and Subsidies
- 9.4 Imports, Exports and Trade Barriers
- 9.5 Public Procurement and Local Content Requirements
- 9.6 Environmental and Sustainability Compliance
- 9.7 Upcoming Policy Changes and Market Implications
Chapter 10 APAC Organic Rankine Cycle Market Hotspots and Opportunities
- 10.1 Market Opportunity Mapping and Growth Hotspots
- 10.2 High-Growth Applications and Customer Groups
- 10.3 Underserved Markets and White-Space Opportunities
- 10.4 Emerging Technology and Product Opportunities
- 10.5 New Capacity and Investment Hotspots
- 10.6 Market Entry and Expansion Opportunities
- 10.7 Distribution and Partnership Opportunities
- 10.8 Near-Term and Long-Term Commercial Potential
- 10.9 Opportunity Attractiveness and Execution Risks
Chapter 11 APAC Organic Rankine Cycle Market Outlook, 2025-2035
- 11.1 Market Size and Analysis
- 11.1.1 Revenue (Market Measurement: 2025: USD 481.5 million → 2035: USD 1.34 billion)
- 11.1.2 Market Volume and Quantity Sold
- 11.1.3 Historical Market Size, 2018-2025
- 11.1.4 Base-Year Market Size, 2025
- 11.2 Market Forecast, 2025-2035
- 11.2.1 Revenue Forecast to 2035
- 11.2.2 Volume Forecast to 2035
- 11.2.3 CAGR and Year-on-Year Growth
- 11.2.4 Incremental Revenue Opportunity
- 11.3 Forecast Assumptions and Scenario Analysis
- 11.3.1 Base-Case Forecast
- 11.3.2 Optimistic and Conservative Scenarios
- 11.3.3 Technology, Pricing and Policy Sensitivities
- 11.4 Market Attractiveness and Growth Outlook
Chapter 12 APAC Organic Rankine Cycle Market Segmentation and Outlook
- 12.1 Segmentation Summary and Market Shares, 2025
- 12.2 Largest and Fastest-Growing Segments
- 12.3 By Energy Source - Market Size and Forecast, 2025-2035
- 12.3.1 Segment Definition and Scope
- 12.3.2 Historical Market Size, 2018-2025
- 12.3.3 Revenue Forecast, 2025-2035
- 12.3.4 Volume Forecast, 2025-2035
- 12.3.5 Base-Year Market Share, 2025
- 12.3.6 Segment CAGR and Growth Drivers
- 12.3.7 Subsegment Market Size and Forecast
- 12.3.7.1 Industrial waste heat
- 12.3.7.2 Geothermal heat
- 12.3.7.3 Biomass heat
- 12.3.7.4 Solar and residual renewable heat
- 12.3.8 Subsegment Pricing and Adoption Trends
- 12.3.9 Leading Suppliers and Competition
- 12.3.10 Regional Demand and Opportunities
- 12.4 By Application - Market Size and Forecast, 2025-2035
- 12.4.1 Segment Definition and Scope
- 12.4.2 Historical Market Size, 2018-2025
- 12.4.3 Revenue Forecast, 2025-2035
- 12.4.4 Volume Forecast, 2025-2035
- 12.4.5 Base-Year Market Share, 2025
- 12.4.6 Segment CAGR and Growth Drivers
- 12.4.7 Subsegment Market Size and Forecast
- 12.4.7.1 Bottoming-cycle power recovery
- 12.4.7.2 Standalone power generation
- 12.4.7.3 Combined heat and power
- 12.4.8 Subsegment Pricing and Adoption Trends
- 12.4.9 Leading Suppliers and Competition
- 12.4.10 Regional Demand and Opportunities
- 12.5 By End User - Market Size and Forecast, 2025-2035
- 12.5.1 Segment Definition and Scope
- 12.5.2 Historical Market Size, 2018-2025
- 12.5.3 Revenue Forecast, 2025-2035
- 12.5.4 Volume Forecast, 2025-2035
- 12.5.5 Base-Year Market Share, 2025
- 12.5.6 Segment CAGR and Growth Drivers
- 12.5.7 Subsegment Market Size and Forecast
- 12.5.7.1 Electricity generators
- 12.5.7.2 Process manufacturers
- 12.5.7.3 Bioenergy operators
- 12.5.7.4 Distributed energy users
- 12.5.8 Subsegment Pricing and Adoption Trends
- 12.5.9 Leading Suppliers and Competition
- 12.5.10 Regional Demand and Opportunities
- 12.6 By Project Scale - Market Size and Forecast, 2025-2035
- 12.6.1 Segment Definition and Scope
- 12.6.2 Historical Market Size, 2018-2025
- 12.6.3 Revenue Forecast, 2025-2035
- 12.6.4 Volume Forecast, 2025-2035
- 12.6.5 Base-Year Market Share, 2025
- 12.6.6 Segment CAGR and Growth Drivers
- 12.6.7 Subsegment Market Size and Forecast
- 12.6.7.1 Below 0.5 MWe
- 12.6.7.2 0.5 to below 5 MWe
- 12.6.7.3 5 to below 20 MWe
- 12.6.7.4 20 MWe and above
- 12.6.8 Subsegment Pricing and Adoption Trends
- 12.6.9 Leading Suppliers and Competition
- 12.6.10 Regional Demand and Opportunities
- 12.7 By Market - Market Size and Forecast, 2025-2035
- 12.7.1 Segment Definition and Scope
- 12.7.2 Historical Market Size, 2018-2025
- 12.7.3 Revenue Forecast, 2025-2035
- 12.7.4 Volume Forecast, 2025-2035
- 12.7.5 Base-Year Market Share, 2025
- 12.7.6 Segment CAGR and Growth Drivers
- 12.7.7 Subsegment Market Size and Forecast
- 12.7.7.1 China
- 12.7.7.2 New Zealand
- 12.7.7.3 Southeast Asia
- 12.7.7.4 Remaining covered Asia-Pacific
- 12.7.8 Subsegment Pricing and Adoption Trends
- 12.7.9 Leading Suppliers and Competition
- 12.7.10 Regional Demand and Opportunities
- 12.8 Segment Growth Comparison
- 12.9 Segment Attractiveness and Priority Matrix
Chapter 13 APAC Organic Rankine Cycle End-Use and Application Market Outlook
- 13.1 End-Use Industry and Customer Demand Structure
- 13.2 Leading Applications and Customer Groups
- 13.3 End-Use Market Size, Share and Forecast
- 13.4 Major End-Use Industry Deep Dives
- 13.4.1 Customer Requirements and Use Cases
- 13.4.2 Demand and Replacement Cycles
- 13.4.3 Technical and Regulatory Considerations
- 13.4.4 Purchasing and Procurement Models
- 13.4.5 Leading Vendors and Distribution Channels
- 13.4.6 Forecast and Commercial Opportunities
- 13.5 Emerging Applications and Cross-Segment Demand
- 13.6 End-Use Industry Investment Priorities
Chapter 14 APAC Organic Rankine Cycle Geographic Market Outlook, 2025-2035
- 14.1 Regional Market Size and Country-Level Shares, 2025
- 14.2 Country Market Size Comparison, 2025
- 14.3 Country Market Forecasts, 2025-2035
- 14.4 Subregional Industrial and Demand Clusters
- 14.5 Intra-Regional Pricing and Cost Differences
- 14.6 Cross-Border Trade and Supply Networks
- 14.7 Regional Supply and Demand Balances
- 14.8 Country Opportunity Comparison and Prioritization
Note: Every listed country is covered on the structure shown under the first country.
Chapter 15 APAC Organic Rankine Cycle Technology, Innovation and Sustainability Outlook
- 15.1 Technology Landscape and Maturity
- 15.2 Product, Process and Service Innovation
- 15.3 AI, Automation and Digital Tools in the Industry
- 15.4 Technology Adoption and Performance Benchmarking
- 15.5 Innovation Pipeline and R&D Investment
- 15.6 Patent and Intellectual Property Trends
- 15.7 Energy Efficiency and Resource Management
- 15.8 Sustainability, Recycling and Circularity
- 15.9 Technology Roadmap, 2025-2035
- 15.10 Risks of Obsolescence and Technology Substitution
Chapter 16 APAC Organic Rankine Cycle Market Key Strategic Imperatives
- 16.1 Growth and Market Entry Priorities
- 16.2 High-Return Products and Segments
- 16.3 Pricing, Profitability and Cost Optimization
- 16.4 Technology Investment and Product Differentiation
- 16.5 Supply Chain Localization and Resilience
- 16.6 Distribution and Customer Acquisition
- 16.7 Partnership, Acquisition and Capacity Strategy
- 16.8 Regional Expansion Priorities
- 16.9 Short-, Medium- and Long-Term Actions
Chapter 17 Competition Outlook
- 17.1 Industry Competition Characteristics
- 17.2 Market Structure and Concentration
- 17.3 Market Share and Competitive Positioning, 2025
- 17.4 Company-Wise Revenue and Product Benchmarking
- 17.5 Production and Service Capacity Benchmarking
- 17.6 Technology, Pricing and Differentiation
- 17.7 Regional Footprint and Distribution Strength
- 17.8 Mergers, Acquisitions and Strategic Alliances
- 17.9 New Entrants and Competitive Threats
- 17.10 Porter's Five Forces and Industry Attractiveness
- 17.11 Competitive Outlook, 2025-2035
Chapter 18 Company Profiles
- 18.1 Company Coverage and Selection Criteria
- 18.2 Kaishan Group
- 18.2.1 Business Description
- 18.2.2 Company Ownership and Geographic Presence
- 18.2.3 Product and Service Portfolio
- 18.2.4 Manufacturing and Operating Footprint
- 18.2.5 Production Capacity and Expansion Plans
- 18.2.6 Financial Performance and Investment
- 18.2.7 Market Share and Competitive Position
- 18.2.8 Technology and Innovation Capabilities
- 18.2.9 Strategic Alliances or Partnerships
- 18.2.10 Recent Developments
- 18.2.11 Growth Strategy and Outlook
- 18.3 Ormat Technologies
- 18.4 Turboden
- 18.5 TICA Thermal
- 18.6 Exergy International
- 18.7 Kobe Steel
- 18.8 Orcan Energy
- 18.9 ElectraTherm
- 18.10 Climeon
- 18.11 ENOGIA
- 18.12 Other Relevant Market Participants
Note: Every listed company is profiled on the structure shown under the first company. The company list is preliminary and may change based on research findings, market developments, data availability and client requirements.
Chapter 19 Disclaimer
- 19.1 Research and Forecast Disclaimer
- 19.2 Data Source and Estimation Limitations
Note: The depth of individual sections depends on data availability for this market. Volume, capacity, trade and other unit-based metrics are included where applicable.

