
Biomass and waste fuels drive solid fuel steam projects
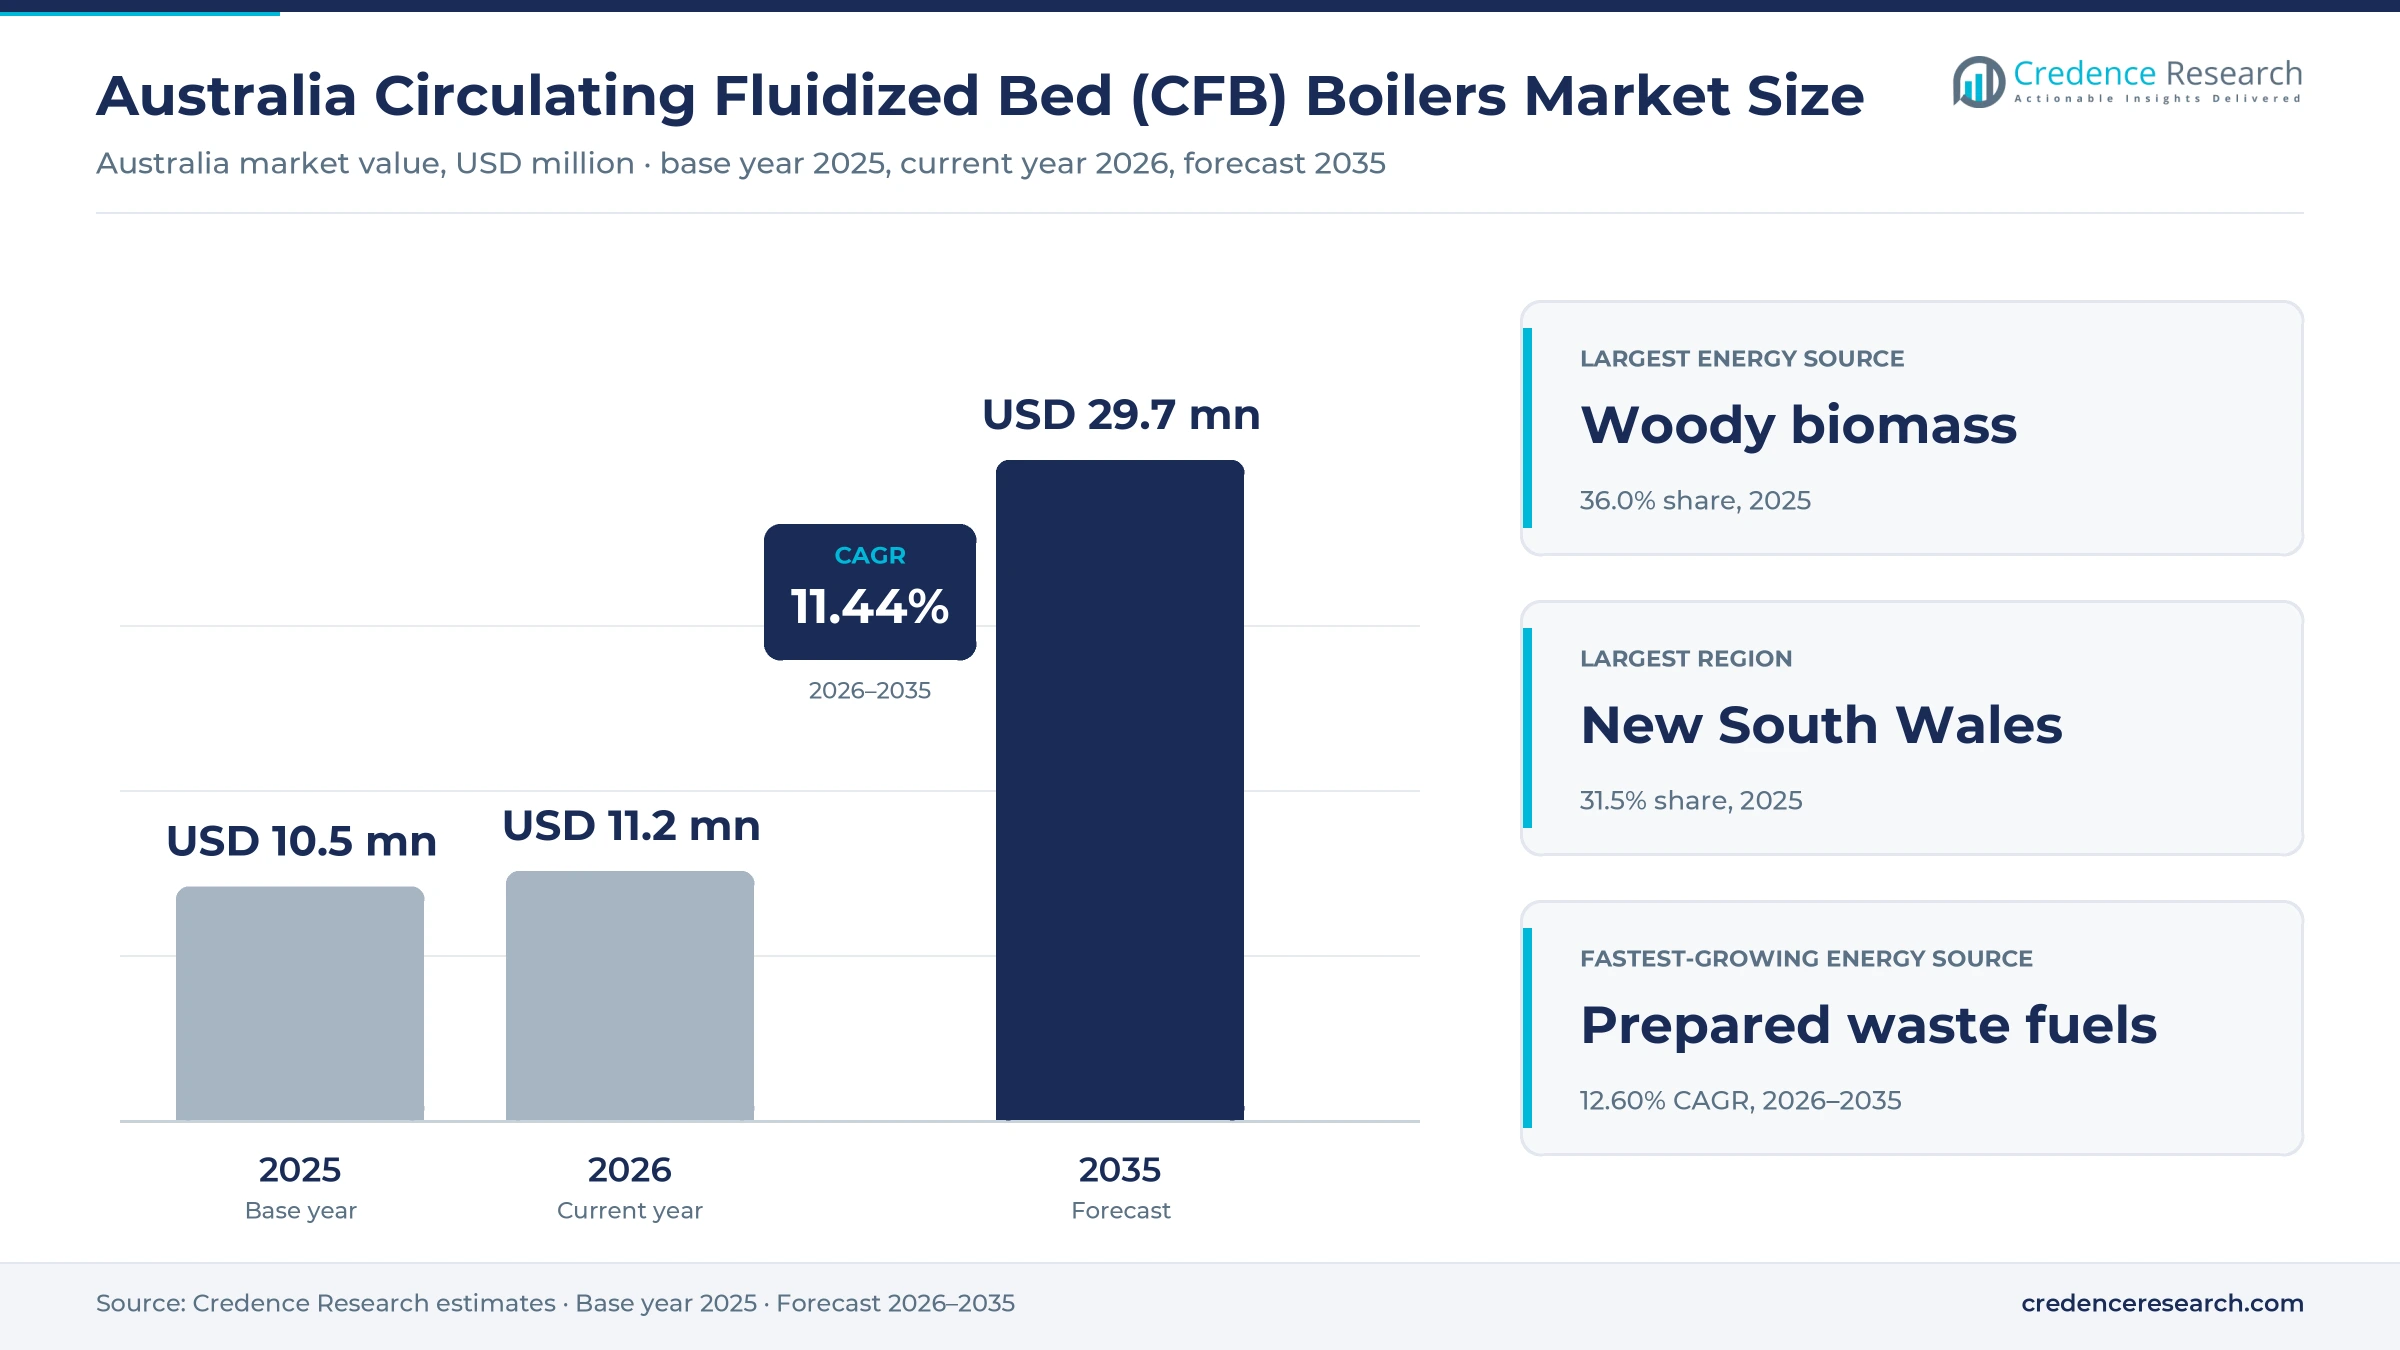
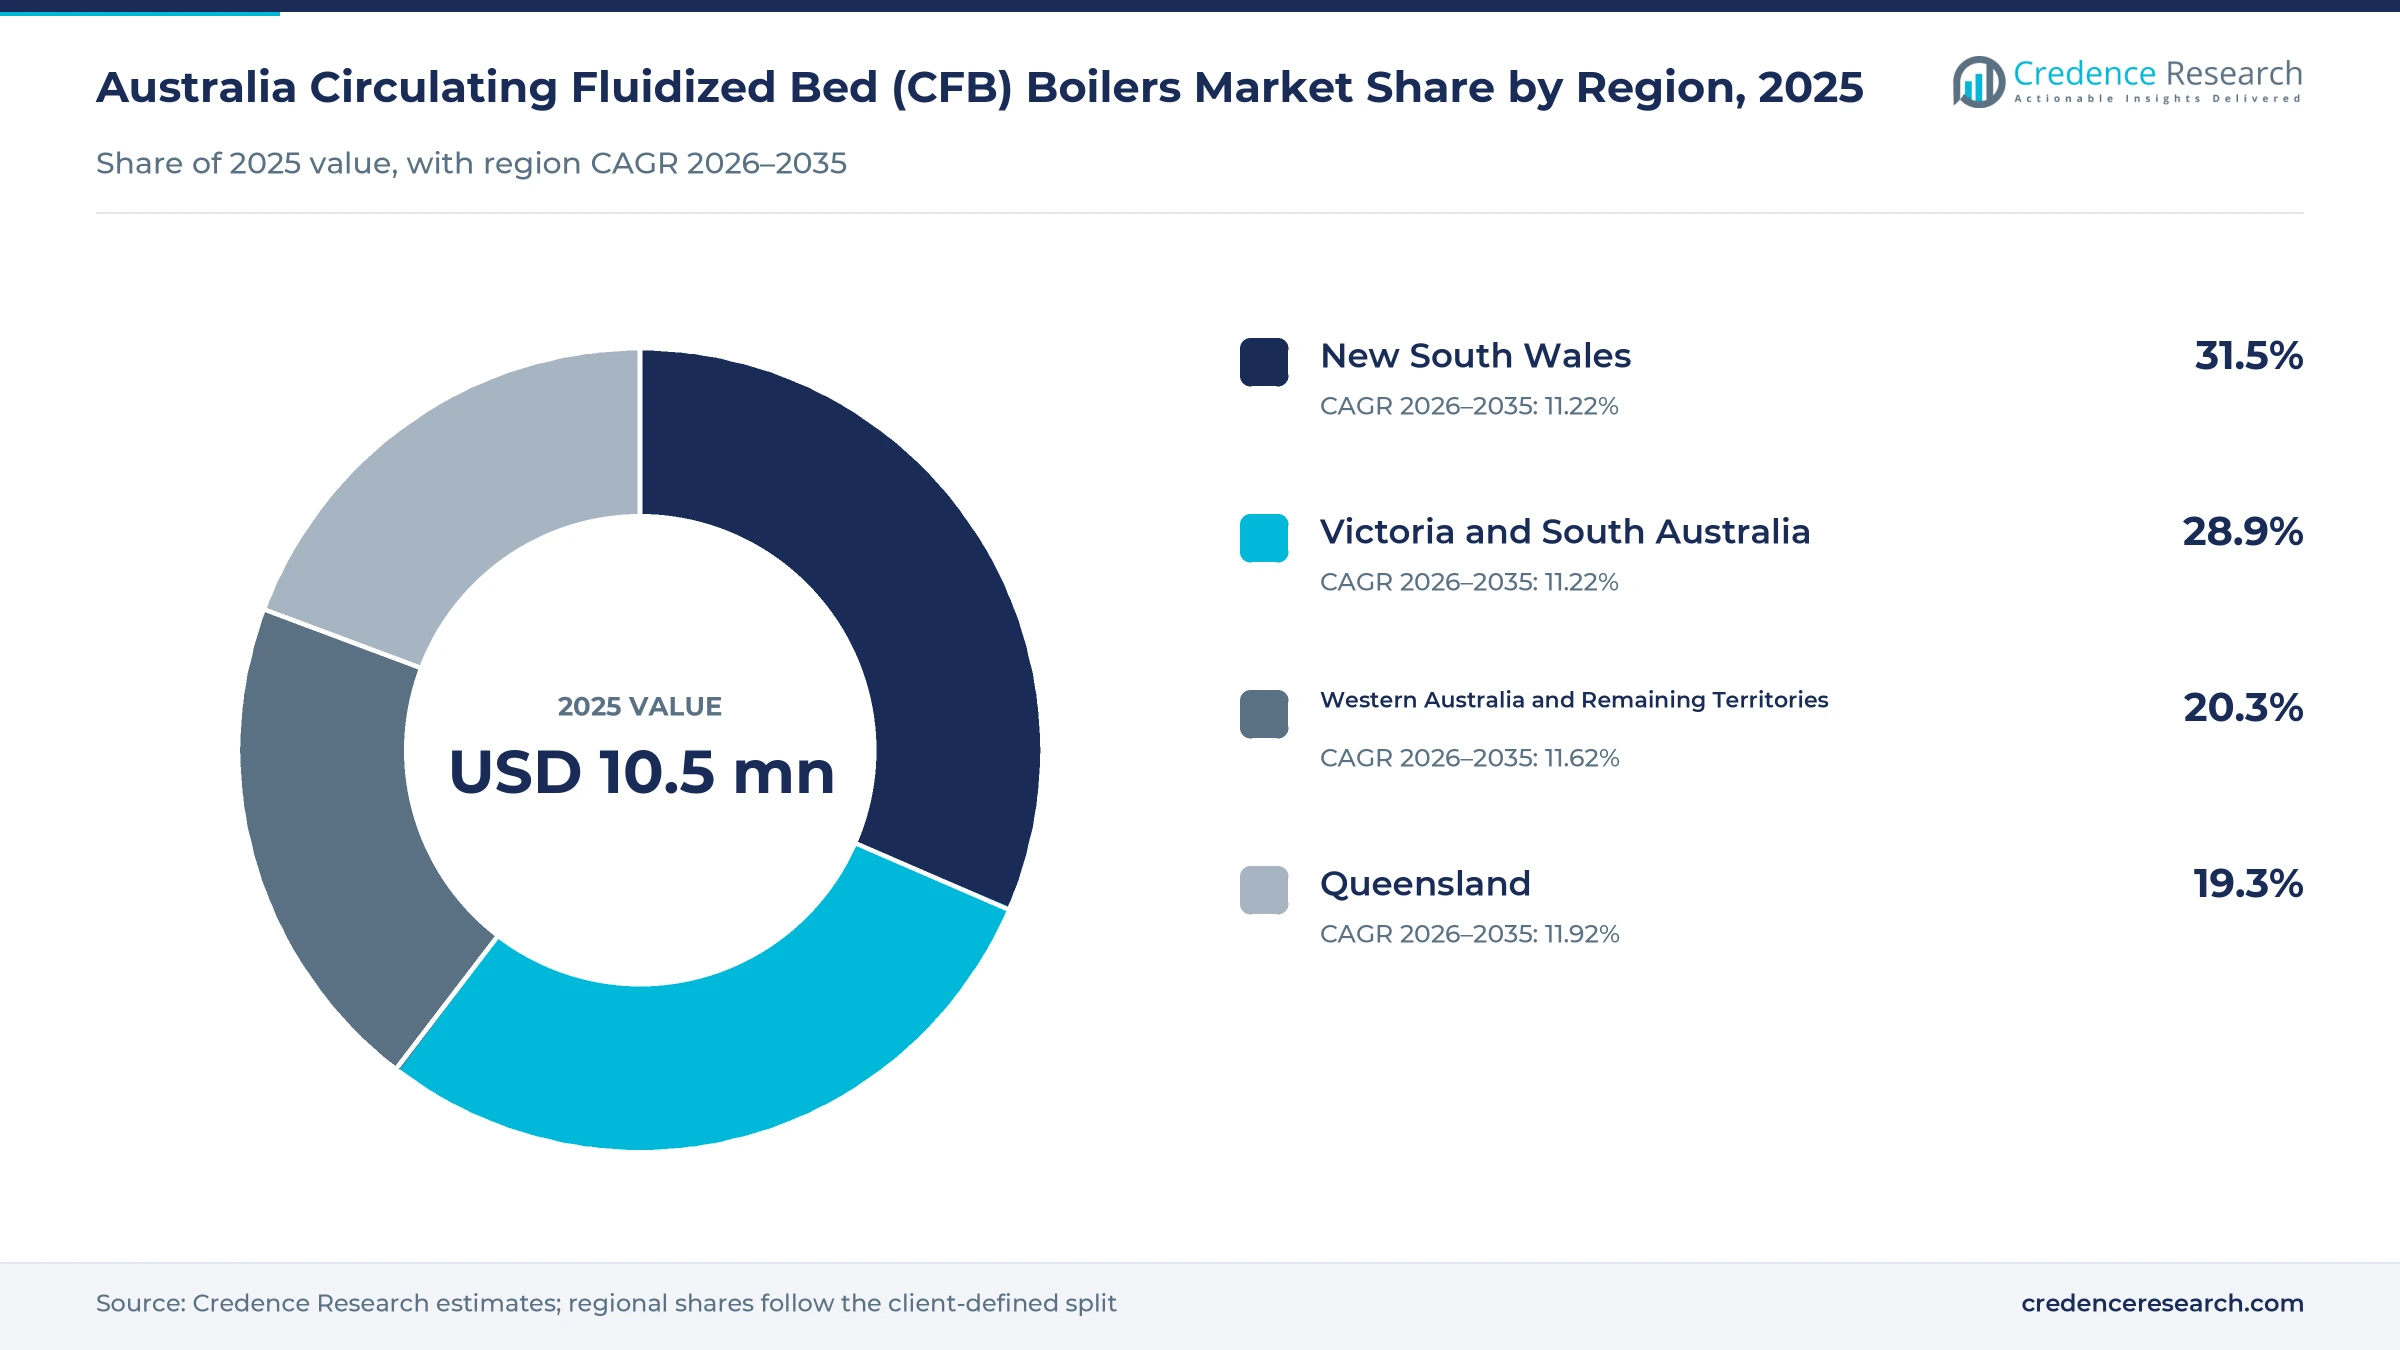
The Australia circulating fluidized bed (CFB) boilers market was valued at USD 10.5 million in 2025 and is projected to increase from USD 11.2 million in 2026 to USD 29.7 million by 2035, registering a CAGR of 11.44% during 2026–2035. Demand comes from sugar mills that burn cane fiber for steam and power, from wood and paper processors that use residues, and from manufacturers and energy recovery operators that want to replace gas with solid renewable fuels. New South Wales held the largest regional share, 31.5% in 2025, because it combines large manufacturing sites with forestry residues and the Hunter Valley energy base. Queensland is the fastest-growing region at 11.92% a year, as sugar mills modernize their cogeneration plants. In turn, Safeguard Mechanism baselines for large emitters decline by 4.9% each financial year to 2030, which pushes heavy industry to cut fossil fuel use.
Which solid fuel steam systems and services does the estimate cover?
The estimate measures the value of circulating fluidized bed boilers that burn bagasse, woody biomass, prepared waste fuels and mixed solid fuels to make process steam, combined heat and power, or electricity in Australia. It counts new equipment, engineering and installation work, and operation, maintenance and spare parts for installed units.
The estimate excludes grate-fired and stoker units, gas and electric steam generators, and turbines sold on their own. The value chain runs from global boiler makers in Europe, Japan and North America through local engineering contractors to sugar mills, wood processors, manufacturers and energy recovery sites in every mainland state.
Australia Circulating Fluidized Bed (CFB) Boilers Market Insights
- The Australia circulating fluidized bed (CFB) boilers market was valued at USD 10.5 million in 2025 and is projected to reach USD 29.7 million by 2035, registering a CAGR of 11.44% during 2026–2035.
- New South Wales held a 31.5% share of 2025 value, because the state combines large manufacturing sites with forestry residues.
- Woody biomass led with a 36.0% share of 2025 value, because sawmill and plantation residues are the most widely available solid fuel.
- Safeguard Mechanism baselines decline by 4.9% each financial year through June 30, 2030, which raises pressure on large emitters to switch fuels.
- Prepared waste fuels grow fastest at 12.60% a year during 2026–2035, as state waste-to-energy licensing opens new projects for energy recovery operators.
Woody biomass leads while prepared waste fuels grow fastest
Why does woody biomass lead fuel demand?
Based on energy source, the market is categorized into bagasse, woody biomass, prepared waste fuels and mixed solid fuels. Woody Biomass led with a 36.0% share of 2025 value, because sawmill, plantation and processing residues are available in most states. Prepared Waste Fuels grow fastest at 12.60% a year, as licensed waste-to-energy projects need units that handle variable and lower-quality fuels.
How do cogeneration and process steam split use?
Based on application, the market is categorized into industrial process steam, cogeneration and electricity-only generation. Cogeneration led with a 48.0% share of 2025 value, because sugar mills and paper plants need both steam and power from the same fuel. Industrial Process Steam grows fastest at 11.91% a year, as manufacturers replace gas-fired steam with renewable solid fuels.
Why do wood and paper processors buy the most capacity?
Based on end user, the market is categorized into sugar mills, wood and paper processors, food and materials manufacturers, and energy recovery operators. Wood and Paper Processors led with a 30.0% share of 2025 value, because they burn their own residues around the clock. Energy Recovery Operators grow fastest at 12.21% a year, as state licensing lets new plants process residual waste for energy.
How do equipment and service spending compare?
Based on value chain stage, the market is categorized into equipment, engineering and installation, and O&M and spare parts. Equipment led with a 52.0% share of 2025 value, because new units and major retrofits carry the largest contracts. O&M and Spare Parts grows fastest at 12.02% a year, as owners extend the life of installed units and add inspection and cleaning services.
| Segment Group | Leading Sub-segment | Share, 2025 | Fastest-growing Sub-segment | CAGR, 2026–2035 |
|---|---|---|---|---|
| By Energy Source | Woody Biomass | 36.0% | Prepared Waste Fuels | 12.60% |
| By Application | Cogeneration | 48.0% | Industrial Process Steam | 11.91% |
| By End User | Wood and Paper Processors | 30.0% | Energy Recovery Operators | 12.21% |
| By Value Chain Stage | Equipment | 52.0% | O&M and Spare Parts | 12.02% |
Request a Free Sample
Fill in your details and we'll send you a free sample report.
- Sample data tables & charts
- Research methodology
Sugar cogeneration and fuel switching lift demand
How does sugar cogeneration modernization lift demand?
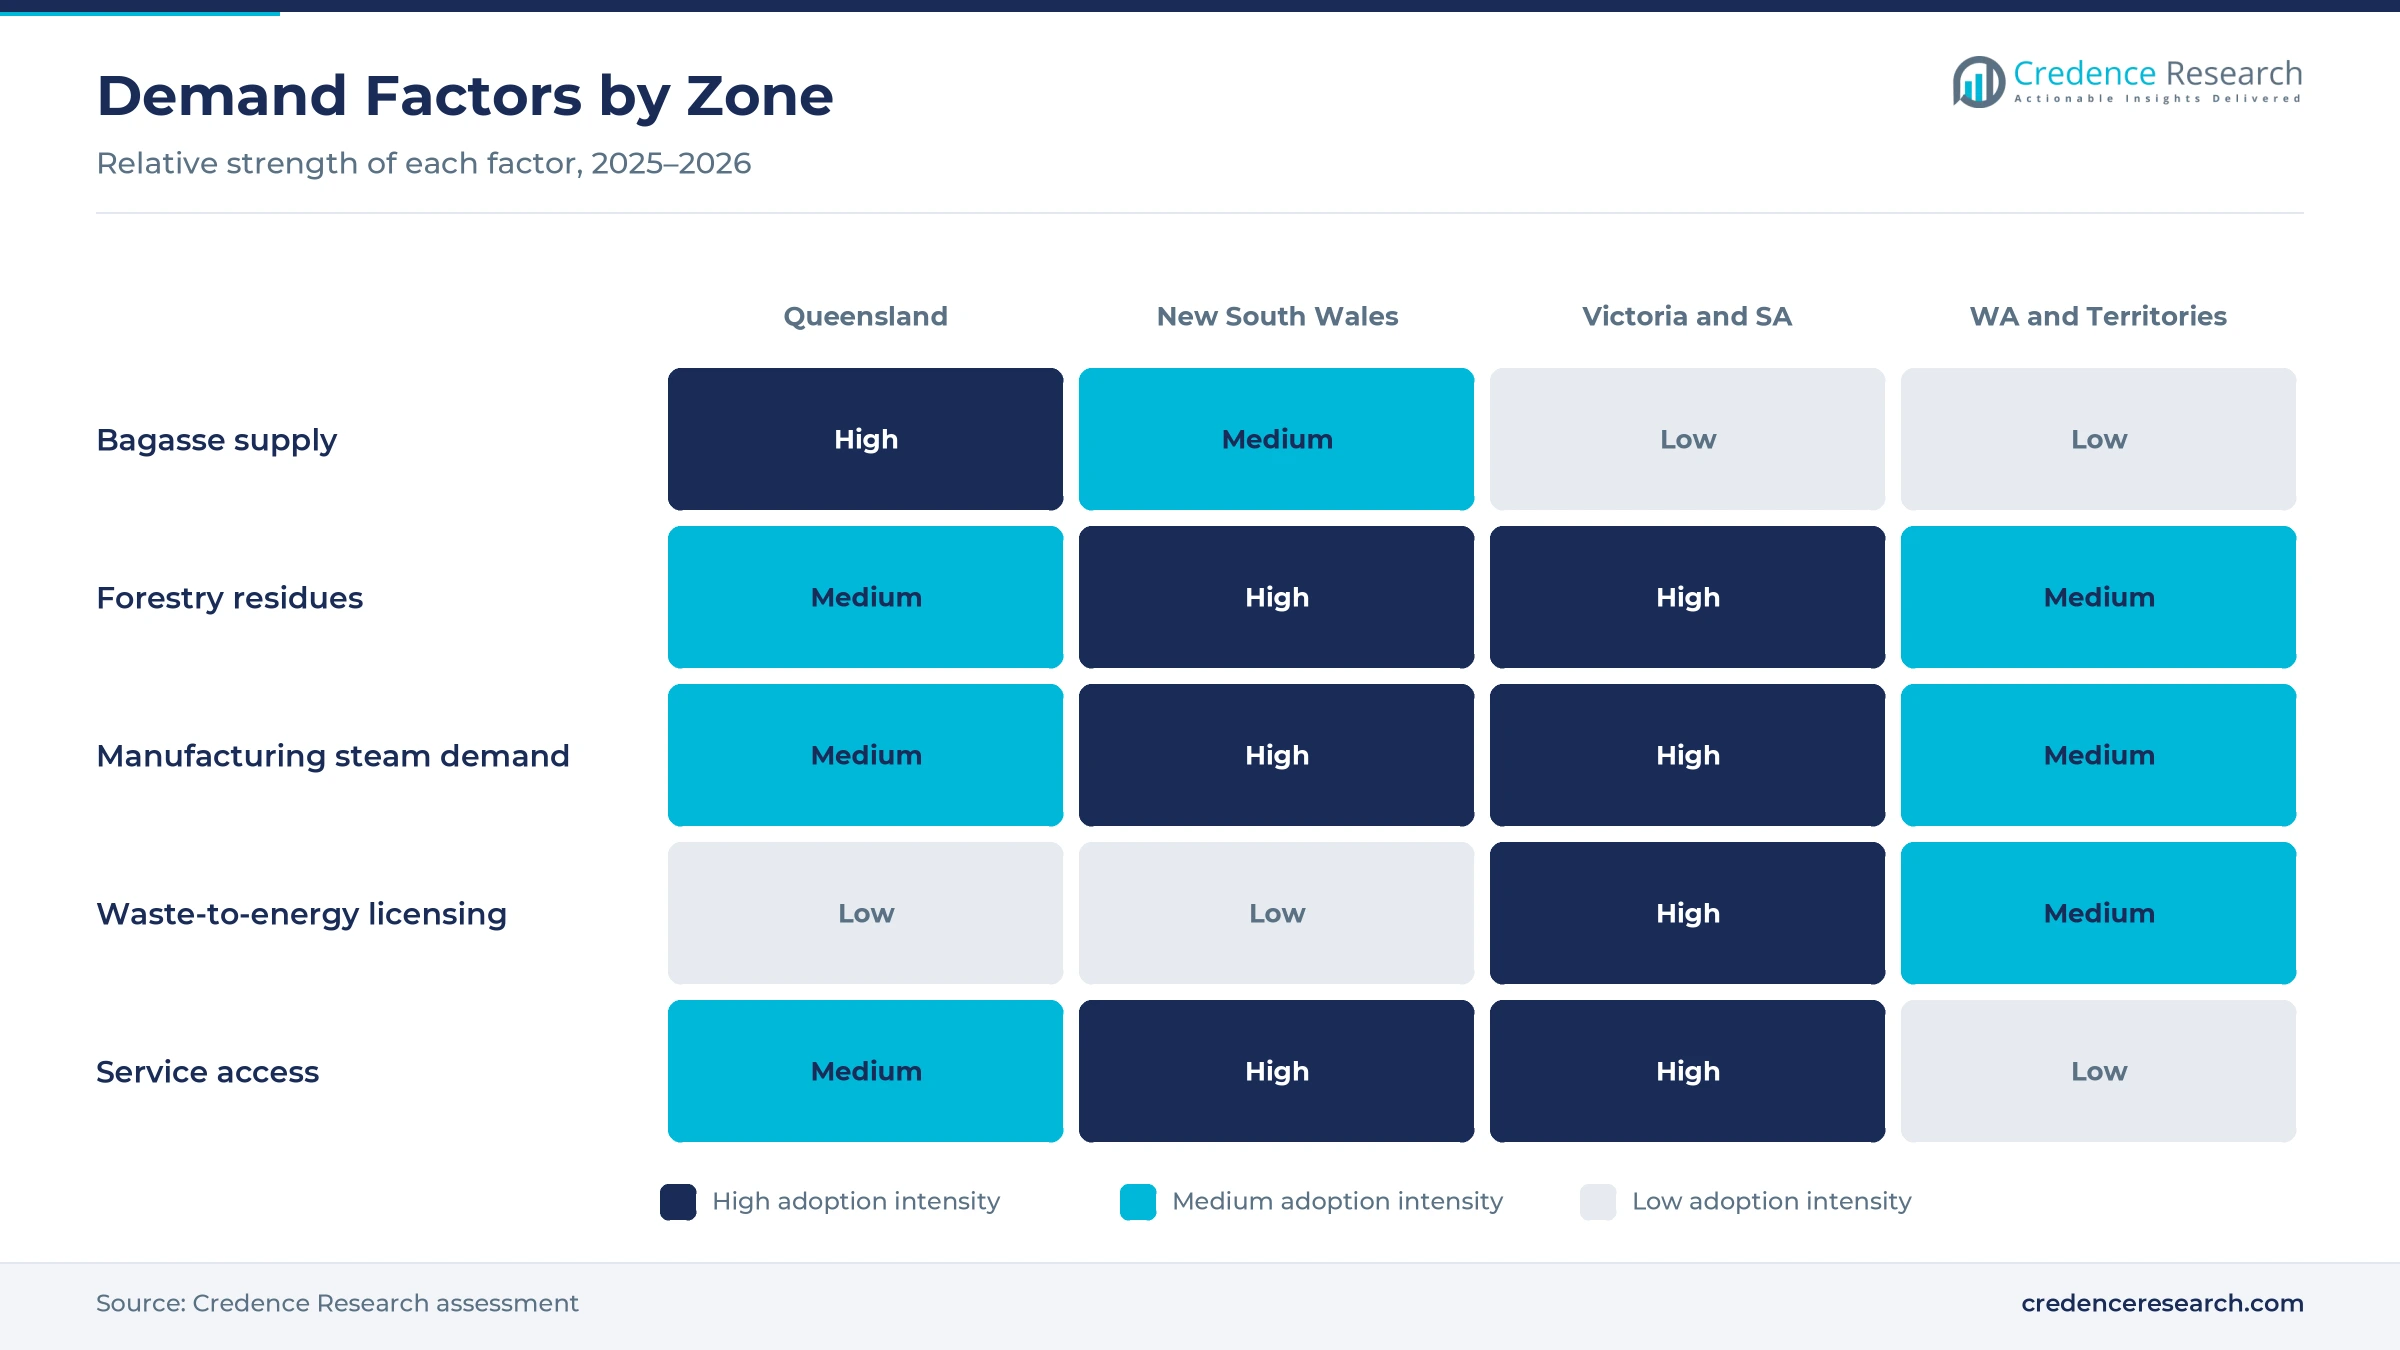
Sugar cogeneration modernization lifts demand, because mills need efficient boilers to turn cane fiber into steam and export power. Mackay Sugar produces more than two million metric tons of bagasse each year, which it burns to make high-pressure steam for its power houses and mill turbines. The same mills are fully energy self-sufficient and export renewable electricity to the national grid. Excess bagasse is also stockpiled during the June to December crush and burned at the Racecourse cogeneration plant in the off season. The Australian Research Council also awarded AUD 176,000 in April 2021 for combustion modeling and control of biomass-fueled sugar mill boilers. As a result, cogeneration holds 48.0% of 2025 value, as mill owners upgrade aging units.
Why does industrial biomass fuel switching raise orders?
Industrial biomass fuel switching raises orders, because manufacturers want to cut gas costs and emissions in their steam systems. The Australian Renewable Energy Agency committed over AUD 12 million in September 2025 to trial and demonstrate low-emission process heat technologies that reduce reliance on natural gas. The agency earlier provided AUD 2 million to MSM Milling to replace LPG-fired units with a woodchip-fired steam boiler. Renewables also reached 12.3% of final energy consumption in 2021, up from 9.8% in 2018, according to the World Bank. In turn, industrial process steam grows at 11.91% a year, the fastest application rate, as plants move to industrial biomass heating.
How does installed-fleet compliance spending support service work?
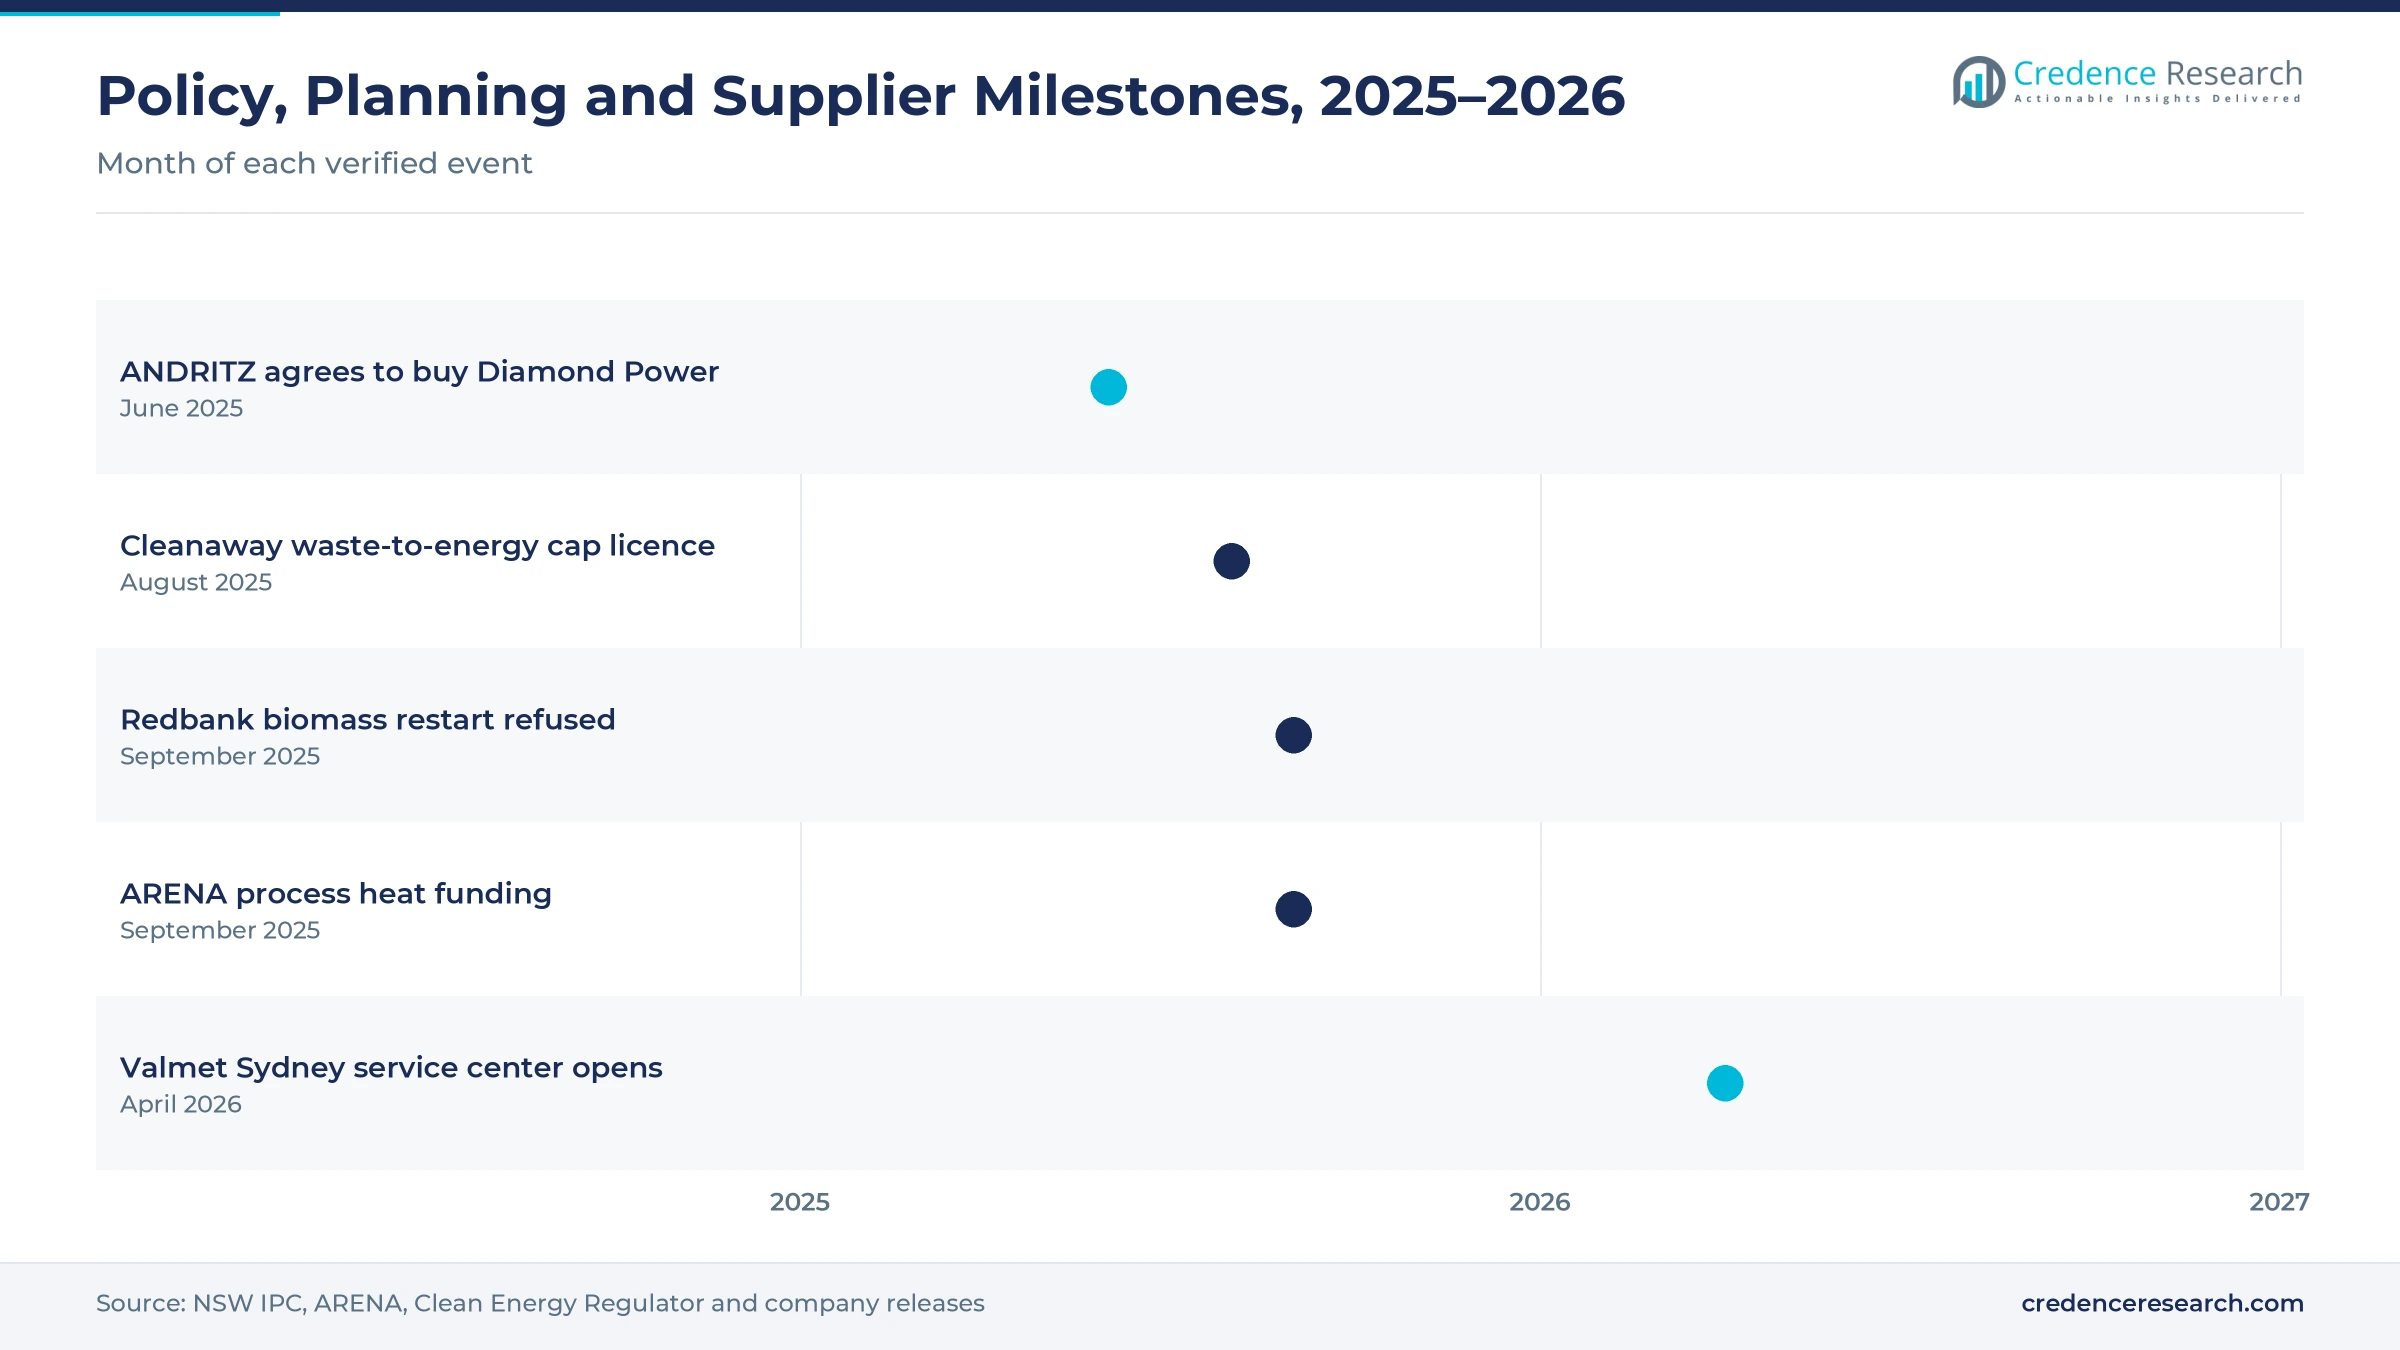
Installed-fleet compliance spending supports service work, because large emitters must cut emissions at existing sites before they can justify new plants. Safeguard Mechanism baselines decline by 4.9% each financial year through June 30, 2030, according to the Clean Energy Regulator. The scheme covered 208 facilities in 2024-25, with total covered emissions of 132.8 million metric tons of carbon dioxide equivalent. ANDRITZ also agreed in June 2025 to buy the Diamond Power boiler cleaning business from Babcock & Wilcox, which it said strengthens its recovery and power boiler service work. As a result, O&M and spare parts grow at 12.02% a year, the fastest stage rate in the value chain.
Why does waste-to-energy licensing open new fuel demand?
Waste-to-energy licensing opens new fuel demand, because state caps give operators a clear path to build thermal plants for residual waste. Victoria requires a cap licence or an existing operator licence for any thermal facility that processes permitted waste under the Circular Economy Act 2021. Cleanaway received a cap licence on Aug. 20, 2025, that allows 760,000 metric tons of non-recyclable waste a year at its Melbourne energy and resource recovery center. Victoria and South Australia also held 28.9% of 2025 value. In turn, energy recovery operators grow at 12.21% a year, the fastest end-user rate, as waste-to-energy projects need units that handle variable fuel.
Emission limits and waste caps reshape buying
How is the shift to declining emission limits changing plans?
The shift to declining emission limits is changing plant plans, because large emitters now face firm yearly reductions instead of fixed caps. Facilities that began commercial production on or after July 1, 2023, are treated as new and receive tighter baselines from the start. The sectoral baseline is set at 198 million metric tons of carbon dioxide equivalent a year, which caps total covered emissions across heavy industry. The scheme also issued credit units to 54 facilities in 2024-25 that stayed below their baselines. As a result, owners favor solid renewable fuels and efficient combustion that can earn credits, which raises interest in units that burn residues, wood pellets and prepared fuels.
Why is the rise of fuel sourcing scrutiny notable?
The rise of fuel sourcing scrutiny is notable, because planning authorities now test where biomass comes from before they approve large plants. The NSW Independent Planning Commission refused the restart of the 151 MW Redbank Power Station on Sept. 15, 2025. The project sought to burn up to 700,000 dry metric tons of biomass a year, first from invasive native species and later from plantation crops. The commission found that the fuel strategy could create a new incentive for land clearing that had not been assessed. In turn, developers now prepare detailed fuel supply plans, residue contracts and lifecycle studies before they seek approval for new solid fuel plants.
Can repurposing idle thermal sites open a new project pipeline?
Repurposing idle thermal sites can open a new project pipeline, because existing grid links, water and buildings cut the cost of new renewable generation. Redbank closed in 2014 after 13 years of burning coal tailings, and its owner plans to restart it on biomass with fluidized bed combustion. Verdant Earth Technologies states that the restarted plant would produce about 1 million MWh a year of dispatchable power. The planning commission also acknowledged benefits such as reuse of existing infrastructure, energy security and local jobs. As a result, suppliers that can retrofit older units for biomass power and secure sustainable fuel can win work at former coal and waste sites.
Is there room to grow long-term service partnerships?
Long-term service partnerships have room to grow, because most installed units need regular inspection, refractory repair and cleaning to stay reliable. Valmet opened a new service center and manufacturing unit in Sydney on April 8, 2026, with a focus on pulp, paper and renewable energy customers. Its Melbourne service center already serves customers in Australia and New Zealand with remote and on-site technical expertise. Mitsubishi Power has installed over 50 gas turbines, steam turbines and boilers in Australia, totaling close to 5,400 MW. In turn, owners can shift risk to suppliers through multiyear contracts, while energy-as-a-service models let smaller plants avoid large upfront spending.
Fuel supply and planning risk test suppliers
How does fuel supply risk slow new projects?
Fuel supply risk slows new projects, because lenders and planners want proof of long-term residue volumes. Bagasse is only available during the crush season, and forestry residues depend on harvest levels. As a result, owners must stockpile fuel or blend several fuels to keep units running. Suppliers respond with fuel-flexible designs that handle moisture swings and mixed feedstocks without long outages or costly fuel trucking from distant regions.
Why does planning risk raise the cost of approvals?
Planning risk raises the cost of approvals, because large biomass and waste projects face detailed environmental review and public objections. The Redbank refusal showed that fuel strategy alone can stop a project. In turn, developers spend more on studies and community engagement before they order equipment. Many respond by starting with residues that have clear sources and by sizing plants to local fuel supply that can be proven over the life of the project.
How do small project sizes limit supplier returns?
Small project sizes limit supplier returns, because many Australian sites need units well below the size that suits large global boiler makers. Engineering, shipping and commissioning costs do not fall in line with smaller capacity. As a result, some owners choose grate-fired or packaged units instead. Suppliers respond with modular designs, local partners and service contracts that spread fixed engineering and commissioning costs across several sites.
Why does skilled labor shortage affect operation and upkeep?
Skilled labor shortages affect operation and upkeep, because circulating fluidized bed boilers need trained operators, welders and inspection staff. Remote mill and forestry towns often struggle to attract these workers. In turn, outages can last longer and maintenance costs rise for owners. Suppliers respond with remote monitoring, robotic inspection and regional service centers that bring specialists closer to sugar, timber and manufacturing sites.
New South Wales leads as Queensland grows fastest
| Region | Value, 2025 (USD million) | Share, 2025 | CAGR, 2026–2035 |
|---|---|---|---|
| New South Wales | 3.3 | 31.5% | 11.22% |
| Victoria and South Australia | 3.0 | 28.9% | 11.22% |
| Western Australia and Remaining Territories | 2.1 | 20.3% | 11.62% |
| Queensland | 2.0 | 19.3% | 11.92% |
Why does new South Wales hold the top share?
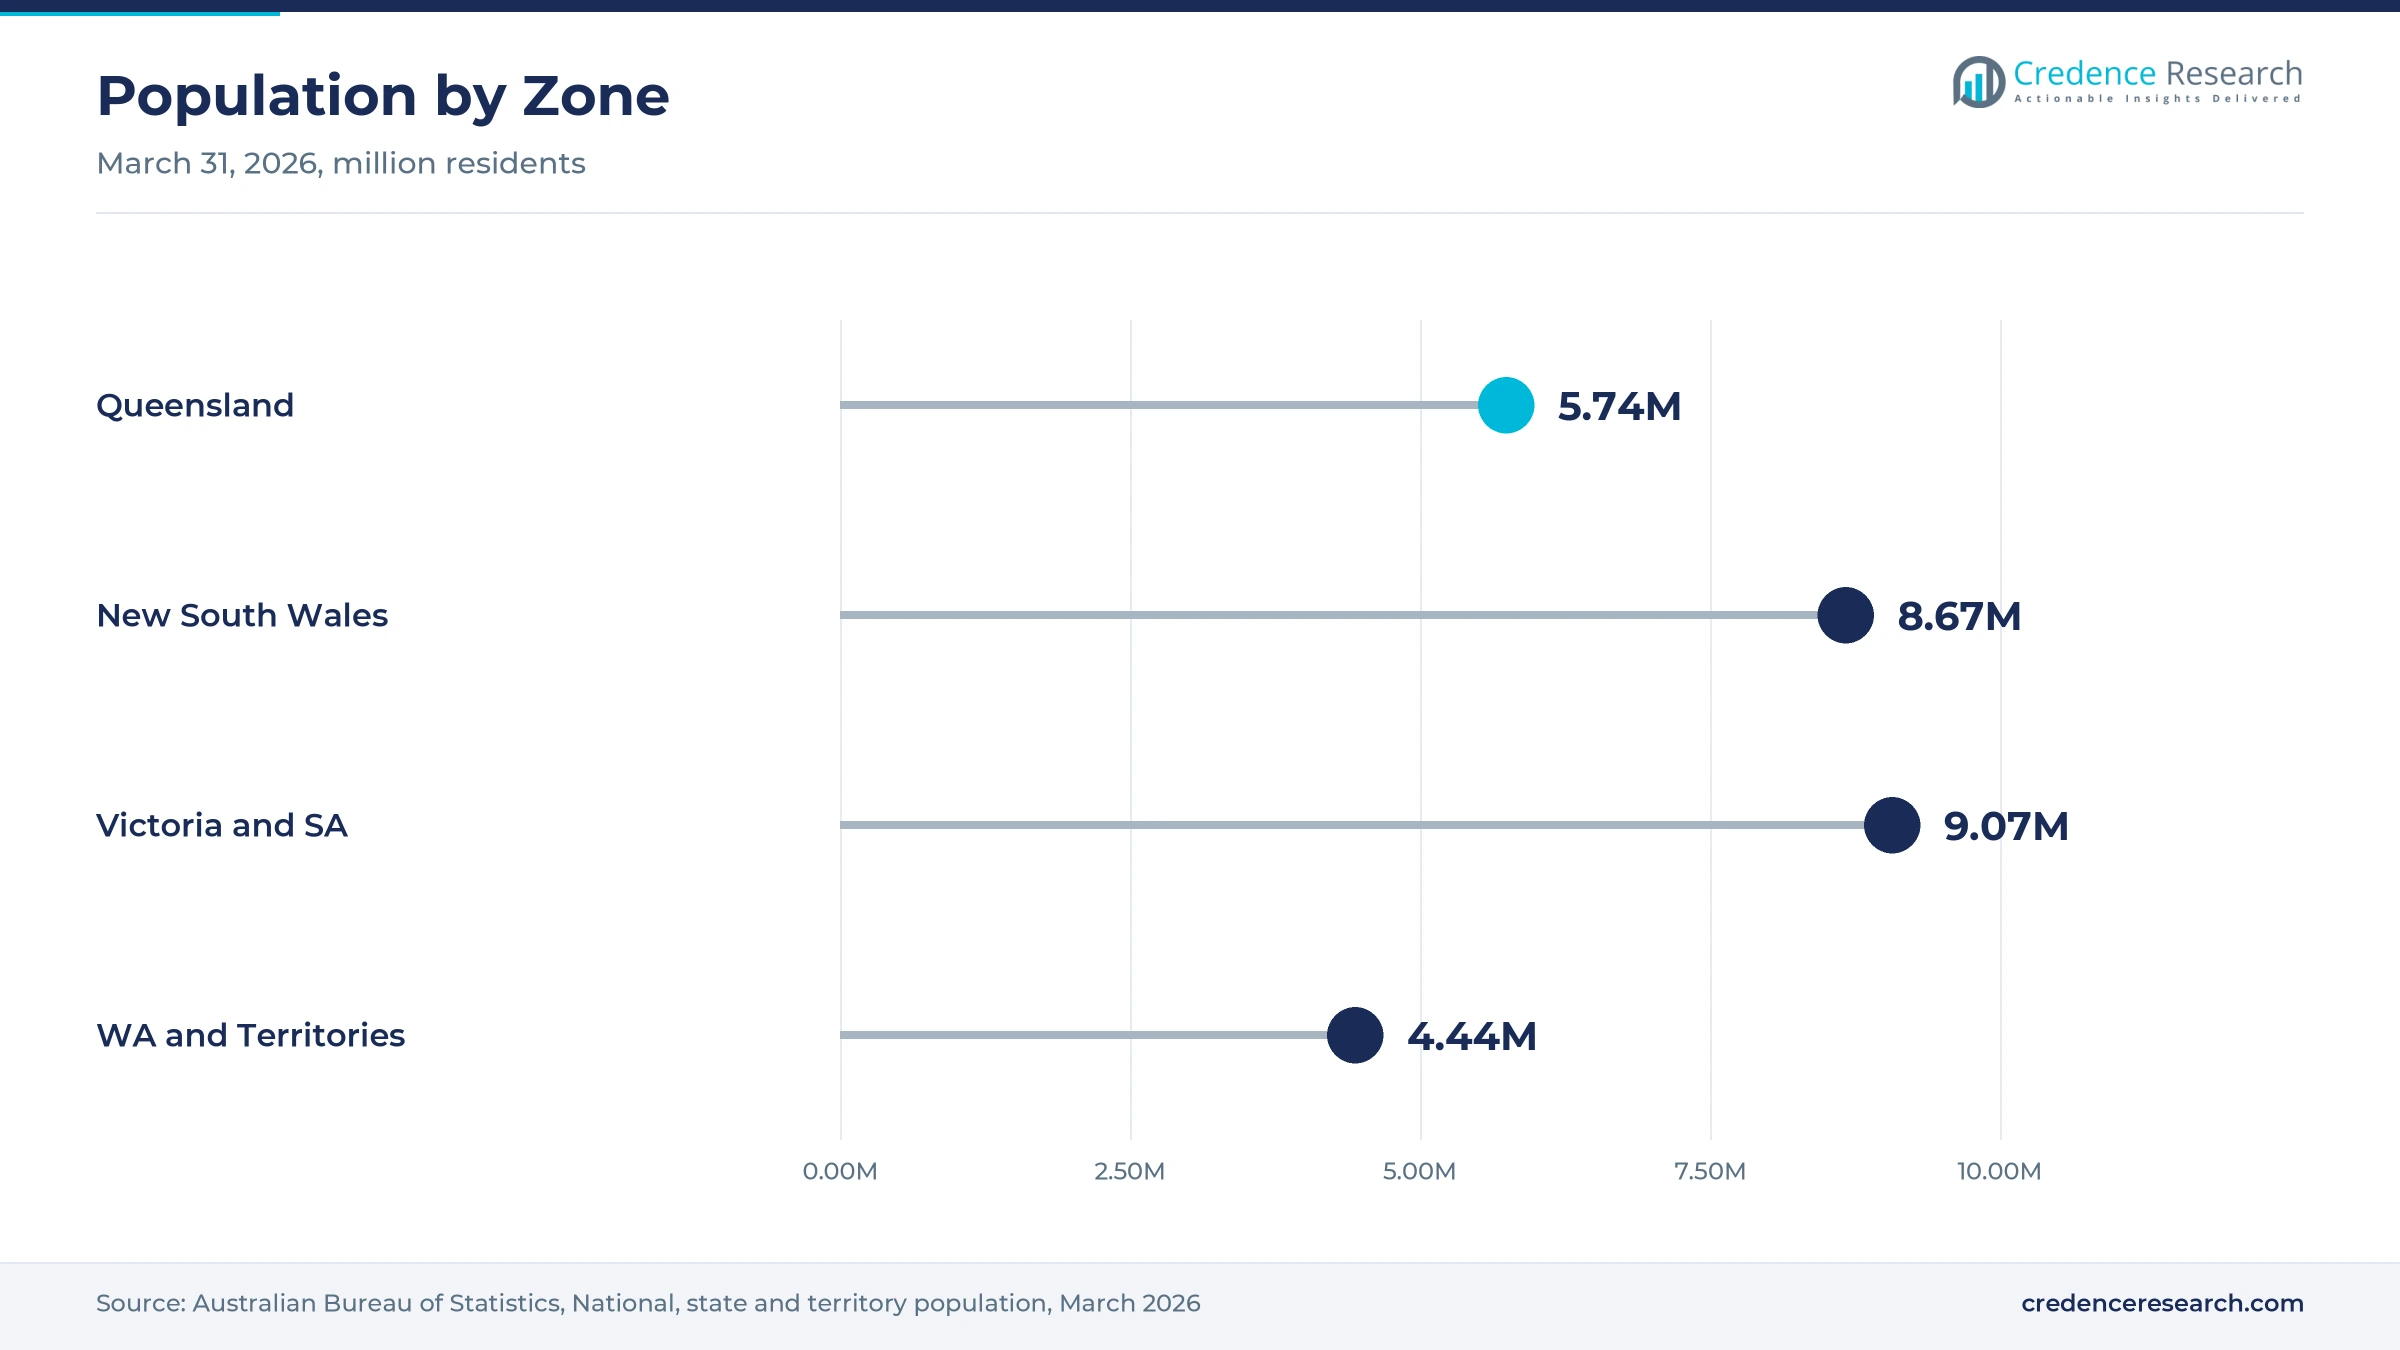
New South Wales held a 31.5% share of 2025 value and grows at 11.22% a year, because the state combines large manufacturing sites, forestry residues and northern sugar mills. It is also the most populous state, with 8.67 million residents at March 31, 2026. The Hunter Valley hosts the Redbank site, the country's best-known fluidized bed power station. As a result, the state leads demand for retrofits, service work and new biomass steam projects.
How do Victoria and South Australia support demand?
Victoria and South Australia held a 28.9% share of 2025 value and grow at 11.22% a year, because both states have food, paper and materials plants that need steam. The two states had a combined population of about 9.07 million at March 31, 2026. Victoria's waste-to-energy cap licences also give energy recovery operators a clear path to build plants. In turn, the zone leads demand for units that burn prepared waste fuels.
Why is Queensland growing fastest?
Queensland held a 19.3% share of 2025 value and grows fastest at 11.92% a year, because most of the country's sugar mills sit along its coast. Mackay Sugar alone produces more than two million metric tons of bagasse each year for its boilers and cogeneration plant. The state also had 5.74 million residents at March 31, 2026, and growing industrial demand in its south-east. As a result, mill upgrades and new process steam projects lift spending through 2035.
What shapes demand in Western Australia and the territories?
Western Australia and the remaining territories held a 20.3% share of 2025 value and grow at 11.62% a year, because Western Australia has plantation residues and mineral processing sites. Western Australia also recorded the fastest population growth at 2.1% in the year to March 31, 2026. As a result, the zone adds steady demand for process steam and service work.
Planning rulings and supplier moves, 2025–2026
| Development | Status and market relevance |
|---|---|
| In June 2025, ANDRITZ agreed to acquire the Diamond Power boiler cleaning business from Babcock & Wilcox. | Strengthens recovery and power boiler service capability |
| In August 2025, Recycling Victoria allocated Cleanaway a waste-to-energy cap licence of 760,000 metric tons a year. | Opens a large prepared waste fuel project in Melbourne |
| In September 2025, the NSW Independent Planning Commission refused the biomass restart of the 151 MW Redbank Power Station. | Raises the bar for fuel sourcing evidence |
| In September 2025, the Australian Renewable Energy Agency committed over AUD 12 million to low-emission process heat projects. | Supports manufacturers moving away from natural gas |
| In April 2026, Valmet opened a new service center and manufacturing unit in Sydney. | Brings lifecycle support closer to pulp, paper and energy customers |
Fuel flexibility and low emissions shape combustion design
- Circulating bed combustion keeps fuel and sand moving through a hot loop at moderate temperatures, which lets one unit burn wet bagasse, wood residues and waste fuels with low nitrogen oxide output.
- In-furnace sulfur capture adds limestone to the bed so sulfur is removed during combustion, which reduces the need for separate flue gas treatment.
- Robotic inspection and online cleaning use crawling sensors and sootblowers to find wall loss and remove deposits, which shortens outages and extends unit life.
Need a Custom Version of This Report?
Tailor the scope, geography, or segments to your exact requirements.
- Custom geography or segment scope
- Direct access to our analyst team
Global boiler makers and service networks compete
Competition is led by global boiler makers that combine equipment supply with long-term service. Mitsubishi Power has supplied equipment in Australia since 1969 and has installed over 50 gas turbines, steam turbines and boilers. Valmet runs service centers in Melbourne and Sydney that support pulp, paper and renewable energy customers. ANDRITZ agreed in June 2025 to acquire the Diamond Power boiler cleaning business from Babcock & Wilcox Enterprises, which adds cleaning systems to its boiler service range. Sumitomo SHI FW offers inspection, damage analysis and maintenance services for fluidized bed owners worldwide through a partnership with Gecko Robotics. Rivals compete on fuel flexibility, emissions, availability, local service and lifecycle cost. Because many Australian projects are retrofits or small new builds, suppliers with local partners and strong service teams win more contracts.
Which companies supply solid fuel steam systems in Australia?
| Company | Type | Role in the market |
|---|---|---|
| Mitsubishi Power Ltd | Global power equipment maker | Over 50 turbines and boilers installed in Australia since 1969 |
| Valmet Oyj | Global process and energy supplier | Service centers in Melbourne and Sydney for pulp, paper and energy customers |
Credence Research view on solid fuel steam demand
Credence Research's view is that Australian demand for circulating fluidized bed boilers will grow quickly from a small base because emission limits, gas costs and waste policy all favor solid renewable fuels. Woody biomass remains the largest fuel, while prepared waste fuels add the fastest growth as licensed plants move ahead. Sugar mills will keep upgrading their cogeneration units as older plants reach the end of service life. Suppliers that pair fuel-flexible designs with local service and clear fuel sourcing evidence should gain share fastest, while planning risk will delay some large projects.
How the national solid fuel steam estimate was built
The report uses 2025 as the base year on a calendar basis, and market values come from the Credence Research model. That model combines emission scheme data, energy statistics, population data, planning decisions, waste licensing records, renewable energy funding announcements and company releases. Segment splits and zone growth rates are Credence Research estimates, while zone shares follow the client-defined split. Sources used are official statistics, regulator and agency releases, planning decisions and company releases, and no interviews or surveys were used.
Waste fuels and service contracts carry growth to 2035
Equipment and service value is expected to reach USD 29.7 million by 2035, an 11.44% CAGR during 2026–2035, as manufacturers, mills and energy recovery operators replace fossil steam with renewable solid fuels. Growth should be strongest through 2030, while Safeguard baselines keep falling each year. After that, service contracts and retrofits will carry more of the value. Faster waste licensing would lift demand, while tougher fuel sourcing rules would slow large projects. Suppliers with local service are expected to gain the most.
Frequently Asked Questions
How big is the Australia circulating fluidized bed (CFB) boilers market?
Which fuel leads Australian demand?
Which region leads the Australian market?
How does the Safeguard Mechanism affect boiler demand?
What happened to the Redbank biomass restart?
Which application is growing fastest?
Who are the leading companies in the Australian market?
What are the main challenges for suppliers?
Table of Content
Chapter 1 Market Segmentation
- 1.1 Segmentation Framework
- 1.1.1 Product and Service Classification
- 1.1.2 Application and End-Use Classification
- 1.1.3 Technology and Solution Classification
- 1.1.4 Customer and Distribution Channel Classification
- 1.1.5 Geographic Segmentation
- 1.1.6 Market Segment Definitions and Boundaries
- 1.2 By Energy Source
- 1.2.1 Woody Biomass
- 1.2.2 Bagasse
- 1.2.3 Prepared Waste Fuels
- 1.2.4 Mixed Solid Fuels
- 1.3 By Application
- 1.3.1 Cogeneration
- 1.3.2 Industrial Process Steam
- 1.3.3 Electricity-Only Generation
- 1.4 By End User
- 1.4.1 Wood and Paper Processors
- 1.4.2 Sugar Mills
- 1.4.3 Food and Materials Manufacturers
- 1.4.4 Energy Recovery Operators
- 1.5 By Value Chain Stage
- 1.5.1 Equipment
- 1.5.2 Engineering and Installation
- 1.5.3 O&M and Spare Parts
Chapter 2 Introduction
- 2.1 Report Objectives and Scope
- 2.2 Product Definition and Industry Terminology
- 2.3 Market Inclusions and Exclusions
- 2.4 Research Process
- 2.4.1 Primary Research and Expert Interviews
- 2.4.2 Secondary Research and Source Review
- 2.4.3 Top-Down and Bottom-Up Estimation
- 2.4.4 Data Triangulation and Verification
- 2.5 Market Size Measurement Basis
- 2.5.1 2025: USD 10.5 million → 2035: USD 29.7 million
- 2.6 Historical and Forecast Reference Periods
- 2.6.1 Historical Period: 2018-2025
- 2.6.2 Base Year: 2025
- 2.6.3 Forecast Period: 2025-2035
- 2.7 Research Assumptions and Limitations
Chapter 3 Executive Summary
- 3.1 Market Snapshot and Key Findings
- 3.2 Base-Year Market Size, 2025
- 3.3 Forecast Market Size, 2035
- 3.4 Revenue and Volume Growth Outlook
- 3.5 Key Demand and Supply Indicators
- 3.6 Leading Market Segments
- 3.7 Fastest-Growing Market Opportunities
- 3.8 Regional Performance Highlights
- 3.9 Technology and Industry Transformation
- 3.10 Competitive Landscape Summary
- 3.11 Analyst View and Strategic Implications
Chapter 4 Australia Circulating Fluidized Bed (CFB) Boilers Market Trends and Developments
- 4.1 Historical Industry Development, 2018-2025
- 4.2 Recent Market Trends and Developments
- 4.3 Demand and Customer Behavior Trends
- 4.4 Technology and Product Innovation
- 4.5 Artificial Intelligence, Automation and Digitalization
- 4.6 Local Manufacturing and Supply Chain Realignment
- 4.7 Industry Partnerships, Mergers and Acquisitions
- 4.8 Sustainability and Circular Economy Developments
- 4.9 Government and Private Sector Investment Trends
- 4.10 Emerging Business Models and Commercialization
- 4.11 Industry Developments and Announcements
Chapter 5 Australia Circulating Fluidized Bed (CFB) Boilers Market Production, Supply and Demand Analysis
- 5.1 Demand Trend and Consumption Analysis, 2018-2025
- 5.2 Demand Forecast, 2025-2035
- 5.3 Production and Output Trend, 2018-2025
- 5.4 Production and Output Forecast, 2025-2035
- 5.5 Installed Capacity and Capacity Utilization
- 5.6 Company-Wise Production Plants and Statistics
- 5.6.1 Installed Production Capacity
- 5.6.2 Actual Production
- 5.6.3 Planned Capacity and Expansion Targets
- 5.7 Supply Chain Structure and Procurement Trends
- 5.8 Supply-Demand Gap and Bottlenecks
- 5.9 Import Dependence and Sourcing Structure
- 5.10 Contract Manufacturing and Outsourcing
- 5.11 Regional Supply and Demand Concentration
Chapter 6 Australia Circulating Fluidized Bed (CFB) Boilers Market Pricing Analysis
- 6.1 Pricing Structure and Measurement
- 6.2 Historical Pricing Trends, 2018-2025
- 6.3 Pricing Outlook, 2025-2035
- 6.4 Average Selling Price and Unit Economics
- 6.5 Pricing by Product and Market Segment
- 6.6 Geographic Pricing Differences
- 6.7 Key Input, Energy, Labor and Logistics Costs
- 6.8 Contract Pricing and Purchasing Models
- 6.9 Pricing Sensitivity and Competitive Positioning
- 6.10 Price, Margin and Profitability Implications
Chapter 7 Australia Circulating Fluidized Bed (CFB) Boilers Market Dynamics
- 7.1 Market Growth Drivers
- 7.1.1 Demand-Side Drivers
- 7.1.2 Technology and Innovation Drivers
- 7.1.3 Infrastructure and Investment Drivers
- 7.1.4 Regulatory and Policy Drivers
- 7.2 Market Restraints
- 7.2.1 Cost and Affordability Constraints
- 7.2.2 Technology and Adoption Barriers
- 7.2.3 Supply Chain and Operational Constraints
- 7.3 Market Challenges
- 7.3.1 Competitive Pressure and Margin Erosion
- 7.3.2 Skills, Infrastructure and Implementation Gaps
- 7.4 Emerging Market Opportunities
- 7.5 Market Dynamics Impact and Time-Horizon Assessment
Chapter 8 Australia Circulating Fluidized Bed (CFB) Boilers Value Chain Analysis
- 8.1 Industry Value Chain Overview
- 8.2 Upstream Suppliers and Critical Inputs
- 8.3 Technology and Component Providers
- 8.4 Manufacturing or Service Delivery
- 8.5 Distribution, Channel Partners and Integrators
- 8.6 Downstream Applications and End Users
- 8.7 Value Addition and Profit Pools
- 8.8 Vertical Integration and Outsourcing
- 8.9 Supplier Concentration and Risk
- 8.10 Supply Chain Localization and Resilience
Chapter 9 Australia Circulating Fluidized Bed (CFB) Boilers Market Regulations and Policies
- 9.1 Relevant Laws, Standards and Compliance Frameworks
- 9.2 Product, Service, Safety and Quality Requirements
- 9.3 Government Policies, Incentives and Subsidies
- 9.4 Imports, Exports and Trade Barriers
- 9.5 Public Procurement and Local Content Requirements
- 9.6 Environmental and Sustainability Compliance
- 9.7 Upcoming Policy Changes and Market Implications
Chapter 10 Australia Circulating Fluidized Bed (CFB) Boilers Market Hotspots and Opportunities
- 10.1 Market Opportunity Mapping and Growth Hotspots
- 10.2 High-Growth Applications and Customer Groups
- 10.3 Underserved Markets and White-Space Opportunities
- 10.4 Emerging Technology and Product Opportunities
- 10.5 New Capacity and Investment Hotspots
- 10.6 Market Entry and Expansion Opportunities
- 10.7 Distribution and Partnership Opportunities
- 10.8 Near-Term and Long-Term Commercial Potential
- 10.9 Opportunity Attractiveness and Execution Risks
Chapter 11 Australia Circulating Fluidized Bed (CFB) Boilers Market Outlook, 2025-2035
- 11.1 Market Size and Analysis
- 11.1.1 Revenue (Market Measurement: 2025: USD 10.5 million → 2035: USD 29.7 million)
- 11.1.2 Market Volume and Quantity Sold
- 11.1.3 Historical Market Size, 2018-2025
- 11.1.4 Base-Year Market Size, 2025
- 11.2 Market Forecast, 2025-2035
- 11.2.1 Revenue Forecast to 2035
- 11.2.2 Volume Forecast to 2035
- 11.2.3 CAGR and Year-on-Year Growth
- 11.2.4 Incremental Revenue Opportunity
- 11.3 Forecast Assumptions and Scenario Analysis
- 11.3.1 Base-Case Forecast
- 11.3.2 Optimistic and Conservative Scenarios
- 11.3.3 Technology, Pricing and Policy Sensitivities
- 11.4 Market Attractiveness and Growth Outlook
Chapter 12 Australia Circulating Fluidized Bed (CFB) Boilers Market Segmentation and Outlook
- 12.1 Segmentation Summary and Market Shares, 2025
- 12.2 Largest and Fastest-Growing Segments
- 12.3 By Energy Source - Market Size and Forecast, 2025-2035
- 12.3.1 Segment Definition and Scope
- 12.3.2 Historical Market Size, 2018-2025
- 12.3.3 Revenue Forecast, 2025-2035
- 12.3.4 Volume Forecast, 2025-2035
- 12.3.5 Base-Year Market Share, 2025
- 12.3.6 Segment CAGR and Growth Drivers
- 12.3.7 Subsegment Market Size and Forecast
- 12.3.7.1 Woody Biomass
- 12.3.7.2 Bagasse
- 12.3.7.3 Prepared Waste Fuels
- 12.3.7.4 Mixed Solid Fuels
- 12.3.8 Subsegment Pricing and Adoption Trends
- 12.3.9 Leading Suppliers and Competition
- 12.3.10 Regional Demand and Opportunities
- 12.4 By Application - Market Size and Forecast, 2025-2035
- 12.4.1 Segment Definition and Scope
- 12.4.2 Historical Market Size, 2018-2025
- 12.4.3 Revenue Forecast, 2025-2035
- 12.4.4 Volume Forecast, 2025-2035
- 12.4.5 Base-Year Market Share, 2025
- 12.4.6 Segment CAGR and Growth Drivers
- 12.4.7 Subsegment Market Size and Forecast
- 12.4.7.1 Cogeneration
- 12.4.7.2 Industrial Process Steam
- 12.4.7.3 Electricity-Only Generation
- 12.4.8 Subsegment Pricing and Adoption Trends
- 12.4.9 Leading Suppliers and Competition
- 12.4.10 Regional Demand and Opportunities
- 12.5 By End User - Market Size and Forecast, 2025-2035
- 12.5.1 Segment Definition and Scope
- 12.5.2 Historical Market Size, 2018-2025
- 12.5.3 Revenue Forecast, 2025-2035
- 12.5.4 Volume Forecast, 2025-2035
- 12.5.5 Base-Year Market Share, 2025
- 12.5.6 Segment CAGR and Growth Drivers
- 12.5.7 Subsegment Market Size and Forecast
- 12.5.7.1 Wood and Paper Processors
- 12.5.7.2 Sugar Mills
- 12.5.7.3 Food and Materials Manufacturers
- 12.5.7.4 Energy Recovery Operators
- 12.5.8 Subsegment Pricing and Adoption Trends
- 12.5.9 Leading Suppliers and Competition
- 12.5.10 Regional Demand and Opportunities
- 12.6 By Value Chain Stage - Market Size and Forecast, 2025-2035
- 12.6.1 Segment Definition and Scope
- 12.6.2 Historical Market Size, 2018-2025
- 12.6.3 Revenue Forecast, 2025-2035
- 12.6.4 Volume Forecast, 2025-2035
- 12.6.5 Base-Year Market Share, 2025
- 12.6.6 Segment CAGR and Growth Drivers
- 12.6.7 Subsegment Market Size and Forecast
- 12.6.7.1 Equipment
- 12.6.7.2 Engineering and Installation
- 12.6.7.3 O&M and Spare Parts
- 12.6.8 Subsegment Pricing and Adoption Trends
- 12.6.9 Leading Suppliers and Competition
- 12.6.10 Regional Demand and Opportunities
- 12.7 Segment Growth Comparison
- 12.8 Segment Attractiveness and Priority Matrix
Chapter 13 Australia Circulating Fluidized Bed (CFB) Boilers End-Use and Application Market Outlook
- 13.1 End-Use Industry and Customer Demand Structure
- 13.2 Leading Applications and Customer Groups
- 13.3 End-Use Market Size, Share and Forecast
- 13.4 Major End-Use Industry Deep Dives
- 13.4.1 Customer Requirements and Use Cases
- 13.4.2 Demand and Replacement Cycles
- 13.4.3 Technical and Regulatory Considerations
- 13.4.4 Purchasing and Procurement Models
- 13.4.5 Leading Vendors and Distribution Channels
- 13.4.6 Forecast and Commercial Opportunities
- 13.5 Emerging Applications and Cross-Segment Demand
- 13.6 End-Use Industry Investment Priorities
Chapter 14 Australia Circulating Fluidized Bed (CFB) Boilers Geographic Market Outlook, 2025-2035
- 14.1 Domestic Market Distribution and Demand Clusters
- 14.2 State- or Province-Wise Market Size and Forecast, 2025-2035
- 14.3 City and Metropolitan Market Outlook
- 14.4 Industrial, Manufacturing and Commercial Clusters
- 14.5 Geographic Concentration of Key End Users
- 14.6 Local Pricing and Purchasing Differences
- 14.7 Domestic Production Facilities and Capacity Map
- 14.8 Local Infrastructure and Project Pipeline
- 14.9 State-Level Policy and Incentive Differences
- 14.10 Subnational Investment Hotspots and Opportunities
- 14.11 Distribution and Logistics Networks
- 14.12 Domestic Competitive Footprint
Chapter 15 Australia Circulating Fluidized Bed (CFB) Boilers Technology, Innovation and Sustainability Outlook
- 15.1 Technology Landscape and Maturity
- 15.2 Product, Process and Service Innovation
- 15.3 AI, Automation and Digital Tools in the Industry
- 15.4 Technology Adoption and Performance Benchmarking
- 15.5 Innovation Pipeline and R&D Investment
- 15.6 Patent and Intellectual Property Trends
- 15.7 Energy Efficiency and Resource Management
- 15.8 Sustainability, Recycling and Circularity
- 15.9 Technology Roadmap, 2025-2035
- 15.10 Risks of Obsolescence and Technology Substitution
Chapter 16 Australia Circulating Fluidized Bed (CFB) Boilers Market Key Strategic Imperatives
- 16.1 Growth and Market Entry Priorities
- 16.2 High-Return Products and Segments
- 16.3 Pricing, Profitability and Cost Optimization
- 16.4 Technology Investment and Product Differentiation
- 16.5 Supply Chain Localization and Resilience
- 16.6 Distribution and Customer Acquisition
- 16.7 Partnership, Acquisition and Capacity Strategy
- 16.8 Regional Expansion Priorities
- 16.9 Short-, Medium- and Long-Term Actions
Chapter 17 Competition Outlook
- 17.1 Industry Competition Characteristics
- 17.2 Market Structure and Concentration
- 17.3 Market Share and Competitive Positioning, 2025
- 17.4 Company-Wise Revenue and Product Benchmarking
- 17.5 Production and Service Capacity Benchmarking
- 17.6 Technology, Pricing and Differentiation
- 17.7 Regional Footprint and Distribution Strength
- 17.8 Mergers, Acquisitions and Strategic Alliances
- 17.9 New Entrants and Competitive Threats
- 17.10 Porter's Five Forces and Industry Attractiveness
- 17.11 Competitive Outlook, 2025-2035
Chapter 18 Company Profiles
- 18.1 Company Coverage and Selection Criteria
- 18.2 Babcock & Wilcox Enterprises, Inc.
- 18.2.1 Business Description
- 18.2.2 Company Ownership and Geographic Presence
- 18.2.3 Product and Service Portfolio
- 18.2.4 Manufacturing and Operating Footprint
- 18.2.5 Production Capacity and Expansion Plans
- 18.2.6 Financial Performance and Investment
- 18.2.7 Market Share and Competitive Position
- 18.2.8 Technology and Innovation Capabilities
- 18.2.9 Strategic Alliances or Partnerships
- 18.2.10 Recent Developments
- 18.2.11 Growth Strategy and Outlook
- 18.3 Sumitomo SHI FW
- 18.4 ANDRITZ AG
- 18.5 Valmet Oyj
- 18.6 Mitsubishi Power Ltd
- 18.7 Other Relevant Market Participants
Note: Every listed company is profiled on the structure shown under the first company. The company list is preliminary and may change based on research findings, market developments, data availability and client requirements.
Chapter 19 Disclaimer
- 19.1 Research and Forecast Disclaimer
- 19.2 Data Source and Estimation Limitations
Note: The depth of individual sections depends on data availability for this market. Volume, capacity, trade and other unit-based metrics are included where applicable.

