
Outages and data centers drive backup power purchases
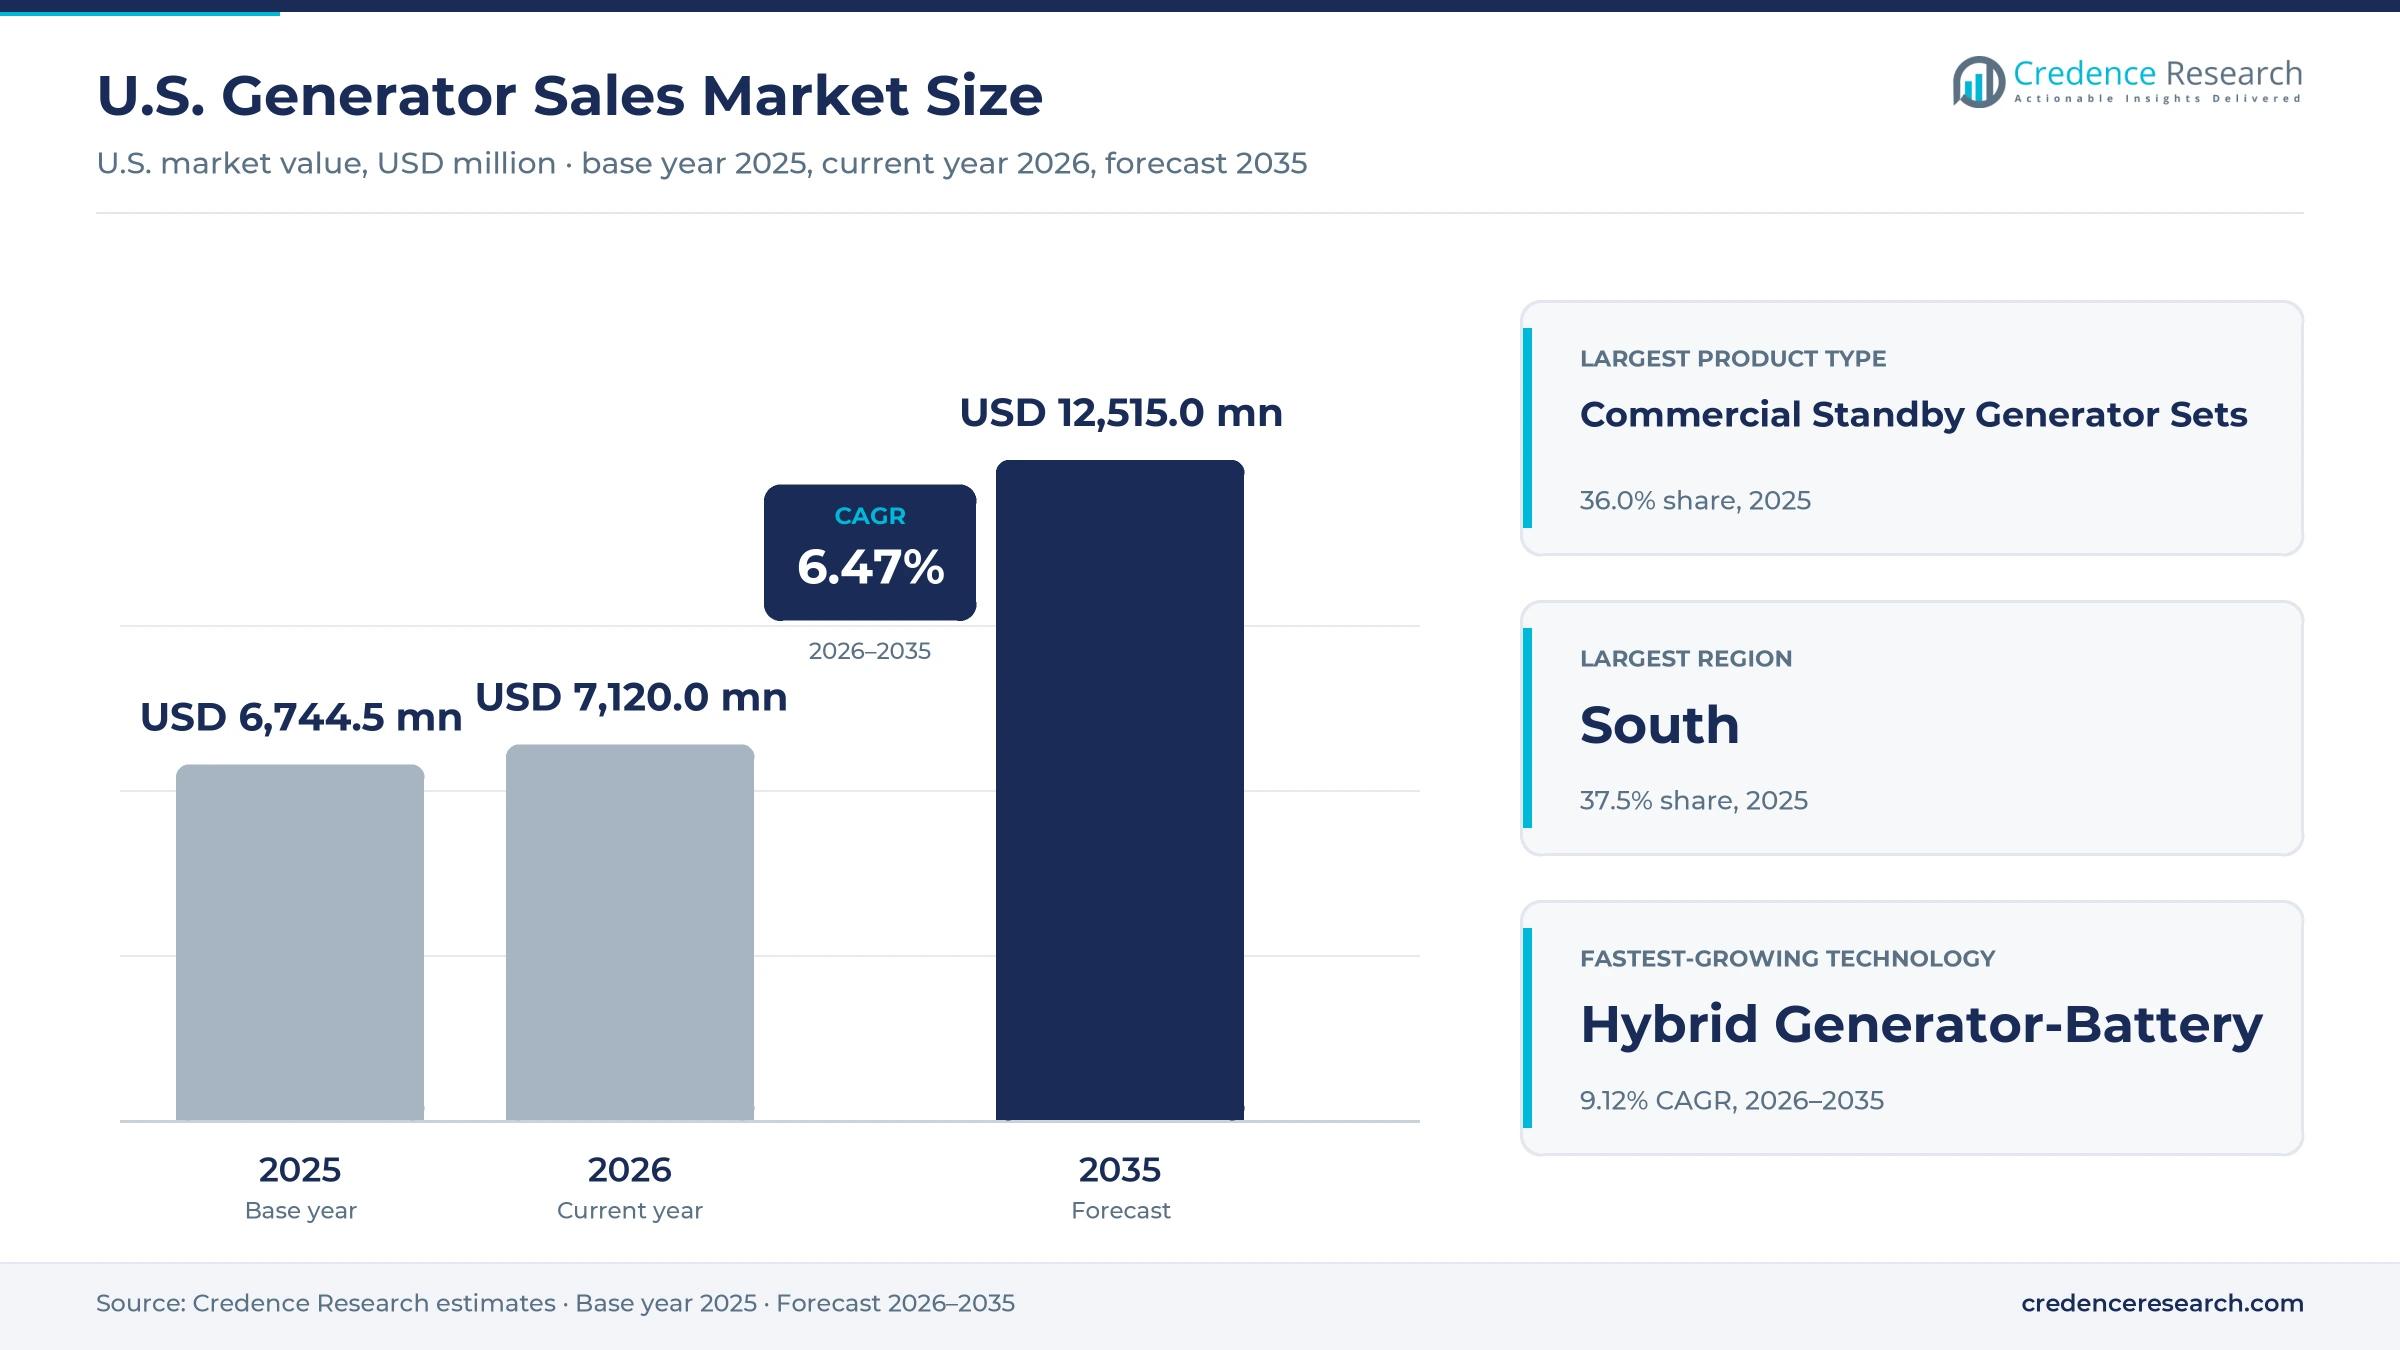
The U.S. generator sales market was valued at USD 6.74 billion in 2025 and is projected to increase from USD 7.12 billion in 2026 to USD 12.51 billion by 2035, registering a CAGR of 6.47% during 2026–2035. Demand comes from households, data centers, hospitals, telecom networks and industrial sites that buy standby, prime and portable sets to keep operating when the grid fails. The South held the largest regional share, 37.5% in 2025, and is also the fastest-growing region at 6.84% a year, because hurricanes cause long outages there while population and data center capacity keep rising. Outages lasted 11 hours on average for each U.S. electricity customer in 2024, nearly twice the level of a decade earlier. A regulatory change also matters, because a federal clarification in May 2025 allowed certain emergency engines to run up to 50 hours a year to support the grid under paid programs.
What does the U.S. generator sales estimate cover?
The estimate measures the value of new generator sets sold to buyers in the United States, including portable units, home standby systems, commercial standby sets and industrial sets that run as prime or continuous power. It counts diesel, natural gas, dual-fuel and hybrid units sold through dealers, direct OEM accounts, retail and e-commerce, and electrical contractors. Sales are assigned to the Census region where the equipment is installed or delivered.
The estimate excludes used and rental units, service contracts, fuel and utility-scale power plants built to sell electricity. It also excludes stand-alone battery systems that are sold without an engine-driven set. The value chain runs from engine and alternator makers through packagers, enclosure builders and dealers to installers and end users.
U.S. Generator Sales Market Insights
- The market was valued at USD 6.74 billion in 2025 and is projected to reach USD 12.51 billion by 2035, registering a CAGR of 6.47% during 2026–2035.
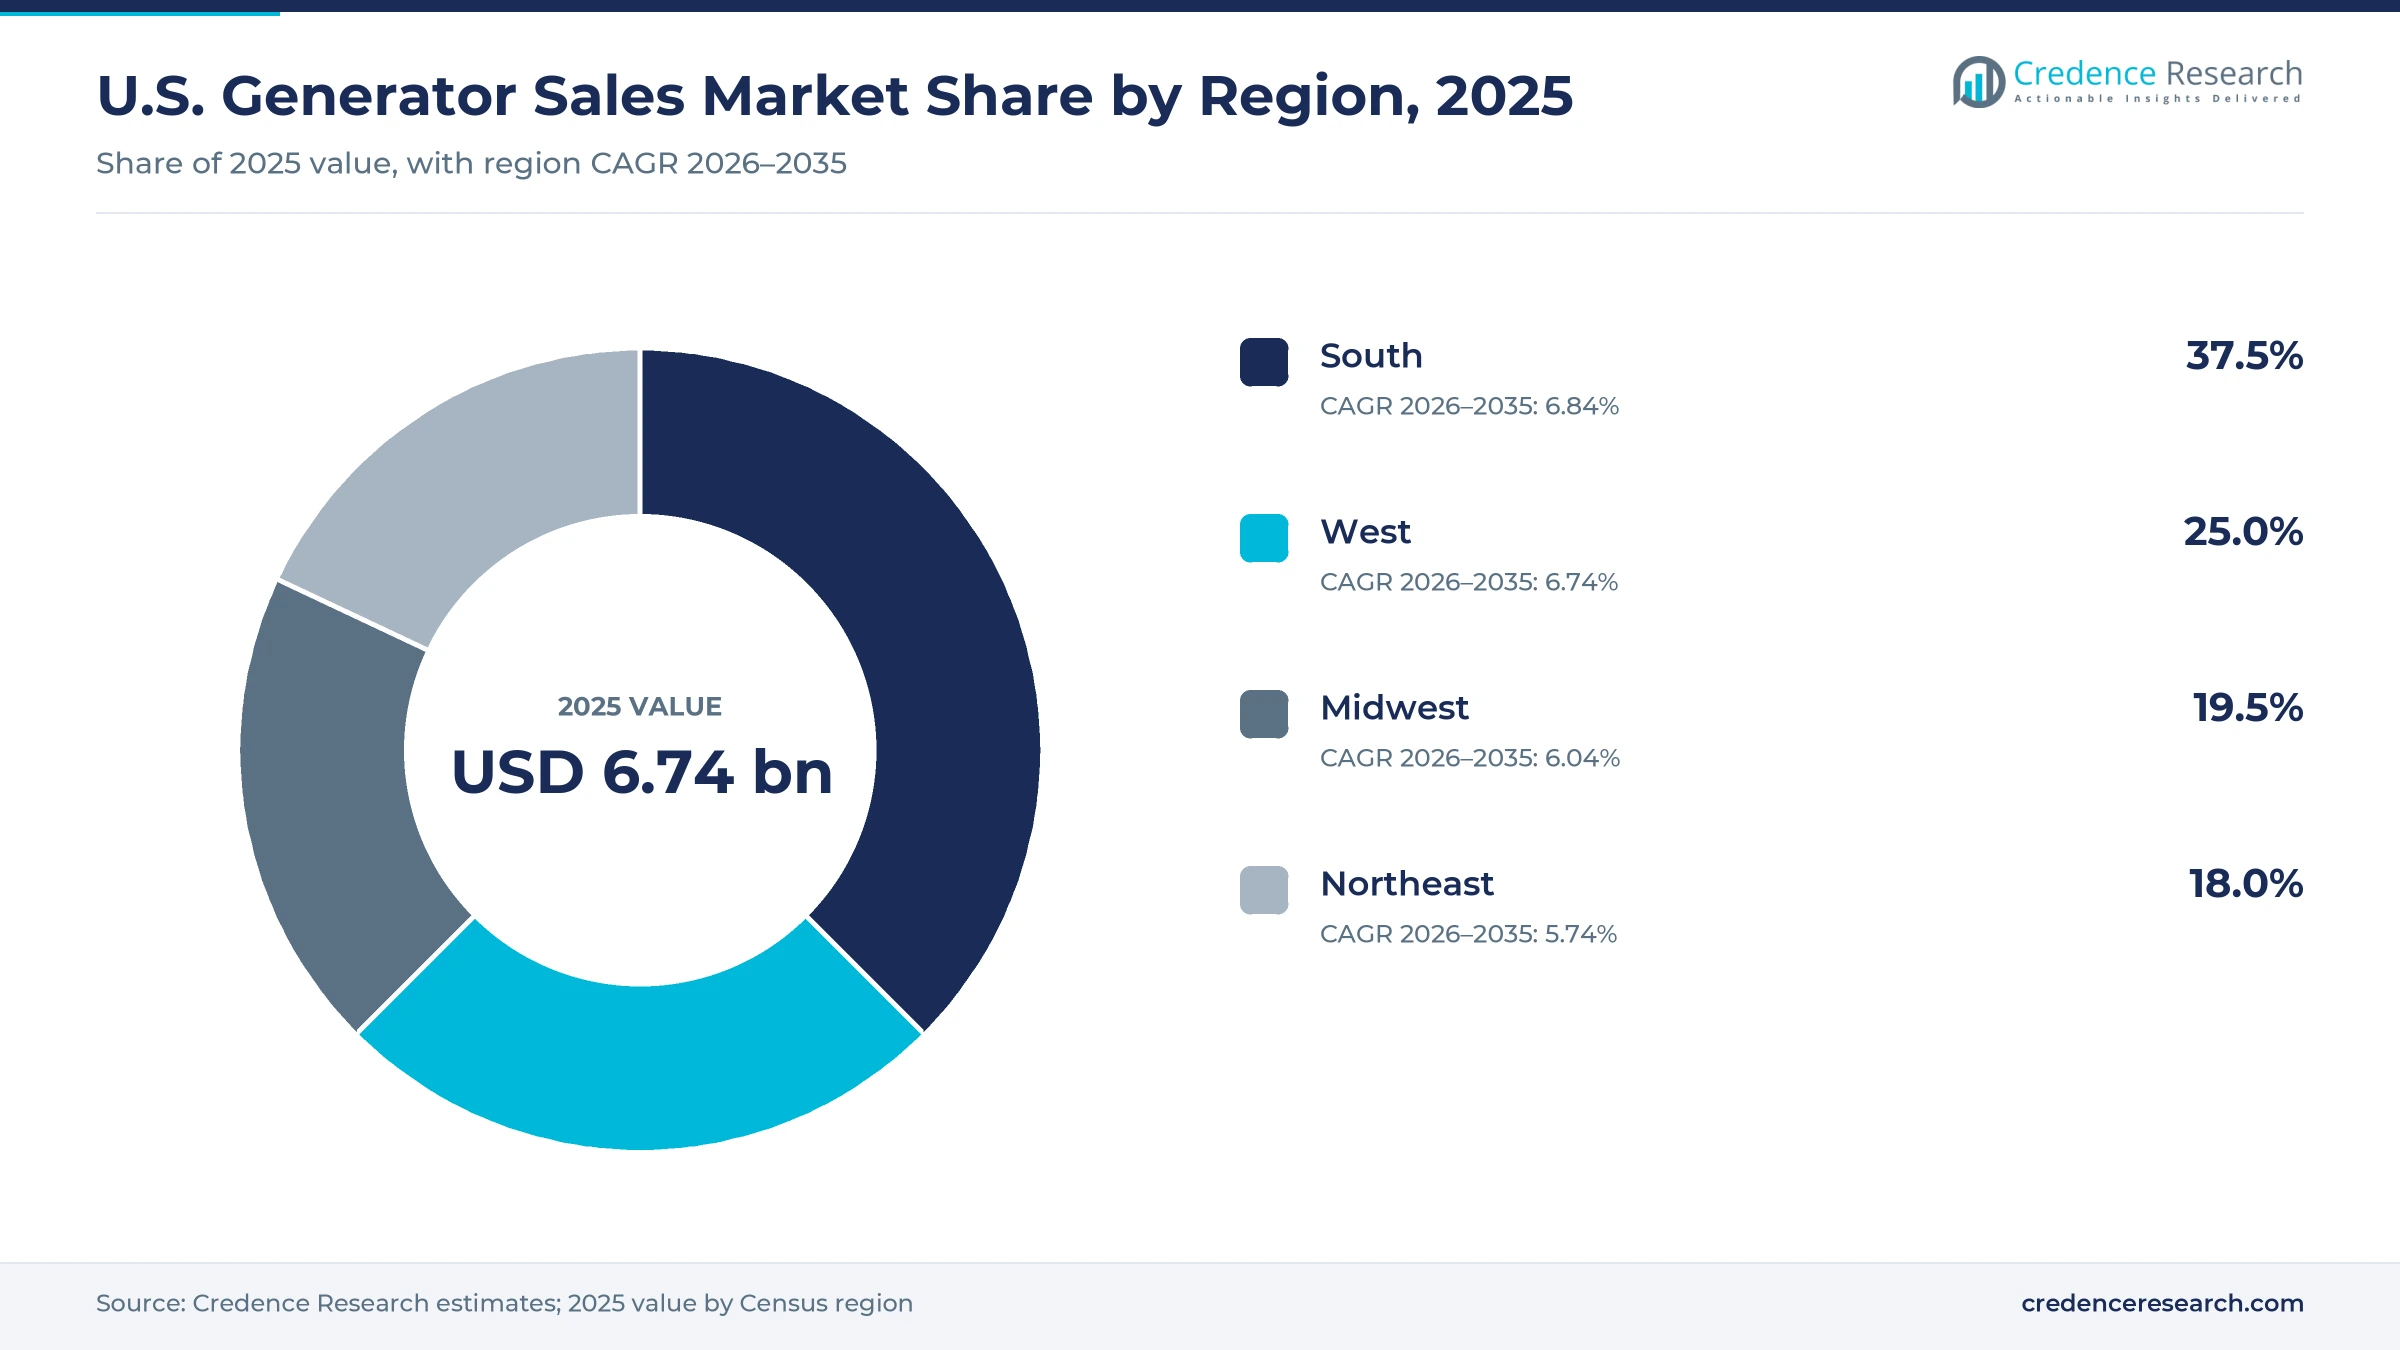
- The South held 37.5% of 2025 value, because it faces the longest hurricane outages and has the fastest-growing population of the four Census regions.
- Commercial standby generator sets led with 36.0% of 2025 value, as data centers, hospitals and offices install large backup units sized in megawatts.
- The Environmental Protection Agency clarified in May 2025 that certain emergency engines may run up to 50 hours a year to support the grid under financial arrangements.
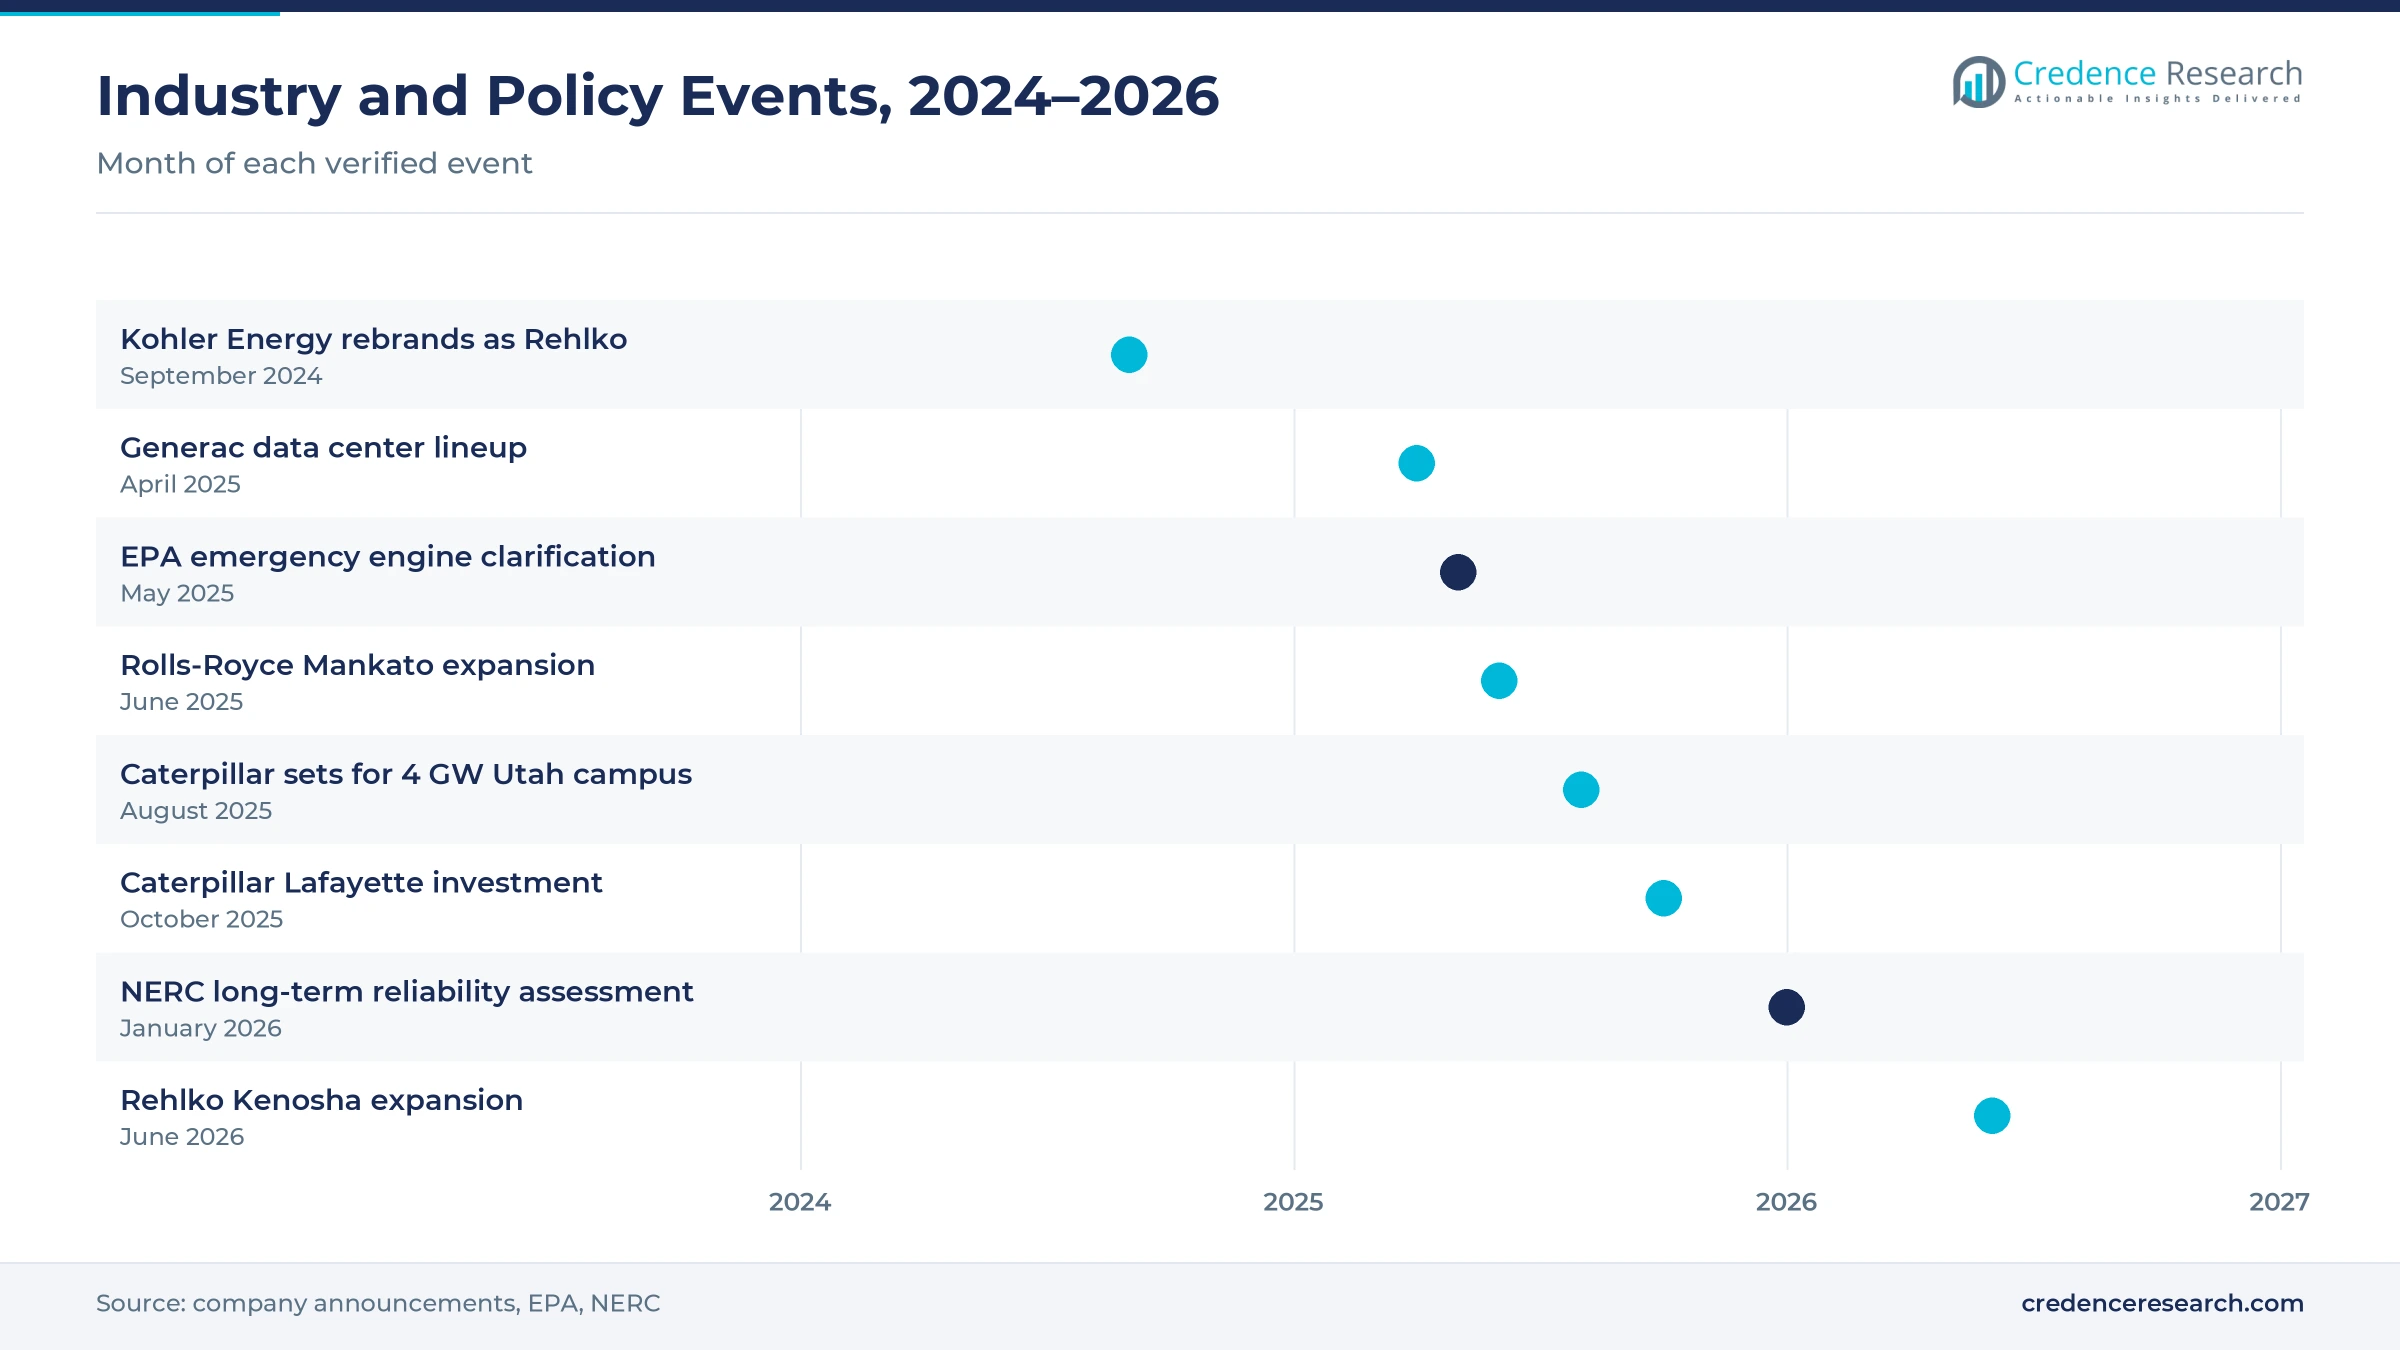
- Caterpillar, Rolls-Royce Power Systems and Rehlko announced U.S. plant expansions between June 2025 and June 2026 to supply data center backup power.
Commercial standby sets and households lead 2025 value
Which product earns the most revenue?
Based on product type, the market is categorized into portable generator sets, home standby generator sets, commercial standby generator sets, and industrial prime and continuous sets. Commercial Standby Generator Sets led with 36.0% of 2025 value, because data centers and hospitals buy large units with high prices per set. Industrial Prime and Continuous Sets grow fastest at 7.66% a year, as some data center campuses run gas-fired sets as their main power source.
Which end users buy the most backup power?
Based on end-use industry, the market is categorized into residential, data centers and telecom, healthcare and public infrastructure, and industrial and construction. Residential led with 41.0% of 2025 value, because millions of households buy portable and home standby units after storms. Data Centers and Telecom grow fastest at 8.26% a year, as new campuses need several megawatts of backup capacity before they open.
How do buyers use the sets they purchase?
Based on application, the market is categorized into emergency standby, prime power, peak shaving and demand response, and mobile and temporary power. Emergency Standby led with 68.5% of 2025 value, because most sets run only during grid failures and tests. Prime Power grows fastest at 8.07% a year, as some sites build behind-the-meter supply while grid connections take years.
Which engine technologies gain ground?
Based on technology, the market is categorized into conventional engine-driven, low-emission natural gas, dual-fuel and bi-fuel, and hybrid generator-battery units. Conventional Engine-Driven units led with 58.0% of 2025 value, because diesel sets start fast and store fuel on site. Hybrid Generator-Battery units grow fastest at 9.12% a year, as buyers pair engines with battery energy storage to cut fuel use and emissions.
| Segment Group | Leading Sub-segment | Share, 2025 | Fastest-growing Sub-segment | CAGR, 2026–2035 |
|---|---|---|---|---|
| By Product Type | Commercial Standby Generator Sets | 36.0% | Industrial Prime and Continuous Sets | 7.66% |
| By End Use | Residential | 41.0% | Data Centers and Telecom | 8.26% |
| By Application | Emergency Standby | 68.5% | Prime Power | 8.07% |
| By Technology | Conventional Engine-Driven | 58.0% | Hybrid Generator-Battery | 9.12% |
Request a Free Sample
Fill in your details and we'll send you a free sample report.
- Sample data tables & charts
- Research methodology
Weather outages, data centers and facility rules lift demand
Why do storms push households toward backup units?
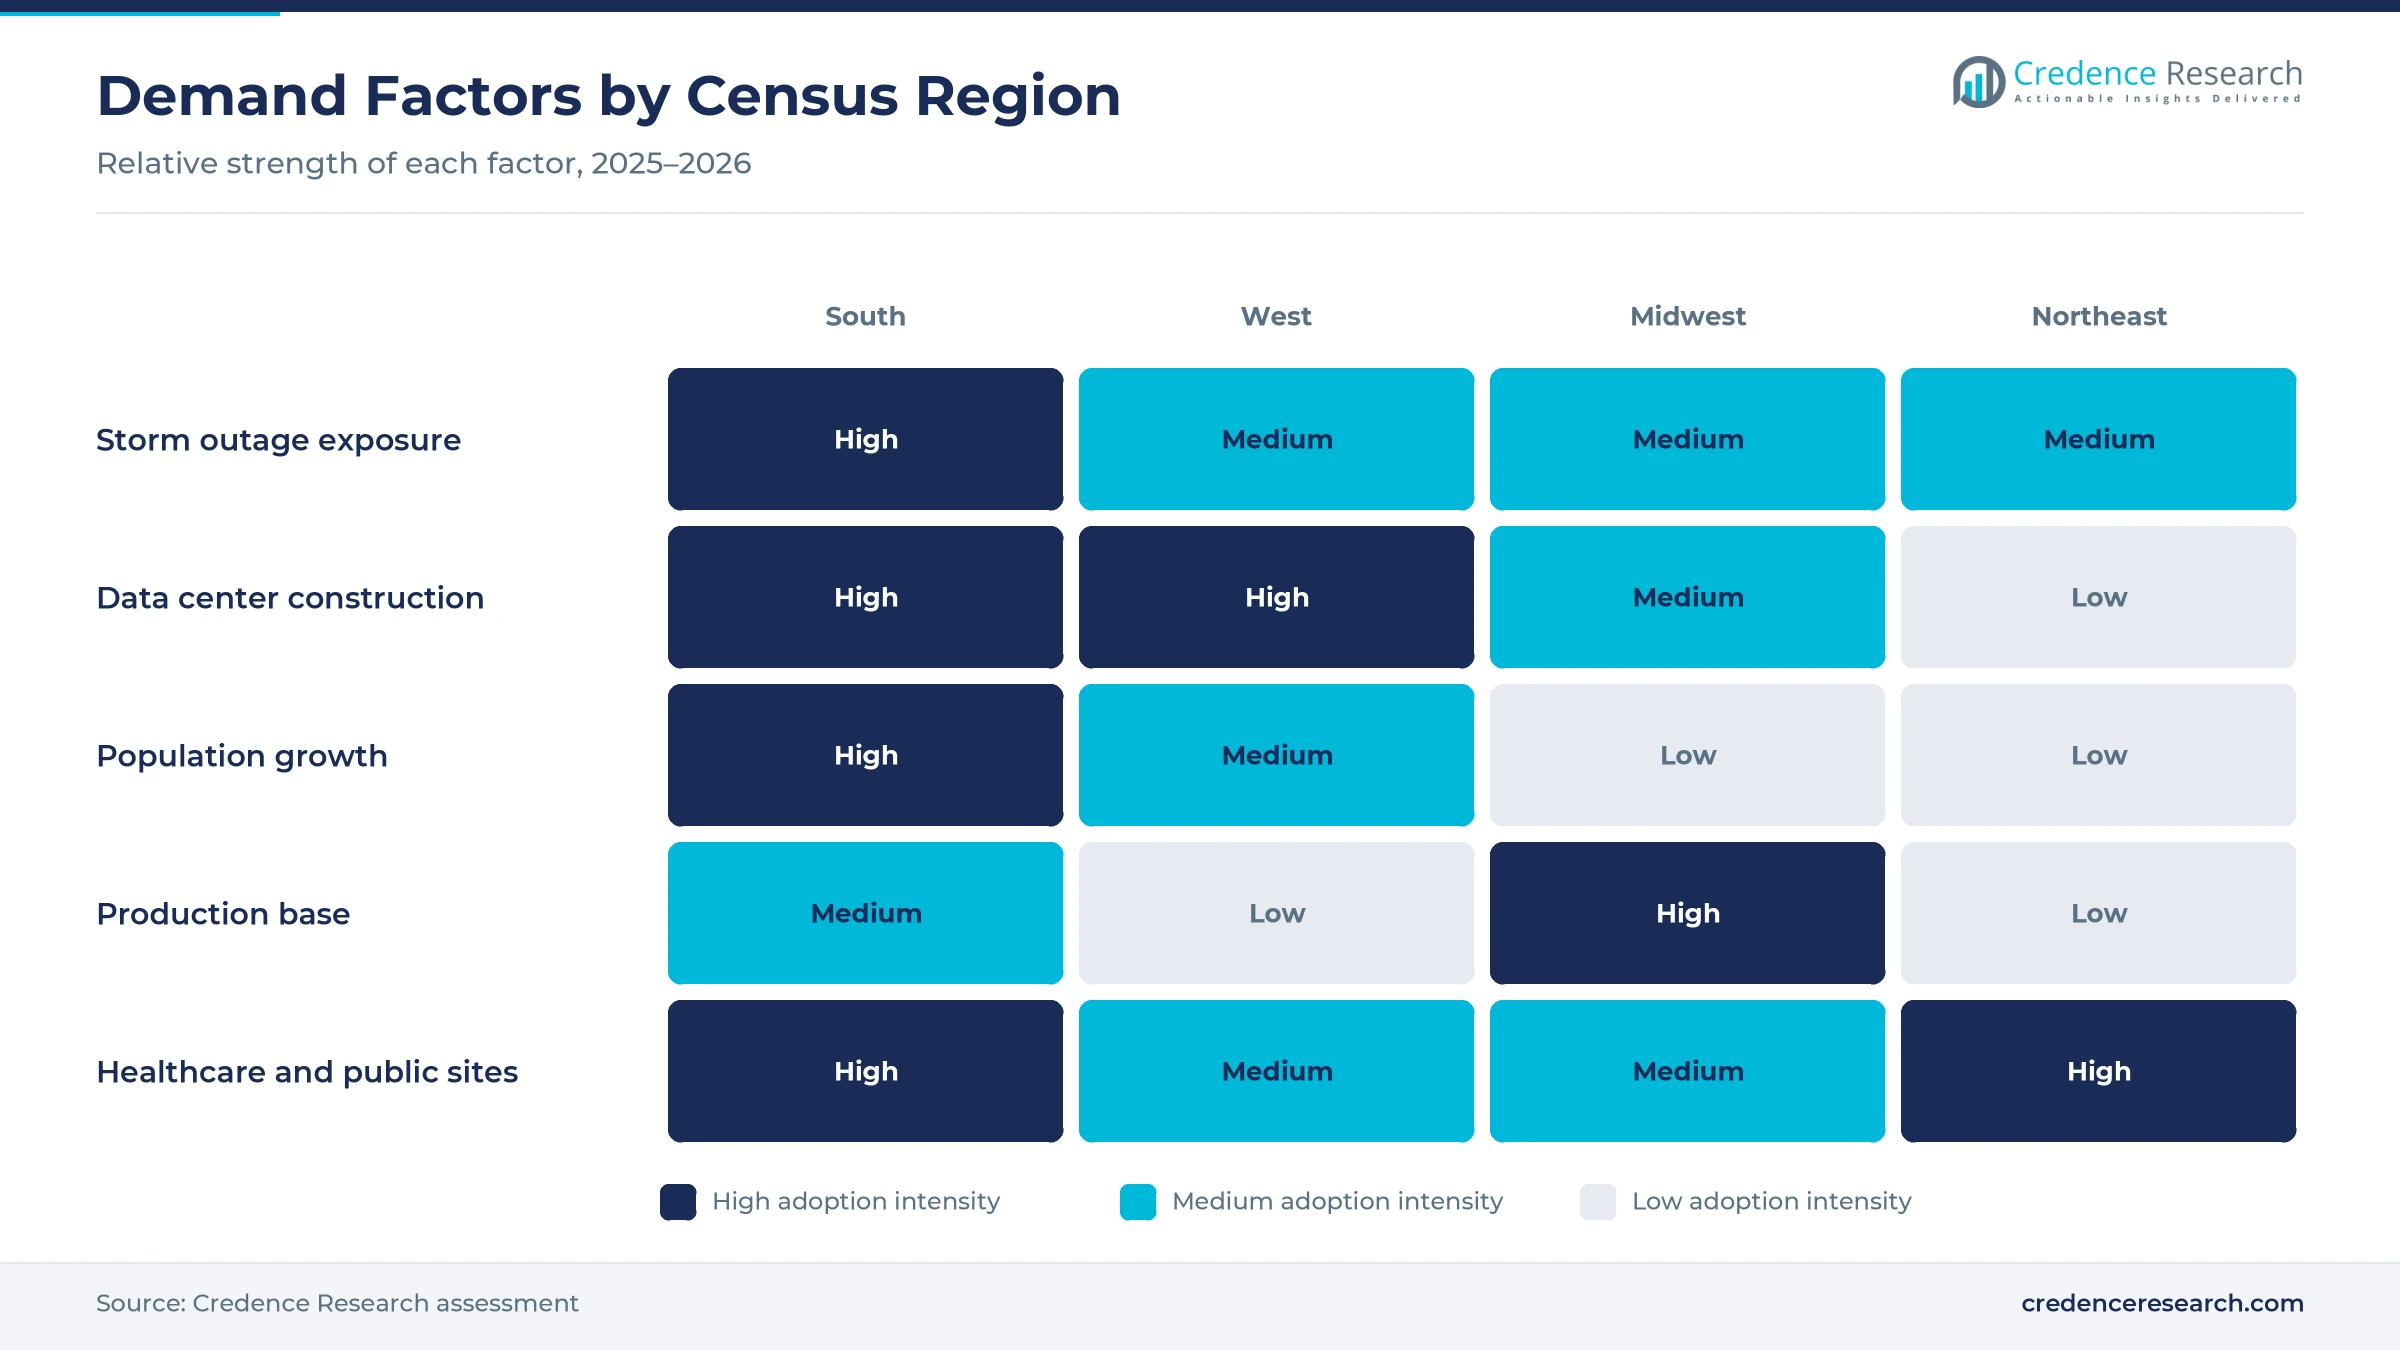
Longer weather-related outages are the main driver, because each major storm leaves millions of homes and businesses without power for days. U.S. electricity customers averaged 11 hours without power in 2024, and major events caused 80% of those hours, according to the U.S. Energy Information Administration. Major-event interruptions averaged nearly nine hours in 2024, compared with nearly four hours a year from 2014 to 2023. Hurricane Helene cut power to 5.9 million customers across 10 states in September 2024, including at least 1.2 million in South Carolina. As a result, residential buyers held 41.0% of 2025 value as households buy portable and home standby units.
How much new computing load needs on-site backup?
Data center expansion raises orders for large sets, because every new hall needs on-site backup sized to its full load. Data centers used about 4.4% of U.S. electricity in 2023 and could use 6.7% to 12% by 2028, according to the Department of Energy. Their consumption rose from 58 TWh in 2014 to 176 TWh in 2023, so backup needs have grown with them. Generac introduced five data center units from 2.25 MW to 3.25 MW in April 2025, while Rolls-Royce said in June 2025 that its Mankato output of mtu Series 4000 sets would rise more than 120% by 2026. Therefore, data centers and telecom grow fastest among end users at 8.26% a year.
Which federal mandates protect patient power supply?
Critical-facility resilience rules support steady demand, because hospitals and care homes must keep power on for patients during outages. Federal emergency preparedness rules require hospitals, critical access hospitals and long-term care facilities to maintain emergency and standby power systems, and the rule covers 17 provider types in total. The rule took effect on Nov. 15, 2016, so compliant sets installed then now enter replacement cycles. South Carolina customers averaged nearly 53 hours without power in 2024, which shows how long hospitals and care homes may need to run on backup. Cummins launched an evolved Centum Series product line at its Fridley, Minnesota, power systems headquarters in July 2024. Therefore, emergency standby holds 68.5% of 2025 value across hospitals, water systems and public buildings.
Why are utilities paying backup engines to run?
Grid capacity strain turns some backup sets into grid assets, because utilities need fast reserves when peak demand rises. The North American Electric Reliability Corporation forecast in January 2026 that summer peak demand will rise by 224 GW over ten years, with data centers the main driver in many areas. The Environmental Protection Agency clarified in May 2025 that certain emergency engines may run up to 50 hours a year to support the grid under a financial arrangement. That interpretation answered a January 2025 request from Duke Energy about its PowerShare Mandatory 50 program. As a result, prime power grows fastest among applications at 8.07% a year, while grid programs lift peak shaving.
Gas-fired prime power and new plant capacity reshape supply
Why is on-site gas generation rising for campuses?
Gas-fired prime power is rising, because some data center developers cannot wait years for grid connections. Joule Capital Partners, Caterpillar and dealer Wheeler Machinery announced in August 2025 a 4 GW campus in Utah that will use Caterpillar G3520K sets with heat recovery for cooling. Cummins agreed in June 2026 to supply natural gas sets on its HSK78 and QSK60 platforms for a behind-the-meter microgrid at Circe Energy's West Texas campus. Deliveries for that project run from 2026 through 2030, with phased energization starting in 2027. Therefore, industrial prime and continuous sets grow fastest among product types at 7.66% a year as campuses run engines every day.
How is the shift toward domestic plant capacity playing out?
Suppliers are shifting more production into U.S. plants, because order books for large sets have outgrown existing lines. Caterpillar announced a $725 million expansion of its large engine plant in Lafayette, Indiana, in October 2025 to meet power demand from data centers and critical infrastructure. Rolls-Royce is adding a 250,000-square-foot logistics center in Mankato, Minnesota, while Rehlko said in June 2026 that a Kenosha, Wisconsin, expansion will lift data center capacity more than 400% over the decade. Generac also bought another Wisconsin plant in late 2025 for large megawatt units. As a result, commercial standby sets keep 36.0% of 2025 value as domestic supply catches up with demand.
Can storage paired with engines open a new revenue pool?
Hybrid generator-battery systems are an opening, because storage lets engines run less often while keeping power quality high. The Utah campus that Caterpillar supplies includes 1.1 GWh of grid-forming battery storage alongside its gas-fired sets. Generac has added storage and controls businesses, including Ageto and the commercial battery business of SunGrid in 2024. Pairing batteries with engines also lets data centers meet grid-forming and ride-through needs without running every set during short disturbances. Because certain emergency engines may run only up to 50 hours a year for grid support under the May 2025 federal clarification, storage can cover the remaining events. Therefore, hybrid generator-battery units grow fastest among technologies at 9.12% a year, as data centers, microgrids and remote sites combine both assets.
Can towable units capture rental and storm work?
Mobile and temporary power offers room to grow, because construction sites, events and storm recovery crews need units that move between jobs. Generac completed its acquisition of Allmand, a Holdrege, Nebraska, maker of mobile power equipment for commercial, industrial and rental markets, in January 2026. It then bought Enercon Engineering of East Peoria, Illinois, in April 2026 and generator distributor Wolter Power Systems of Brookfield, Wisconsin, in May 2026. These deals widen dealer and service coverage across the Midwest, where many power rental fleets are based. As a result, suppliers with towable units and service networks can win fleet orders after storms and on large building projects through 2035.
Lead times, emission permits and safety risks persist
Why must developers order sets so early?
Long lead times delay large projects, because engines, alternators and switchgear for megawatt sets are in short supply. Data Center Frontier reported in April 2025 that industry lead times for large data center sets ran 70 to 90 weeks, although Generac quoted 50 to 60 weeks for its new units. As a result, developers order sets more than a year before a hall opens. Suppliers respond with new plant capacity and standard designs that shorten build time.
What caps the hours an emergency engine may operate?
Emission permits limit how sets can run, because federal engine rules cap non-emergency hours for units classed as emergency engines. The 50-hour allowance clarified in May 2025 covers only certain grid support arrangements, so sites that want daily operation need stricter permits. This raises costs for prime power projects and for older diesel fleets. Buyers manage the risk with natural gas engines, aftertreatment and hybrid storage that reduces runtime.
Why does carbon monoxide weigh on small units?
Safety risks affect portable set buyers and sellers, because exhaust from units run indoors kills people after storms. About 100 consumers die each year in the United States from carbon monoxide poisoning linked to portable sets, according to the Consumer Product Safety Commission. This keeps pressure on makers to add automatic shut-off features and certified designs. Retailers and dealers also spend more on safety guidance at the point of sale.
How does storm timing affect household orders?
Demand swings with outage seasons, because many households buy only after a storm leaves them without power. Generac described the second half of 2025 as the lowest outage environment in a decade, which cut residential orders that year. This volatility makes dealer stocking and factory planning harder for portable and home standby lines. Suppliers smooth demand through financing offers, dealer training and marketing in regions with long outage records.
The South leads as hurricanes and data centers add demand
| Region | Value, 2025 (USD billion) | Share, 2025 | CAGR, 2026–2035 |
|---|---|---|---|
| South | 2.53 | 37.5% | 6.84% |
| West | 1.69 | 25.0% | 6.74% |
| Midwest | 1.32 | 19.5% | 6.04% |
| Northeast | 1.21 | 18.0% | 5.74% |
Why does the South lead backup power buying?
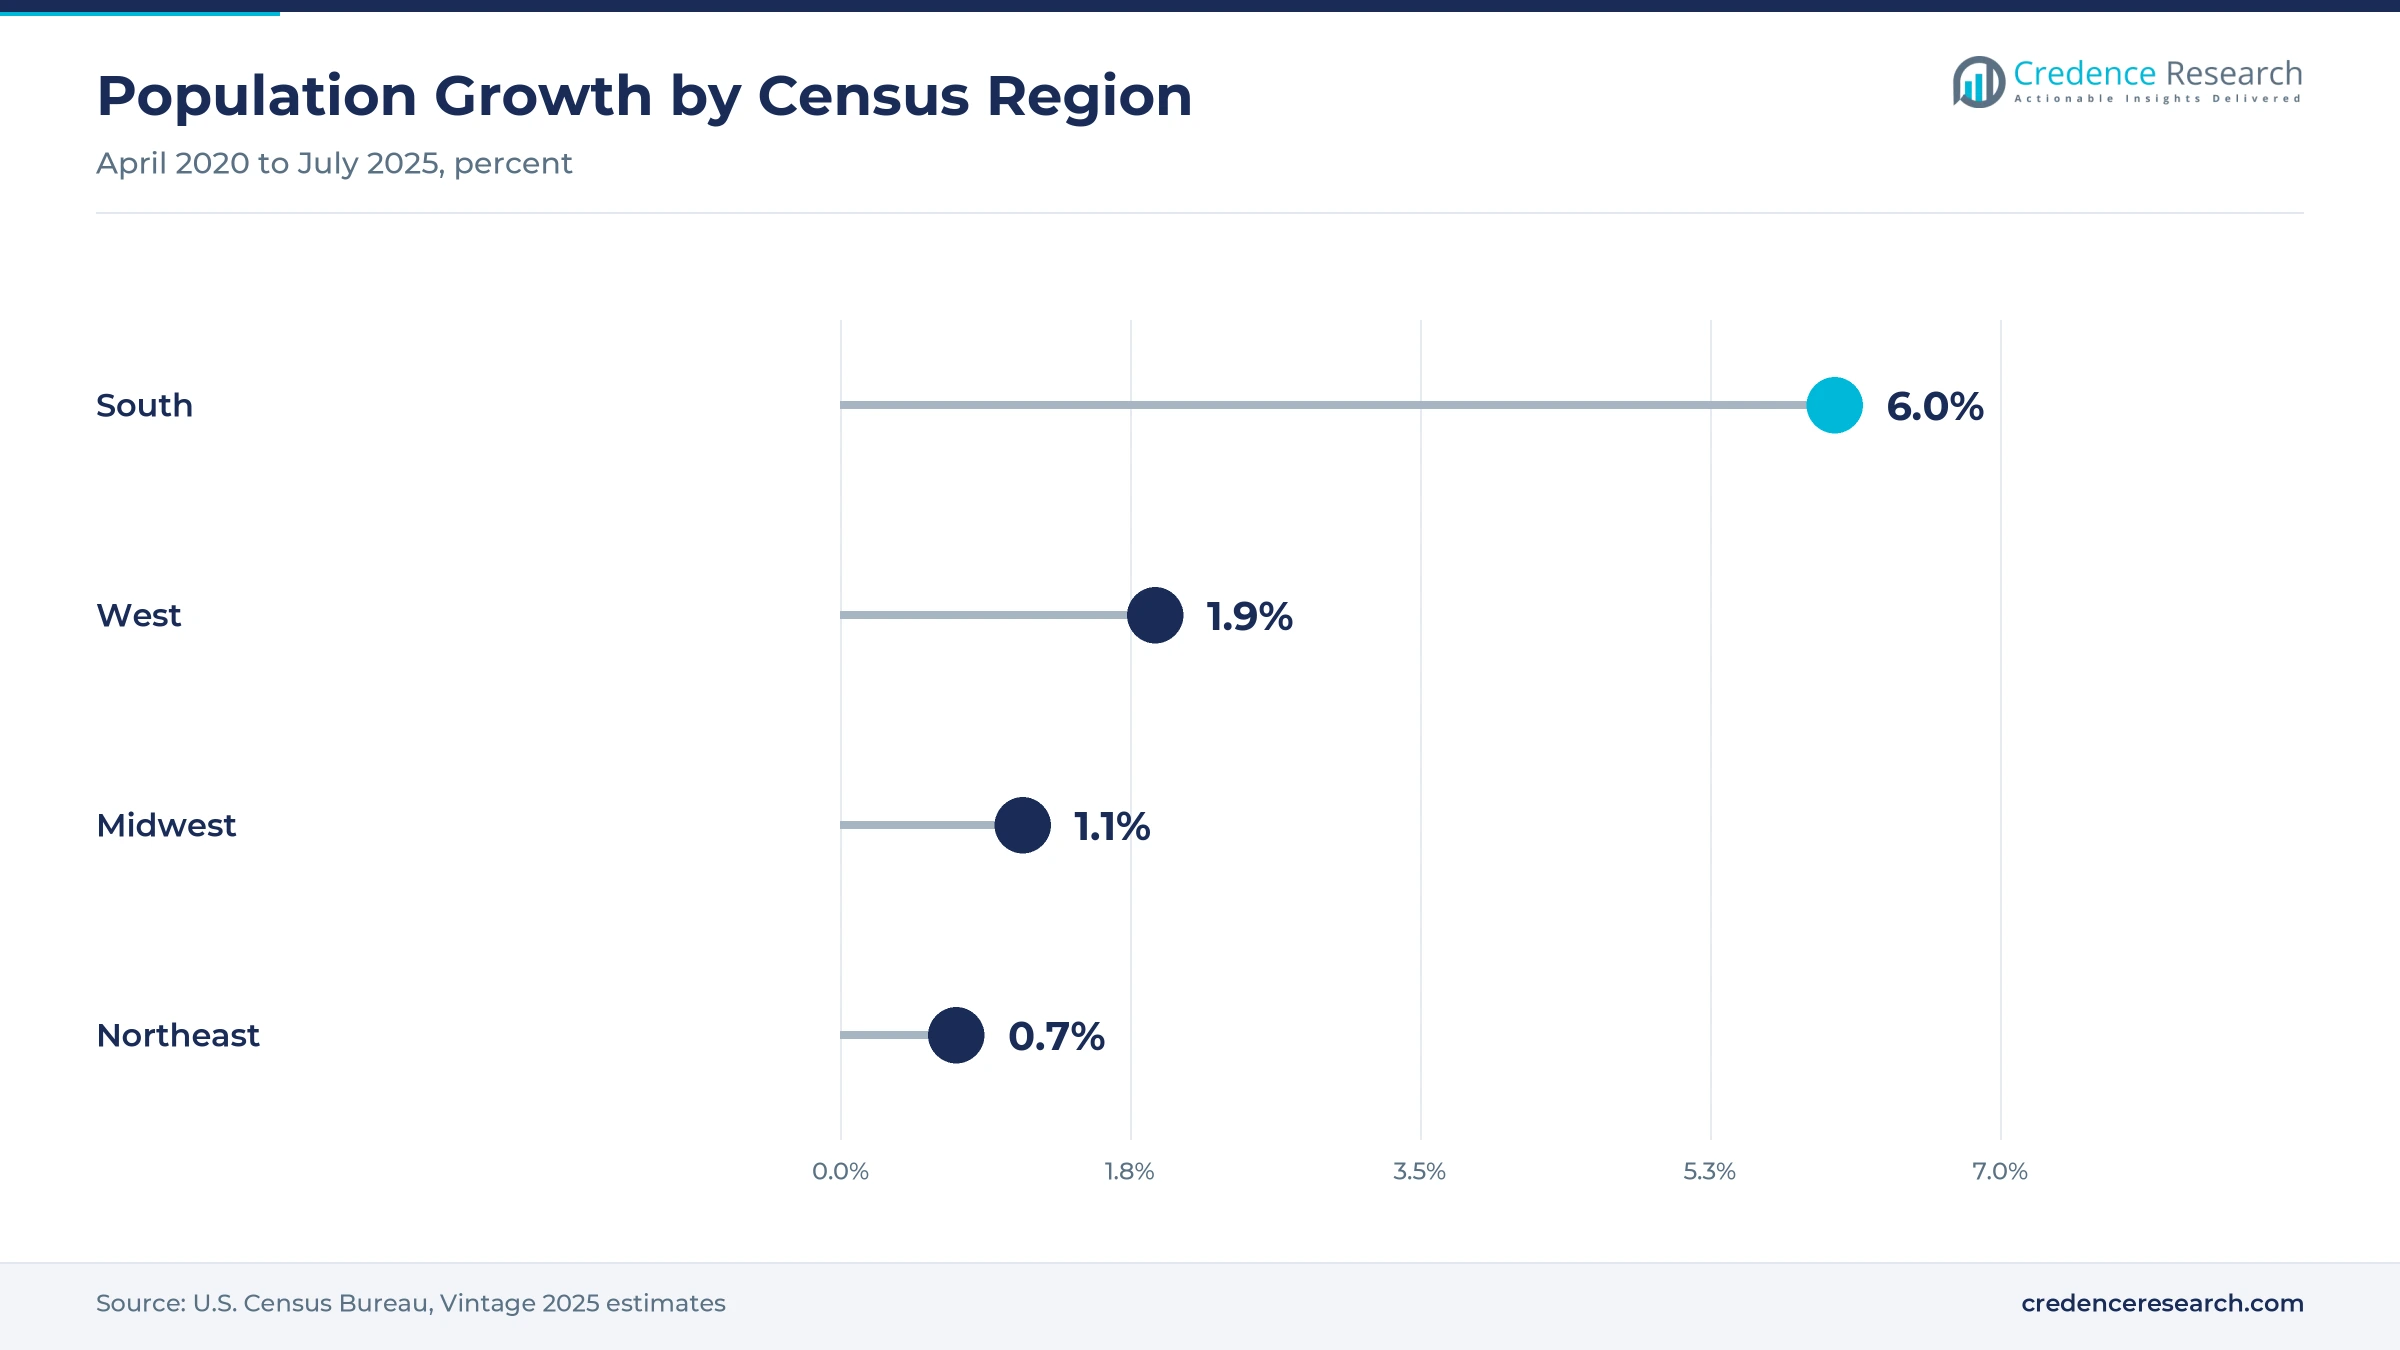
The South held 37.5% of 2025 value and grows fastest at 6.84% a year, because hurricanes cause the longest outages there. Hurricane Beryl left 2.6 million Texas customers without power in July 2024, and Hurricane Milton cut power to 3.4 million Florida customers that October. The South's population also grew 6.0% from 2020 to 2025, about twice the national rate of 3.1%, according to the U.S. Census Bureau. These forces keep both home standby and large commercial demand high.
How is Utah reshaping orders in the West?
The West held 25.0% of 2025 value and grows at 6.74% a year, because large data center campuses are rising in states such as Utah. A campus announced there in August 2025 will run on Caterpillar G3520K sets, which shows the scale of new orders. Generac also offers cooling packages rated for 50°C for hot sites such as Phoenix. Population grew 1.9% from 2020 to 2025, so data centers drive more of the growth than households.
What role does the Midwest play as a supply base?
The Midwest held 19.5% of 2025 value and grows at 6.04% a year, because it combines steady demand with much of the national production base. Cummins runs its power systems headquarters in Fridley, Minnesota, Rolls-Royce assembles mtu sets in Mankato, and Rehlko and Generac are expanding in Wisconsin. Caterpillar is investing $725 million in Lafayette, Indiana, for large engines. However, Illinois and South Dakota had fewer than one interruption per customer in 2024, which tempers household demand.
Why does the Northeast grow more slowly?
The Northeast held 18.0% of 2025 value and grows at 5.74% a year, because its population grew only 0.7% from 2020 to 2025. Even so, Maine and Vermont had frequent outages in 2024, often from storm-damaged trees, which keeps rural households buying standby units. Hospitals, transit systems and financial data centers in dense cities also buy large sets. Massachusetts averaged under two hours without power in 2024, which limits demand in some urban markets.
Capacity expansions and acquisitions marked 2025 to 2026
| Development | Status and market relevance |
|---|---|
| In April 2025, Generac introduced five data center generators from 2.25 MW to 3.25 MW in diesel and natural gas versions. | Expands Generac from home standby into large megawatt sets for hyperscale campuses |
| In June 2025, Rolls-Royce announced a $24 million logistics center in Mankato, Minnesota, for mtu Series 4000 data center sets. | Mankato output is expected to rise more than 120% by 2026 compared with 2025 |
| In October 2025, Caterpillar detailed a $725 million expansion of its large engine plant in Lafayette, Indiana. | Raises engine supply for power generation customers, including data centers |
| In January 2026, Generac completed its acquisition of Allmand, a Nebraska maker of mobile power equipment. | Adds towable units for rental, construction and industrial customers |
| In June 2026, Rehlko announced an assembly expansion in Kenosha, Wisconsin, for data center sets up to 4 MW. | Initial production expected in late 2026, with full capacity in early 2027 |
Gas engines, paralleling controls and hybrid storage
- Natural gas engines such as the Caterpillar G3520K and Cummins HSK78 let campuses run sets as prime power without storing diesel on site.
- Paralleling controls such as Generac's Modular Power Systems let several units share load and scale as a site adds capacity.
- Automatic transfer equipment built into transfer switches moves loads to the set automatically when grid power fails.
- Hybrid storage packages pair engines with batteries, so sites can cover short disturbances without starting every set.
Need a Custom Version of This Report?
Tailor the scope, geography, or segments to your exact requirements.
- Custom geography or segment scope
- Direct access to our analyst team
Engine makers and standby specialists compete on capacity
Competition is led by a few engine makers and standby specialists that compete on capacity, lead time, emissions and dealer coverage. Generac holds a leading position in home standby and has moved into large data center units, while expanding through acquisitions of mobile power, custom enclosure and distribution businesses in 2026. Caterpillar and Cummins supply diesel and gas sets from small commercial units to multi-megawatt systems, backed by national dealer and service networks. Rolls-Royce Power Systems builds mtu sets in Minnesota with engines from South Carolina, and Rehlko, the former Kohler Energy, sells home and industrial sets from its Wisconsin base. Rivals also compete on factory testing, paralleling controls and service contracts. Plant capacity and short delivery times increasingly decide which suppliers win large data center orders.
Companies profiled and their roles in this market
| Company | Type | Role in the market |
|---|---|---|
| Generac Holdings Inc. | Standby and portable specialist | Launched 2.25–3.25 MW data center units in April 2025 and acquired Allmand in January 2026 |
| Caterpillar Inc. | Engine maker and set supplier | Expanding its Lafayette, Indiana, large engine plant by $725 million; supplies G3520K gas sets for data center campuses |
| Cummins Inc. | Engine maker and set supplier | Launched its evolved Centum Series in Fridley, Minnesota, in July 2024; supplies gas sets to a West Texas data center microgrid |
| Rehlko | Home and industrial set supplier | Rebranded from Kohler Energy in September 2024; expanding Kenosha assembly for sets up to 4 MW |
| Rolls-Royce Power Systems AG | Large set supplier | Builds mtu Series 4000 sets in Mankato, Minnesota and expects output to rise more than 120% by 2026 |
Credence Research view on domestic backup power demand
Credence Research's view is that U.S. generator demand will keep growing because the grid faces longer storm outages and faster load growth at the same time. Data centers turn backup power into a planned capital purchase rather than a storm reaction, which smooths demand for large sets. Household buying will stay cyclical and tied to hurricane seasons. Gas-fired prime power and hybrid storage are the main upside factors, while tighter emission permits or faster grid connections could slow large-set growth through 2035.
How the U.S. backup power estimate was built
The report uses 2025 as the base year for every value, share and growth rate. Market values come from the Credence Research model, and regional, product type, end use, application and technology splits are Credence Research estimates. Inputs include Energy Information Administration outage data, Department of Energy data center studies, Census Bureau population estimates, federal rules, company filings and company announcements. Regional shares and growth tilts are Credence Research estimates that reflect outage exposure, population trends and data center construction in each Census region. No interviews or surveys were used in preparing these estimates.
Data centers and grid stress shape demand through 2035
The market is expected to reach USD 12.51 billion by 2035, a 6.47% CAGR during 2026–2035, as storm outages, data center construction and grid strain keep backup power on buyers' budgets. Large commercial and prime power sets should gain share as campuses add capacity and some run engines every day. The South should keep the largest share because of hurricane exposure and population growth. Faster plant expansions would lift this outlook, while a run of mild storm seasons would slow household purchases.
Frequently Asked Questions
How big is the U.S. generator sales market?
Which region leads the market?
Which product type holds the largest share?
How do power outages affect generator demand?
Why do data centers matter for generator sales?
What did the May 2025 federal clarification change?
Which technology grows fastest?
Who are the main companies in the market?
Table of Content
Chapter 1 Market Segmentation
- 1.1 Segmentation Framework
- 1.1.1 Product and Service Classification
- 1.1.2 Application and End-Use Classification
- 1.1.3 Technology and Solution Classification
- 1.1.4 Customer and Distribution Channel Classification
- 1.1.5 Geographic Segmentation
- 1.1.6 Market Segment Definitions and Boundaries
- 1.2 By Product Type
- 1.2.1 Portable Generator Sets
- 1.2.2 Home Standby Generator Sets
- 1.2.3 Commercial Standby Generator Sets
- 1.2.4 Industrial Prime and Continuous Sets
- 1.3 By End Use
- 1.3.1 Residential
- 1.3.2 Data Centers and Telecom
- 1.3.3 Industrial and Construction
- 1.3.4 Healthcare and Public Infrastructure
- 1.4 By Application
- 1.4.1 Emergency Standby
- 1.4.2 Mobile and Temporary Power
- 1.4.3 Prime Power
- 1.4.4 Peak Shaving and Demand Response
- 1.5 By Technology
- 1.5.1 Conventional Engine-Driven
- 1.5.2 Low-Emission Natural Gas
- 1.5.3 Dual-Fuel and Bi-Fuel
- 1.5.4 Hybrid Generator-Battery
Chapter 2 Introduction
- 2.1 Report Objectives and Scope
- 2.2 Product Definition and Industry Terminology
- 2.3 Market Inclusions and Exclusions
- 2.4 Research Process
- 2.4.1 Primary Research and Expert Interviews
- 2.4.2 Secondary Research and Source Review
- 2.4.3 Top-Down and Bottom-Up Estimation
- 2.4.4 Data Triangulation and Verification
- 2.5 Market Size Measurement Basis
- 2.5.1 2025: USD 6.74 billion → 2035: USD 12.51 billion
- 2.6 Historical and Forecast Reference Periods
- 2.6.1 Historical Period: 2018-2025
- 2.6.2 Base Year: 2025
- 2.6.3 Forecast Period: 2025-2035
- 2.7 Research Assumptions and Limitations
Chapter 3 Executive Summary
- 3.1 Market Snapshot and Key Findings
- 3.2 Base-Year Market Size, 2025
- 3.3 Forecast Market Size, 2035
- 3.4 Revenue and Volume Growth Outlook
- 3.5 Key Demand and Supply Indicators
- 3.6 Leading Market Segments
- 3.7 Fastest-Growing Market Opportunities
- 3.8 Regional Performance Highlights
- 3.9 Technology and Industry Transformation
- 3.10 Competitive Landscape Summary
- 3.11 Analyst View and Strategic Implications
Chapter 4 U.S. Generator Sales Market Trends and Developments
- 4.1 Historical Industry Development, 2018-2025
- 4.2 Recent Market Trends and Developments
- 4.3 Demand and Customer Behavior Trends
- 4.4 Technology and Product Innovation
- 4.5 Artificial Intelligence, Automation and Digitalization
- 4.6 Local Manufacturing and Supply Chain Realignment
- 4.7 Industry Partnerships, Mergers and Acquisitions
- 4.8 Sustainability and Circular Economy Developments
- 4.9 Government and Private Sector Investment Trends
- 4.10 Emerging Business Models and Commercialization
- 4.11 Industry Developments and Announcements
Chapter 5 U.S. Generator Sales Market Production, Supply and Demand Analysis
- 5.1 Demand Trend and Consumption Analysis, 2018-2025
- 5.2 Demand Forecast, 2025-2035
- 5.3 Production and Output Trend, 2018-2025
- 5.4 Production and Output Forecast, 2025-2035
- 5.5 Installed Capacity and Capacity Utilization
- 5.6 Company-Wise Production Plants and Statistics
- 5.6.1 Installed Production Capacity
- 5.6.2 Actual Production
- 5.6.3 Planned Capacity and Expansion Targets
- 5.7 Supply Chain Structure and Procurement Trends
- 5.8 Supply-Demand Gap and Bottlenecks
- 5.9 Import Dependence and Sourcing Structure
- 5.10 Contract Manufacturing and Outsourcing
- 5.11 Regional Supply and Demand Concentration
Chapter 6 U.S. Generator Sales Market Pricing Analysis
- 6.1 Pricing Structure and Measurement
- 6.2 Historical Pricing Trends, 2018-2025
- 6.3 Pricing Outlook, 2025-2035
- 6.4 Average Selling Price and Unit Economics
- 6.5 Pricing by Product and Market Segment
- 6.6 Geographic Pricing Differences
- 6.7 Key Input, Energy, Labor and Logistics Costs
- 6.8 Contract Pricing and Purchasing Models
- 6.9 Pricing Sensitivity and Competitive Positioning
- 6.10 Price, Margin and Profitability Implications
Chapter 7 U.S. Generator Sales Market Dynamics
- 7.1 Market Growth Drivers
- 7.1.1 Demand-Side Drivers
- 7.1.2 Technology and Innovation Drivers
- 7.1.3 Infrastructure and Investment Drivers
- 7.1.4 Regulatory and Policy Drivers
- 7.2 Market Restraints
- 7.2.1 Cost and Affordability Constraints
- 7.2.2 Technology and Adoption Barriers
- 7.2.3 Supply Chain and Operational Constraints
- 7.3 Market Challenges
- 7.3.1 Competitive Pressure and Margin Erosion
- 7.3.2 Skills, Infrastructure and Implementation Gaps
- 7.4 Emerging Market Opportunities
- 7.5 Market Dynamics Impact and Time-Horizon Assessment
Chapter 8 U.S. Generator Sales Value Chain Analysis
- 8.1 Industry Value Chain Overview
- 8.2 Upstream Suppliers and Critical Inputs
- 8.3 Technology and Component Providers
- 8.4 Manufacturing or Service Delivery
- 8.5 Distribution, Channel Partners and Integrators
- 8.6 Downstream Applications and End Users
- 8.7 Value Addition and Profit Pools
- 8.8 Vertical Integration and Outsourcing
- 8.9 Supplier Concentration and Risk
- 8.10 Supply Chain Localization and Resilience
Chapter 9 U.S. Generator Sales Market Regulations and Policies
- 9.1 Relevant Laws, Standards and Compliance Frameworks
- 9.2 Product, Service, Safety and Quality Requirements
- 9.3 Government Policies, Incentives and Subsidies
- 9.4 Imports, Exports and Trade Barriers
- 9.5 Public Procurement and Local Content Requirements
- 9.6 Environmental and Sustainability Compliance
- 9.7 Upcoming Policy Changes and Market Implications
Chapter 10 U.S. Generator Sales Market Hotspots and Opportunities
- 10.1 Market Opportunity Mapping and Growth Hotspots
- 10.2 High-Growth Applications and Customer Groups
- 10.3 Underserved Markets and White-Space Opportunities
- 10.4 Emerging Technology and Product Opportunities
- 10.5 New Capacity and Investment Hotspots
- 10.6 Market Entry and Expansion Opportunities
- 10.7 Distribution and Partnership Opportunities
- 10.8 Near-Term and Long-Term Commercial Potential
- 10.9 Opportunity Attractiveness and Execution Risks
Chapter 11 U.S. Generator Sales Market Outlook, 2025-2035
- 11.1 Market Size and Analysis
- 11.1.1 Revenue (Market Measurement: 2025: USD 6.74 billion → 2035: USD 12.51 billion)
- 11.1.2 Market Volume and Quantity Sold
- 11.1.3 Historical Market Size, 2018-2025
- 11.1.4 Base-Year Market Size, 2025
- 11.2 Market Forecast, 2025-2035
- 11.2.1 Revenue Forecast to 2035
- 11.2.2 Volume Forecast to 2035
- 11.2.3 CAGR and Year-on-Year Growth
- 11.2.4 Incremental Revenue Opportunity
- 11.3 Forecast Assumptions and Scenario Analysis
- 11.3.1 Base-Case Forecast
- 11.3.2 Optimistic and Conservative Scenarios
- 11.3.3 Technology, Pricing and Policy Sensitivities
- 11.4 Market Attractiveness and Growth Outlook
Chapter 12 U.S. Generator Sales Market Segmentation and Outlook
- 12.1 Segmentation Summary and Market Shares, 2025
- 12.2 Largest and Fastest-Growing Segments
- 12.3 By Product Type - Market Size and Forecast, 2025-2035
- 12.3.1 Segment Definition and Scope
- 12.3.2 Historical Market Size, 2018-2025
- 12.3.3 Revenue Forecast, 2025-2035
- 12.3.4 Volume Forecast, 2025-2035
- 12.3.5 Base-Year Market Share, 2025
- 12.3.6 Segment CAGR and Growth Drivers
- 12.3.7 Subsegment Market Size and Forecast
- 12.3.7.1 Portable Generator Sets
- 12.3.7.2 Home Standby Generator Sets
- 12.3.7.3 Commercial Standby Generator Sets
- 12.3.7.4 Industrial Prime and Continuous Sets
- 12.3.8 Subsegment Pricing and Adoption Trends
- 12.3.9 Leading Suppliers and Competition
- 12.3.10 Regional Demand and Opportunities
- 12.4 By End Use - Market Size and Forecast, 2025-2035
- 12.4.1 Segment Definition and Scope
- 12.4.2 Historical Market Size, 2018-2025
- 12.4.3 Revenue Forecast, 2025-2035
- 12.4.4 Volume Forecast, 2025-2035
- 12.4.5 Base-Year Market Share, 2025
- 12.4.6 Segment CAGR and Growth Drivers
- 12.4.7 Subsegment Market Size and Forecast
- 12.4.7.1 Residential
- 12.4.7.2 Data Centers and Telecom
- 12.4.7.3 Industrial and Construction
- 12.4.7.4 Healthcare and Public Infrastructure
- 12.4.8 Subsegment Pricing and Adoption Trends
- 12.4.9 Leading Suppliers and Competition
- 12.4.10 Regional Demand and Opportunities
- 12.5 By Application - Market Size and Forecast, 2025-2035
- 12.5.1 Segment Definition and Scope
- 12.5.2 Historical Market Size, 2018-2025
- 12.5.3 Revenue Forecast, 2025-2035
- 12.5.4 Volume Forecast, 2025-2035
- 12.5.5 Base-Year Market Share, 2025
- 12.5.6 Segment CAGR and Growth Drivers
- 12.5.7 Subsegment Market Size and Forecast
- 12.5.7.1 Emergency Standby
- 12.5.7.2 Mobile and Temporary Power
- 12.5.7.3 Prime Power
- 12.5.7.4 Peak Shaving and Demand Response
- 12.5.8 Subsegment Pricing and Adoption Trends
- 12.5.9 Leading Suppliers and Competition
- 12.5.10 Regional Demand and Opportunities
- 12.6 By Technology - Market Size and Forecast, 2025-2035
- 12.6.1 Segment Definition and Scope
- 12.6.2 Historical Market Size, 2018-2025
- 12.6.3 Revenue Forecast, 2025-2035
- 12.6.4 Volume Forecast, 2025-2035
- 12.6.5 Base-Year Market Share, 2025
- 12.6.6 Segment CAGR and Growth Drivers
- 12.6.7 Subsegment Market Size and Forecast
- 12.6.7.1 Conventional Engine-Driven
- 12.6.7.2 Low-Emission Natural Gas
- 12.6.7.3 Dual-Fuel and Bi-Fuel
- 12.6.7.4 Hybrid Generator-Battery
- 12.6.8 Subsegment Pricing and Adoption Trends
- 12.6.9 Leading Suppliers and Competition
- 12.6.10 Regional Demand and Opportunities
- 12.7 Segment Growth Comparison
- 12.8 Segment Attractiveness and Priority Matrix
Chapter 13 U.S. Generator Sales End-Use and Application Market Outlook
- 13.1 End-Use Industry and Customer Demand Structure
- 13.2 Leading Applications and Customer Groups
- 13.3 End-Use Market Size, Share and Forecast
- 13.4 Major End-Use Industry Deep Dives
- 13.4.1 Customer Requirements and Use Cases
- 13.4.2 Demand and Replacement Cycles
- 13.4.3 Technical and Regulatory Considerations
- 13.4.4 Purchasing and Procurement Models
- 13.4.5 Leading Vendors and Distribution Channels
- 13.4.6 Forecast and Commercial Opportunities
- 13.5 Emerging Applications and Cross-Segment Demand
- 13.6 End-Use Industry Investment Priorities
Chapter 14 U.S. Generator Sales Geographic Market Outlook, 2025-2035
- 14.1 Domestic Market Distribution and Demand Clusters
- 14.2 State- or Province-Wise Market Size and Forecast, 2025-2035
- 14.3 City and Metropolitan Market Outlook
- 14.4 Industrial, Manufacturing and Commercial Clusters
- 14.5 Geographic Concentration of Key End Users
- 14.6 Local Pricing and Purchasing Differences
- 14.7 Domestic Production Facilities and Capacity Map
- 14.8 Local Infrastructure and Project Pipeline
- 14.9 State-Level Policy and Incentive Differences
- 14.10 Subnational Investment Hotspots and Opportunities
- 14.11 Distribution and Logistics Networks
- 14.12 Domestic Competitive Footprint
Chapter 15 U.S. Generator Sales Technology, Innovation and Sustainability Outlook
- 15.1 Technology Landscape and Maturity
- 15.2 Product, Process and Service Innovation
- 15.3 AI, Automation and Digital Tools in the Industry
- 15.4 Technology Adoption and Performance Benchmarking
- 15.5 Innovation Pipeline and R&D Investment
- 15.6 Patent and Intellectual Property Trends
- 15.7 Energy Efficiency and Resource Management
- 15.8 Sustainability, Recycling and Circularity
- 15.9 Technology Roadmap, 2025-2035
- 15.10 Risks of Obsolescence and Technology Substitution
Chapter 16 U.S. Generator Sales Market Key Strategic Imperatives
- 16.1 Growth and Market Entry Priorities
- 16.2 High-Return Products and Segments
- 16.3 Pricing, Profitability and Cost Optimization
- 16.4 Technology Investment and Product Differentiation
- 16.5 Supply Chain Localization and Resilience
- 16.6 Distribution and Customer Acquisition
- 16.7 Partnership, Acquisition and Capacity Strategy
- 16.8 Regional Expansion Priorities
- 16.9 Short-, Medium- and Long-Term Actions
Chapter 17 Competition Outlook
- 17.1 Industry Competition Characteristics
- 17.2 Market Structure and Concentration
- 17.3 Market Share and Competitive Positioning, 2025
- 17.4 Company-Wise Revenue and Product Benchmarking
- 17.5 Production and Service Capacity Benchmarking
- 17.6 Technology, Pricing and Differentiation
- 17.7 Regional Footprint and Distribution Strength
- 17.8 Mergers, Acquisitions and Strategic Alliances
- 17.9 New Entrants and Competitive Threats
- 17.10 Porter's Five Forces and Industry Attractiveness
- 17.11 Competitive Outlook, 2025-2035
Chapter 18 Company Profiles
- 18.1 Company Coverage and Selection Criteria
- 18.2 Generac Holdings Inc.
- 18.2.1 Business Description
- 18.2.2 Company Ownership and Geographic Presence
- 18.2.3 Product and Service Portfolio
- 18.2.4 Manufacturing and Operating Footprint
- 18.2.5 Production Capacity and Expansion Plans
- 18.2.6 Financial Performance and Investment
- 18.2.7 Market Share and Competitive Position
- 18.2.8 Technology and Innovation Capabilities
- 18.2.9 Strategic Alliances or Partnerships
- 18.2.10 Recent Developments
- 18.2.11 Growth Strategy and Outlook
- 18.3 Caterpillar Inc.
- 18.4 Cummins Inc.
- 18.5 Rehlko
- 18.6 Rolls-Royce Power Systems AG
- 18.7 Other Relevant Market Participants
Note: Every listed company is profiled on the structure shown under the first company. The company list is preliminary and may change based on research findings, market developments, data availability and client requirements.
Chapter 19 Disclaimer
- 19.1 Research and Forecast Disclaimer
- 19.2 Data Source and Estimation Limitations
Note: The depth of individual sections depends on data availability for this market. Volume, capacity, trade and other unit-based metrics are included where applicable.

