
New offshore supply keeps output steady as old fields fade
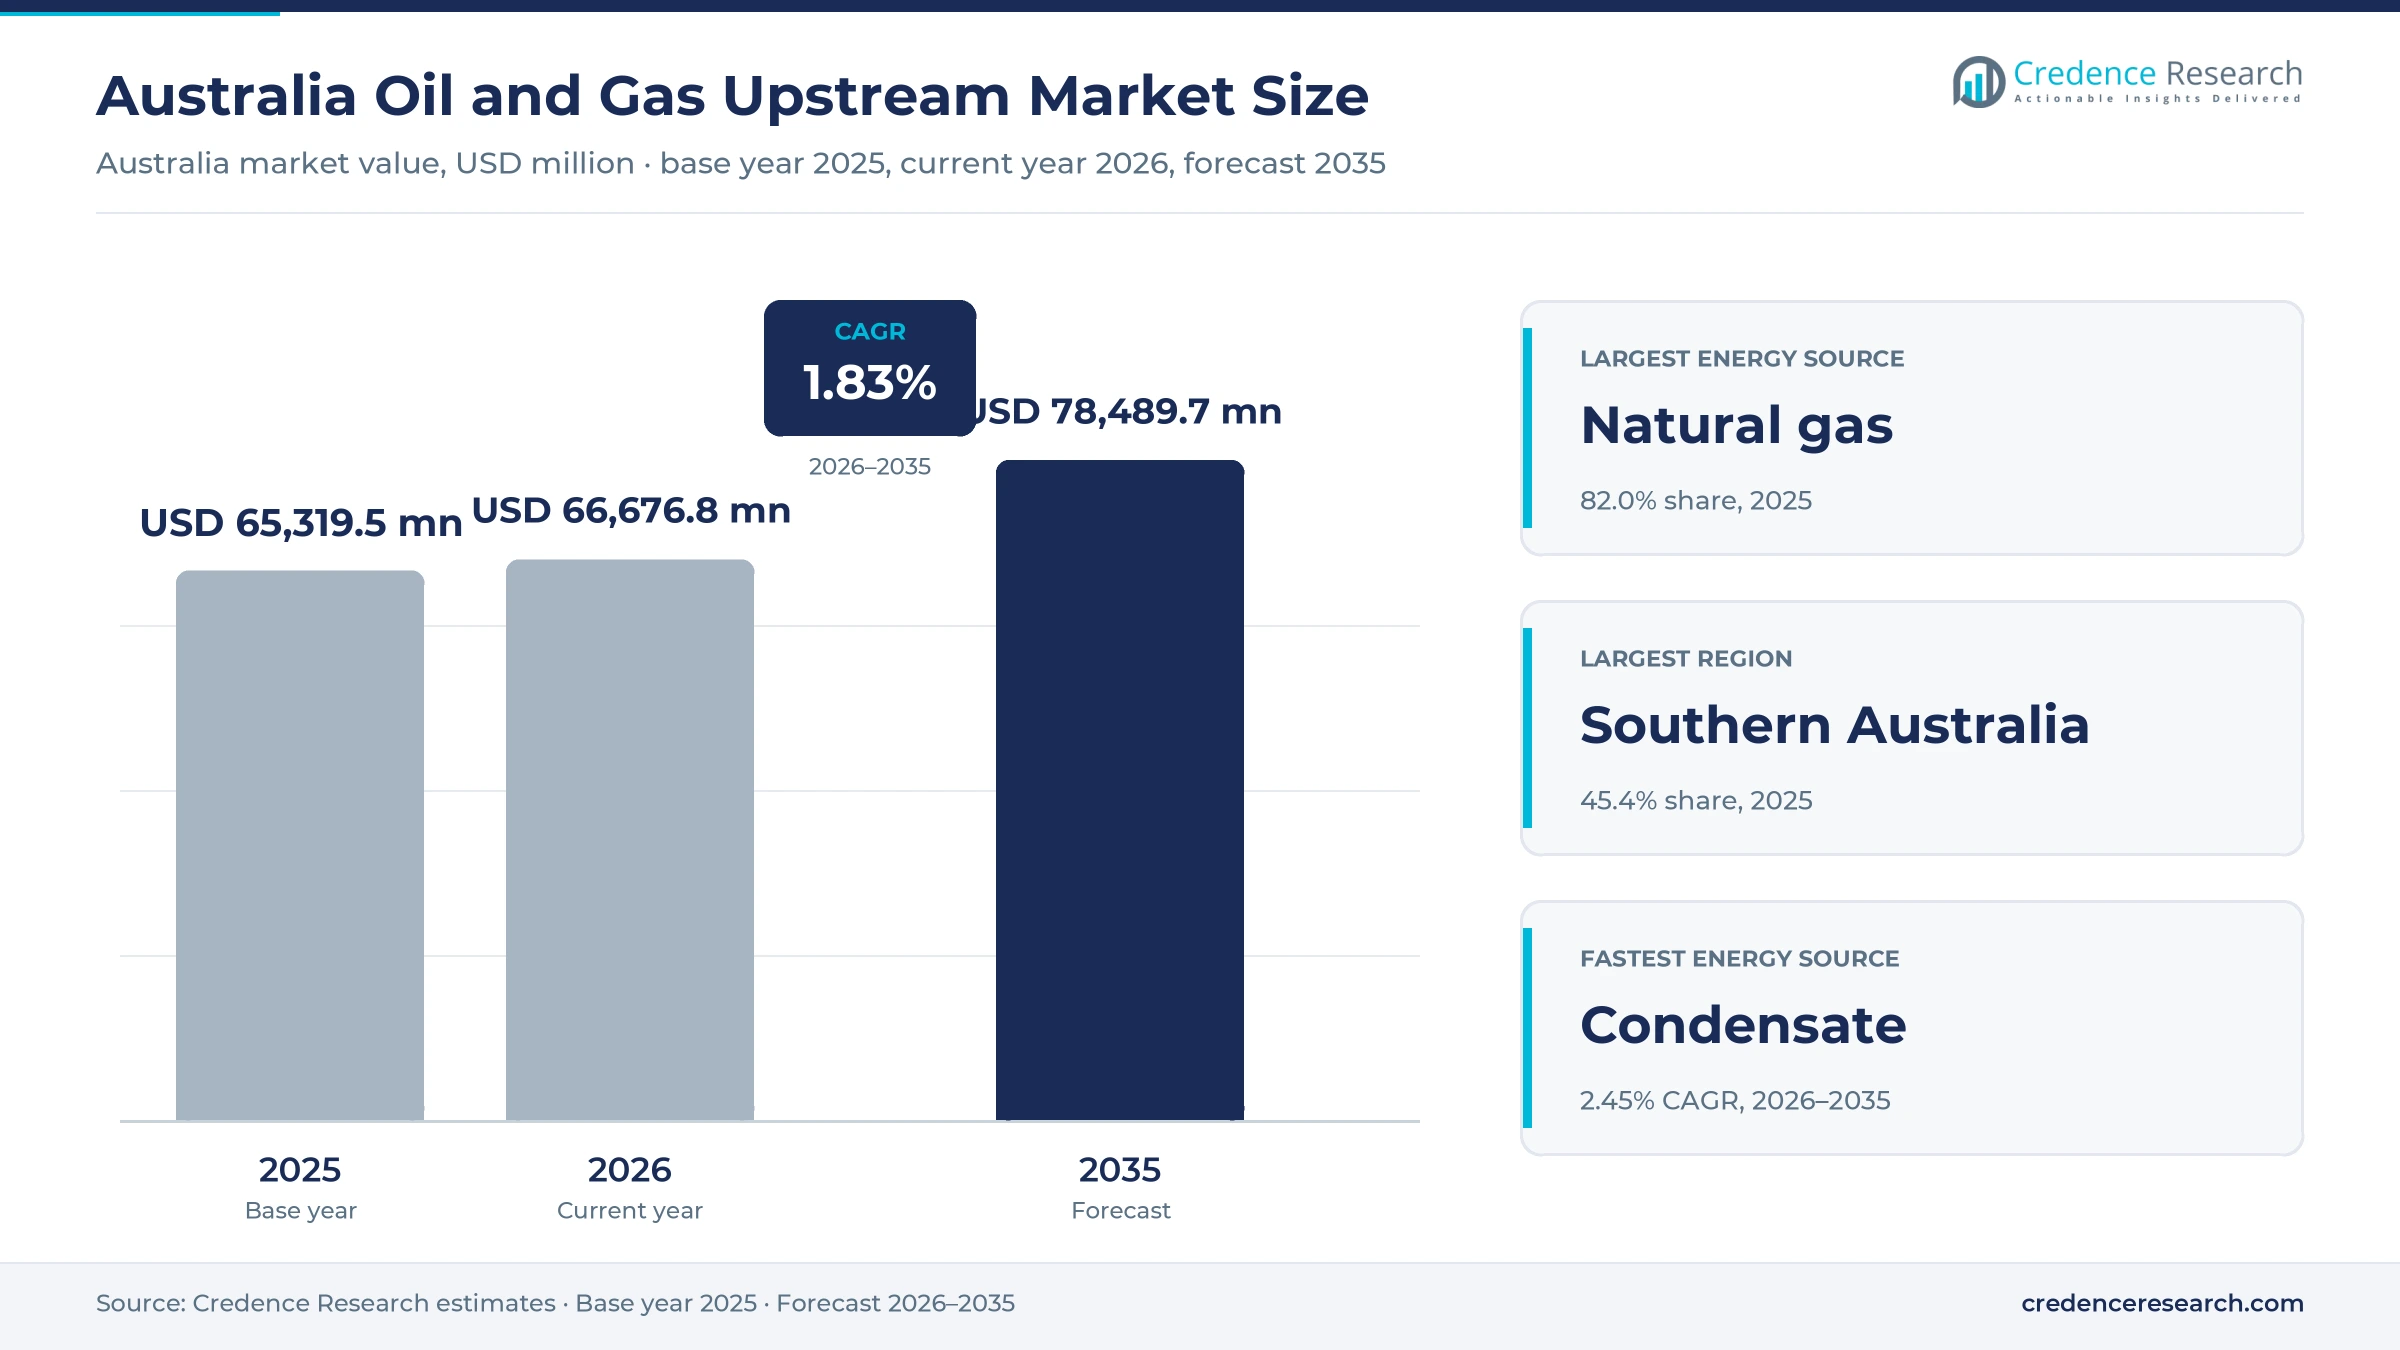
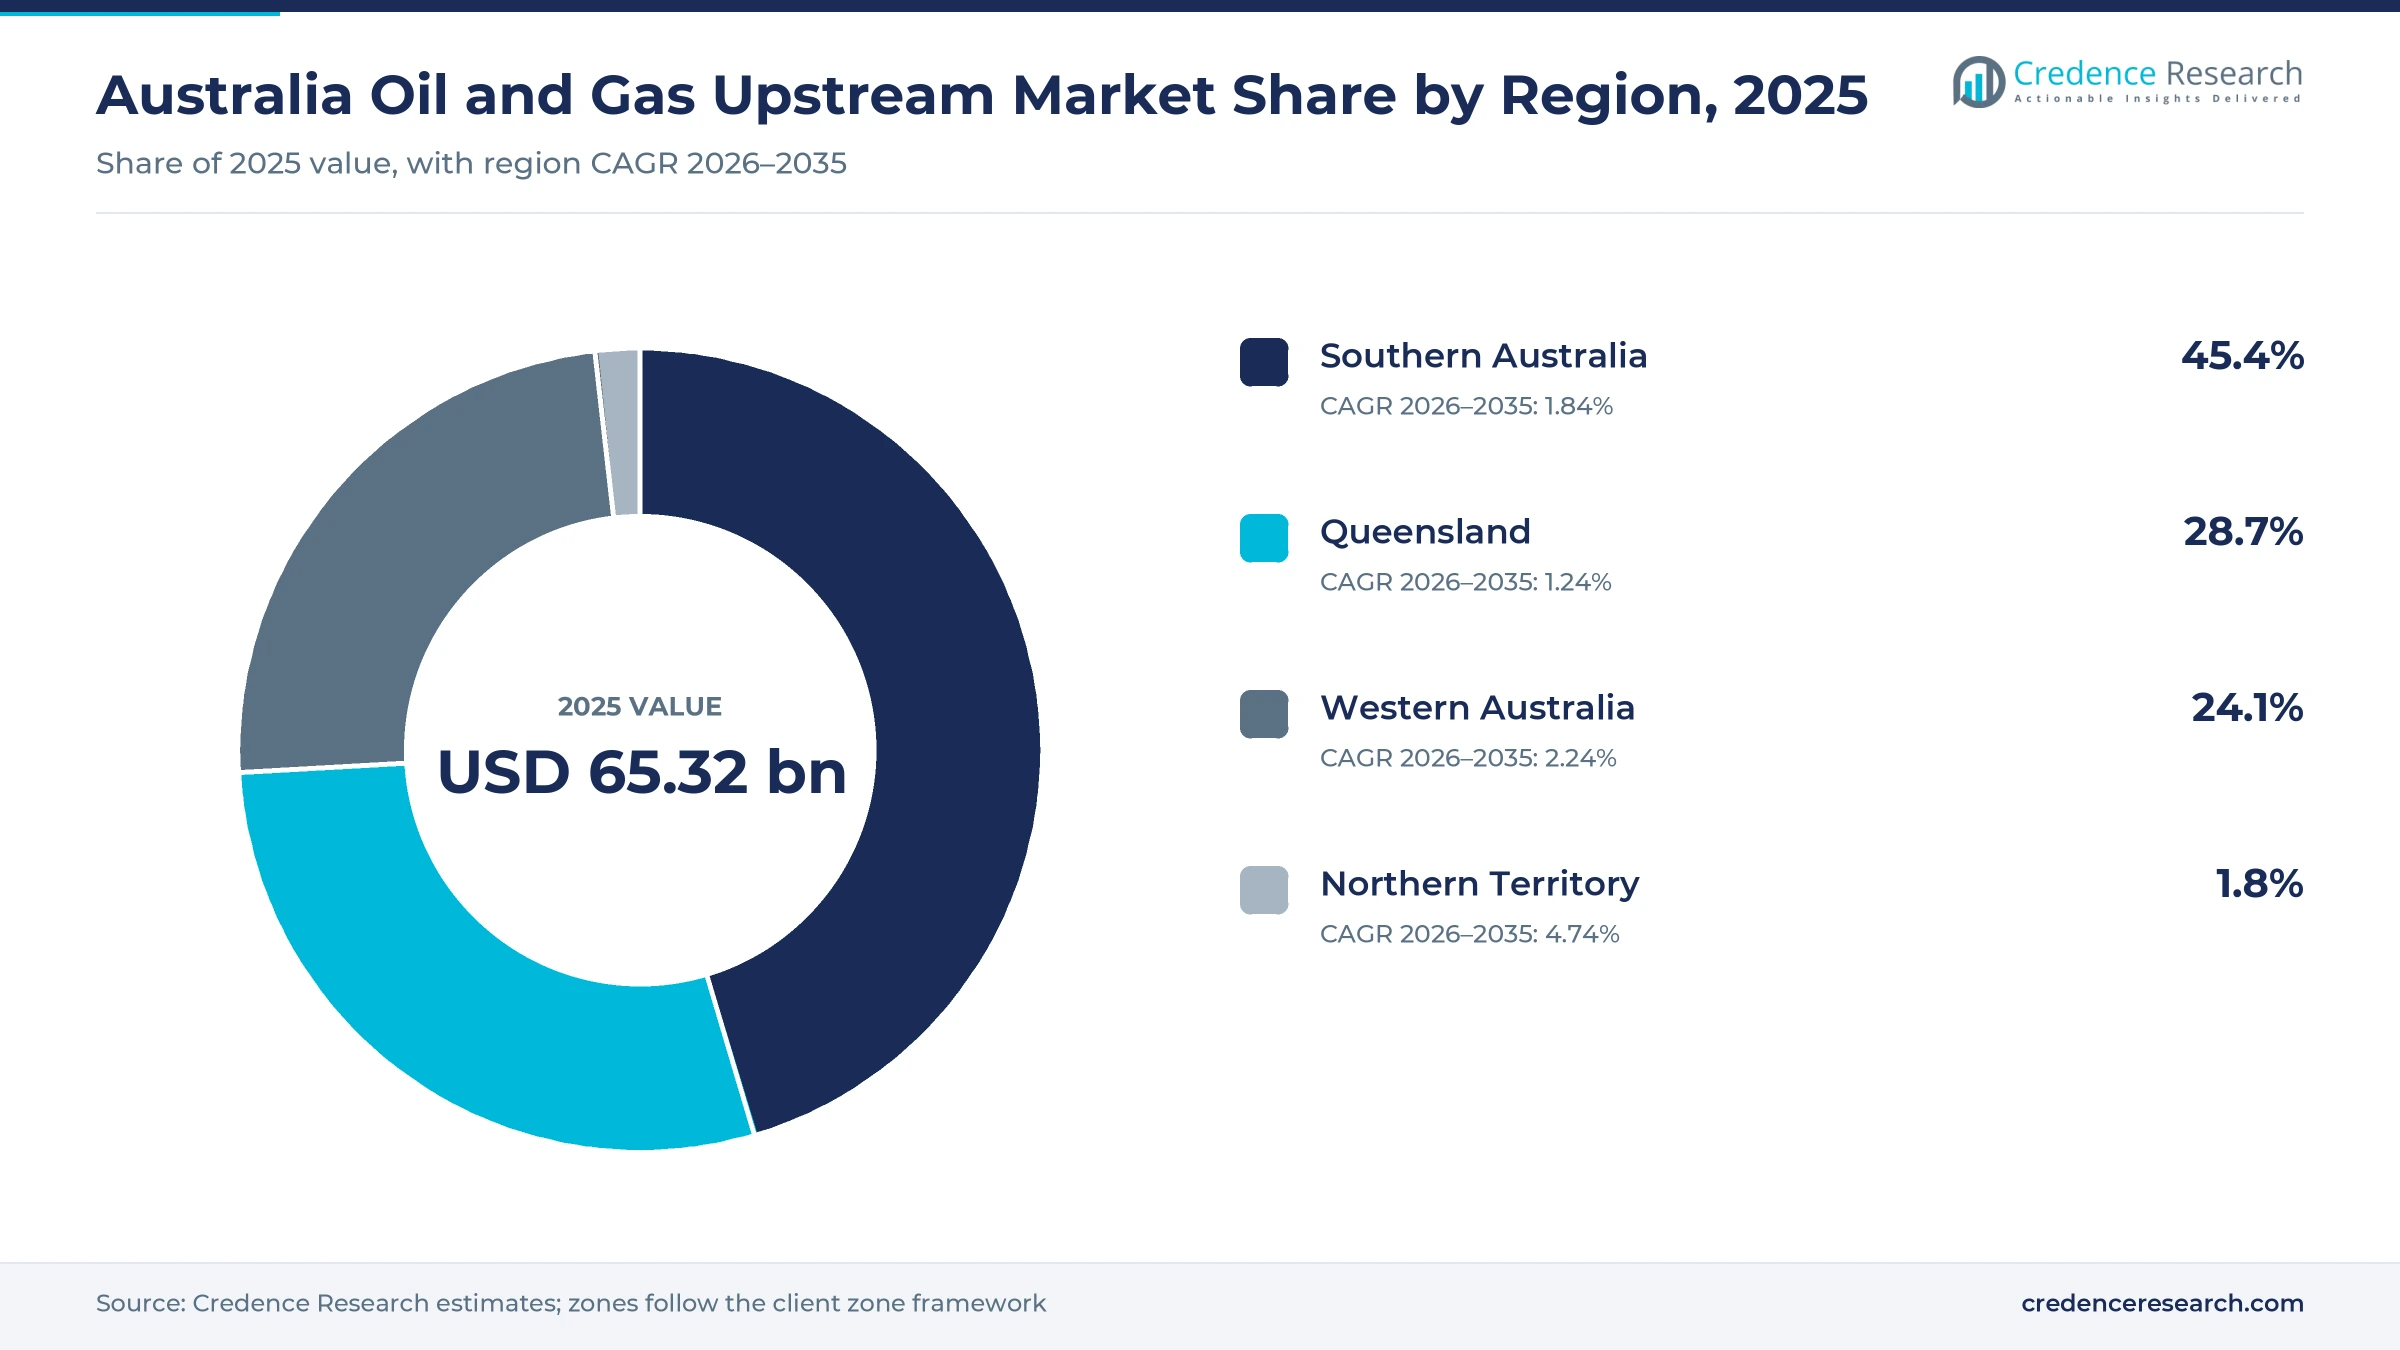
The Australia oil and gas upstream market was valued at USD 65.32 billion in 2025 and is projected to increase from USD 66.68 billion in 2026 to USD 78.49 billion by 2035, registering a CAGR of 1.83% during 2026–2035. Demand comes from long-term LNG contracts with utilities in Japan, China, South Korea and Taiwan, from domestic gas users in Western Australia and on the east coast, and from refiners and traders that buy crude oil, condensate and LPG. Southern Australia held the largest regional share, 45.4% in 2025, because the zone groups the southern states with Commonwealth offshore fields that are not assigned to a state. The Northern Territory is the fastest-growing zone at 4.74% a year during 2026–2035, as Beetaloo Sub-basin gas starts flowing into the Territory network. New offshore supply from Scarborough and Barossa now replaces declining fields, while a federal reservation scheme for east coast gas begins on July 1, 2027.
Which production and zones does this estimate cover?
The estimate counts the value of natural gas, crude oil, condensate and liquefied petroleum gas produced from Australian fields at the first point of sale, including gas that is liquefied at integrated export plants. It covers exploration, development and production by field operators and joint venture partners, with value assigned to the zone in which each field title sits. Refining, retail fuel distribution and pipeline transmission tariffs are left out, because they belong to later stages of the value chain.
Western Australia covers fields held under Western Australian titles, mainly onshore and in state coastal waters, together with supply into the state domestic market. Queensland covers the coal seam gas fields of the Bowen and Surat basins that feed the Gladstone export plants, and the Northern Territory covers onshore areas such as the Beetaloo Sub-basin and Amadeus Basin. Southern Australia groups Victoria, South Australia, New South Wales and Tasmania with Commonwealth offshore fields that are not assigned to a state zone, which explains its large share.
Australia Oil and Gas Upstream Market Insights
- The Australia oil and gas upstream market is projected to grow from USD 66.68 billion in 2026 to USD 78.49 billion by 2035, a CAGR of 1.83%, as new offshore fields replace aging ones.
- Southern Australia held the largest regional share at 45.4% in 2025, because the zone combines the southern basins with Commonwealth offshore fields outside the state zones.
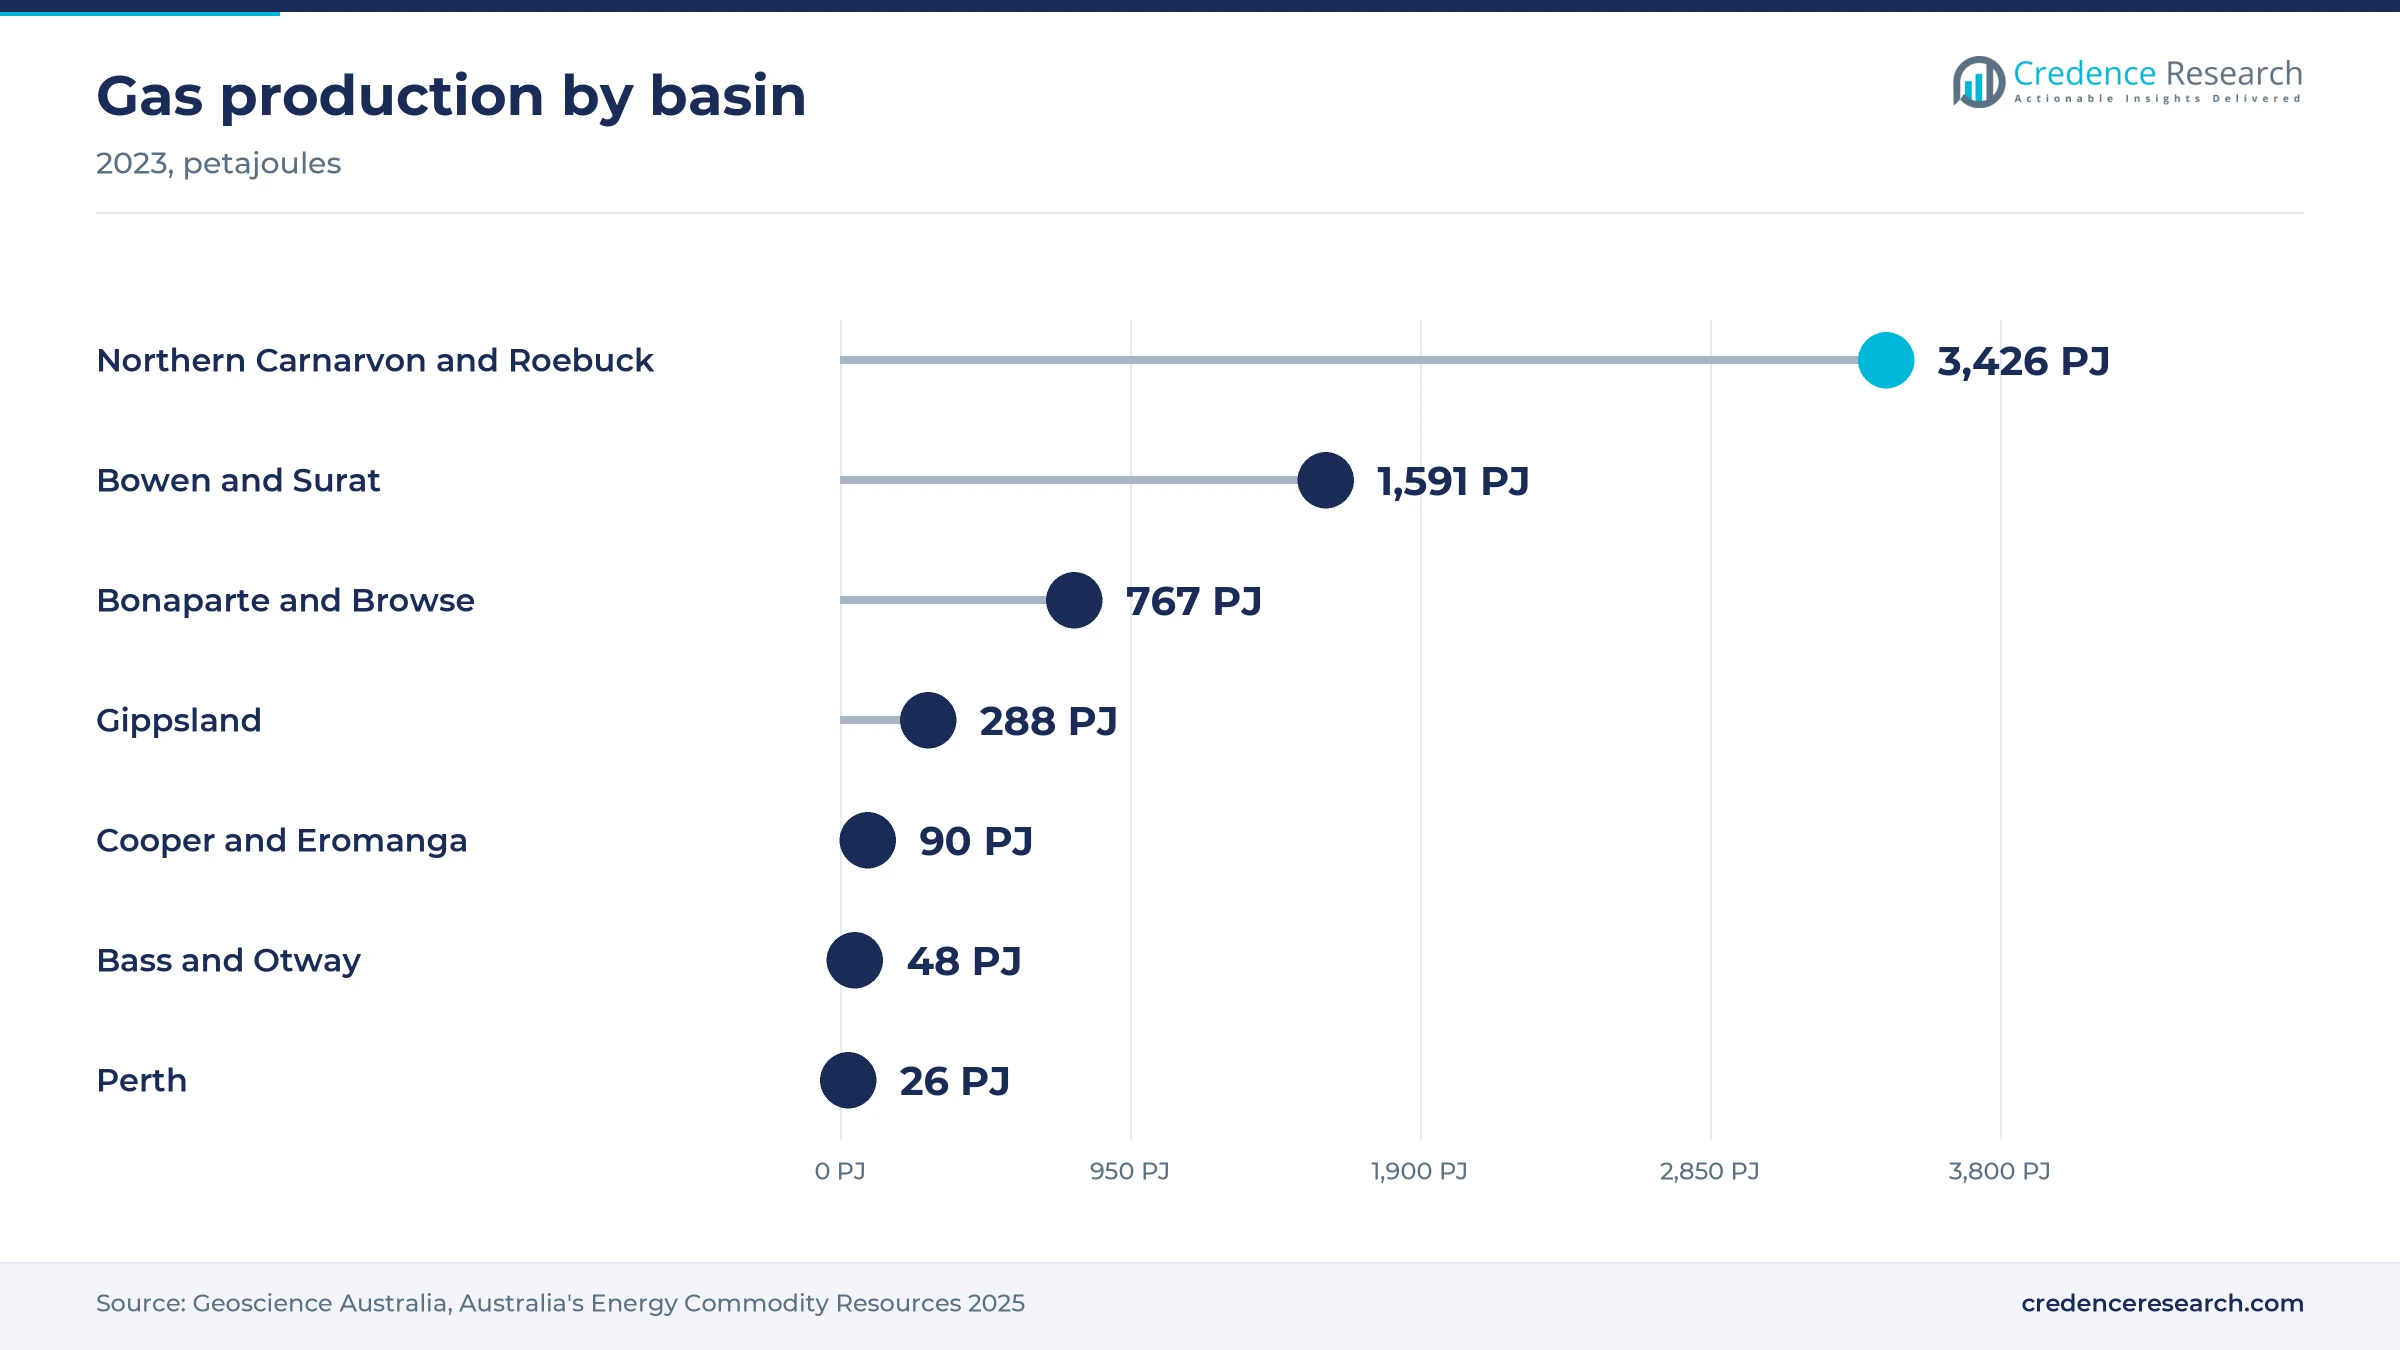
- Natural gas led energy sources with 82.0% of 2025 value, reflecting 6,264 PJ of national gas production in 2023 against much smaller liquids output.
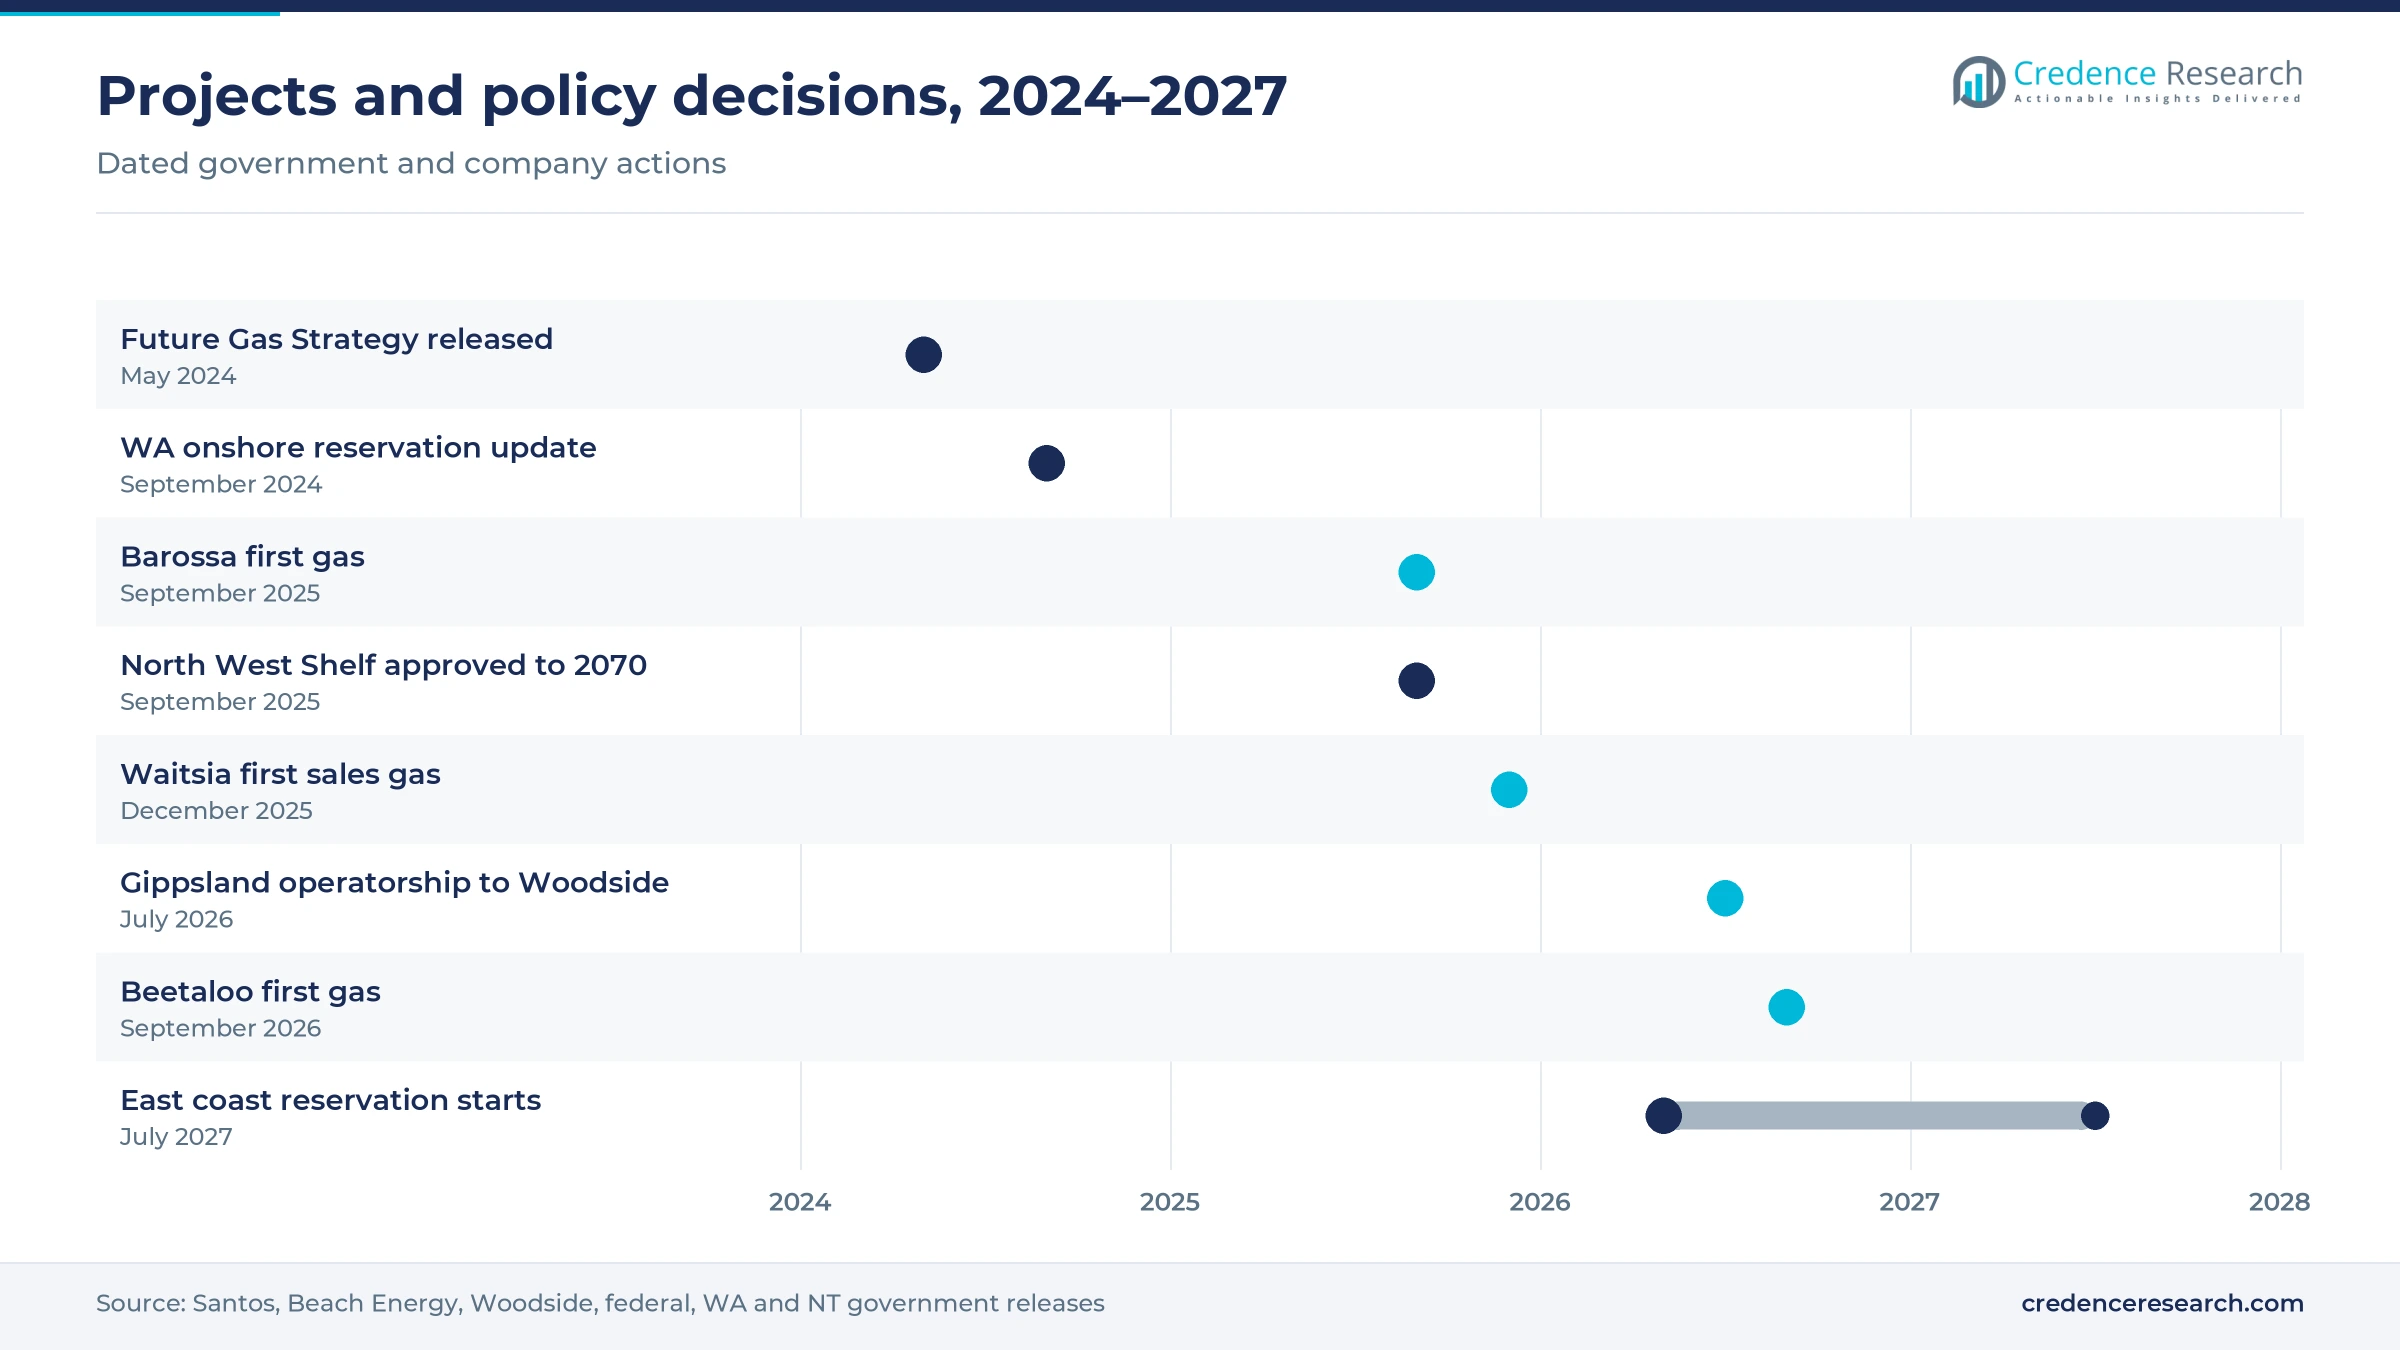
- Santos sent the first Barossa LNG cargo from Darwin to the Sakai terminal in Japan on Jan. 25, 2026, within about six months of the project's planned start date.
- Operator changes are reshaping the industry, with Woodside taking over Gippsland Basin operatorship from ExxonMobil on July 1, 2026.
Natural gas and LNG-linked output dominate value
Why does natural gas carry most upstream value?
Based on energy source, the market is categorized into Natural gas, Crude oil, Condensate and Liquefied petroleum gas. Natural gas led with 82.0% of 2025 value, because large offshore and coal seam gas fields supply both export plants and domestic pipelines. Condensate grows fastest at 2.45% a year, as liquids-rich fields such as Barossa and Ichthys produce condensate alongside gas.
How do buyers use Australian hydrocarbons?
Based on application, the market is categorized into Power generation, Process heat and feedstock, and Liquid fuel conversion. Power generation led with 48.0% of 2025 value, because Asian utilities burn much of the exported gas in power stations. Process heat and feedstock grows fastest at 2.27% a year, as alumina refiners, chemical plants and city gas buyers sign new supply under domestic reservation rules.
Why do LNG buyers dominate upstream sales?
Based on customer type, the market is categorized into Liquefied natural gas buyers, Domestic gas buyers and Liquid hydrocarbon buyers. Liquefied natural gas buyers led with 66.0% of 2025 value, because about 70% of national gas output is exported under long-term contracts. Domestic gas buyers grow fastest at 2.57% a year, as reservation policies in Western Australia and on the east coast direct more gas to local users.
How are upstream projects organized?
Based on value chain stage, the market is categorized into Integrated upstream and liquefied natural gas, Standalone gas extraction and treatment, and Standalone liquids extraction and separation. Integrated upstream and liquefied natural gas led with 72.0% of 2025 value, because most fields are developed to feed a dedicated export plant. Standalone gas extraction and treatment grows fastest at 2.47% a year, as Waitsia and Beetaloo supply domestic pipelines directly.
| Segment Group | Leading Sub-segment | Share, 2025 | Fastest-growing Sub-segment | CAGR, 2026–2035 |
|---|---|---|---|---|
| By Energy Source | Natural gas | 82.0% | Condensate | 2.45% |
| By Application | Power generation | 48.0% | Process heat and feedstock | 2.27% |
| By Customer Type | Liquefied natural gas buyers | 66.0% | Domestic gas buyers | 2.57% |
| By Value Chain Stage | Integrated upstream and liquefied natural gas | 72.0% | Standalone gas extraction and treatment | 2.47% |
Request a Free Sample
Fill in your details and we'll send you a free sample report.
- Sample data tables & charts
- Research methodology
Field replacement and Asian contracts sustain output
New offshore fields replace declining legacy supply
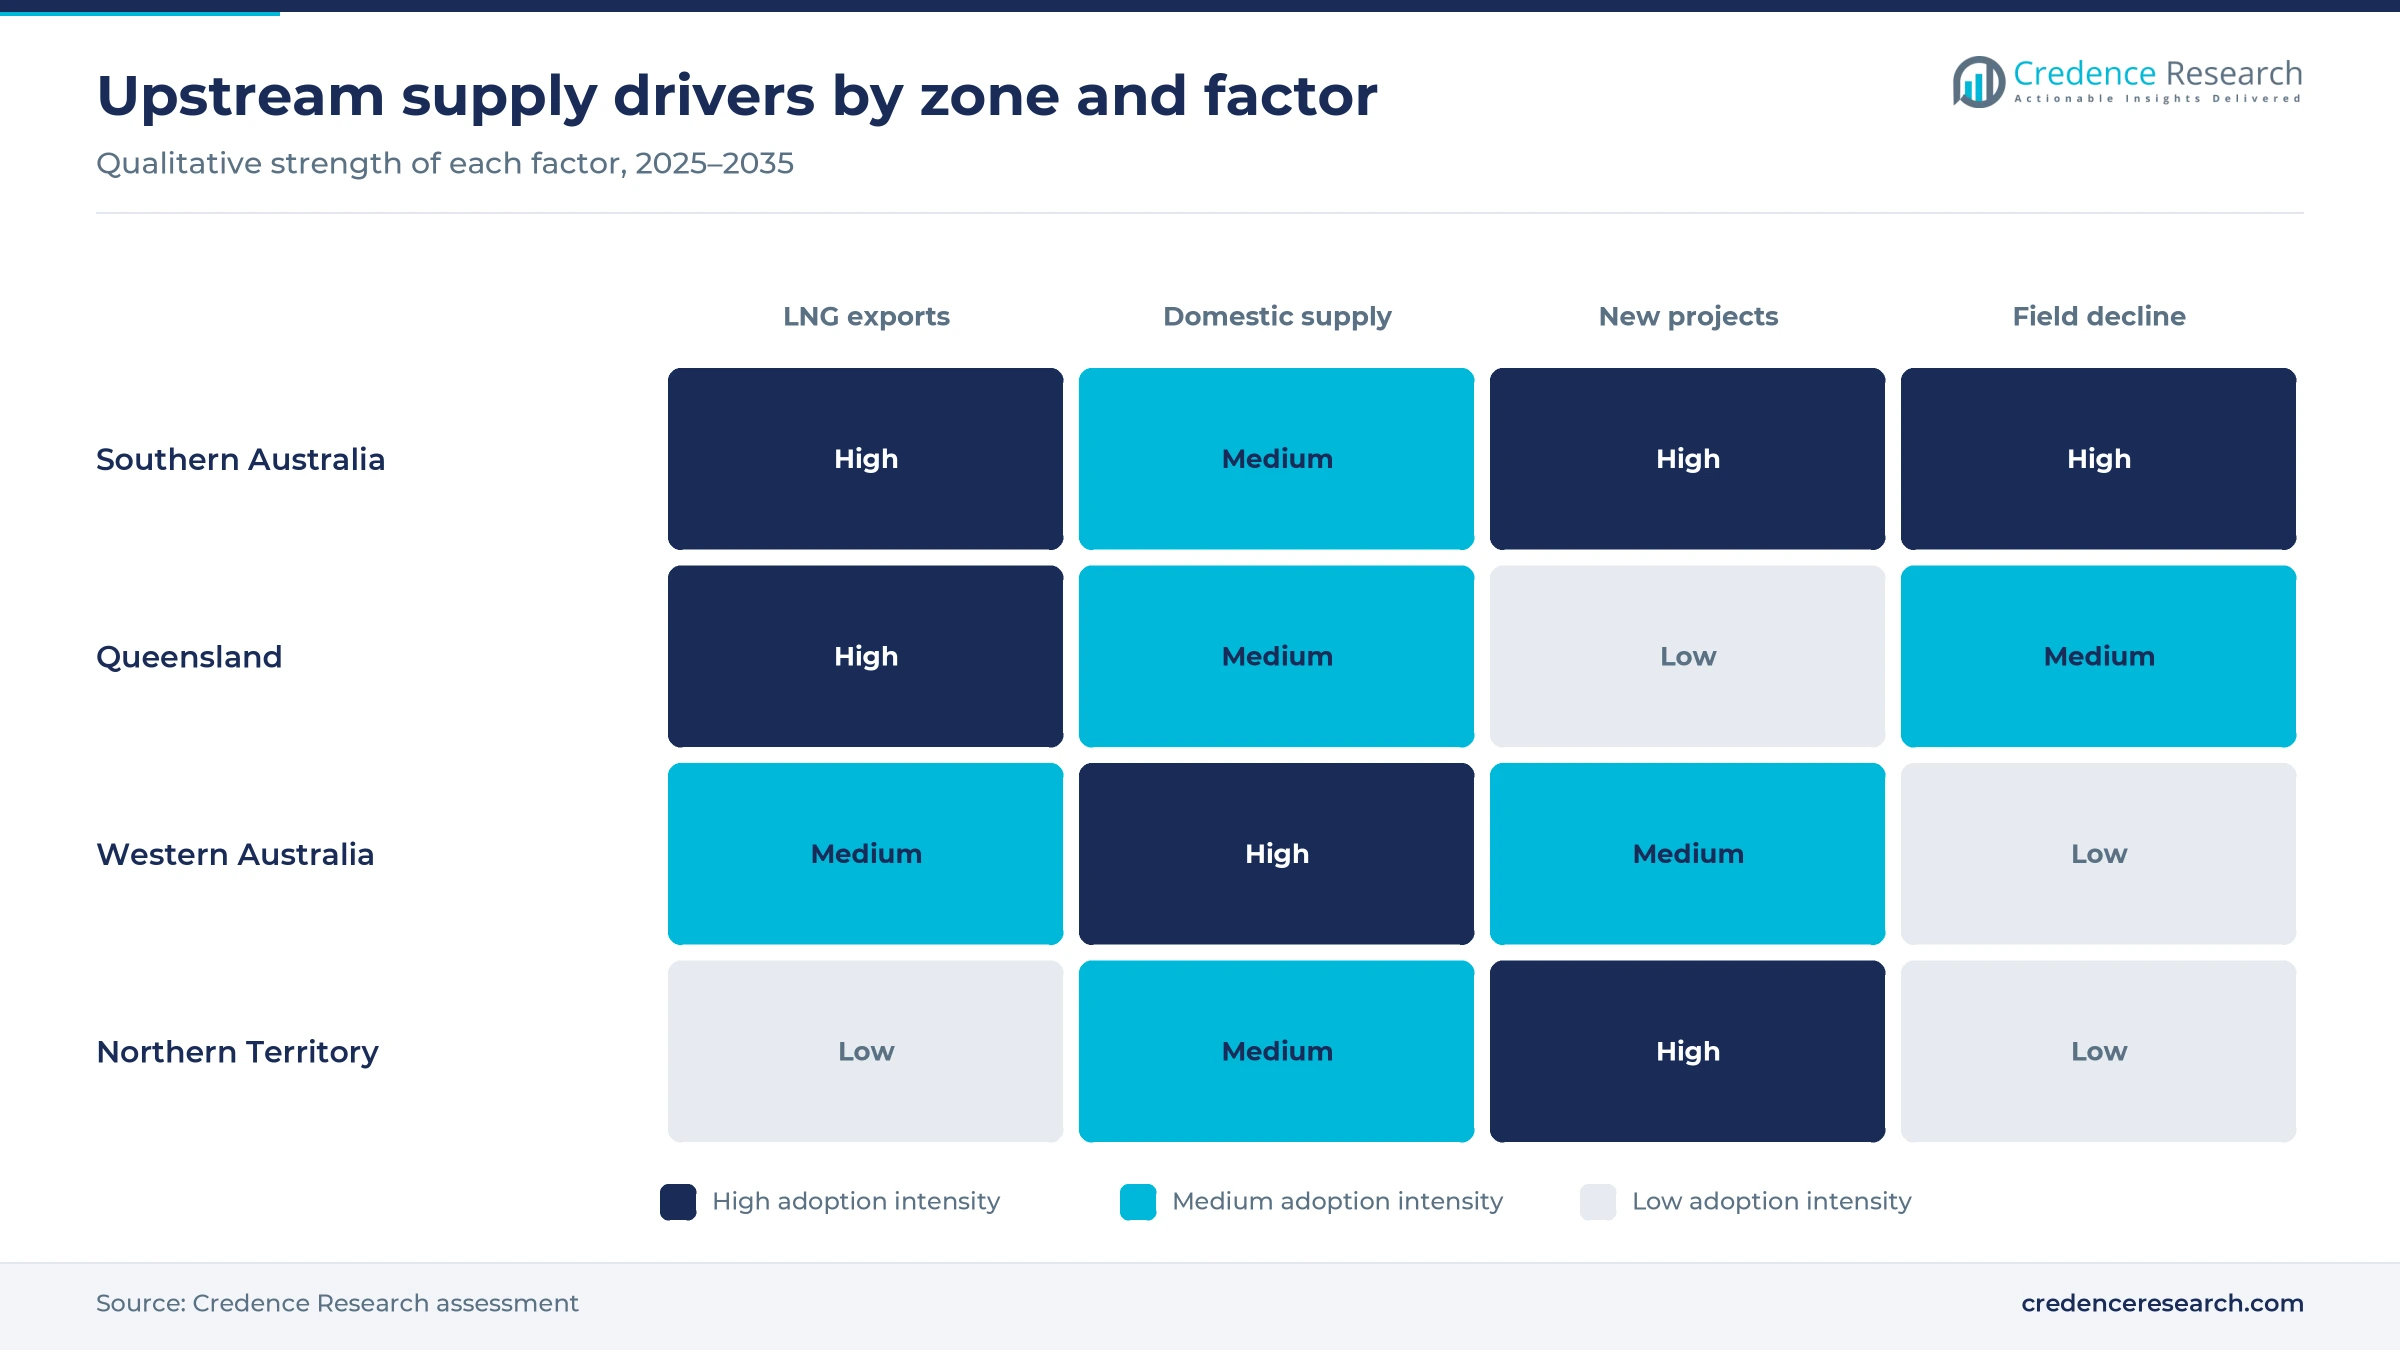
Producers must replace fields that are running down, and most new volume comes from offshore developments tied to existing plants. Australia produced 6,264 PJ of gas in 2023, down 1.5% from 2022, mainly because of lower Bass Strait output, according to Geoscience Australia. On Sept. 22, 2025, Santos reported first gas into the BW Opal floating production unit at Barossa, which will feed Darwin LNG for about two decades. Woodside said Scarborough was 98% complete at the end of June 2026 and on track for its first LNG cargo in the fourth quarter, in its second quarter 2026 report. Chevron's Jansz-Io compression project, worth about US$4 billion, keeps gas flowing to the Gorgon trains. As a result, integrated projects hold 72.0% of 2025 value.
Long-term Asian LNG contracts anchor export volumes
Long-term contracts with utilities in Japan, South Korea, China and Taiwan set the base load for Australian export plants. LNG exports reached 4,388 PJ, or 80.7 Mt, in 2023, and Geoscience Australia ranks the country as the world's third-largest exporter. Global LNG trade rose 5.4% to a record 56.3 billion cubic feet a day in 2025, and Australia remained one of the three largest exporters, according to the U.S. Energy Information Administration. The federal Future Gas Strategy of May 2024 states that demand for Australian LNG will remain strong until 2035 to service existing long-term contracts. Japanese buyers also hold equity, with JERA owning 15.1% of Scarborough and 12.5% of Barossa. These ties keep LNG trade flows stable, so LNG buyers hold 66.0% of 2025 value.
Shortfall risks and outage recovery keep output high
Domestic shortfall warnings and the recovery from storm and flood outages push operators to restore and add supply quickly. AEMO said on March 26, 2026, that production from legacy fields in the southern states is forecast to fall 46% over five years, with supply gaps from 2030 under most weather conditions, in its 2026 Gas Statement of Opportunities. Beach Energy's 250 TJ a day Waitsia gas plant delivered first sales gas on Dec. 6, 2025, and two Waitsia LNG cargoes were lifted in the December 2025 quarter. Woodside reported that the Wheatstone outage caused by Cyclone Narelle was repaired in April 2026, while Santos and Beach restored most flood-affected Cooper Basin wells by the end of 2025. Standalone gas extraction and treatment therefore grows fastest at 2.47% a year.
Liquids-rich gas fields sustain condensate value
Condensate from large gas fields now carries more liquids value than crude oil from conventional oilfields. Geoscience Australia data show 397 PJ of condensate output in 2023, against 182 PJ of crude oil, after crude production fell 22% in a single year. The INPEX-operated Ichthys project produces more than 100,000 barrels of condensate a day at peak and about 1.65 million tons of LPG a year, according to INPEX Australia. The Barossa floating unit can handle 11,000 barrels of condensate a day alongside 850 million cubic feet of gas, according to Santos. These streams also feed regional LPG supply chains, which is why condensate grows fastest among energy sources at 2.45% a year.
Reservation rules and onshore gas reshape supply
Rising reservation rules shift more gas to local buyers
Governments are steadily raising the share of gas that exporters must offer to Australian users before shipping it abroad. Federal ministers announced in May 2026 that LNG exporters must reserve 20% of east coast exports for the domestic market from July 1, 2027, applying to prospective contracts and the spot market, according to Resources Minister Madeleine King. Western Australia updated its policy on Sept. 19, 2024, so that new onshore projects reserve 80% of output until Dec. 31, 2030, and all of it from 2031. Woodside also agreed to sell 31.1 PJ to Alcoa over 2027 to 2030. These moves explain why domestic gas buyers grow fastest among customer types at 2.57% a year.
Onshore basins emerge as new domestic supply
Onshore basins are emerging as a second source of domestic gas as offshore fields in the south decline. Gas from Tamboran Resources' Shenandoah South project began flowing into the Northern Territory network on Sept. 1, 2026, at more than 40 TJ a day through APA's Sturt Plateau Pipeline, according to the Northern Territory Government. In the Perth Basin, the Waitsia plant reached a peak rate of 165 TJ a day after December 2025, according to Beach Energy. In Queensland, Australia Pacific LNG drilled 82 operated development wells in fiscal 2026 to hold coal seam gas output. As a result, the Northern Territory becomes the fastest-growing zone, although from a very small base.
Life extensions open brownfield backfill opportunities
Approved life extensions create an opening for backfill wells and tie-backs that use existing platforms and plants. The North West Shelf plant received final federal approval to operate until 2070 in September 2025, with 48 conditions including a 60% cut in nitrogen oxide emissions within five years, according to Baird Maritime. Woodside approved a rig contract for Greater Western Flank Phase 4, with drilling targeted for 2027 and production for 2028, and targeted Julimar Phase 3 start-up for the second half of 2026. Turrum Phase 3 in Bass Strait is aimed at first production in the first half of 2027. Each campaign needs offshore support vessels, subsea crews and drilling rigs.
Asset swaps give focused operators room to invest
Portfolio swaps between the largest producers give each operator control of assets it plans to develop, which opens room for faster investment decisions. In July 2025, Chevron agreed to take Woodside's 13% Wheatstone interest and a 65% operated stake in Julimar-Brunello, while Woodside takes Chevron's 16.67% North West Shelf interest, according to GIIGNL. Woodside reported that the swap remains targeted for completion in the fourth quarter of 2026. Operatorship of the Gippsland Basin assets passed from ExxonMobil to Woodside on July 1, 2026, and the Browse project received State Significant Project status in Western Australia during the same quarter.
Field decline, cyclones and approvals test producers
Crude oil output is falling quickly
The main risk for liquids producers is that domestic crude oil production continues to decline rapidly, and Geoscience Australia projects that it could cease within seven years without new commercial discoveries. Australia imported about 90% of its oil requirements in 2023, so falling crude output does not reduce local fuel demand. Producers of crude oil therefore face shrinking volumes, and the segment records the slowest growth. Operators respond by focusing on condensate from gas fields and on low-cost infill drilling.
Cyclones and equipment defects interrupt production
Weather is a constant risk because most offshore fields sit in a cyclone belt, so storms and equipment faults can halt output for weeks. Woodside reported in July 2026 that the Okha floating unit had a subsea mooring defect with production yet to resume, while the Pyrenees unit only partly restarted after cyclone damage. Wheatstone was also shut by Cyclone Narelle before repairs in April 2026. Operators answer with storm-hardened moorings, spare parts held locally and stronger maintenance planning.
Long approvals delay new supply
Environmental and heritage approvals are a barrier because they can take years, which delays new supply and raises financing costs. The North West Shelf extension took about seven years to approve and carries conditions that require deep nitrogen oxide cuts by 2061. Developers of new fields face similar reviews, offshore and onshore. These delays affect operators and contractors alike, and companies now plan more time for consultation and emissions control in their project schedules.
Softer LNG and oil prices squeeze margins
Price pressure is rising because lower oil prices feed into oil-linked LNG contract prices, which reduces the value of each cargo. The Department of Industry, Science and Resources forecast in September 2025 that LNG export earnings would fall from A$65 billion in 2024–25 to A$48 billion by 2026–27, while oil export values fall from A$12.5 billion to A$7.1 billion. Producers respond by deferring marginal wells and focusing capital on low-cost backfill, which slows value growth.
Southern Australia leads while Beetaloo lifts the territory
| Region | Value, 2025 (USD billion) | Share, 2025 | CAGR, 2026–2035 |
|---|---|---|---|
| Southern Australia | 29.66 | 45.4% | 1.84% |
| Queensland | 18.75 | 28.7% | 1.24% |
| Western Australia | 15.74 | 24.1% | 2.24% |
| Northern Territory | 1.18 | 1.8% | 4.74% |
Southern basins and offshore fields anchor the largest zone
Southern Australia held a 45.4% share of 2025 value and grows at 1.84% a year, close to the national rate. The zone groups the Gippsland, Otway and Cooper basins with Commonwealth offshore fields such as Scarborough, Ichthys and Barossa that are not assigned to a state zone. Southern basin output is falling, and AEMO expects Victorian annual gas production to drop 52.8% by 2030. New offshore fields such as Scarborough and Barossa offset much of this decline across the zone.
Queensland coal seam gas feeds three Gladstone plants
Queensland held a 28.7% share of 2025 value and grows at 1.24% a year, the slowest zone rate. The Bowen and Surat basins produced 1,591 PJ of coal seam gas in 2023, which supplies the GLNG, Australia Pacific LNG and QCLNG plants on Curtis Island. Australia Pacific LNG produced 668 PJ in fiscal 2026 and shipped 137 cargoes, according to Origin Energy. Its fiscal 2027 guidance of 625 to 670 PJ reflects natural field decline, which requires steady drilling to hold output.
Western Australia gains from onshore and domestic supply
Western Australia held a 24.1% share of 2025 value and grows at 2.24% a year, above the national rate. The zone covers fields under state titles, mainly in the Perth Basin and coastal waters, together with supply into the state domestic market. Beach Energy's Waitsia plant in the Perth Basin began selling gas into the state market in December 2025. Woodside reported realized pipeline gas prices of A$6.9 per GJ in Western Australia during the June 2026 quarter, against A$15.7 per GJ on the east coast.
Northern Territory grows fastest from a small base
The Northern Territory held a 1.8% share of 2025 value and grows fastest at 4.74% a year. The zone covers onshore fields, and Beetaloo gas from Tamboran Resources now supplies the Territory network through APA's Sturt Plateau Pipeline. Darwin also hosts the Ichthys and Barossa LNG plants, but the fields that feed them sit in Commonwealth waters and are counted in Southern Australia. The 890 km Ichthys export pipeline links the Browse Basin field to Darwin.
Start-ups, approvals and policy moves since 2025
| Development | Status and market relevance |
|---|---|
| In September 2025, Santos achieved first gas at the Barossa field, which supplies Darwin LNG. | Producing; first LNG cargo shipped to Japan in January 2026 |
| In September 2025, the federal government gave final approval for the North West Shelf plant to run until 2070. | Approved; 48 conditions, including nitrogen oxide cuts |
| In December 2025, Beach Energy delivered first sales gas from the Waitsia gas plant in the Perth Basin. | Ramping up; peak of 165 TJ a day reached after the quarter |
| In May 2026, federal ministers announced a 20% east coast gas reservation scheme starting July 1, 2027. | Announced; applies to prospective contracts and the spot market |
| In September 2026, Tamboran Resources began Beetaloo gas supply into the Northern Territory network. | Producing; more than 40 TJ a day through the Sturt Plateau Pipeline |
Subsea compression and floating units extend fields
- Subsea compression boosts pressure from aging reservoirs, and the Jansz-Io project uses 6,500 tons of subsea compression equipment controlled from a 27,000-ton floating station.
- Floating production units process gas and condensate at the field, with the BW Opal unit at Barossa able to handle 850 million cubic feet of gas a day.
- Floating LNG lets operators liquefy gas at sea, and floating liquefaction units avoid long export pipelines for remote fields.
- Coal seam gas wells are drilled in large numbers, with Australia Pacific LNG commissioning 92 wells in fiscal 2026 to offset decline.
Need a Custom Version of This Report?
Tailor the scope, geography, or segments to your exact requirements.
- Custom geography or segment scope
- Direct access to our analyst team
LNG operators and domestic suppliers compete for gas
Competition centers on access to reserves, spare capacity in existing LNG plants and the ability to supply domestic buyers under reservation rules. Woodside Energy Group operates Pluto, the North West Shelf and Scarborough and has taken over Gippsland Basin operatorship. Chevron Australia operates Gorgon and Wheatstone, where ExxonMobil Australia and Shell Australia are Gorgon partners. INPEX Australia operates the Ichthys project off Western Australia, with TotalEnergies Australia holding a 26% interest. On the east coast, Santos operates GLNG, Shell Australia operates QCLNG, and ConocoPhillips Australia leads Australia Pacific LNG with Origin Energy running its upstream fields. Beach Energy supplies the Otway, Cooper and Perth basin markets. Contractors that supply drilling, subsea work and drilling waste services compete for backfill campaigns.
Companies profiled and their roles in this market
| Company | Type | Role in the market |
|---|---|---|
| Woodside Energy Group | Operator | Operates Pluto, North West Shelf and Scarborough; Gippsland operator from July 2026 |
| Chevron Australia | Operator | Operates Gorgon and Wheatstone; building the Jansz-Io compression project |
| Shell Australia | Operator and partner | Operates QCLNG on Curtis Island and holds 25% of Gorgon |
| INPEX Australia | Operator | Operates Ichthys with a 67.82% interest and Darwin onshore plant |
| Santos | Operator | Operates Barossa and GLNG; first Barossa cargo in January 2026 |
| ExxonMobil Australia | Partner | Holds 25% of Gorgon; passed Gippsland operatorship to Woodside |
| ConocoPhillips Australia | LNG operator | Leads Australia Pacific LNG on Curtis Island |
| TotalEnergies Australia | Partner | Holds 26% of the Ichthys project |
| Origin Energy | Upstream operator | Runs Australia Pacific LNG coal seam gas fields; 668 PJ in fiscal 2026 |
| Beach Energy | Domestic supplier | Operates the 250 TJ a day Waitsia plant and Otway gas plant |
Credence Research view on upstream supply to 2035
Credence Research's view is that the Australia oil and gas upstream market will grow slowly but steadily, because new offshore fields are replacing declining ones rather than adding large net volumes. Scarborough, Barossa and backfill campaigns keep export plants full, while long-term Asian contracts protect most of the value. Domestic reservation rules in Western Australia and on the east coast will shift a larger share of new supply to local buyers. Power generation remains the largest application with 48.0% of 2025 value, because Asian utilities burn most exported cargoes in power stations. Operators with spare plant capacity, low-cost backfill options and onshore acreage are best placed, while crude oil producers face steady decline.
How the zone and segment estimates were built
The report uses 2025 as the base year on a calendar basis, and market values come from the Credence Research model. That model draws on Geoscience Australia production and reserves data, Australian Energy Market Operator outlooks, Department of Industry, Science and Resources forecasts, U.S. Energy Information Administration trade data, state and territory government releases and company stock exchange reports. Zone shares follow the client zone framework, and segment splits are Credence Research estimates guided by production by product, with no interviews or surveys used in the analysis.
Replacement projects hold output steady to 2035
The Australia oil and gas upstream market is expected to reach USD 78.49 billion by 2035, rising at a 1.83% CAGR during 2026–2035, as Scarborough, Barossa and backfill wells replace output from mature fields. Natural gas keeps the largest share, while condensate grows fastest among energy sources. Southern Australia stays the largest zone, and the Northern Territory grows fastest as Beetaloo production expands. Queensland, with 28.7% of 2025 value, depends on steady coal seam gas drilling to offset natural decline at existing fields. Domestic reservation from July 2027 will raise the share of gas sold to local buyers, while crude oil output continues to fall over the forecast period.
Frequently Asked Questions
How big is the Australia oil and gas upstream market?
Which energy source holds the largest share?
Which region holds the largest share of value?
Which region grows fastest?
Why do LNG buyers dominate upstream sales?
How will the east coast reservation scheme affect producers?
Which projects add new supply during the forecast period?
Which companies are active in the Australia oil and gas upstream market?
Table of Content
Chapter 1 Market Segmentation
- 1.1 Segmentation Framework
- 1.1.1 Product and Service Classification
- 1.1.2 Application and End-Use Classification
- 1.1.3 Technology and Solution Classification
- 1.1.4 Customer and Distribution Channel Classification
- 1.1.5 Geographic Segmentation
- 1.1.6 Market Segment Definitions and Boundaries
- 1.2 By Energy Source
- 1.2.1 Natural gas
- 1.2.2 Crude oil
- 1.2.3 Condensate
- 1.2.4 Liquefied petroleum gas
- 1.3 By Application
- 1.3.1 Power generation
- 1.3.2 Process heat and feedstock
- 1.3.3 Liquid fuel conversion
- 1.4 By Customer Type
- 1.4.1 Liquefied natural gas buyers
- 1.4.2 Domestic gas buyers
- 1.4.3 Liquid hydrocarbon buyers
- 1.5 By Value Chain Stage
- 1.5.1 Integrated upstream and liquefied natural gas
- 1.5.2 Standalone gas extraction and treatment
- 1.5.3 Standalone liquids extraction and separation
Chapter 2 Introduction
- 2.1 Report Objectives and Scope
- 2.2 Product Definition and Industry Terminology
- 2.3 Market Inclusions and Exclusions
- 2.4 Research Process
- 2.4.1 Primary Research and Expert Interviews
- 2.4.2 Secondary Research and Source Review
- 2.4.3 Top-Down and Bottom-Up Estimation
- 2.4.4 Data Triangulation and Verification
- 2.5 Market Size Measurement Basis
- 2.5.1 2025: USD 65.32 billion → 2035: USD 78.49 billion
- 2.6 Historical and Forecast Reference Periods
- 2.6.1 Historical Period: 2018-2025
- 2.6.2 Base Year: 2025
- 2.6.3 Forecast Period: 2025-2035
- 2.7 Research Assumptions and Limitations
Chapter 3 Executive Summary
- 3.1 Market Snapshot and Key Findings
- 3.2 Base-Year Market Size, 2025
- 3.3 Forecast Market Size, 2035
- 3.4 Revenue and Volume Growth Outlook
- 3.5 Key Demand and Supply Indicators
- 3.6 Leading Market Segments
- 3.7 Fastest-Growing Market Opportunities
- 3.8 Regional Performance Highlights
- 3.9 Technology and Industry Transformation
- 3.10 Competitive Landscape Summary
- 3.11 Analyst View and Strategic Implications
Chapter 4 Australia Oil and Gas Upstream Market Trends and Developments
- 4.1 Historical Industry Development, 2018-2025
- 4.2 Recent Market Trends and Developments
- 4.3 Demand and Customer Behavior Trends
- 4.4 Technology and Product Innovation
- 4.5 Artificial Intelligence, Automation and Digitalization
- 4.6 Local Manufacturing and Supply Chain Realignment
- 4.7 Industry Partnerships, Mergers and Acquisitions
- 4.8 Sustainability and Circular Economy Developments
- 4.9 Government and Private Sector Investment Trends
- 4.10 Emerging Business Models and Commercialization
- 4.11 Industry Developments and Announcements
Chapter 5 Australia Oil and Gas Upstream Market Production, Supply and Demand Analysis
- 5.1 Demand Trend and Consumption Analysis, 2018-2025
- 5.2 Demand Forecast, 2025-2035
- 5.3 Production and Output Trend, 2018-2025
- 5.4 Production and Output Forecast, 2025-2035
- 5.5 Installed Capacity and Capacity Utilization
- 5.6 Company-Wise Production Plants and Statistics
- 5.6.1 Installed Production Capacity
- 5.6.2 Actual Production
- 5.6.3 Planned Capacity and Expansion Targets
- 5.7 Supply Chain Structure and Procurement Trends
- 5.8 Supply-Demand Gap and Bottlenecks
- 5.9 Import Dependence and Sourcing Structure
- 5.10 Contract Manufacturing and Outsourcing
- 5.11 Regional Supply and Demand Concentration
Chapter 6 Australia Oil and Gas Upstream Market Pricing Analysis
- 6.1 Pricing Structure and Measurement
- 6.2 Historical Pricing Trends, 2018-2025
- 6.3 Pricing Outlook, 2025-2035
- 6.4 Average Selling Price and Unit Economics
- 6.5 Pricing by Product and Market Segment
- 6.6 Geographic Pricing Differences
- 6.7 Key Input, Energy, Labor and Logistics Costs
- 6.8 Contract Pricing and Purchasing Models
- 6.9 Pricing Sensitivity and Competitive Positioning
- 6.10 Price, Margin and Profitability Implications
Chapter 7 Australia Oil and Gas Upstream Market Dynamics
- 7.1 Market Growth Drivers
- 7.1.1 Demand-Side Drivers
- 7.1.2 Technology and Innovation Drivers
- 7.1.3 Infrastructure and Investment Drivers
- 7.1.4 Regulatory and Policy Drivers
- 7.2 Market Restraints
- 7.2.1 Cost and Affordability Constraints
- 7.2.2 Technology and Adoption Barriers
- 7.2.3 Supply Chain and Operational Constraints
- 7.3 Market Challenges
- 7.3.1 Competitive Pressure and Margin Erosion
- 7.3.2 Skills, Infrastructure and Implementation Gaps
- 7.4 Emerging Market Opportunities
- 7.5 Market Dynamics Impact and Time-Horizon Assessment
Chapter 8 Australia Oil and Gas Upstream Value Chain Analysis
- 8.1 Industry Value Chain Overview
- 8.2 Upstream Suppliers and Critical Inputs
- 8.3 Technology and Component Providers
- 8.4 Manufacturing or Service Delivery
- 8.5 Distribution, Channel Partners and Integrators
- 8.6 Downstream Applications and End Users
- 8.7 Value Addition and Profit Pools
- 8.8 Vertical Integration and Outsourcing
- 8.9 Supplier Concentration and Risk
- 8.10 Supply Chain Localization and Resilience
Chapter 9 Australia Oil and Gas Upstream Market Regulations and Policies
- 9.1 Relevant Laws, Standards and Compliance Frameworks
- 9.2 Product, Service, Safety and Quality Requirements
- 9.3 Government Policies, Incentives and Subsidies
- 9.4 Imports, Exports and Trade Barriers
- 9.5 Public Procurement and Local Content Requirements
- 9.6 Environmental and Sustainability Compliance
- 9.7 Upcoming Policy Changes and Market Implications
Chapter 10 Australia Oil and Gas Upstream Market Hotspots and Opportunities
- 10.1 Market Opportunity Mapping and Growth Hotspots
- 10.2 High-Growth Applications and Customer Groups
- 10.3 Underserved Markets and White-Space Opportunities
- 10.4 Emerging Technology and Product Opportunities
- 10.5 New Capacity and Investment Hotspots
- 10.6 Market Entry and Expansion Opportunities
- 10.7 Distribution and Partnership Opportunities
- 10.8 Near-Term and Long-Term Commercial Potential
- 10.9 Opportunity Attractiveness and Execution Risks
Chapter 11 Australia Oil and Gas Upstream Market Outlook, 2025-2035
- 11.1 Market Size and Analysis
- 11.1.1 Revenue (Market Measurement: 2025: USD 65.32 billion → 2035: USD 78.49 billion)
- 11.1.2 Market Volume and Quantity Sold
- 11.1.3 Historical Market Size, 2018-2025
- 11.1.4 Base-Year Market Size, 2025
- 11.2 Market Forecast, 2025-2035
- 11.2.1 Revenue Forecast to 2035
- 11.2.2 Volume Forecast to 2035
- 11.2.3 CAGR and Year-on-Year Growth
- 11.2.4 Incremental Revenue Opportunity
- 11.3 Forecast Assumptions and Scenario Analysis
- 11.3.1 Base-Case Forecast
- 11.3.2 Optimistic and Conservative Scenarios
- 11.3.3 Technology, Pricing and Policy Sensitivities
- 11.4 Market Attractiveness and Growth Outlook
Chapter 12 Australia Oil and Gas Upstream Market Segmentation and Outlook
- 12.1 Segmentation Summary and Market Shares, 2025
- 12.2 Largest and Fastest-Growing Segments
- 12.3 By Energy Source - Market Size and Forecast, 2025-2035
- 12.3.1 Segment Definition and Scope
- 12.3.2 Historical Market Size, 2018-2025
- 12.3.3 Revenue Forecast, 2025-2035
- 12.3.4 Volume Forecast, 2025-2035
- 12.3.5 Base-Year Market Share, 2025
- 12.3.6 Segment CAGR and Growth Drivers
- 12.3.7 Subsegment Market Size and Forecast
- 12.3.7.1 Natural gas
- 12.3.7.2 Crude oil
- 12.3.7.3 Condensate
- 12.3.7.4 Liquefied petroleum gas
- 12.3.8 Subsegment Pricing and Adoption Trends
- 12.3.9 Leading Suppliers and Competition
- 12.3.10 Regional Demand and Opportunities
- 12.4 By Application - Market Size and Forecast, 2025-2035
- 12.4.1 Segment Definition and Scope
- 12.4.2 Historical Market Size, 2018-2025
- 12.4.3 Revenue Forecast, 2025-2035
- 12.4.4 Volume Forecast, 2025-2035
- 12.4.5 Base-Year Market Share, 2025
- 12.4.6 Segment CAGR and Growth Drivers
- 12.4.7 Subsegment Market Size and Forecast
- 12.4.7.1 Power generation
- 12.4.7.2 Process heat and feedstock
- 12.4.7.3 Liquid fuel conversion
- 12.4.8 Subsegment Pricing and Adoption Trends
- 12.4.9 Leading Suppliers and Competition
- 12.4.10 Regional Demand and Opportunities
- 12.5 By Customer Type - Market Size and Forecast, 2025-2035
- 12.5.1 Segment Definition and Scope
- 12.5.2 Historical Market Size, 2018-2025
- 12.5.3 Revenue Forecast, 2025-2035
- 12.5.4 Volume Forecast, 2025-2035
- 12.5.5 Base-Year Market Share, 2025
- 12.5.6 Segment CAGR and Growth Drivers
- 12.5.7 Subsegment Market Size and Forecast
- 12.5.7.1 Liquefied natural gas buyers
- 12.5.7.2 Domestic gas buyers
- 12.5.7.3 Liquid hydrocarbon buyers
- 12.5.8 Subsegment Pricing and Adoption Trends
- 12.5.9 Leading Suppliers and Competition
- 12.5.10 Regional Demand and Opportunities
- 12.6 By Value Chain Stage - Market Size and Forecast, 2025-2035
- 12.6.1 Segment Definition and Scope
- 12.6.2 Historical Market Size, 2018-2025
- 12.6.3 Revenue Forecast, 2025-2035
- 12.6.4 Volume Forecast, 2025-2035
- 12.6.5 Base-Year Market Share, 2025
- 12.6.6 Segment CAGR and Growth Drivers
- 12.6.7 Subsegment Market Size and Forecast
- 12.6.7.1 Integrated upstream and liquefied natural gas
- 12.6.7.2 Standalone gas extraction and treatment
- 12.6.7.3 Standalone liquids extraction and separation
- 12.6.8 Subsegment Pricing and Adoption Trends
- 12.6.9 Leading Suppliers and Competition
- 12.6.10 Regional Demand and Opportunities
- 12.7 Segment Growth Comparison
- 12.8 Segment Attractiveness and Priority Matrix
Chapter 13 Australia Oil and Gas Upstream End-Use and Application Market Outlook
- 13.1 End-Use Industry and Customer Demand Structure
- 13.2 Leading Applications and Customer Groups
- 13.3 End-Use Market Size, Share and Forecast
- 13.4 Major End-Use Industry Deep Dives
- 13.4.1 Customer Requirements and Use Cases
- 13.4.2 Demand and Replacement Cycles
- 13.4.3 Technical and Regulatory Considerations
- 13.4.4 Purchasing and Procurement Models
- 13.4.5 Leading Vendors and Distribution Channels
- 13.4.6 Forecast and Commercial Opportunities
- 13.5 Emerging Applications and Cross-Segment Demand
- 13.6 End-Use Industry Investment Priorities
Chapter 14 Australia Oil and Gas Upstream Geographic Market Outlook, 2025-2035
- 14.1 Domestic Market Distribution and Demand Clusters
- 14.2 State- or Province-Wise Market Size and Forecast, 2025-2035
- 14.3 City and Metropolitan Market Outlook
- 14.4 Industrial, Manufacturing and Commercial Clusters
- 14.5 Geographic Concentration of Key End Users
- 14.6 Local Pricing and Purchasing Differences
- 14.7 Domestic Production Facilities and Capacity Map
- 14.8 Local Infrastructure and Project Pipeline
- 14.9 State-Level Policy and Incentive Differences
- 14.10 Subnational Investment Hotspots and Opportunities
- 14.11 Distribution and Logistics Networks
- 14.12 Domestic Competitive Footprint
Chapter 15 Australia Oil and Gas Upstream Technology, Innovation and Sustainability Outlook
- 15.1 Technology Landscape and Maturity
- 15.2 Product, Process and Service Innovation
- 15.3 AI, Automation and Digital Tools in the Industry
- 15.4 Technology Adoption and Performance Benchmarking
- 15.5 Innovation Pipeline and R&D Investment
- 15.6 Patent and Intellectual Property Trends
- 15.7 Energy Efficiency and Resource Management
- 15.8 Sustainability, Recycling and Circularity
- 15.9 Technology Roadmap, 2025-2035
- 15.10 Risks of Obsolescence and Technology Substitution
Chapter 16 Australia Oil and Gas Upstream Market Key Strategic Imperatives
- 16.1 Growth and Market Entry Priorities
- 16.2 High-Return Products and Segments
- 16.3 Pricing, Profitability and Cost Optimization
- 16.4 Technology Investment and Product Differentiation
- 16.5 Supply Chain Localization and Resilience
- 16.6 Distribution and Customer Acquisition
- 16.7 Partnership, Acquisition and Capacity Strategy
- 16.8 Regional Expansion Priorities
- 16.9 Short-, Medium- and Long-Term Actions
Chapter 17 Competition Outlook
- 17.1 Industry Competition Characteristics
- 17.2 Market Structure and Concentration
- 17.3 Market Share and Competitive Positioning, 2025
- 17.4 Company-Wise Revenue and Product Benchmarking
- 17.5 Production and Service Capacity Benchmarking
- 17.6 Technology, Pricing and Differentiation
- 17.7 Regional Footprint and Distribution Strength
- 17.8 Mergers, Acquisitions and Strategic Alliances
- 17.9 New Entrants and Competitive Threats
- 17.10 Porter's Five Forces and Industry Attractiveness
- 17.11 Competitive Outlook, 2025-2035
Chapter 18 Company Profiles
- 18.1 Company Coverage and Selection Criteria
- 18.2 Woodside Energy Group
- 18.2.1 Business Description
- 18.2.2 Company Ownership and Geographic Presence
- 18.2.3 Product and Service Portfolio
- 18.2.4 Manufacturing and Operating Footprint
- 18.2.5 Production Capacity and Expansion Plans
- 18.2.6 Financial Performance and Investment
- 18.2.7 Market Share and Competitive Position
- 18.2.8 Technology and Innovation Capabilities
- 18.2.9 Strategic Alliances or Partnerships
- 18.2.10 Recent Developments
- 18.2.11 Growth Strategy and Outlook
- 18.3 Chevron Australia
- 18.4 Shell Australia
- 18.5 INPEX Australia
- 18.6 Santos
- 18.7 ExxonMobil Australia
- 18.8 ConocoPhillips Australia
- 18.9 TotalEnergies Australia
- 18.10 Origin Energy
- 18.11 Beach Energy
- 18.12 Other Relevant Market Participants
Note: Every listed company is profiled on the structure shown under the first company. The company list is preliminary and may change based on research findings, market developments, data availability and client requirements.
Chapter 19 Disclaimer
- 19.1 Research and Forecast Disclaimer
- 19.2 Data Source and Estimation Limitations
Note: The depth of individual sections depends on data availability for this market. Volume, capacity, trade and other unit-based metrics are included where applicable.

