
Cogeneration networks heat cities as clean sources expand
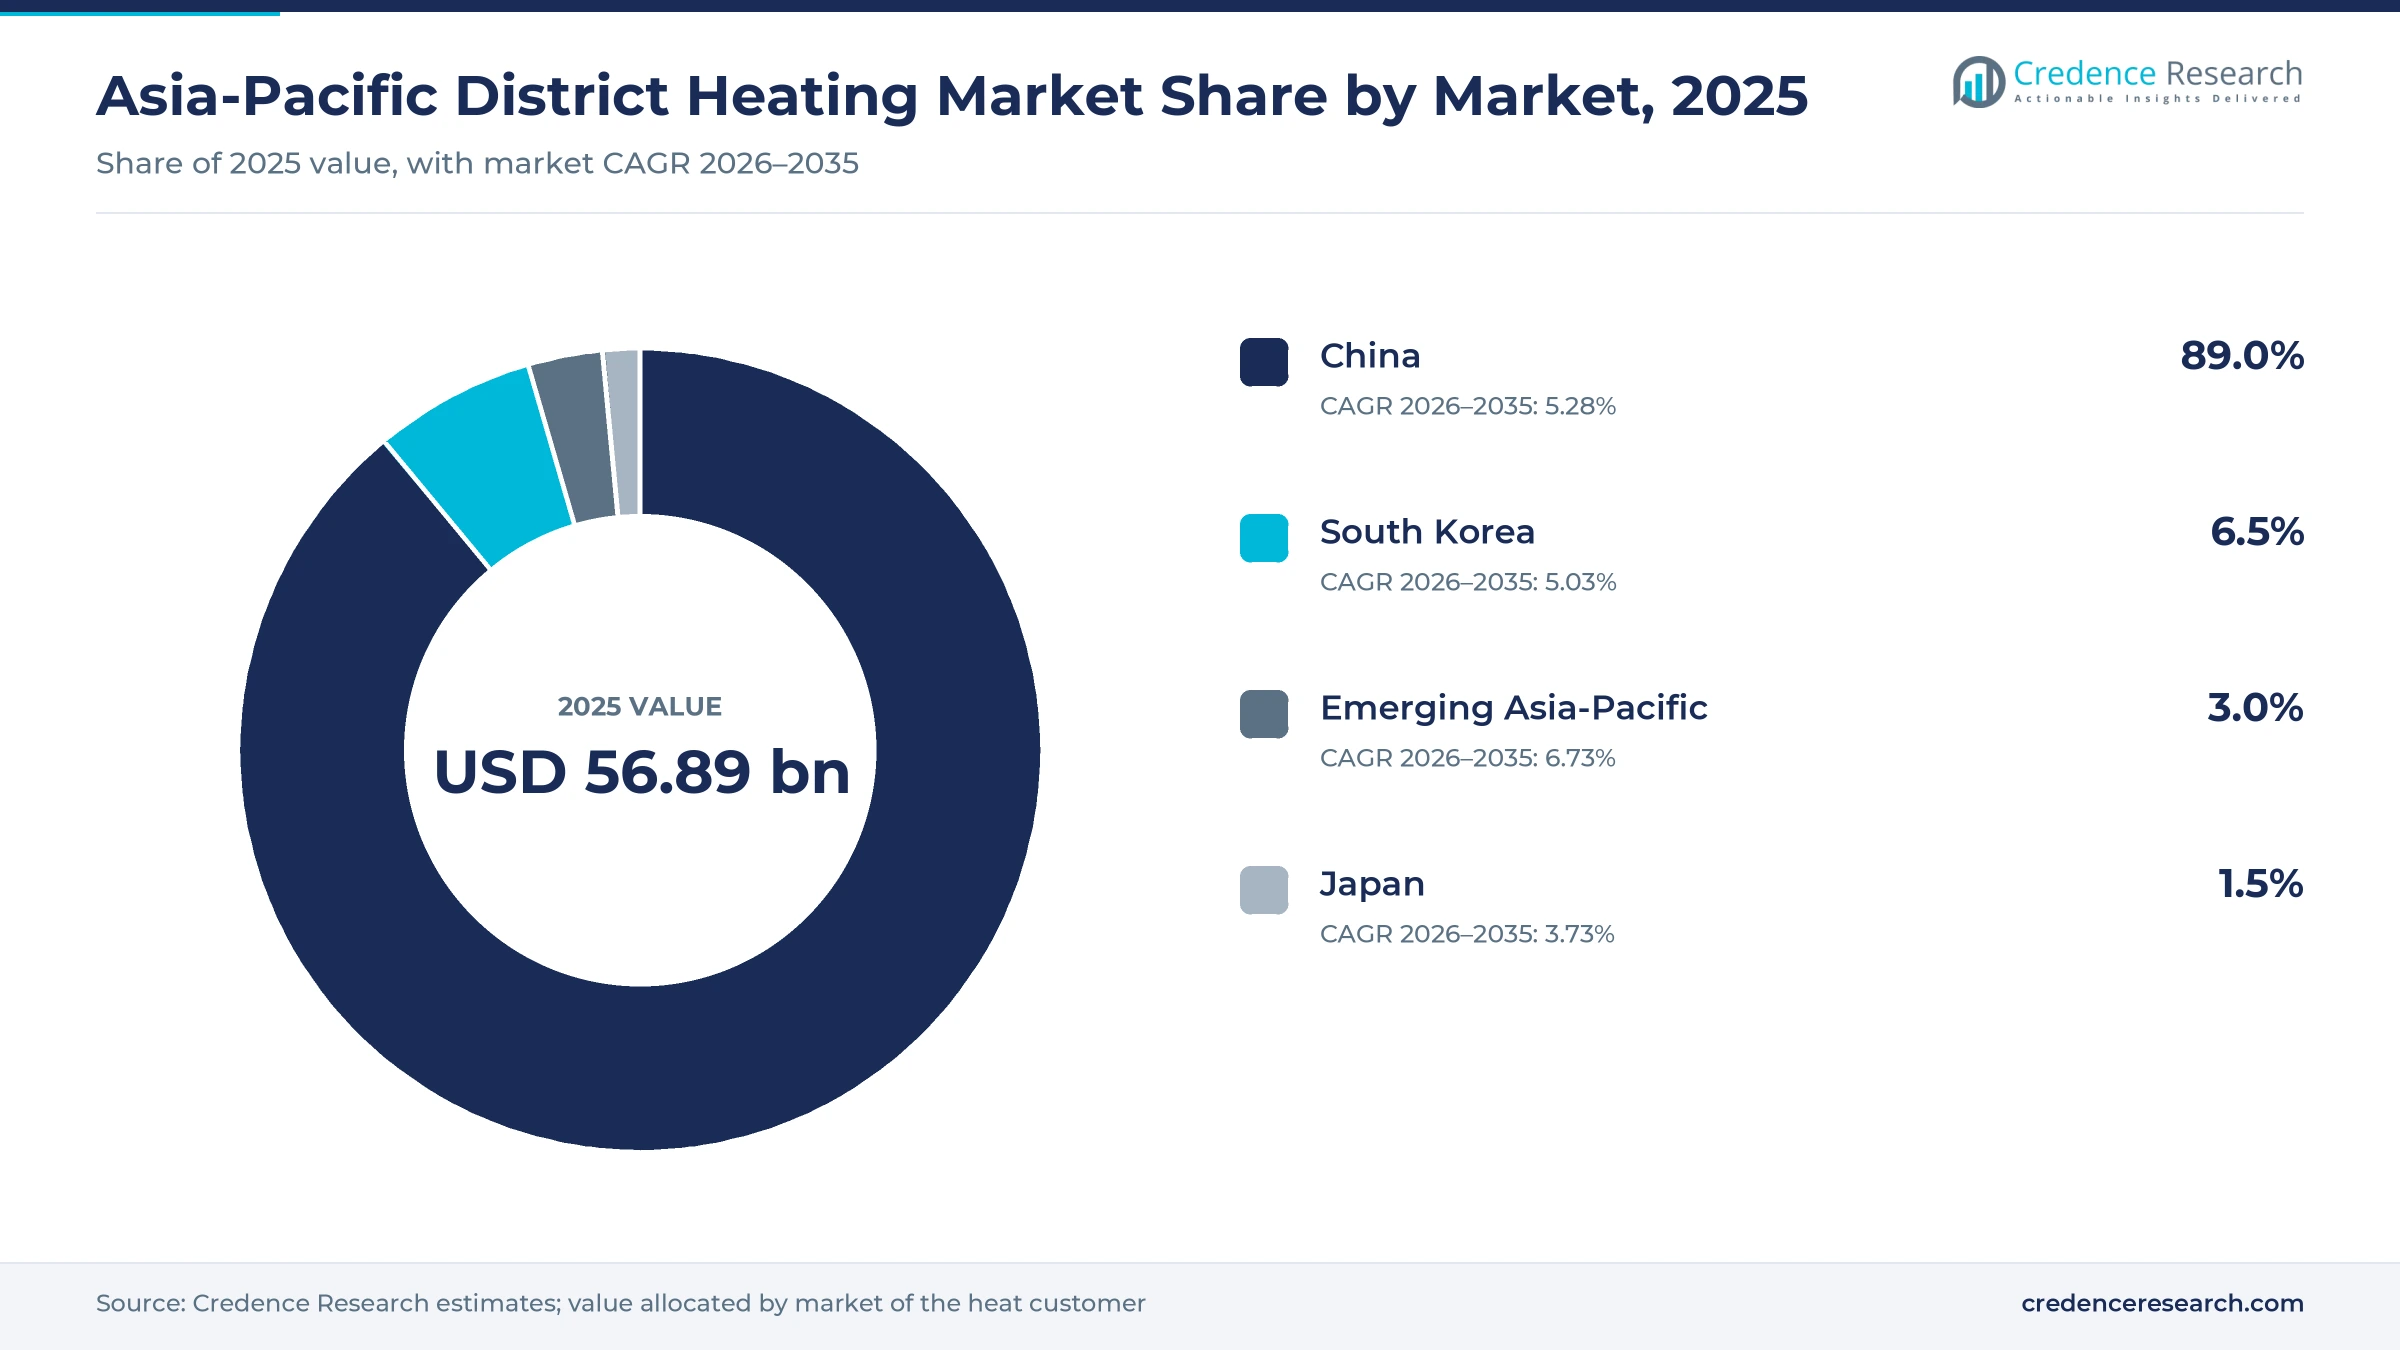
The Asia-Pacific district heating market was valued at USD 56.89 billion in 2025 and is projected to increase from USD 60.05 billion in 2026 to USD 95.48 billion by 2035, registering a CAGR of 5.29% during 2026–2035. Demand comes from apartment heating in northern Chinese cities, district energy in South Korean new towns and steam supply to industrial parks across the region. China held the largest share, 89.0% in 2025, because large coal and gas cogeneration plants feed city networks that heat hundreds of millions of square meters each winter. Emerging Asia-Pacific is the fastest-growing market at 6.73% a year, as Mongolia rebuilds the Ulaanbaatar network with international finance. South Korea adds steady growth from new housing connections, while Japanese networks serve dense business districts. Heat sources are also changing, because nuclear plants, geothermal wells and long-distance waste heat pipelines now supply city networks that once relied on small coal boilers.
What does the regional heat supply estimate cover?
The estimate measures the value of heat sold through piped networks to buildings and industrial users in China, South Korea, Japan and emerging Asia-Pacific markets such as Mongolia. It covers space heating, domestic hot water and process heat delivered as hot water or steam, valued at the tariffs that customers pay. Sales billed by floor area, by metered energy or by combined capacity and energy charges all count toward the total.
The estimate excludes district cooling, electricity sold by cogeneration plants and equipment sales such as boilers, pipes and heat exchangers. The value chain runs from heat producers, including cogeneration plants, heat-only boilers, nuclear stations, geothermal wells and industrial waste heat sources, through transmission and distribution networks to municipal, private and concession operators that bill households, offices and factories.
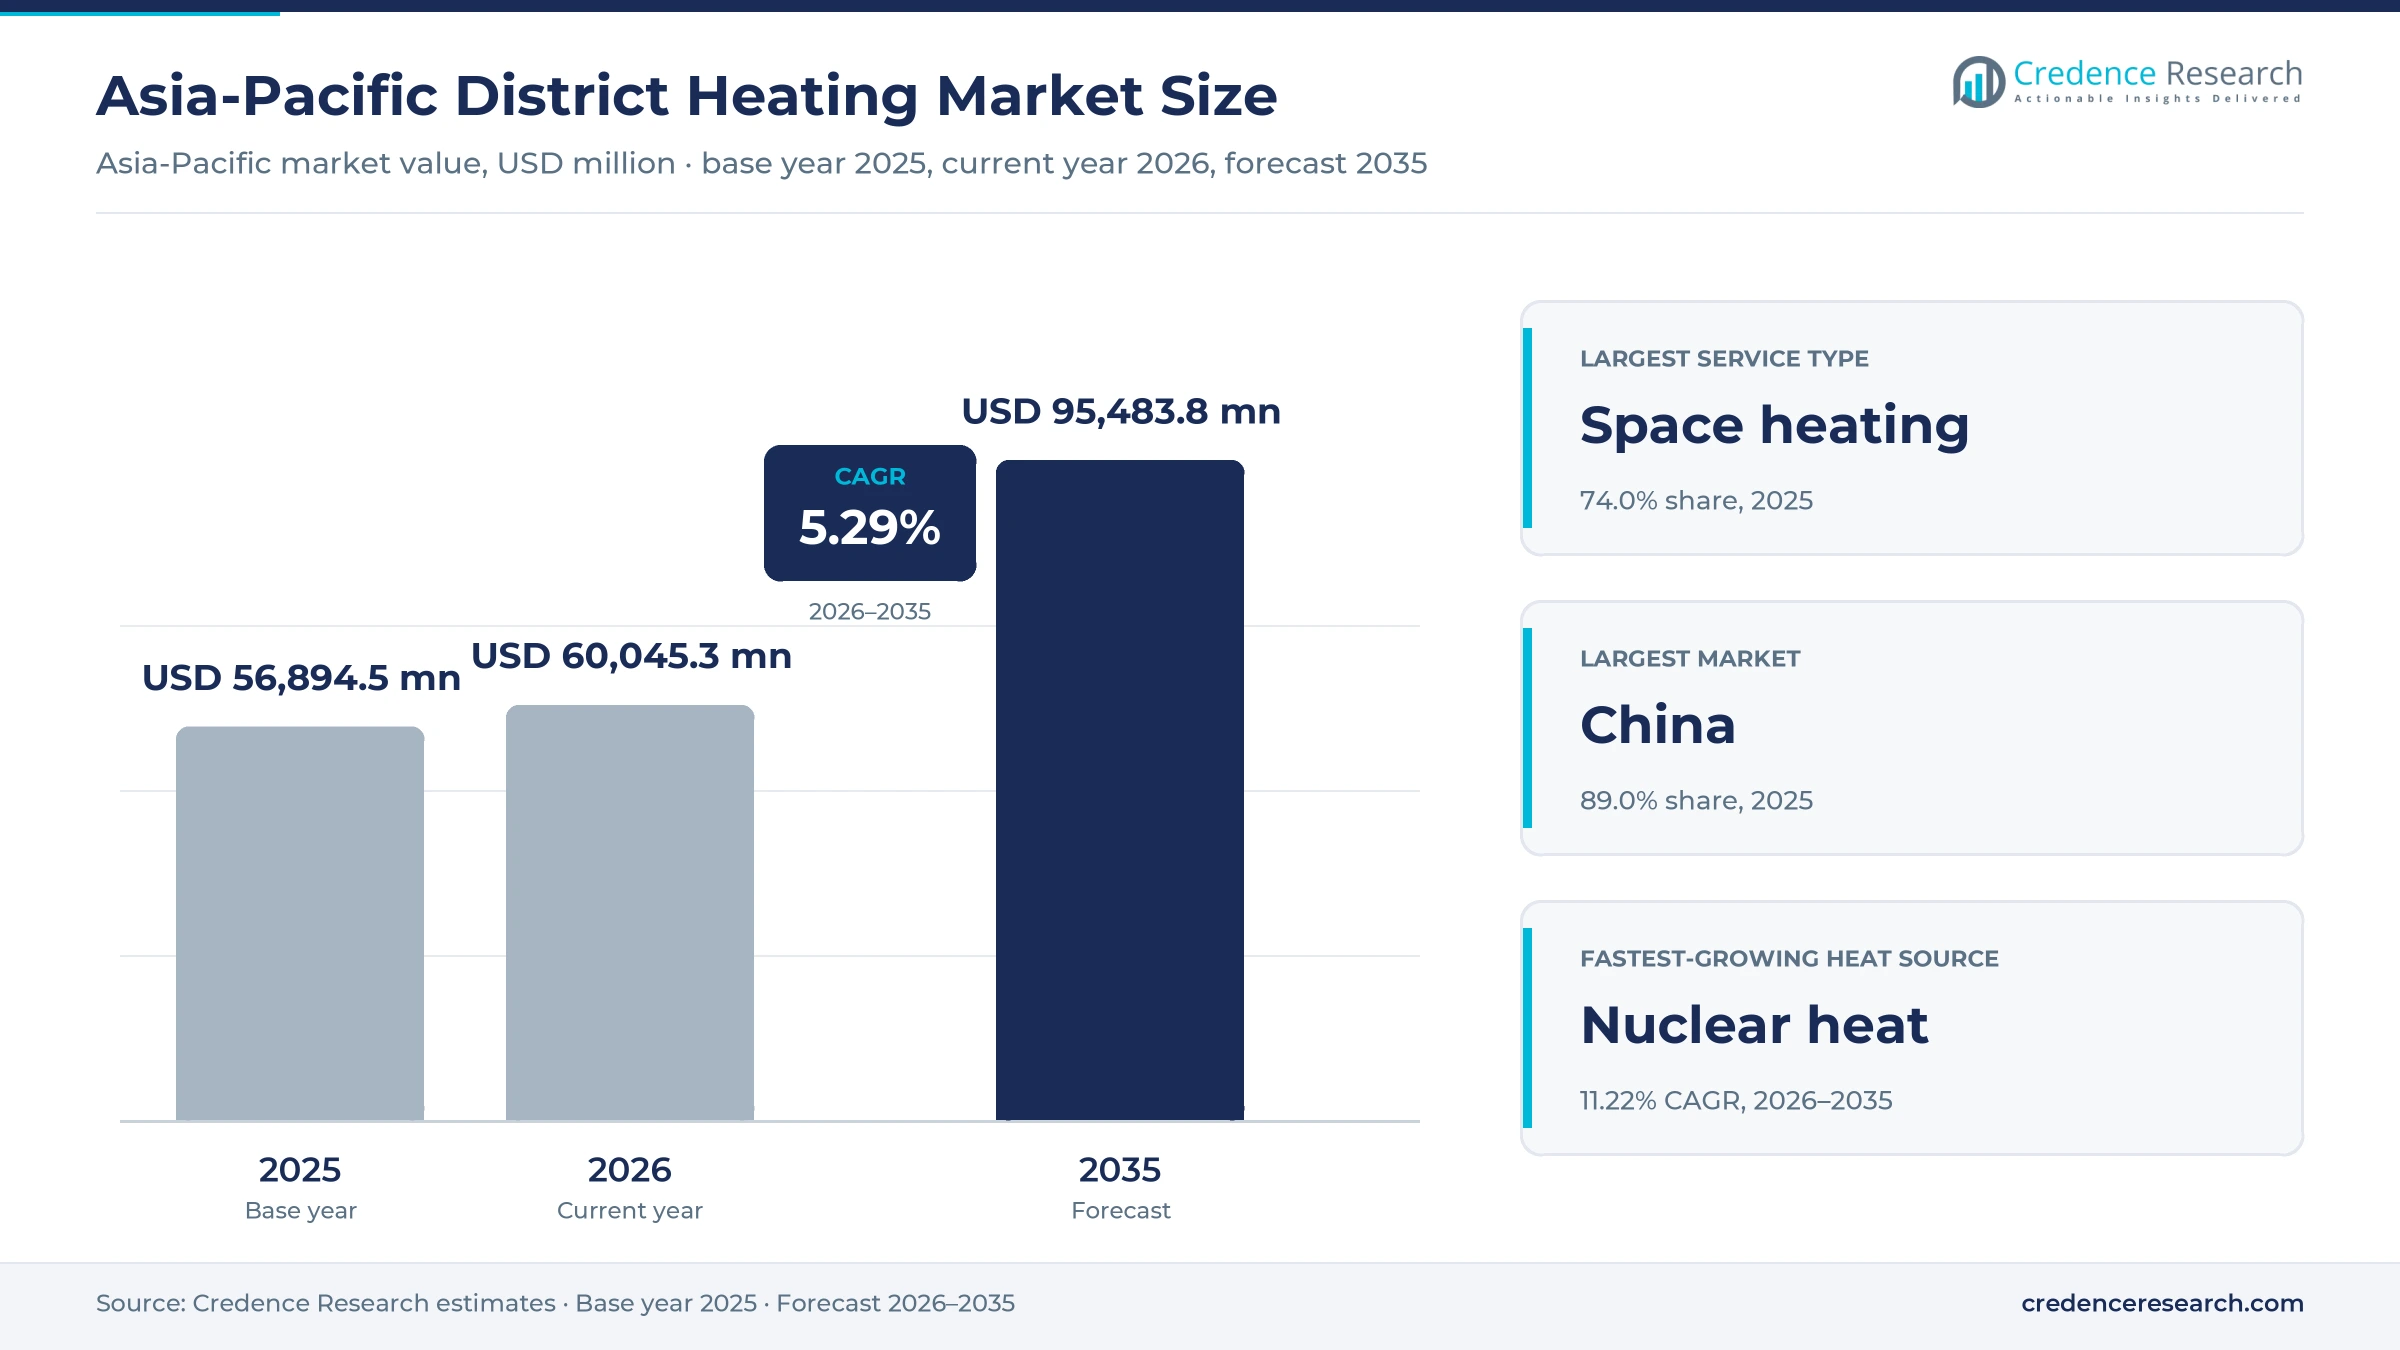
Asia-Pacific District Heating Market Insights
- The Asia-Pacific district heating market was valued at USD 56.89 billion in 2025 and is projected to reach USD 95.48 billion by 2035, registering a CAGR of 5.29% during 2026–2035.
- China held 89.0% of 2025 value, and CHN Energy alone supplied 540 million gigajoules of heat in 2024, up 6.7% from 2023.
- Space heating led service demand with a 74.0% share of 2025 value, because winter apartment heating in northern China dominates network sales.
- South Korea plans to raise district heating connections from 3.78 million households in 2023 to 4.46 million by 2028 under its sixth basic plan.
- Sinopec reported geothermal heating coverage of 120 million square meters at the end of 2024, about double its 2020 level.
Space heating leads while process heat grows fastest
Why does space heating dominate service demand?
Based on service type, the market is categorized into space heating, domestic hot water and process heat. Space heating led with a 74.0% share of 2025 value, because northern Chinese cities heat apartments and offices through long winter seasons. Process heat grows fastest at 5.98% a year, as industrial parks replace their own small boilers with steam bought from nuclear and cogeneration plants under long supply contracts.
How do fossil fuels still lead the heat source mix?
Based on heat source, the market is categorized into fossil-fuel heat, recovered heat, renewable heat and nuclear heat. Fossil-fuel heat led with a 78.0% share of 2025 value, because coal and gas cogeneration plants still supply most city networks in China and South Korea. Nuclear heat grows fastest at 11.22% a year from a small base, as Haiyang, Tianwan and Shidao Bay show that reactors can heat homes and supply industrial steam.
Why do residential buildings anchor heat sales?
Based on end user, the market is categorized into residential buildings, commercial buildings and industrial facilities. Residential buildings led with a 68.0% share of 2025 value, because apartment complexes form the core customer base for Chinese and Korean operators, such as the 528,492 household users of Jilin Chuncheng Heating in 2025. Industrial facilities grow fastest at 5.88% a year, as chemical and manufacturing parks buy steam under long contracts.
How do high-temperature networks shape the technology mix?
Based on technology, the market is categorized into high-temperature water networks, low-temperature water networks and steam networks. High-temperature water networks led with a 76.0% share of 2025 value, because most Chinese and Korean networks were built around large cogeneration plants and long transmission mains. Low-temperature water networks grow fastest at 9.18% a year, as geothermal wells, heat pumps and waste heat sources work best at lower supply temperatures.
| Segment Group | Leading Sub-segment | Share, 2025 | Fastest-growing Sub-segment | CAGR, 2026–2035 |
|---|---|---|---|---|
| By Service Type | Space heating | 74.0% | Process heat | 5.98% |
| By Heat Source | Fossil-fuel heat | 78.0% | Nuclear heat | 11.22% |
| By End User | Residential buildings | 68.0% | Industrial facilities | 5.88% |
| By Technology | High-temperature water networks | 76.0% | Low-temperature water networks | 9.18% |
Request a Free Sample
Fill in your details and we'll send you a free sample report.
- Sample data tables & charts
- Research methodology
Urban connections, Korean plans and clean heat lift sales
How does connected urban floor area lift heat sales?
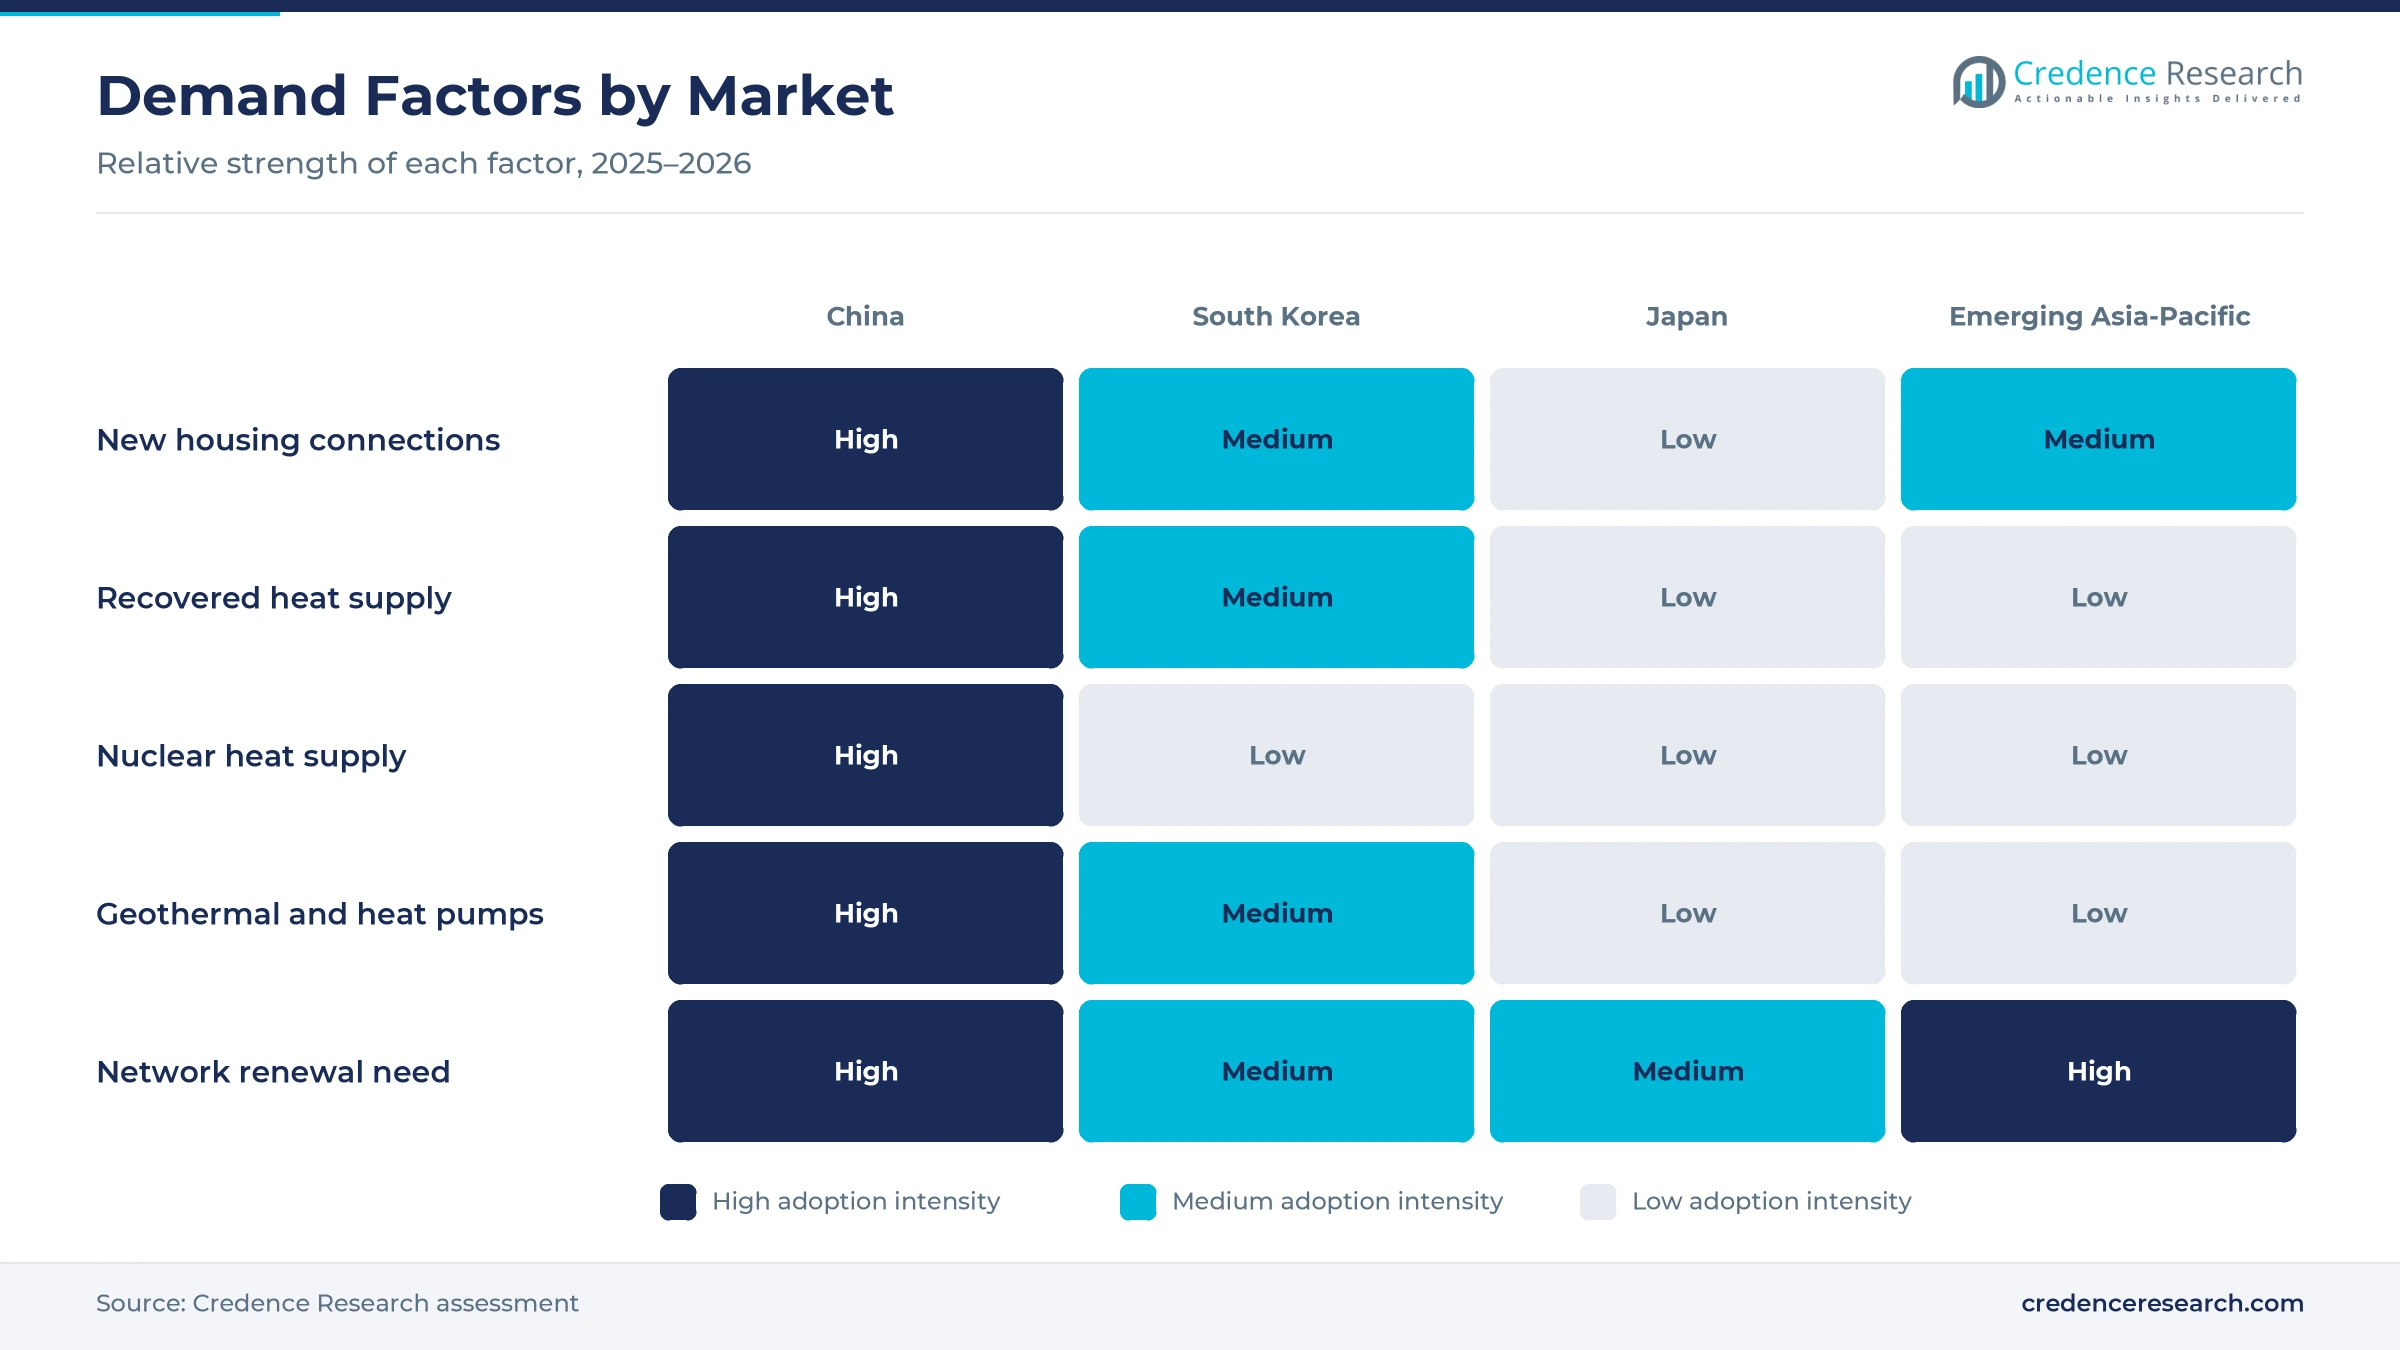
Each new apartment block in a northern Chinese city adds a paying heat customer for decades, which makes new housing the main source of demand growth. CHN Energy reported that its heating coverage passed 900 million square meters in 2024 after it added 77.31 million square meters during the year, Heat Exchanger World reported. The company also delivered 540 million gigajoules of heat in 2024, up 6.7% from 2023. Beijing expects its urban central heating area to reach about 1.07 billion square meters in the 2025 to 2026 season, Xinhua reported. Jilin Chuncheng Heating also expanded its service area by 4.33% to 72.781 million square meters in 2025. As a result, space heating demand in China keeps rising as more connected floor area enters each heating season.
Why does Korea's district energy plan add new customers?
South Korea is extending district energy into new housing and industrial complexes, which adds steady connections for its operators. The Ministry of Trade, Industry and Energy finalized the sixth basic plan for district energy supply on Feb. 27, 2025, and set a target of 4.46 million connected households by 2028, according to Etoday. That target equals about 21.3% of all Korean housing and adds about 680,000 households to the 3.78 million served in 2023. The plan also raises the number of industrial complex district energy sites from 45 to 54. GS Power already supplies about 380,000 households in the Anyang and Bucheon areas, according to GS Energy. As a result, South Korea holds a 6.5% share of 2025 value.
How do clean heat sources reshape network supply?
Geothermal wells, recovered heat and other low-carbon supply now feed city networks, which lets operators meet new demand while they cut coal use. Sinopec reported geothermal heating coverage of 120 million square meters at the end of 2024, serving 1.2 million households in more than 70 cities, according to ThinkGeoEnergy. That figure is about double the 2020 level and replaces nearly 2.3 million tons of standard coal each year. Beijing prohibited new coal and gas heating systems in new buildings in November 2023, with limited exceptions, according to the Regulatory Assistance Project. Northern China also had 41 million clean heating users by the end of 2024, Xinhua reported. In turn, renewable and recovered heat gain share as operators retire small coal boilers across northern cities.
Why do industrial parks buy more piped steam?
Chemical and manufacturing parks increasingly buy steam from large central plants instead of running their own small boilers. China's first industrial nuclear steam project, Heqi-1 at Tianwan, began operation on June 20, 2024, and is expected to supply 4.8 million tons of steam a year to the Lianyungang petrochemical base, World Nuclear News reported. The project replaces about 400,000 tons of standard coal a year through a pipeline of about 23 kilometers. Huadian Power International also said in March 2026 that its 55 controlled plants sit mainly in electricity and heat load centers across 15 provinces. Jilin Chuncheng Heating served 69,593 industrial, commercial and other non-residential users in 2025. As a result, process heat grows fastest among service types at 5.98% a year.
Waste heat, nuclear supply and heat pumps reshape networks
How is long-distance waste heat transport rising?
Cities are piping surplus heat from distant power plants, which turns waste heat into a main supply source for whole districts. Jinan now draws heat from two thermal power plants more than 100 kilometers away, and the city expects the new source to cut standard coal use by 1.3 million tons per heating season, Xinhua reported in November 2025. The same report said Jinan expected to phase out 54 coal-fired boilers in its urban area during 2025. CHN Energy's Feixian project in Shandong also uses a 45.4-kilometer pipeline to serve 210,000 households. These projects rely on waste heat recovery systems at power plants and industrial sites. As a result, recovered heat gains share across the forecast period.
Why is nuclear heat emerging in coastal provinces?
Reactor owners in Shandong, Liaoning and Jiangsu are selling heat from existing units, which gives nearby cities a zero-carbon baseload source. The Warm Nuclear No. 1 project, the third phase of the Haiyang commercial heating scheme, began operation on Nov. 25, 2023, with a 23-kilometer link to Haiyang and Rushan, according to World Nuclear News. The project can heat 12.5 million square meters for about 400,000 people. The scheme has delivered 4.56 million gigajoules of zero-carbon heat and replaced about 390,000 tons of raw coal. The Shidao Bay-1 residential heating project also started operating in April 2024, NucNet reported. As a result, nuclear heat grows fastest among heat sources at 11.22% a year.
Can low-temperature networks open room for heat pumps?
Networks that run at lower supply temperatures can use heat sources that older steam and hot water mains cannot, which creates an opening for heat pump suppliers and surplus renewable power. Korea's sixth basic plan includes power-to-heat pilot projects that use surplus renewable electricity and incentives for heat pumps that draw on low-temperature heat. The same plan introduces a clean heat certification system and an updated national heat map with heat trading guidelines. China's 2022 to 2025 clean winter heating policy placed more emphasis on new energy heating and heat pumps, according to the Regulatory Assistance Project. Suppliers of industrial heat pumps can serve these projects where operators recover low-grade heat. As a result, low-temperature water networks grow fastest among technologies at 9.18% a year.
Is there room for network upgrades in emerging markets?
Aging networks in Mongolia and Central Asia offer an opening for operators and suppliers with modernization experience. The World Bank approved a USD 41 million credit for the Ulaanbaatar Heating Sector Improvement Project on April 24, 2020, to expand capacity and improve network efficiency, according to the World Bank. The bank rated progress toward that objective satisfactory in November 2024. Korea District Heating Corporation also launched its K-Heating initiative in Uzbekistan in August 2025, with a team that advises local operators on network modernization, Kun.uz reported. The company's northern business strategy targets Central Asia and Mongolia. As a result, emerging markets gain share across the forecast period as lenders fund new pipelines.
Coal reliance, aging pipes and thin finance slow growth
Why does coal dependence keep supply costs exposed?
Most networks in northern China still draw heat from coal-fired cogeneration plants and boilers, which ties operators to coal prices and emission rules. China's 2017 to 2021 clean winter heating plan for northern cities focused on phasing out small coal boilers and loose coal, according to the Regulatory Assistance Project. As a result, operators face rising costs to retrofit or replace these plants. Companies respond by signing waste heat contracts, adding geothermal and biomass sources, and planning heat storage at retired coal sites, as Huadian Power International described in March 2026.
How do aging pipelines raise losses and risks?
Old pipelines lose heat and fail more often, which raises costs for operators and safety risks for cities. China plans to build and upgrade about 770,000 kilometers of urban underground pipelines during 2026 to 2030, with heating systems among the priorities, People's Daily reported in June 2026. The government earmarked 160 billion yuan for 2026 through ultra-long special treasury bonds. However, heat operators must still fund much of their own network work. Companies respond with smart monitoring and staged replacement of the oldest mains.
Why does fragmentation limit scale in Japan?
Japan's heat supply business is fragmented and concentrated in dense business districts, which limits scale for each operator. The Ministry of Economy, Trade and Industry listed 73 registered heat supply operators as of June 1, 2022, and many of them serve only one or two districts. Hokkaido Heat Supply, for example, serves central Sapporo and the Kosei district. As a result, growth depends on urban redevelopment rather than new housing. Operators respond by linking new buildings to existing plants and adding gas cogeneration units.
How does thin finance slow emerging-market repairs?
Emerging markets struggle to fund network repairs, because their utilities depend on outside lenders for large projects. The EBRD, the European Union and the Austrian government combined EUR 15.5 million for Ulaanbaatar pipeline upgrades, which the EU delegation described in November 2024 as the first major foreign investment in the city's central heating system in over two decades. As a result, progress depends on concessional loans and grants. Operators respond by upgrading the most congested pipeline sections first.
China dominates while emerging markets grow fastest
| Market | Value, 2025 (USD billion) | Share, 2025 | CAGR, 2026–2035 |
|---|---|---|---|
| China | 50.64 | 89.0% | 5.28% |
| South Korea | 3.70 | 6.5% | 5.03% |
| Emerging Asia-Pacific | 1.71 | 3.0% | 6.73% |
| Japan | 0.85 | 1.5% | 3.73% |
Why does China dominate regional heat sales?
China held 89.0% of 2025 value and grows at 5.28% a year, because northern cities connect new housing to large cogeneration networks every year. CHN Energy's Lingwu plant is the largest cogeneration facility in China by heating area, with more than 70 million square meters. Coastal provinces also add nuclear heat and industrial steam, as the Heqi-1 project draws on nuclear steam supply systems at Tianwan to serve a petrochemical base. Geothermal heating from Sinopec also adds supply in Hebei, Shaanxi and Henan.
How does South Korea grow through new towns?
South Korea held a 6.5% share of 2025 value and grows at 5.03% a year, because district energy serves new towns and industrial complexes around Seoul and other cities. GS Power's Anyang plant began commercial operation of a 500 MW unit in February 2022 and reaches over 93% efficiency in district heating mode, according to GE Vernova. Operators rely on gas-fired combined heat and power systems to supply both electricity and heat. Korea District Heating Corporation also runs a cogeneration plant in Pangyo.
Why is emerging Asia-Pacific the fastest-growing market?
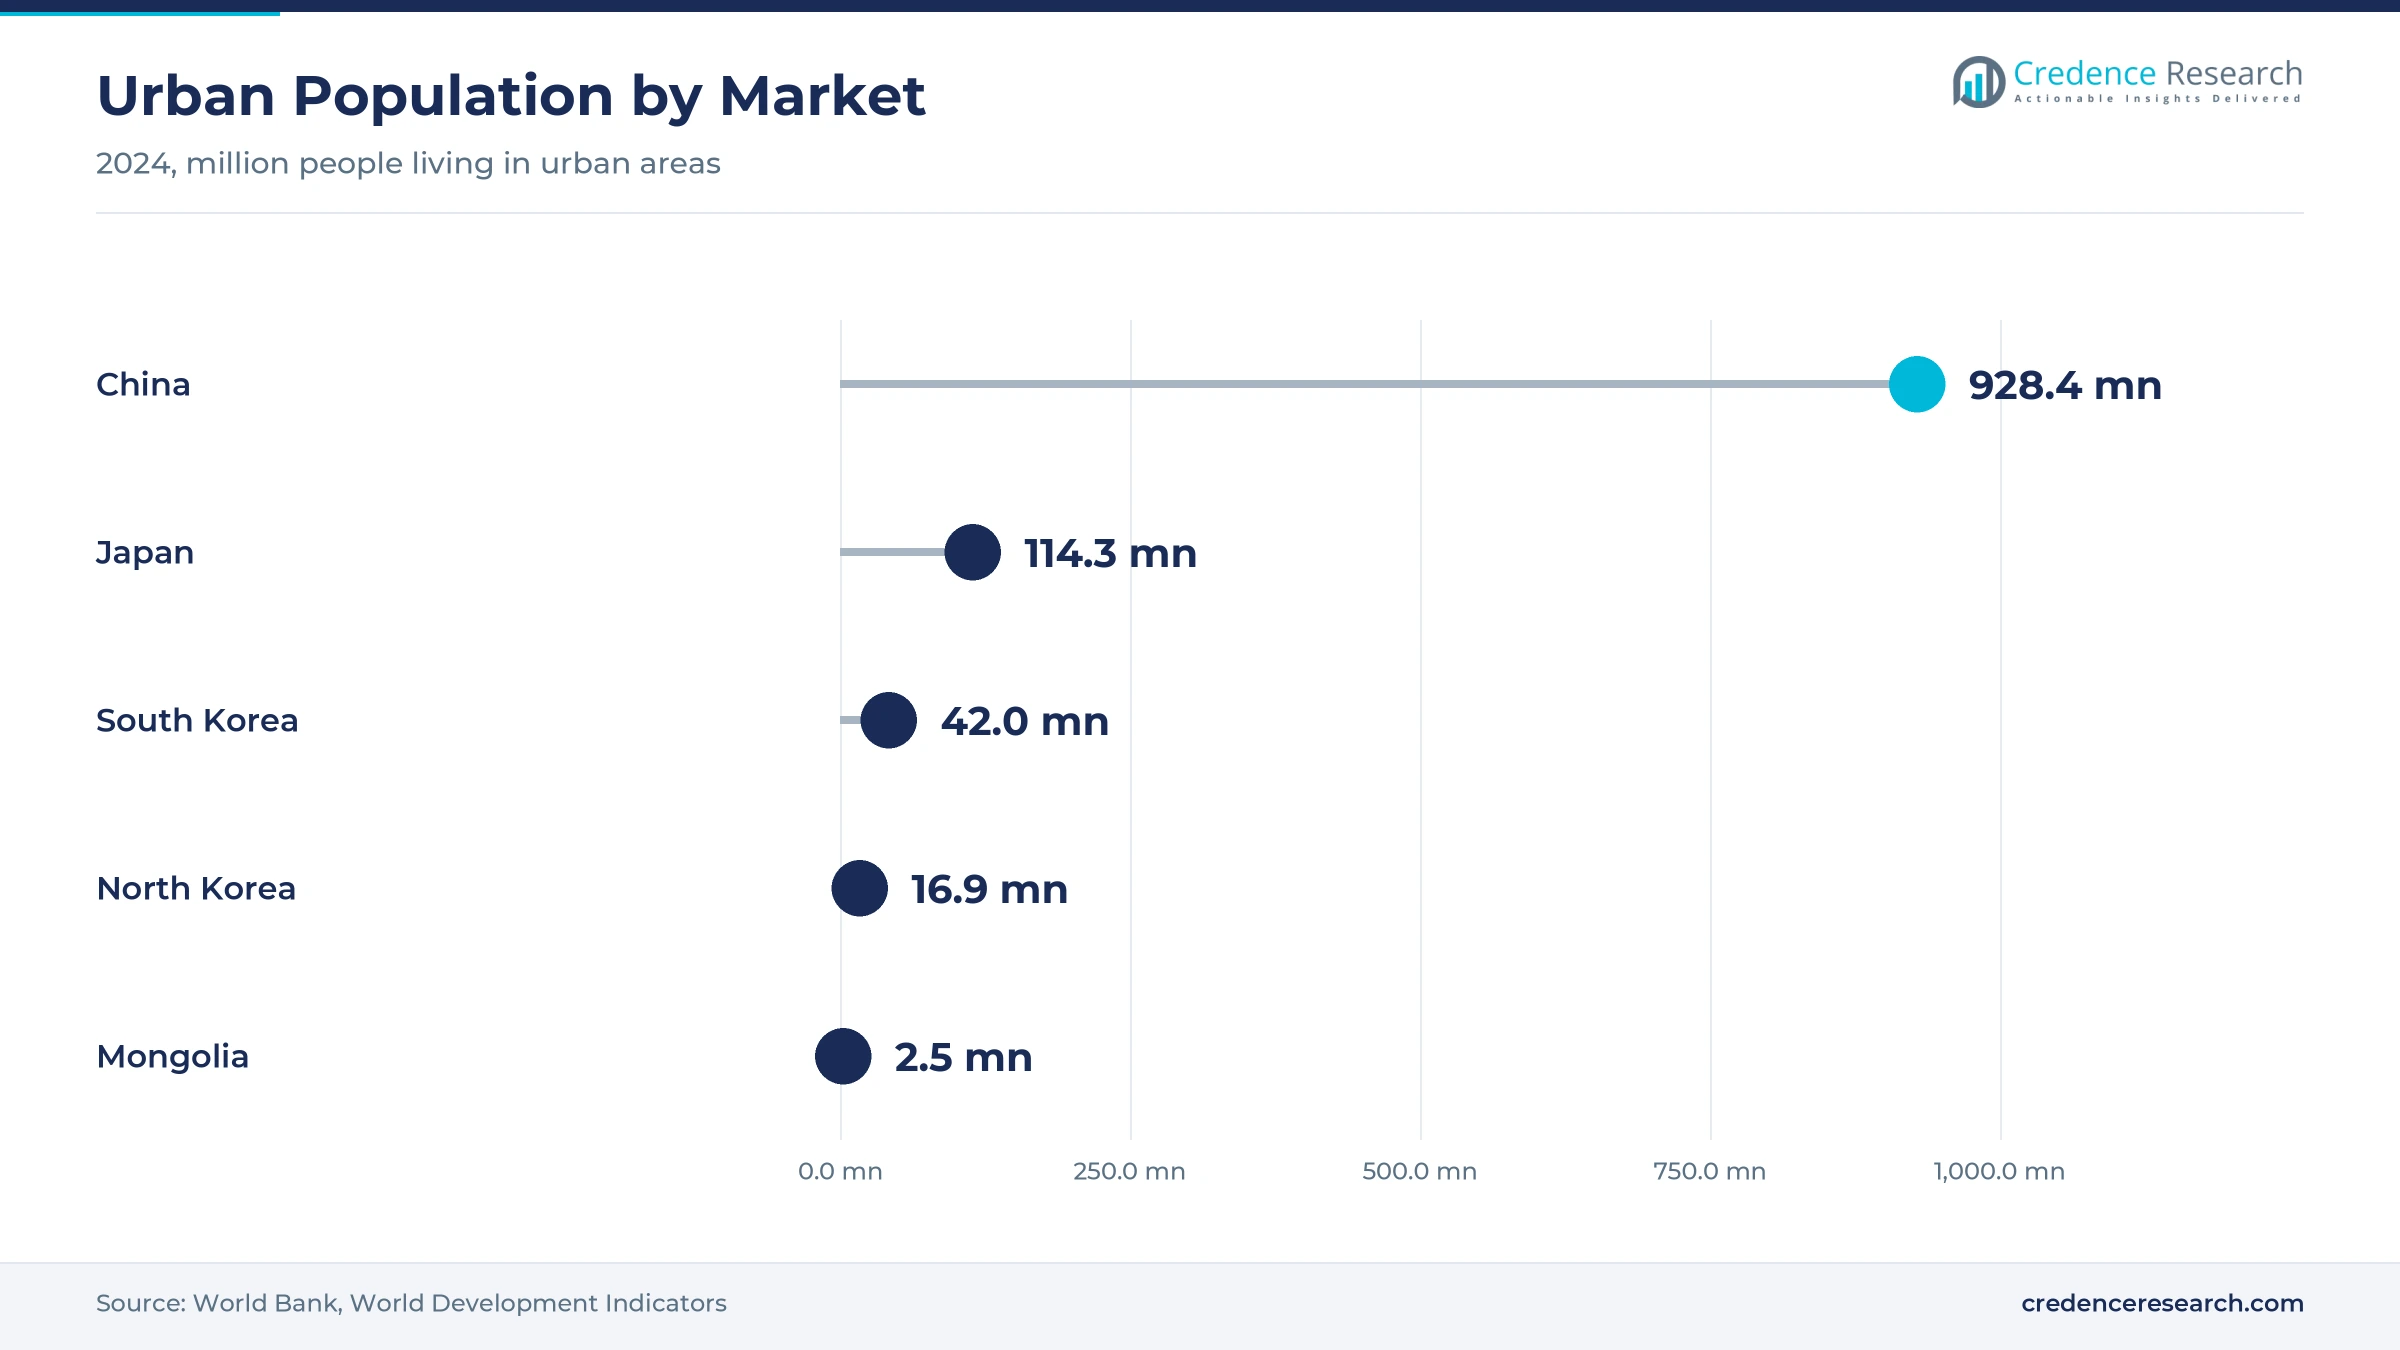
Emerging Asia-Pacific held a 3.0% share of 2025 value and grows fastest at 6.73% a year, because Mongolia is rebuilding the Ulaanbaatar network with international finance. Recent pipeline work in the Bayangol and Bayanzurkh districts lets the network connect 150 to 200 more 12-story residential buildings. Mongolia's urban population reached about 2.5 million in 2024, according to World Bank data. Korea District Heating Corporation's northern strategy also targets Mongolia and Central Asia.
Why does Japan stay a niche business-district market?
Japan held a 1.5% share of 2025 value and grows at 3.73% a year, the slowest pace in the region, because heat networks serve dense business districts rather than whole cities. Hokkaido Heat Supply operates in central Sapporo and the Kosei district, where new heat supply regulations were approved on March 5, 2026, and took effect on April 1, 2026, according to the Ministry of Economy, Trade and Industry. Growth therefore follows office and civic redevelopment projects in large cities.
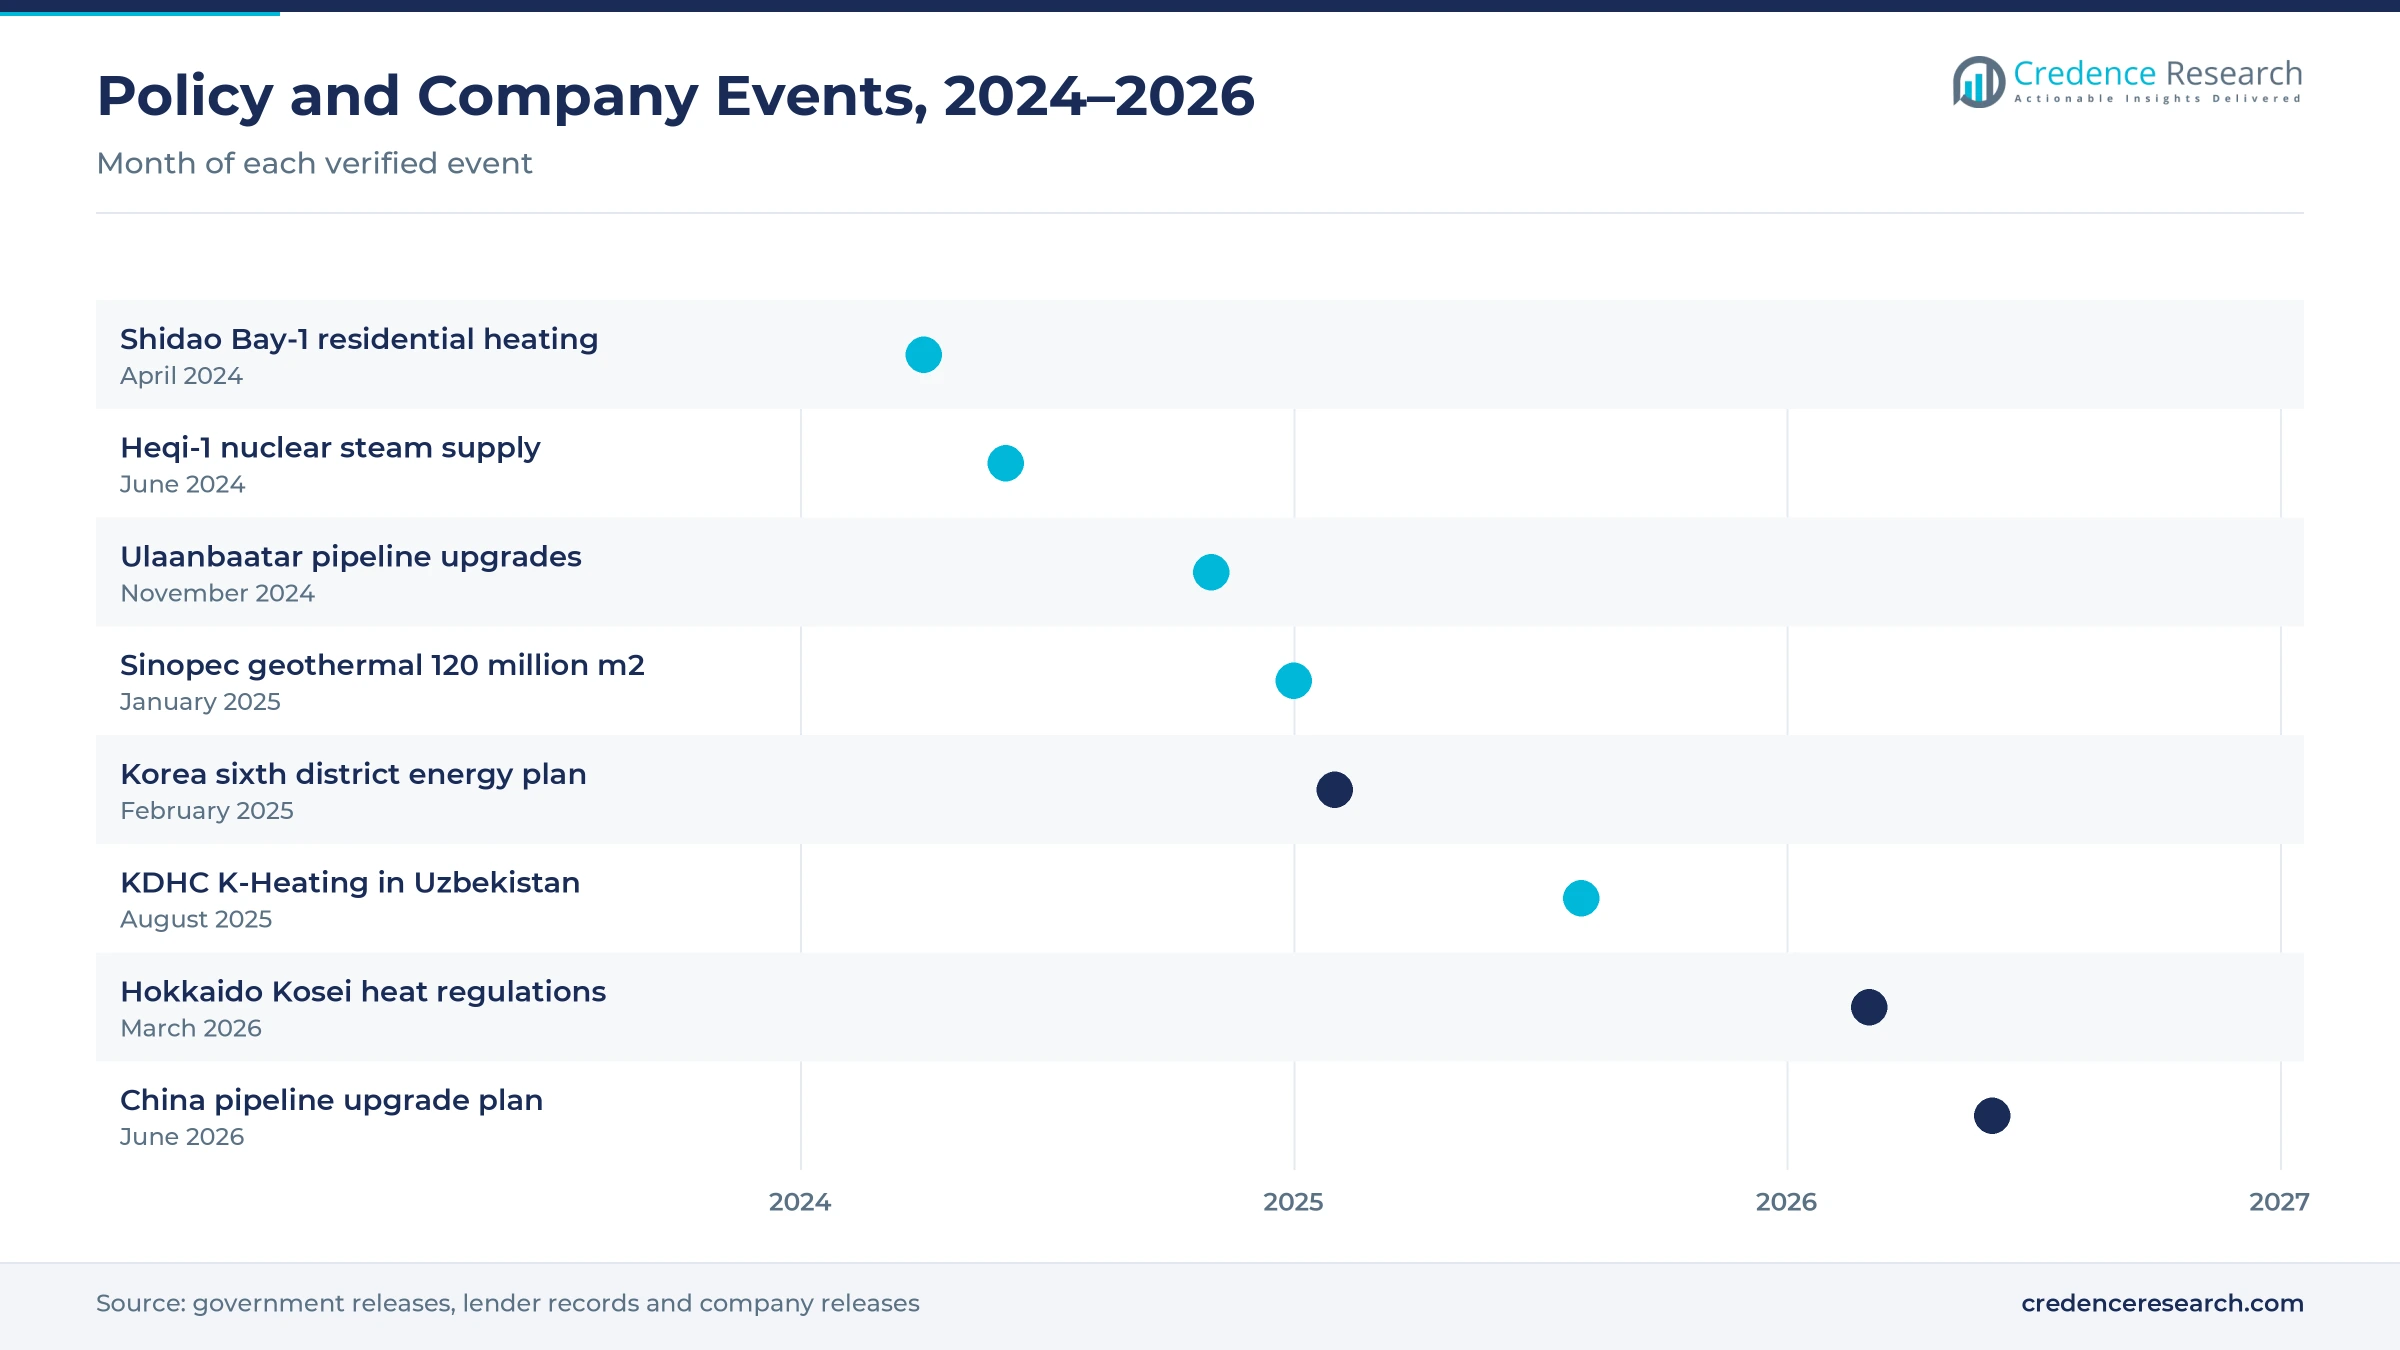
Nuclear steam, Korean plans and pipe upgrades, 2024 to 2026
| Development | Status and market relevance |
|---|---|
| In June 2024, Jiangsu Nuclear Power Company began operating the Heqi-1 project, which supplies steam from Tianwan to the Lianyungang petrochemical base. | Expected to supply 4.8 million tons of steam a year |
| In February 2025, South Korea finalized its sixth basic plan for district energy supply, covering 2024 to 2028. | Targets 4.46 million connected households by 2028 |
| In August 2025, Korea District Heating Corporation launched its K-Heating initiative to help modernize heat networks in Uzbekistan. | Extends Korean operator know-how to Central Asia |
| In March 2026, Japan approved new heat supply regulations for Hokkaido Heat Supply's Kosei district in Sapporo. | Took effect on April 1, 2026 |
| In June 2026, China announced plans to build and upgrade about 770,000 kilometers of urban underground pipelines during 2026 to 2030. | Lists heating systems among the upgrade priorities |
Long-distance mains and nuclear extraction reshape supply
- Long-distance transmission mains carry heat from power plants more than 100 kilometers away, which lets cities such as Jinan retire small coal boilers.
- Nuclear heat extraction draws steam from reactor secondary circuits, which lets plants such as Tianwan supply industrial parks without burning coal.
- Medium-deep geothermal wells supply heat directly to city networks, which helps Sinopec serve 1.2 million households in more than 70 cities.
- Power-to-heat units convert surplus renewable electricity into network heat, which South Korea plans to test under its sixth basic plan.
Need a Custom Version of This Report?
Tailor the scope, geography, or segments to your exact requirements.
- Custom geography or segment scope
- Direct access to our analyst team
Power groups and city utilities compete on heat sources
Competition combines state-owned power groups, municipal and provincial heat utilities, energy majors and private operators. In China, CHN Energy, Huadian Power International and State Power Investment Corporation sell heat from coal, gas and nuclear plants into city networks and industrial parks. Local distributors such as Jilin Province Chuncheng Heating buy cogeneration heat and bill households directly. Sinopec Star, the geothermal development arm of Sinopec, competes with renewable heat in northern cities. In South Korea, Korea District Heating Corporation serves new towns such as Pangyo, while GS Power focuses on the Anyang and Bucheon areas. In Japan, Hokkaido Heat Supply serves central Sapporo and the Kosei district. Companies compete on access to low-cost heat sources, long concession rights, network reliability and the ability to replace coal with recovered, renewable and nuclear heat.
Companies profiled and their roles in this market
| Company | Type | Role in the market |
|---|---|---|
| CHN Energy Investment Group | State power group | Supplied 540 million gigajoules of heat in 2024 across more than 900 million square meters |
| Huadian Power International | State power group | Runs 55 controlled plants located mainly in electricity and heat load centers |
| State Power Investment Corporation | State power group | Operates the Warm Nuclear No. 1 heating project at Haiyang |
| Sinopec Star | Geothermal heat developer | Geothermal arm of Sinopec, which heats 120 million square meters |
| Jilin Province Chuncheng Heating Company Limited | Municipal heat distributor | Served 72.781 million square meters in Changchun area in 2025 |
| Korea District Heating Corporation | Public heat utility | Runs the Pangyo cogeneration plant and the K-Heating initiative |
| GS Power | Private heat utility | Supplies about 380,000 households in the Anyang and Bucheon areas |
| Hokkaido Heat Supply Corporation | Heat supply operator | Serves central Sapporo and the Kosei district |
Credence Research view on regional piped heat demand
Credence Research's view is that district heating in the Asia-Pacific region will grow at a steady pace, because new urban connections in China and South Korea keep adding customers while clean heat sources lower coal use. Space heating keeps the largest service share, but process heat grows faster as industrial parks buy piped steam. China stays the largest market, while emerging Asia-Pacific grows fastest from a small base. However, coal dependence, aging pipelines and thin finance in poorer cities will slow progress. Operators that secure recovered, geothermal and nuclear heat should gain share fastest.
How the regional piped heat estimate was built
The report uses 2025 as the base year on a calendar basis, and market values come from the Credence Research model. That model combines connected floor area and household data, heat delivery volumes, tariff structures, operator filings and public investment programs. Market shares, segment splits and growth rates are Credence Research estimates. Sources used are official statistics, government and ministry releases, multilateral lender project records, company filings and releases, and news reports, and no interviews or surveys were used.
Clean sources and new connections carry growth to 2035
Asia-Pacific district heating value is expected to reach USD 95.48 billion by 2035, a 5.29% CAGR during 2026–2035, as new connections and cleaner heat sources carry growth. China will add floor area and replace small coal boilers with waste heat, geothermal and nuclear supply. South Korea should reach its 2028 household target and expand power-to-heat projects. Faster pipeline renewal would raise this outlook, while weak housing construction or delays to multilateral finance in Mongolia would lower it.
Frequently Asked Questions
How big is the Asia-Pacific district heating market?
Which market leads the region?
Which service type leads demand?
How is South Korea expanding district energy?
How are clean heat sources changing supply?
Which heat source grows fastest?
Who are the leading companies in the region?
What are the main challenges for operators?
Table of Content
Chapter 1 Market Segmentation
- 1.1 Segmentation Framework
- 1.1.1 Product and Service Classification
- 1.1.2 Application and End-Use Classification
- 1.1.3 Technology and Solution Classification
- 1.1.4 Customer and Distribution Channel Classification
- 1.1.5 Geographic Segmentation
- 1.1.6 Market Segment Definitions and Boundaries
- 1.2 By Service Type
- 1.2.1 Space heating
- 1.2.2 Domestic hot water
- 1.2.3 Process heat
- 1.3 By Heat Source
- 1.3.1 Fossil-fuel heat
- 1.3.2 Recovered heat
- 1.3.3 Renewable heat
- 1.3.4 Nuclear heat
- 1.4 By End User
- 1.4.1 Residential buildings
- 1.4.2 Commercial buildings
- 1.4.3 Industrial facilities
- 1.5 By Technology
- 1.5.1 High-temperature water networks
- 1.5.2 Low-temperature water networks
- 1.5.3 Steam networks
- 1.6 By Market
- 1.6.1 China
- 1.6.2 South Korea
- 1.6.3 Japan
- 1.6.4 Emerging Asia-Pacific
Chapter 2 Introduction
- 2.1 Report Objectives and Scope
- 2.2 Product Definition and Industry Terminology
- 2.3 Market Inclusions and Exclusions
- 2.4 Research Process
- 2.4.1 Primary Research and Expert Interviews
- 2.4.2 Secondary Research and Source Review
- 2.4.3 Top-Down and Bottom-Up Estimation
- 2.4.4 Data Triangulation and Verification
- 2.5 Market Size Measurement Basis
- 2.5.1 2025: USD 56.89 billion → 2035: USD 95.48 billion
- 2.6 Historical and Forecast Reference Periods
- 2.6.1 Historical Period: 2018-2025
- 2.6.2 Base Year: 2025
- 2.6.3 Forecast Period: 2025-2035
- 2.7 Research Assumptions and Limitations
Chapter 3 Executive Summary
- 3.1 Market Snapshot and Key Findings
- 3.2 Base-Year Market Size, 2025
- 3.3 Forecast Market Size, 2035
- 3.4 Revenue and Volume Growth Outlook
- 3.5 Key Demand and Supply Indicators
- 3.6 Leading Market Segments
- 3.7 Fastest-Growing Market Opportunities
- 3.8 Regional Performance Highlights
- 3.9 Technology and Industry Transformation
- 3.10 Competitive Landscape Summary
- 3.11 Analyst View and Strategic Implications
Chapter 4 Asia-Pacific District Heating Market Trends and Developments
- 4.1 Historical Industry Development, 2018-2025
- 4.2 Recent Market Trends and Developments
- 4.3 Demand and Customer Behavior Trends
- 4.4 Technology and Product Innovation
- 4.5 Artificial Intelligence, Automation and Digitalization
- 4.6 Local Manufacturing and Supply Chain Realignment
- 4.7 Industry Partnerships, Mergers and Acquisitions
- 4.8 Sustainability and Circular Economy Developments
- 4.9 Government and Private Sector Investment Trends
- 4.10 Emerging Business Models and Commercialization
- 4.11 Industry Developments and Announcements
Chapter 5 Asia-Pacific District Heating Market Production, Supply and Demand Analysis
- 5.1 Demand Trend and Consumption Analysis, 2018-2025
- 5.2 Demand Forecast, 2025-2035
- 5.3 Production and Output Trend, 2018-2025
- 5.4 Production and Output Forecast, 2025-2035
- 5.5 Installed Capacity and Capacity Utilization
- 5.6 Company-Wise Production Plants and Statistics
- 5.6.1 Installed Production Capacity
- 5.6.2 Actual Production
- 5.6.3 Planned Capacity and Expansion Targets
- 5.7 Supply Chain Structure and Procurement Trends
- 5.8 Supply-Demand Gap and Bottlenecks
- 5.9 Import Dependence and Sourcing Structure
- 5.10 Contract Manufacturing and Outsourcing
- 5.11 Regional Supply and Demand Concentration
Chapter 6 Asia-Pacific District Heating Market Pricing Analysis
- 6.1 Pricing Structure and Measurement
- 6.2 Historical Pricing Trends, 2018-2025
- 6.3 Pricing Outlook, 2025-2035
- 6.4 Average Selling Price and Unit Economics
- 6.5 Pricing by Product and Market Segment
- 6.6 Geographic Pricing Differences
- 6.7 Key Input, Energy, Labor and Logistics Costs
- 6.8 Contract Pricing and Purchasing Models
- 6.9 Pricing Sensitivity and Competitive Positioning
- 6.10 Price, Margin and Profitability Implications
Chapter 7 Asia-Pacific District Heating Market Dynamics
- 7.1 Market Growth Drivers
- 7.1.1 Demand-Side Drivers
- 7.1.2 Technology and Innovation Drivers
- 7.1.3 Infrastructure and Investment Drivers
- 7.1.4 Regulatory and Policy Drivers
- 7.2 Market Restraints
- 7.2.1 Cost and Affordability Constraints
- 7.2.2 Technology and Adoption Barriers
- 7.2.3 Supply Chain and Operational Constraints
- 7.3 Market Challenges
- 7.3.1 Competitive Pressure and Margin Erosion
- 7.3.2 Skills, Infrastructure and Implementation Gaps
- 7.4 Emerging Market Opportunities
- 7.5 Market Dynamics Impact and Time-Horizon Assessment
Chapter 8 Asia-Pacific District Heating Value Chain Analysis
- 8.1 Industry Value Chain Overview
- 8.2 Upstream Suppliers and Critical Inputs
- 8.3 Technology and Component Providers
- 8.4 Manufacturing or Service Delivery
- 8.5 Distribution, Channel Partners and Integrators
- 8.6 Downstream Applications and End Users
- 8.7 Value Addition and Profit Pools
- 8.8 Vertical Integration and Outsourcing
- 8.9 Supplier Concentration and Risk
- 8.10 Supply Chain Localization and Resilience
Chapter 9 Asia-Pacific District Heating Market Regulations and Policies
- 9.1 Relevant Laws, Standards and Compliance Frameworks
- 9.2 Product, Service, Safety and Quality Requirements
- 9.3 Government Policies, Incentives and Subsidies
- 9.4 Imports, Exports and Trade Barriers
- 9.5 Public Procurement and Local Content Requirements
- 9.6 Environmental and Sustainability Compliance
- 9.7 Upcoming Policy Changes and Market Implications
Chapter 10 Asia-Pacific District Heating Market Hotspots and Opportunities
- 10.1 Market Opportunity Mapping and Growth Hotspots
- 10.2 High-Growth Applications and Customer Groups
- 10.3 Underserved Markets and White-Space Opportunities
- 10.4 Emerging Technology and Product Opportunities
- 10.5 New Capacity and Investment Hotspots
- 10.6 Market Entry and Expansion Opportunities
- 10.7 Distribution and Partnership Opportunities
- 10.8 Near-Term and Long-Term Commercial Potential
- 10.9 Opportunity Attractiveness and Execution Risks
Chapter 11 Asia-Pacific District Heating Market Outlook, 2025-2035
- 11.1 Market Size and Analysis
- 11.1.1 Revenue (Market Measurement: 2025: USD 56.89 billion → 2035: USD 95.48 billion)
- 11.1.2 Market Volume and Quantity Sold
- 11.1.3 Historical Market Size, 2018-2025
- 11.1.4 Base-Year Market Size, 2025
- 11.2 Market Forecast, 2025-2035
- 11.2.1 Revenue Forecast to 2035
- 11.2.2 Volume Forecast to 2035
- 11.2.3 CAGR and Year-on-Year Growth
- 11.2.4 Incremental Revenue Opportunity
- 11.3 Forecast Assumptions and Scenario Analysis
- 11.3.1 Base-Case Forecast
- 11.3.2 Optimistic and Conservative Scenarios
- 11.3.3 Technology, Pricing and Policy Sensitivities
- 11.4 Market Attractiveness and Growth Outlook
Chapter 12 Asia-Pacific District Heating Market Segmentation and Outlook
- 12.1 Segmentation Summary and Market Shares, 2025
- 12.2 Largest and Fastest-Growing Segments
- 12.3 By Service Type - Market Size and Forecast, 2025-2035
- 12.3.1 Segment Definition and Scope
- 12.3.2 Historical Market Size, 2018-2025
- 12.3.3 Revenue Forecast, 2025-2035
- 12.3.4 Volume Forecast, 2025-2035
- 12.3.5 Base-Year Market Share, 2025
- 12.3.6 Segment CAGR and Growth Drivers
- 12.3.7 Subsegment Market Size and Forecast
- 12.3.7.1 Space heating
- 12.3.7.2 Domestic hot water
- 12.3.7.3 Process heat
- 12.3.8 Subsegment Pricing and Adoption Trends
- 12.3.9 Leading Suppliers and Competition
- 12.3.10 Regional Demand and Opportunities
- 12.4 By Heat Source - Market Size and Forecast, 2025-2035
- 12.4.1 Segment Definition and Scope
- 12.4.2 Historical Market Size, 2018-2025
- 12.4.3 Revenue Forecast, 2025-2035
- 12.4.4 Volume Forecast, 2025-2035
- 12.4.5 Base-Year Market Share, 2025
- 12.4.6 Segment CAGR and Growth Drivers
- 12.4.7 Subsegment Market Size and Forecast
- 12.4.7.1 Fossil-fuel heat
- 12.4.7.2 Recovered heat
- 12.4.7.3 Renewable heat
- 12.4.7.4 Nuclear heat
- 12.4.8 Subsegment Pricing and Adoption Trends
- 12.4.9 Leading Suppliers and Competition
- 12.4.10 Regional Demand and Opportunities
- 12.5 By End User - Market Size and Forecast, 2025-2035
- 12.5.1 Segment Definition and Scope
- 12.5.2 Historical Market Size, 2018-2025
- 12.5.3 Revenue Forecast, 2025-2035
- 12.5.4 Volume Forecast, 2025-2035
- 12.5.5 Base-Year Market Share, 2025
- 12.5.6 Segment CAGR and Growth Drivers
- 12.5.7 Subsegment Market Size and Forecast
- 12.5.7.1 Residential buildings
- 12.5.7.2 Commercial buildings
- 12.5.7.3 Industrial facilities
- 12.5.8 Subsegment Pricing and Adoption Trends
- 12.5.9 Leading Suppliers and Competition
- 12.5.10 Regional Demand and Opportunities
- 12.6 By Technology - Market Size and Forecast, 2025-2035
- 12.6.1 Segment Definition and Scope
- 12.6.2 Historical Market Size, 2018-2025
- 12.6.3 Revenue Forecast, 2025-2035
- 12.6.4 Volume Forecast, 2025-2035
- 12.6.5 Base-Year Market Share, 2025
- 12.6.6 Segment CAGR and Growth Drivers
- 12.6.7 Subsegment Market Size and Forecast
- 12.6.7.1 High-temperature water networks
- 12.6.7.2 Low-temperature water networks
- 12.6.7.3 Steam networks
- 12.6.8 Subsegment Pricing and Adoption Trends
- 12.6.9 Leading Suppliers and Competition
- 12.6.10 Regional Demand and Opportunities
- 12.7 By Market - Market Size and Forecast, 2025-2035
- 12.7.1 Segment Definition and Scope
- 12.7.2 Historical Market Size, 2018-2025
- 12.7.3 Revenue Forecast, 2025-2035
- 12.7.4 Volume Forecast, 2025-2035
- 12.7.5 Base-Year Market Share, 2025
- 12.7.6 Segment CAGR and Growth Drivers
- 12.7.7 Subsegment Market Size and Forecast
- 12.7.7.1 China
- 12.7.7.2 South Korea
- 12.7.7.3 Japan
- 12.7.7.4 Emerging Asia-Pacific
- 12.7.8 Subsegment Pricing and Adoption Trends
- 12.7.9 Leading Suppliers and Competition
- 12.7.10 Regional Demand and Opportunities
- 12.8 Segment Growth Comparison
- 12.9 Segment Attractiveness and Priority Matrix
Chapter 13 Asia-Pacific District Heating End-Use and Application Market Outlook
- 13.1 End-Use Industry and Customer Demand Structure
- 13.2 Leading Applications and Customer Groups
- 13.3 End-Use Market Size, Share and Forecast
- 13.4 Major End-Use Industry Deep Dives
- 13.4.1 Customer Requirements and Use Cases
- 13.4.2 Demand and Replacement Cycles
- 13.4.3 Technical and Regulatory Considerations
- 13.4.4 Purchasing and Procurement Models
- 13.4.5 Leading Vendors and Distribution Channels
- 13.4.6 Forecast and Commercial Opportunities
- 13.5 Emerging Applications and Cross-Segment Demand
- 13.6 End-Use Industry Investment Priorities
Chapter 14 Asia-Pacific District Heating Geographic Market Outlook, 2025-2035
- 14.1 Regional Market Size and Country-Level Shares, 2025
- 14.2 Country Market Size Comparison, 2025
- 14.3 Country Market Forecasts, 2025-2035
- 14.4 Subregional Industrial and Demand Clusters
- 14.5 Intra-Regional Pricing and Cost Differences
- 14.6 Cross-Border Trade and Supply Networks
- 14.7 Regional Supply and Demand Balances
- 14.8 Country Opportunity Comparison and Prioritization
Note: Every listed country is covered on the structure shown under the first country.
Chapter 15 Asia-Pacific District Heating Technology, Innovation and Sustainability Outlook
- 15.1 Technology Landscape and Maturity
- 15.2 Product, Process and Service Innovation
- 15.3 AI, Automation and Digital Tools in the Industry
- 15.4 Technology Adoption and Performance Benchmarking
- 15.5 Innovation Pipeline and R&D Investment
- 15.6 Patent and Intellectual Property Trends
- 15.7 Energy Efficiency and Resource Management
- 15.8 Sustainability, Recycling and Circularity
- 15.9 Technology Roadmap, 2025-2035
- 15.10 Risks of Obsolescence and Technology Substitution
Chapter 16 Asia-Pacific District Heating Market Key Strategic Imperatives
- 16.1 Growth and Market Entry Priorities
- 16.2 High-Return Products and Segments
- 16.3 Pricing, Profitability and Cost Optimization
- 16.4 Technology Investment and Product Differentiation
- 16.5 Supply Chain Localization and Resilience
- 16.6 Distribution and Customer Acquisition
- 16.7 Partnership, Acquisition and Capacity Strategy
- 16.8 Regional Expansion Priorities
- 16.9 Short-, Medium- and Long-Term Actions
Chapter 17 Competition Outlook
- 17.1 Industry Competition Characteristics
- 17.2 Market Structure and Concentration
- 17.3 Market Share and Competitive Positioning, 2025
- 17.4 Company-Wise Revenue and Product Benchmarking
- 17.5 Production and Service Capacity Benchmarking
- 17.6 Technology, Pricing and Differentiation
- 17.7 Regional Footprint and Distribution Strength
- 17.8 Mergers, Acquisitions and Strategic Alliances
- 17.9 New Entrants and Competitive Threats
- 17.10 Porter's Five Forces and Industry Attractiveness
- 17.11 Competitive Outlook, 2025-2035
Chapter 18 Company Profiles
- 18.1 Company Coverage and Selection Criteria
- 18.2 CHN Energy Investment Group
- 18.2.1 Business Description
- 18.2.2 Company Ownership and Geographic Presence
- 18.2.3 Product and Service Portfolio
- 18.2.4 Manufacturing and Operating Footprint
- 18.2.5 Production Capacity and Expansion Plans
- 18.2.6 Financial Performance and Investment
- 18.2.7 Market Share and Competitive Position
- 18.2.8 Technology and Innovation Capabilities
- 18.2.9 Strategic Alliances or Partnerships
- 18.2.10 Recent Developments
- 18.2.11 Growth Strategy and Outlook
- 18.3 Huaneng Power International
- 18.4 Huadian Power International
- 18.5 Beijing Jingneng Power
- 18.6 Korea District Heating Corporation
- 18.7 Sinopec Star
- 18.8 State Power Investment Corporation
- 18.9 Jilin Province Chuncheng Heating Company Limited
- 18.10 GS Power
- 18.11 Hokkaido Heat Supply Corporation
- 18.12 Other Relevant Market Participants
Note: Every listed company is profiled on the structure shown under the first company. The company list is preliminary and may change based on research findings, market developments, data availability and client requirements.
Chapter 19 Disclaimer
- 19.1 Research and Forecast Disclaimer
- 19.2 Data Source and Estimation Limitations
Note: The depth of individual sections depends on data availability for this market. Volume, capacity, trade and other unit-based metrics are included where applicable.

